
Abstract
Urbanists are keenly interested in individuals’ satisfaction with their neighbourhoods, and especially in the determinants of satisfaction. To the extent that we all want to be satisfied with our neighbourhoods, this work has an important practical application, providing guidance to planners, developers, local leaders and others on how to build satisfying neighbourhoods. However, do neighbourhoods matter for neighbourhood satisfaction? This study answers that question using a meta-analysis to pool 126 estimates from 27 studies of the association between neighbourhoods and neighbourhood satisfaction. I find that neighbourhoods do matter for neighbourhood satisfaction, but that their direct effect is weak. I consider several possible explanations for this finding, and discuss the practical significance of calling into question whether changes to a neighbourhood’s built or social environment can meaningfully improve residents’ neighbourhood satisfaction.
In the past decade, several thousands of scholarly articles and chapters referencing neighbourhood or community satisfaction have appeared, including 56 published in Urban Studies. 1 Urbanists are keenly interested in individuals’ satisfaction with their neighbourhoods, and especially in the determinants of satisfaction. To the extent that we all want to be satisfied with our neighbourhoods, these studies have an important practical application, providing guidance to planners, developers, local leaders and others on how to build satisfying neighbourhoods. However, identifying the determinants of neighbourhood satisfaction is difficult, ‘because satisfaction studies vary greatly in the range of variables covered and in the sample population, from nation-wide surveys to surveys of groups or neighbourhoods in a single city’ (Parkes et al., 2002: 2417). Although this variation has left us with a mixed literature, it also presents an opportunity to triangulate these diverse findings through meta-analysis and gain clarity about the extent to which neighbourhoods matter for neighbourhood satisfaction.
Therefore, this study asks: do neighbourhoods matter for neighbourhood satisfaction? Using a meta-analysis to pool 126 estimates from 27 studies of the association between neighbourhoods and neighbourhood satisfaction, I find that neighbourhoods do matter for neighbourhood satisfaction, but that their direct effect is weak. Specifically, I find that neighbourhoods themselves account for at most 16% of the variation in residents’ neighbourhood satisfaction, while the majority of variation in neighbourhood satisfaction is associated with individual-level characteristics and perceptions. There are several possible explanations for this finding, but it is significant because it calls into question whether changes to a neighbourhood’s built or social environment can meaningfully improve residents’ neighbourhood satisfaction.
The remainder of the article has four sections. In the next section, I briefly review existing conceptual models of neighbourhood satisfaction and the utility of the intraclass correlation coefficient (ICC) to quantify the impact of neighbourhoods as a determinant of neighbourhood satisfaction. In the methods section, I first use the PRISMA guidelines to describe a systematic literature search used to identify ICC estimates concerning neighbourhood satisfaction, then I describe how these estimates are pooled using a random effects meta-analysis. In the results section, I review the characteristics of the included studies, and report the results of the random effects meta-analysis. I conclude with a discussion of four possible explanations for the finding that neighbourhoods have a limited association with neighbourhood satisfaction, and identify future directions for both researchers interested in understanding neighbourhood satisfaction and practitioners interested in increasing it.
Neighbourhood satisfaction
Neighbourhood satisfaction is rarely explicitly defined in studies of neighbourhood satisfaction, where its meaning is often assumed to be self-evident. Rather than focus on where or what is being measured, discussions of neighbourhood satisfaction more often focus on how it is measured. Measurement of neighbourhood satisfaction involves assessing an individual’s attitude (satisfaction) towards a reference place (neighbourhood or block). Since ‘neighbourhood is … difficult to define and attempts to do so may prevent respondents from using the concept of neighbourhood that is most relevant to them’, questions about neighbourhood satisfaction typically leave the term ‘neighbourhood’ or ‘block’ undefined (Parkes et al., 2002: 2415). However, although individuals may interpret these subjective terms to refer to different objective areal units, ‘the consequences of such perceptual idiosyncrasies for their answers to survey questions do not seem particularly serious’ (Lee and Campbell, 1997: 934).
Satisfaction is similarly difficult to define, leading to a variety of approaches for measuring it. First, researchers can use a single question to measure global satisfaction, for example by asking ‘How satisfied are you with your neighborhood?’ (Greif, 2009: 33). Second, researchers can use a multi-item scale that treats global satisfaction as ‘a more complex construct rather than [something that can be captured from] the response to a single question’ (Parkes et al., 2002: 2415). For example, Arundel and Ronald (2017: 39) combined four separate questions/statements, including ‘Are you satisfied with your immediate neighbourhood?’ and ‘I find it bothersome to live in this neighbourhood.’ Third, researchers can view neighbourhood satisfaction as the combination of one’s satisfaction with each of several specific features of the neighbourhood, which are each potential components of satisfaction. For example, Lee et al. (2017: 143) asked respondents how satisfied they were with 17 distinct neighbourhood features, including shopping and traffic, to construct a pooled measure of neighbourhood satisfaction. Finally, rather than measure neighbourhood satisfaction per se, researchers can focus narrowly on individuals’ satisfaction with a single aspect of the neighbourhood, including their relationships with neighbours (Lenzi et al., 2013), intergenerational closure (King, 2013) and physical or social disorder (Hipp et al., 2012).
Determinants of neighbourhood satisfaction
A central concern in neighbourhood satisfaction research has been to identify its determinants, with the implicit logic that if we can identify the factors that contribute to individuals’ neighbourhood satisfaction, we can build neighbourhoods that are more satisfying. Although many different determinants have been explored, they are often grouped into three broad categories, illustrated in Figure 1 (Lee and Guest, 1983; Parkes et al., 2002; Permentier et al., 2011).
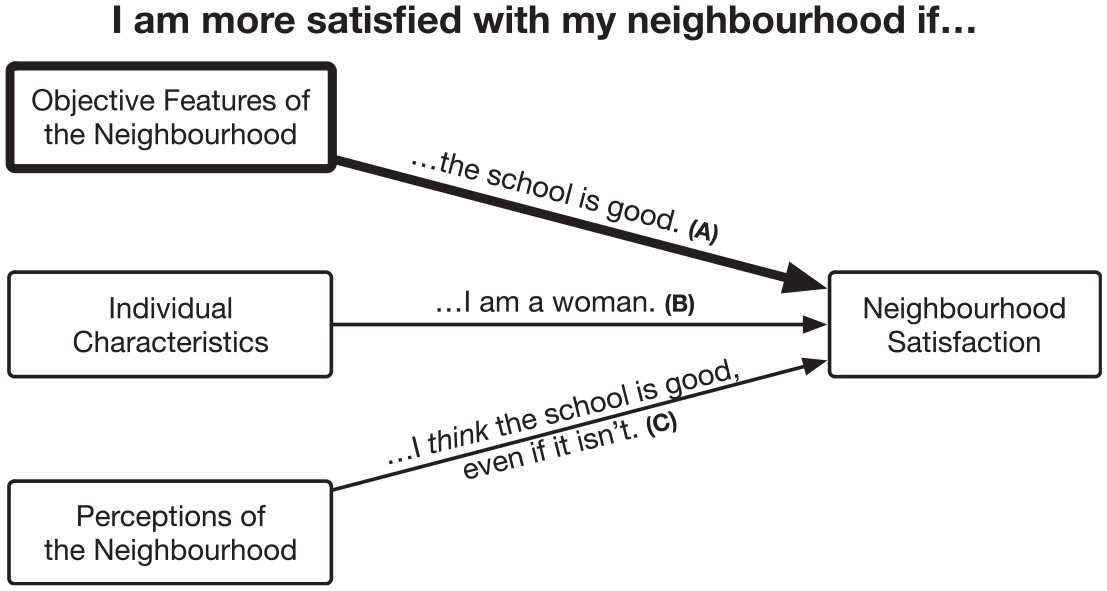
Potential factors contributing to place satisfaction.
First, objective features of the neighbourhood can impact individuals’ neighbourhood satisfaction (Figure 1, path A). For example, individuals are often more satisfied with their neighbourhood if the local public schools are good (e.g. Neal and Neal, 2012). The view that objective neighbourhood features impact satisfaction has been called the urban-scale (Lee and Guest, 1983) or ecological (Parkes et al., 2002) perspective, and can be traced to Wirth (1938). Wirth contended that individuals’ experience of cities and neighbourhoods depended on the objective characteristics of size, density and population heterogeneity, which were all responsible for increased alienation and anomie relative to rural life.
Second, characteristics of the individual can impact their neighbourhood satisfaction (Figure 1, path B). For example, women are sometimes found to have greater neighbourhood satisfaction than men (e.g. Permentier et al., 2011). The view that individual characteristics impact neighbourhood satisfaction has been called the compositional (Lee and Guest, 1983) or systemic (Parkes et al., 2002) perspective, and can be traced to Gans (1962). Individual demographic characteristics may be associated with neighbourhood satisfaction for psychological reasons, for example if certain groups tend to be more satisfied generally. However, the association may also be sociological, if the characteristics (e.g. socio-economic status) represent resources that enable individuals to live in neighbourhoods that are more satisfying.
Finally, individuals’ perceptions of the neighbourhood can impact their neighbourhood satisfaction (Figure 1, path C). For example, individuals might be more satisfied with their neighbourhood if they think the local public schools are good. Lee and Guest (1983) call this the subjective school, which they trace to Marans and Rogers’ (1975: 302) observation that ‘an individual’s satisfaction with any set of circumstances is dependent … on a whole set of values’ that can lead to ‘discrepancies between reality and perception’. That is, the perception of quality public schools can be associated with neighbourhood satisfaction even if it is objectively erroneous, that is, even if the public schools actually are not good. Consistent with this perspective, in a recent systematic review of 85 studies, Orstad et al. (2017: 905) found that ‘perceived neighborhood environment and objectively measured neighborhood environment are related but distinct’, while in one empirical study of nearly 1800 US adults Lee et al. (2017) found that the perceived neighbourhood environment was associated with satisfaction but the objective neighbourhood environment was not.
Neighbourhood satisfaction may also be the product of moderation or interaction between multiple categories of determinants. 2 Indeed, Parkes et al. (2002: 2419) noted that ‘Several studies have suggested that different groups of people may attach more importance to particular neighbourhood features.’ For example, Greif (2015) found that a neighbourhood’s economic advantage was associated with the neighbourhood satisfaction of black homeowners, but not of black renters. However, as with other research on the determinants of neighbourhood satisfaction, findings concerning moderation remain mixed. Despite expectations that quality schools matter mainly for parents, Neal and Neal (2012) found no evidence of moderation by parental status: the positive association between school quality and neighbourhood satisfaction was the same for both parents and non-parents.
Each of these categories of determinants – objective features, individual characteristics and subjective perceptions – and their potential interactions is likely associated with neighbourhood satisfaction, but they differ in their practical importance for planners and local leaders interested in building satisfying neighbourhoods. Knowing whether individual characteristics such as gender or income are associated with neighbourhood satisfaction may help us understand variation in neighbourhood satisfaction, but it offers no practical guidance on increasing individuals’ neighbourhood satisfaction because such characteristics are not directly malleable. Knowing whether perceptions of the neighbourhood are associated with neighbourhood satisfaction may offer somewhat more practical guidance. In this case, perceptions can be shifted through careful marketing that leads residents to have more favourable views of existing amenities, or through changes to the built environment (e.g. adding or removing a barrier) that lead residents to rethink the boundaries of their ‘neighbourhood’ and therefore the amenities it contains. Finally, knowing whether (and to what extent) objective neighbourhood features are associated with neighbourhood satisfaction offers the most direct practical guidance, because planners and local leaders can often take steps to directly change these features. Therefore, the goal of this study is to determine the strength of the association between objective neighbourhood features and neighbourhood satisfaction (Figure 1, path A).
The intraclass correlation coefficient as an index of neighbourhood effects
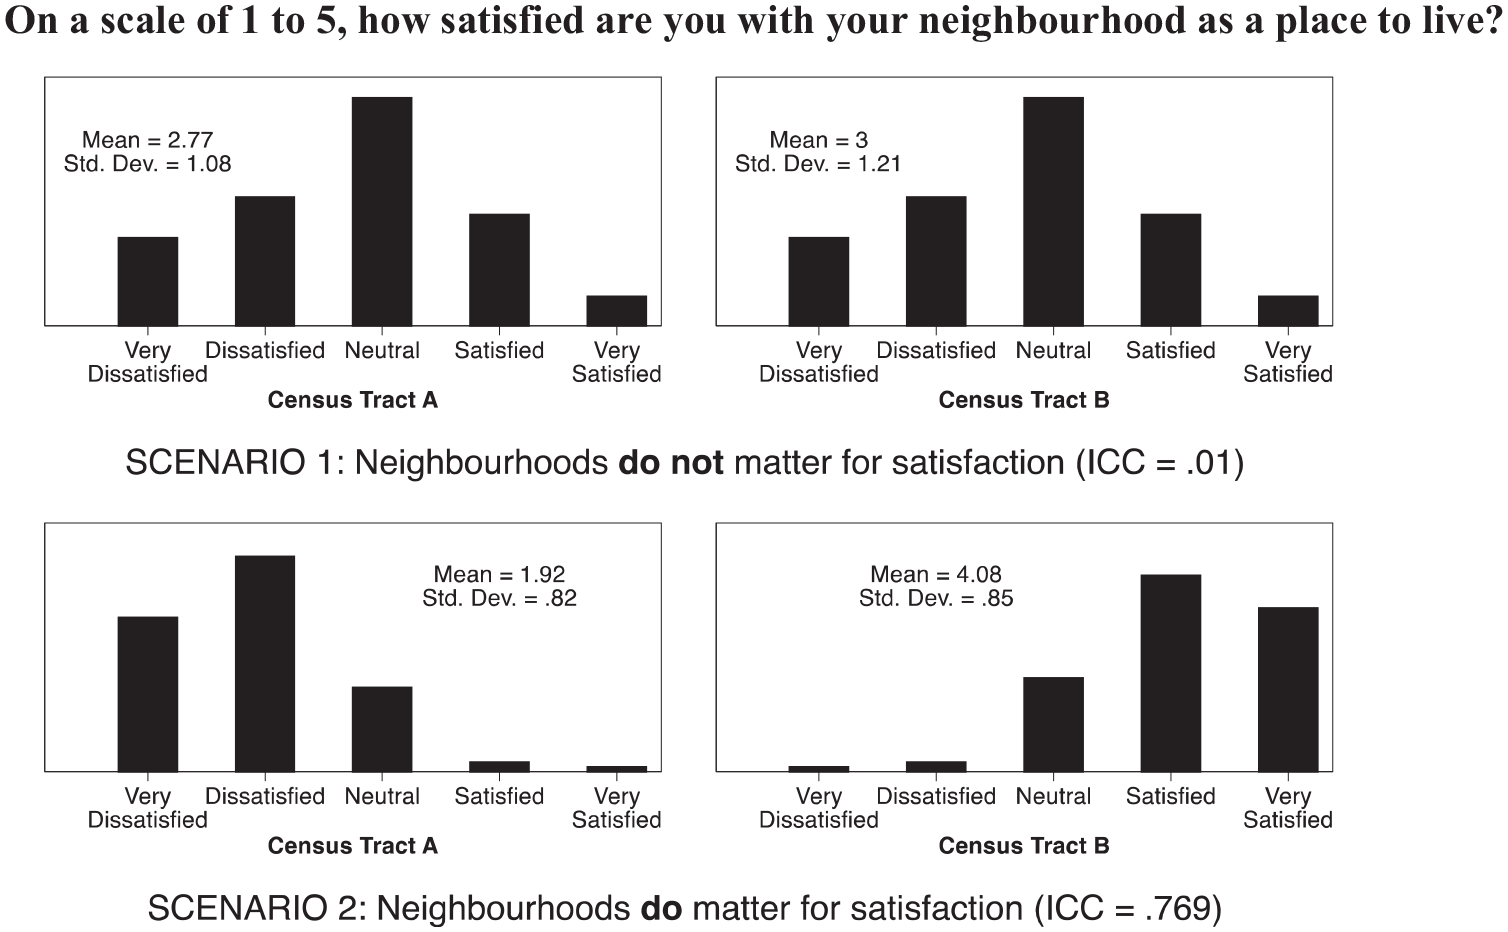
Mixed models, also known as multi-level models (MLM) and hierarchical linear regression (HLM), have become widely used in neighbourhood research because they allow the estimation of regression models in clustered samples (e.g. residents clustered in neighbourhoods), and that include independent variables measured at multiple levels (e.g. individual-level and neighbourhood-level variables). A first step in the estimation of any mixed model is the computation of the intraclass correlation coefficient (ICC) for the dependent variable. The ICC indicates the proportion of variation in the dependent variable that occurs between clusters rather than within clusters. Figure 2 provides an illustration in the context of neighbourhood satisfaction, and highlights how the ICC can provide a measure of the association between neighbourhoods (i.e. their objective features) and neighbourhood satisfaction. Consider a study in which 200 residents from two different census tracts are asked to rate their satisfaction with their neighbourhood on a scale of 1 (very dissatisfied) to 5 (very satisfied). 3
Intraclass correlation coefficient as a measure of neighbourhood effects.
Scenario 1 shows one possible outcome in which neighbourhoods do not matter for neighbourhood satisfaction. In this scenario, there is wide variation in the level of neighbourhood satisfaction among residents of tract A (s.d. = 1.08), and similarly wide variation in neighbourhood satisfaction among the residents of tract B (s.d. = 1.21). Although there is wide variation within each of the tracts, there is little difference in mean neighbourhood satisfaction between them (2.77 vs. 3). This translates to a relatively small ICC of 0.01, which indicates that almost none (1%) of the variation in neighbourhood satisfaction occurs between neighbourhoods, and most of the variation (99%) occurs between residents of the same neighbourhood: some residents in tract A are satisfied while others are dissatisfied, and likewise in tract B.
Scenario 2 shows a different possible outcome in which neighbourhoods do matter for neighbourhood satisfaction. In this scenario, residents of tract A are generally consistent in their dissatisfaction with their neighbourhood (M = 1.92, s.d. = 0.82), while residents of tract B are generally consistent in their satisfaction with their neighbourhood (M = 4.08, s.d. = 0.85). Although there is little variation within each of the tracts, there is a large difference in mean neighbourhood satisfaction between them. This translates to a relatively large ICC of 0.769, which indicates that much (77%) of the variation in neighbourhood satisfaction occurs between neighbourhoods: tract A leaves its residents dissatisfied, while tract B makes its residents satisfied.
The examples in Figure 2 illustrate three important features of the ICC. First, the ICC can be used to measure the strength of the association between neighbourhood-level features and neighbourhood satisfaction (Bielby, 1981; Kingston et al., 1999). When computed for a measure of neighbourhood satisfaction, an ICC near 1 indicates that neighbourhood-level features are responsible for variation in satisfaction, while an ICC near 0 indicates that neighbourhood-level features are not responsible for variation in satisfaction.
Second, the ICC is a coarse measure that provides only an upper bound on the strength of the association between a neighbourhood’s objective features and neighbourhood satisfaction (see Figure 1, path A). Some of the neighbourhood-level effect captured by the ICC is due to variation in the objective features of neighbourhoods, although we may not know precisely which features (e.g. a park, a school). However, some of the effect may also be due to individual characteristics (see Figure 1, path B) if those characteristics exhibit spatial clustering. For example, if wealthy individuals tend to be more satisfied with their neighbourhoods and wealthy individuals are clustered in the same neighbourhoods, then differences in neighbourhood satisfaction will appear to be driven by neighbourhoods (resulting in a larger ICC), when in fact they are driven by individual characteristics. Because this study is focused on estimating the effect of objective features on neighbourhood satisfaction, and because it is impossible to disentangle these two sources of apparent neighbourhood-level effects, the ICC can be interpreted as capturing the maximum possible effect of the neighbourhood itself. For example, an ICC of 0.1 indicates that the objective features of a neighbourhood are responsible for at most 10% of the variation in neighbourhood satisfaction.
Finally, computing the ICC requires specifying an areal clustering unit, which is typically different from the reference place used to assess neighbourhood satisfaction. In the example, the reference place is the ‘neighbourhood’, but the clustering unit is the census tract. Therefore, in the strictest sense, this example illustrates scenarios where the ICC captures whether census tracts matter for neighbourhood satisfaction. When the reference place is subjective, such as an undefined ‘neighbourhood’, researchers attempt to compute the ICC using an objective clustering unit presumed to be analogous; for example, treating tracts as a reasonable proxy for neighbourhoods. However, some compute the ICC using different objective clustering units, with the goal of inductively determining the objective place with which respondents were most plausibly reporting their satisfaction (Cutchin et al., 2011; Hipp, 2010a; Hipp et al., 2012). Because ICCs are often reported in the neighbourhood satisfaction literature, and because they provide a direct indicator of the association between neighbourhoods and neighbourhood satisfaction, they are ideally suited as the object of a meta-analysis focused on precisely estimating the strength of this association.
Methods
Literature search
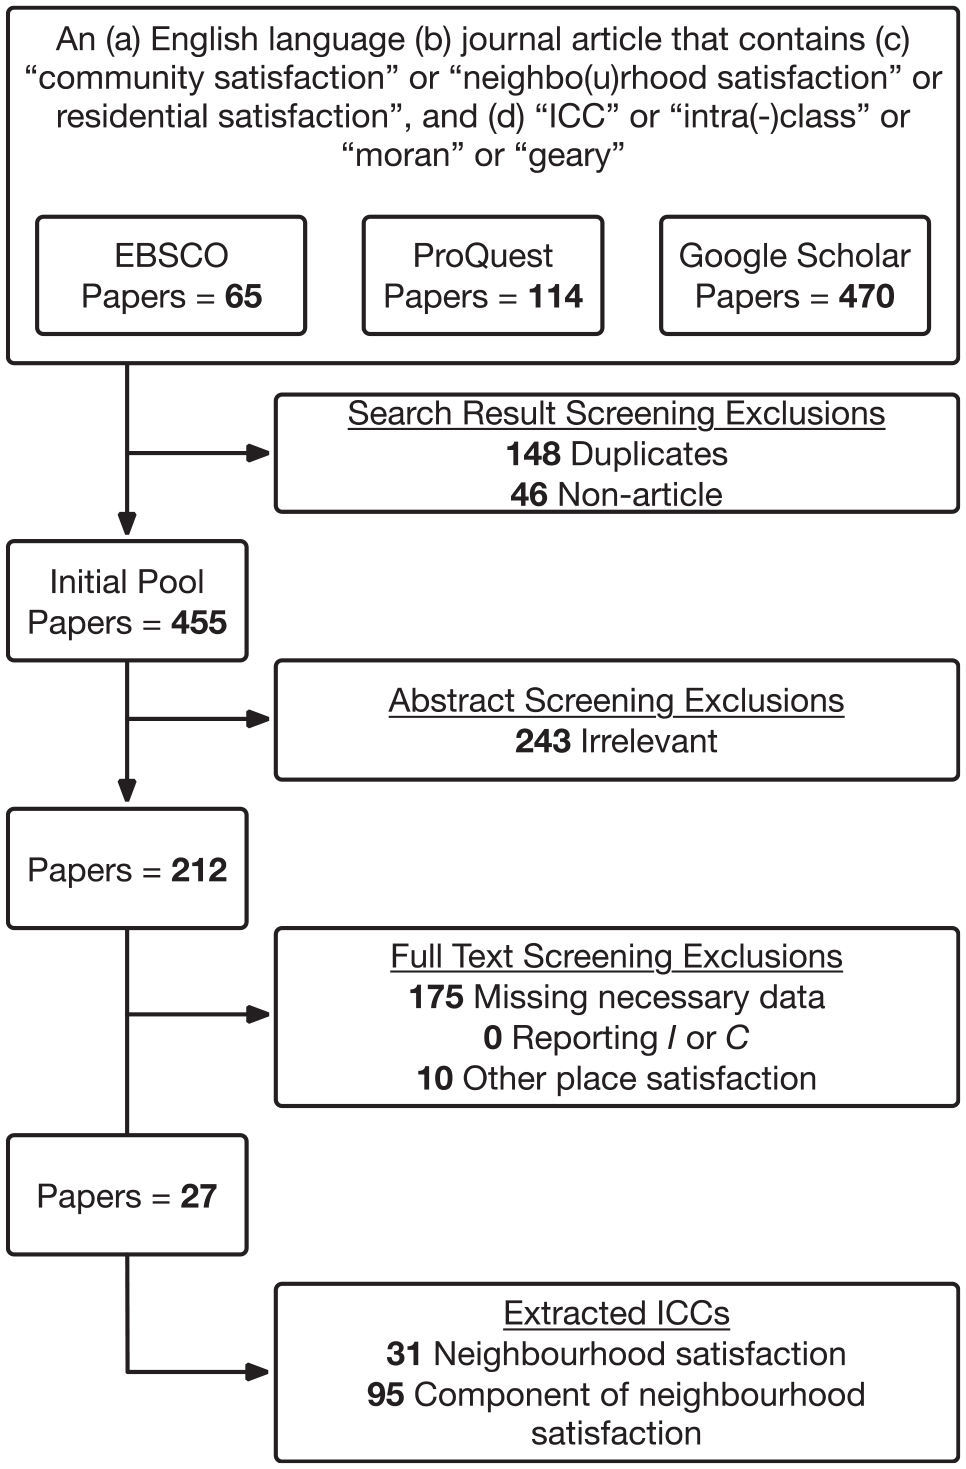
I first undertook a systematic literature search designed to identify all studies that report a measure of the association between places and residents’ satisfaction with them. Figure 3 summarises the stages of a systematic literature review following the Preferred Reporting for Systematic Reviews and Meta-Analyses (PRISMA) guidelines (Moher et al., 2009). In August 2019, I performed an electronic search using three different scholarly research databases: EBSCO, ProQuest and Google Scholar. In each case, I constructed search queries to locate (a) English language, (b) journal articles that contain (c) the phrase ‘community satisfaction’ or ‘neighbo(u)rhood satisfaction’ or ‘residential satisfaction’ and (d) the term ‘ICC’ or ‘intra(-)class’ or ‘moran’ or ‘geary’. A focus on English language studies (criterion a) was necessary for purely practical reasons; however, the final pool of studies included data collected in the United States, China and nine European countries. The inclusion of only published journal articles (criterion b) is often discouraged in meta-analyses because the sample of studies can be biased by the ‘file drawer problem’ in which studies with non-significant findings are systematically less likely to be published (Rothstein et al., 2005). However, the specific estimate of interest in this meta-analysis – spatial clustering in satisfaction – is rarely the focus of a study, and usually is reported only incidentally as part of a statistical modelling rationale, to inform the choice between ordinary least squares regression and a more sophisticated model (e.g. mixed model, spatial autoregression). Therefore, while the estimate may impact the type of model used, it would not directly impact the likelihood of publication. The phrases in criterion (c) were designed to capture the range of studies investigating forms of place satisfaction, while the terms in criterion (d) were designed to identify studies reporting any of the commonly used statistics for assessing spatial clustering in a variable of interest. These searches yielded a total of 649 items (65 from EBSCO, 114 from ProQuest and 470 from Google Scholar).
PRISMA flow diagram.
Second, I screened the items to remove duplicates (n = 148) and non-articles (n = 46, e.g. tables of contents), yielding an initial pool of 455 papers. Third, I screened each paper’s title and abstract for relevance, resulting in the exclusion of 243 irrelevant papers and reducing the pool to 212 papers. While there were many reasons that irrelevant papers appeared in the initial pool, among the most common reasons were cases where ‘ICC’ referred to the United States Interstate Commerce Commission (e.g. in papers published in law reviews) or to a measure of inter-rater reliability for qualitative data. Fourth, I downloaded the remaining 212 papers and reviewed their full text to determine whether they reported an estimate of the association between neighbourhoods and neighbourhood satisfaction (e.g. an ICC) and information necessary to compute the estimate’s variance, which is required for including the estimate in a meta-analysis. This resulted in the exclusion of 175 papers. Although the literature search began with a broad scope, none of the studies used Moran’s I or Geary’s C to measure spatial clustering in neighbourhood satisfaction. A small number of papers (n = 10) focused on residents’ community satisfaction, satisfaction with a named city or satisfaction with another type of place. Because the number of studies examining satisfaction with types of places other than neighbourhoods is insufficient to obtain stable meta-analytic estimates, these were also excluded.
Data extraction and coding
This screening process yielded a sample of 27 studies of neighbourhood satisfaction. The primary data extraction task involved recording each estimate of an ICC used to measure the amount of variation in neighbourhood satisfaction attributable to neighbourhoods. Each paper could report more than one ICC; for example, computed for different samples, or with respect to different measures of neighbourhood satisfaction. I identified 126 such estimates, recording each ICC value as well as the total sample size and number of clusters. I then classified these ICCs into two groups. The first group (satisfaction) includes ICCs describing variation in a variable explicitly intended to measure overall neighbourhood satisfaction using a single-item measure, multi-item scale or pooling of satisfaction with specific neighbourhood features (n = 31). The second group (components) includes ICCs describing variation in a variable measuring satisfaction with a single feature of the neighbourhood that is a component of overall neighbourhood satisfaction (e.g. relationships with neighbours, intergenerational closure or physical or social disorder; n = 95). In the analysis below, I present results separately for the satisfaction ICCs and satisfaction-component ICCs.
I also attempted to extract measurement properties of the variables summarised by the ICC, including their mean, standard deviation, range, response options and, for scale variables, their number of items and inter-item reliability (i.e. Cronbach’s α). In cases where the mean, range and response options were reported, to facilitate comparison across studies I standardised the mean using:

For example, a mean satisfaction of 4 on a 1–5 Likert scale where 5 meant highly satisfied was standardised to 0.75, while a mean satisfaction of 5 on a reverse-coded 1–7 Likert scale where 7 meant highly dissatisfied was standardised as 0.33.
Finally, to characterise the studies, I attempted to extract information about their sample, including respondents’ geographic location, age, sex and race or ethnicity. Additionally, as a rough index of each study’s methodological rigour and transparency, I computed a measure of reporting quality as the proportion of the following values that were reported in the paper: age, gender, satisfaction mean, satisfaction standard deviation, satisfaction range, and reliability and method of scale construction (if using a multi-item satisfaction scale). The complete data, including all items obtained in the systematic literature search and all information extracted from them, is available in Neal (2020).
Analysis
A meta-analysis pools the results of multiple studies estimating a common effect to obtain a more precise estimate. In this meta-analysis, the goal is to obtain a precise estimate of the ICC measuring the amount of variation in neighbourhood satisfaction that can be attributed to neighbourhoods, and thus of the strength of the association between neighbourhoods and neighbourhood satisfaction. There are two types of statistical model used in meta-analysis to compute such an estimate: fixed-effect and random-effects.
The fixed-effect model yields a weighted average of all the individual studies’ estimates, where each estimate (ρ) is weighted by the inverse of its sampling variance (V), which is estimated as a function of the number of clusters (m) and the mean per-cluster sample size (n):

This ensures that studies with larger samples are given greater weight in the pooled estimate. Although the fixed-effect model is straightforward, it imposes the assumption that each study measured the estimate of interest (here, the ICC of neighbourhood satisfaction) in the same way, from the same sample and using the same methods, and thus that between-study variations arise strictly from sampling error. In contrast, the random-effects model does not impose this assumption, and recognises that different studies measured the estimate of interest in different samples, using different methods. This model still yields a weighted average, but the weights take into account not only each study estimate’s variance due to sampling error (eq. 2), but also between-study variance due to differences in samples and methods (Borenstein et al., 2010).
Since there is significant variation in the samples and measurement of place satisfaction across the included studies, the random-effects model is more appropriate than the fixed-effect model. Therefore, following the approach of Hedberg and Hedges (2014) for conducting a meta-analysis of ICCs, I use a random-effects model, which is estimated in R using the ‘meta’ package (Schwarzer, 2007).
Results
Who gets asked about neighbourhood satisfaction?
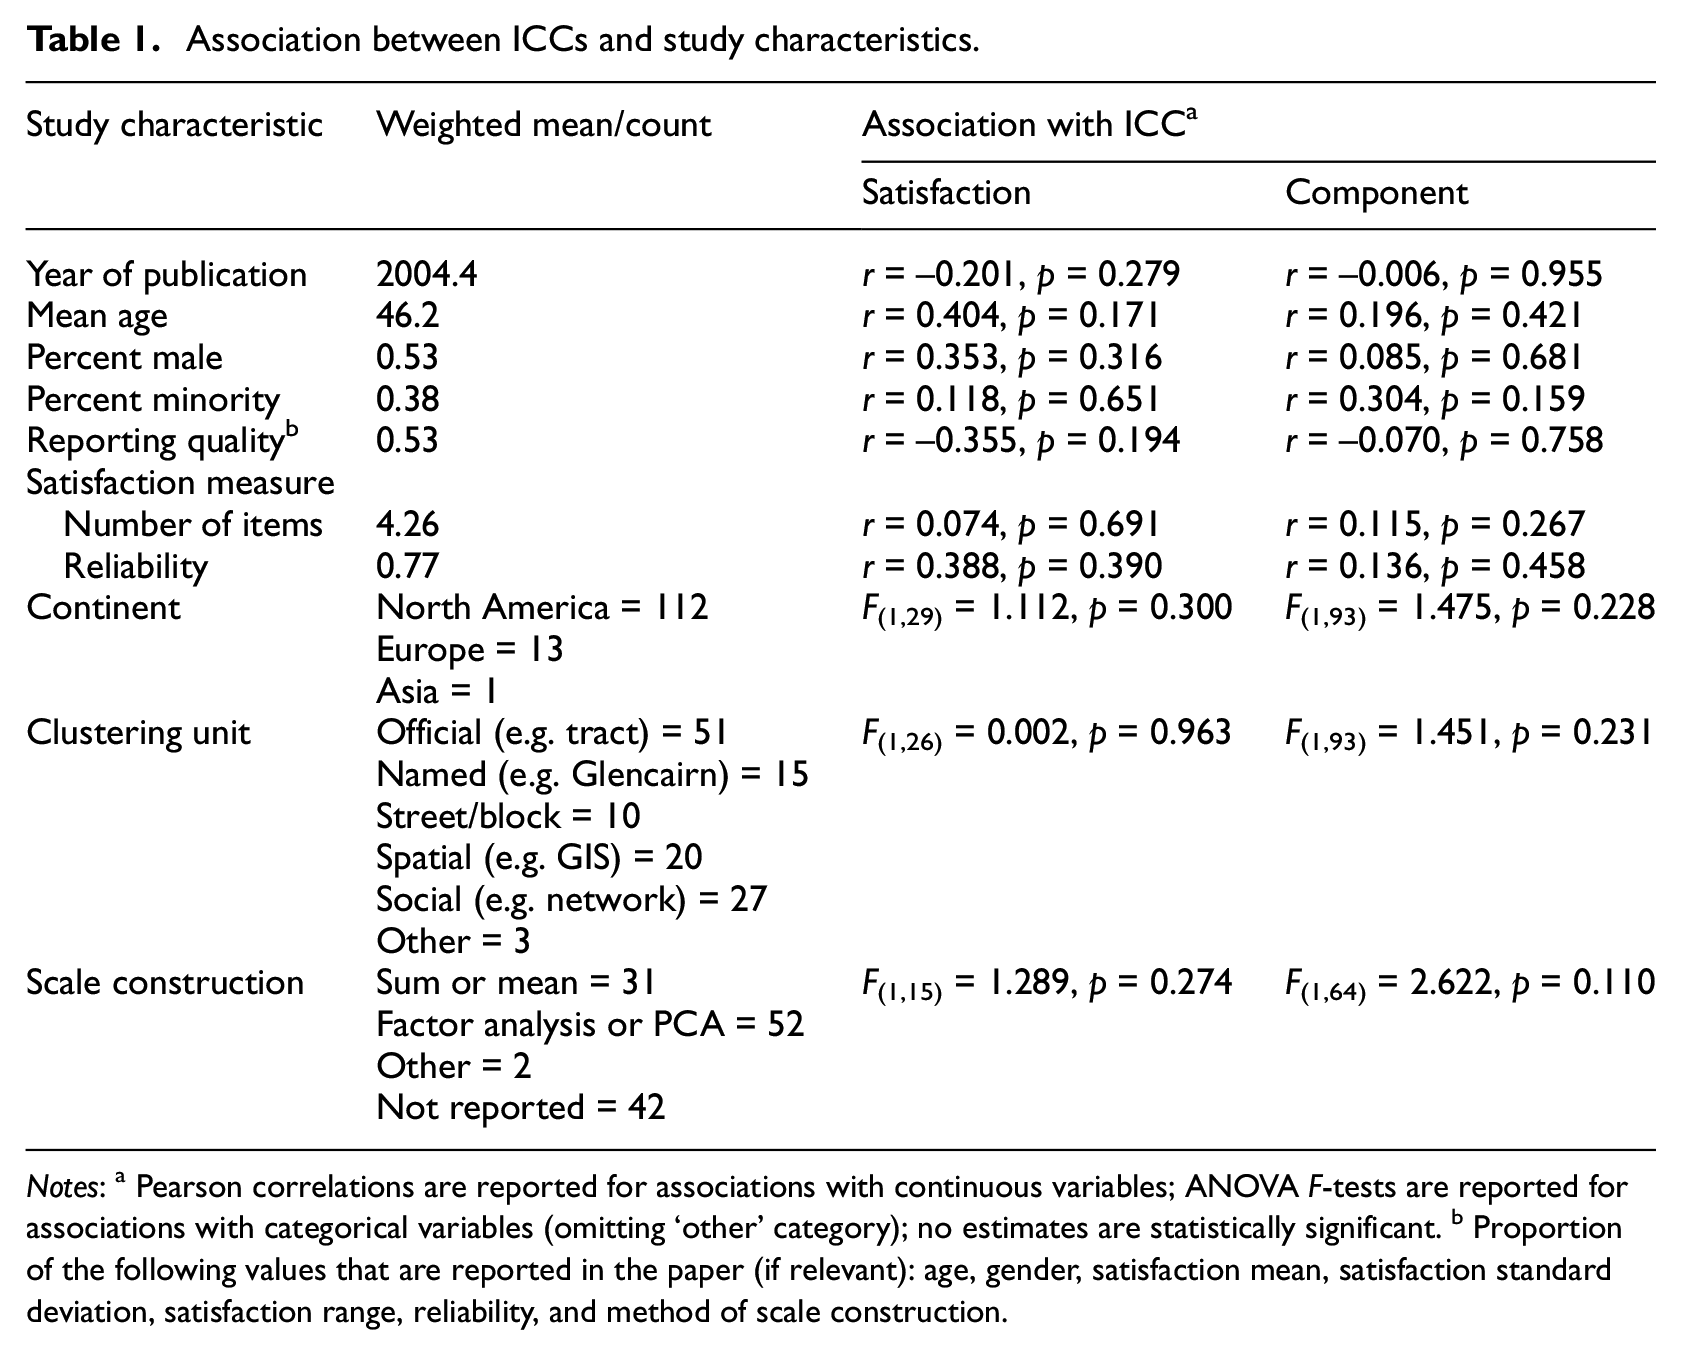
Table 1 summarises the characteristics of the studies of neighbourhood satisfaction identified by the systematic literature review process illustrated in Figure 3. The means are weighted by study sample size so that they approximate the sample about which meta-analytic conclusions can be drawn. Studies were published between 1981 (shortly after mixed models for clustered data were developed) and 2018, with a mean publication year of 2004. These studies’ samples had a mean age of 46, and included primarily samples of adults over the age of 18, although a few focused on adolescents’ place satisfaction (e.g. Hipp et al., 2012; Lenzi et al., 2013). These samples tended to be diverse in terms of both gender (males = 53%) and race/ethnicity (minority = 38%), and were drawn from 11 countries spanning three continents, with the majority coming from the United States. The US samples were drawn from a range of locations and scales, including nationwide (e.g. Hipp, 2010b), regions (e.g. the Southwest; Siordia and Saenz, 2013) and specific cities (e.g. Chicago; King, 2013).
Association between ICCs and study characteristics.
Notes: a Pearson correlations are reported for associations with continuous variables; ANOVA F-tests are reported for associations with categorical variables (omitting ‘other’ category); no estimates are statistically significant. b Proportion of the following values that are reported in the paper (if relevant): age, gender, satisfaction mean, satisfaction standard deviation, satisfaction range, reliability, and method of scale construction.
The studies varied in their methods of measuring satisfaction, using an average of 4.26 items with an average inter-item reliability of 0.77. These items were combined into a single satisfaction variable by adding or averaging the individual items (n = 31), or using a factor or principal components analysis (n = 52). Several different areal clustering units were used to compute the ICC with respect to the satisfaction variable. The most common approach to computing ICCs relied on official government-designated units such as census tracts or postcode (40%, n = 51). Some ICCs were computed using spatial units whose boundaries were defined by respondents’ self-reported social networks (n = 27) or by spatial grids generated via GIS (n = 20; Cutchin et al., 2011; Hipp et al., 2012). Still fewer were computed using researcher-generated boundaries of named neighbourhoods (n = 15) or blocks (n = 10).
Although the rigour of studies is difficult to assess from the final published research paper, their completeness and transparency in reporting descriptive statistics offer a rough index of attention to detail. On average, these studies reported only about half (56%) of the relevant descriptive statistics: sample size, age, gender, satisfaction mean, satisfaction standard deviation, satisfaction range, satisfaction reliability and scale construction method.
To examine whether any of these study characteristics are associated with the ICC(s) reported in a study, Table 1 also reports the Pearson correlation between the ICC and continuous study characteristics, and the ANOVA F-test for categorical study characteristics. None of these characteristics were statistically significantly associated with ICCs summarising neighbourhood satisfaction, or with ICCs summarising components of neighbourhood satisfaction. This suggests that the ICC reported in a specific study is not directly associated with the study’s sample, design or measurement approach.
Are people satisfied with their neighbourhoods?
The primary focus of this meta-analysis is the strength of the association between neighbourhoods and neighbourhood satisfaction; however, it is also informative to consider how neighbourhood satisfaction is measured and whether people are satisfied with their neighbourhoods. The left panel of Table 2 summarises the satisfaction variable used in the included studies, which was measured with many different response scales, including Likert scales with four (e.g. Van Assche et al., 2018), five (e.g. Lee et al., 2017) and 10 (e.g. Permentier et al., 2011) response options. Sufficient information was available for 15 satisfaction variables and 22 satisfaction component variables to standardise the reported sample’s mean on a 0–1 scale using equation (1), where 1 represents the maximum possible satisfaction given the variable’s scale. This standardisation allows comparison of mean satisfaction across studies despite their use of differently scaled variables. The mean of standardised mean satisfaction variables was 0.71, and the mean of standardised mean satisfaction component variables was 0.62. Notably, the minimum mean neighbourhood satisfaction observed in any study was 0.57, which means that on average all respondents across all studies reported being more satisfied with their neighbourhoods than not. Together with the strongly skewed distributions, these characteristics of the standardised variables indicate that respondents in these studies reported relatively high levels of satisfaction.
Summary of satisfaction variables and ICCs.
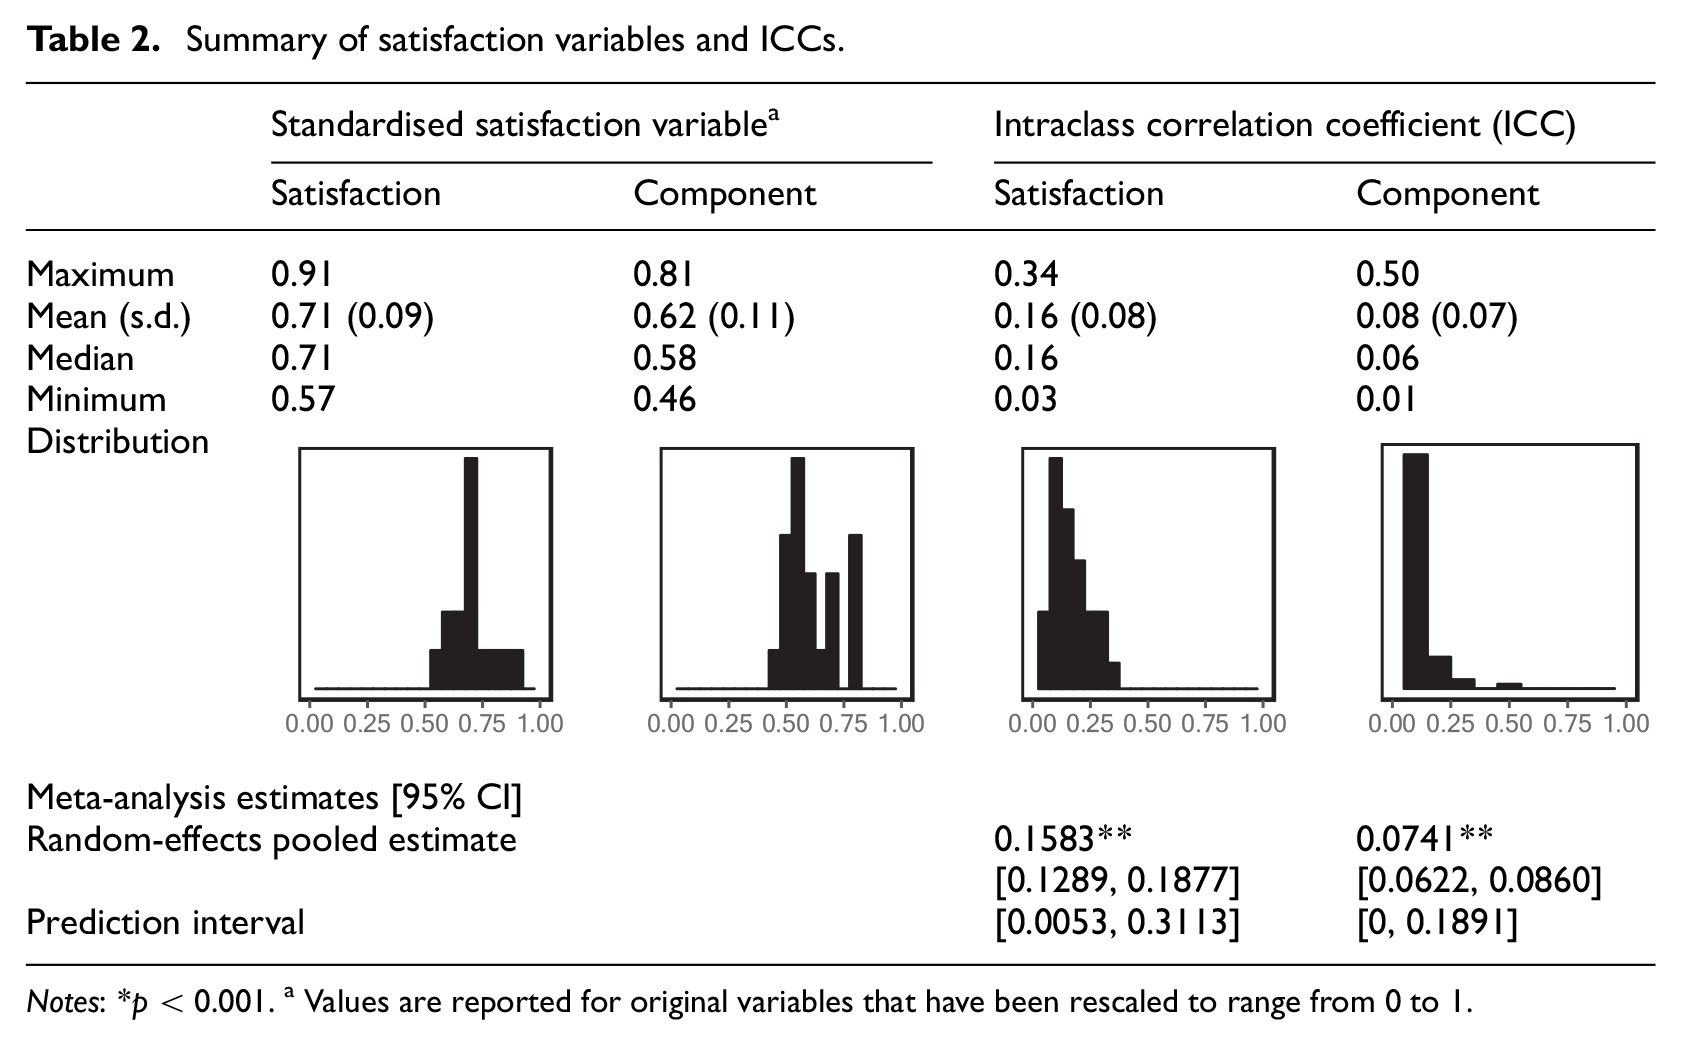
Notes: *p < 0.001. a Values are reported for original variables that have been rescaled to range from 0 to 1.
Do neighbourhoods matter for neighbourhood satisfaction?
The right panel of Table 2 and the forest plot shown in Figure 4 both summarise the ICCs extracted from the included articles. The unweighted mean of ICCs summarising neighbourhood satisfaction is 0.16, and that of ICCs summarising components of neighbourhood satisfaction is 0.08. These values and the related histograms provide a rough summary of the extracted ICCs, highlighting that they are strongly skewed towards zero; however, they do not take into account the within- or between-study variance. A random-effects model provides a more robust way of pooling each study’s ICC estimate that incorporates these sources of variance. The random-effects pooled estimate of the ICCs summarising neighbourhood satisfaction is 0.1583 (p < 0.001). That is, incorporating all the available evidence from 31 estimates, at most about 16% of the variation in neighbourhood satisfaction can be attributed to the neighbourhood. This suggests that neighbourhoods do matter for neighbourhood satisfaction, but that their direct effect is weak. The prediction interval is also derived from the random-effects meta-analysis and provides a 95% confidence interval around the ICCs that might be expected in future studies of neighbourhood satisfaction. Here, it suggests that future studies of neighbourhood satisfaction are likely to obtain an ICC between about 0 and 0.31.
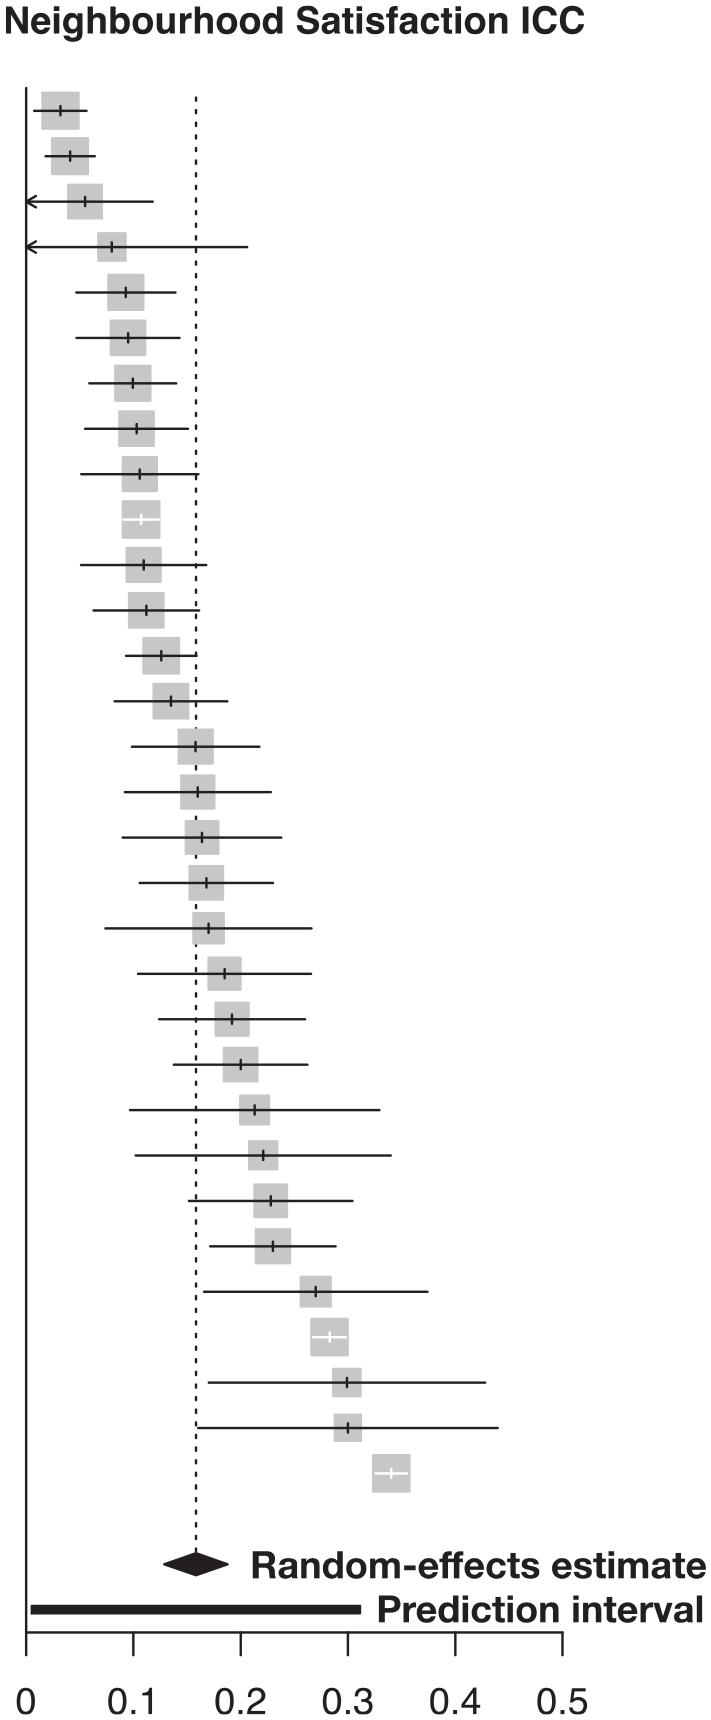
Forest plot of neighbourhood satisfaction ICCs.
The random-effects pooled estimate (0.0741, p < 0.001) and prediction interval [0, 0.1891] for ICCs summarising components of neighbourhood satisfaction are much lower. That is, incorporating all the available evidence from 95 estimates, at most about 7.4% of the variation in components of neighbourhood satisfaction can be attributed to the neighbourhood, and future studies of components of neighbourhood satisfaction are likely to obtain an ICC of between about 0 and 0.19. This suggests that neighbourhoods do matter for the components of neighbourhood satisfaction, but again their direct effect is weak.
Discussion
Beginning with the premise that planners and local leaders want to build neighbourhoods that are satisfying to their residents, in this article I explore the extent to which this is possible by asking: do neighbourhoods matter for neighbourhood satisfaction? Pooling 126 estimates from 27 published studies using a random-effects meta-analysis, I find that neighbourhoods do matter for neighbourhood satisfaction, but that their direct effect is weak. Specifically, neighbourhoods (i.e. objective neighbourhood features) account for at most about 16% of the variation in residents’ neighbourhood satisfaction and at most only 7.4% of the variation in components of neighbourhood satisfaction. The vast majority of variation in satisfaction is driven by personal and psychological factors, such as respondents’ individual characteristics and their perceptions of the neighbourhood. This finding is counterintuitive because we expect that our satisfaction with a neighbourhood should be associated, at least in large part, with the neighbourhood itself. It is also practically significant because it suggests that changes to a neighbourhood’s built or social environment will have relatively little impact on residents’ satisfaction. In this section, I explore four possible explanations for this finding.
First, neighbourhood satisfaction may be an individual-level psychological phenomenon, that is, it may just be ‘in our heads’. Individual differences in neighbourhood satisfaction may be driven by individual demographic differences, or by personality traits such as extraversion and neuroticism, which are associated with generally higher levels of satisfaction (Schimmack et al., 2004; see Figure 1, path B). If this is the case, then there are limited opportunities to make neighbourhoods more satisfying to their residents because there are limited ways to influence residents’ demographic characteristics or personality traits. Neighbourhood satisfaction may also be associated with the (potentially erroneous) beliefs held by residents about their neighbourhoods (see Figure 1, path C). In this case, influencing residents’ neighbourhood satisfaction might be achieved through changes not to the neighbourhood itself, but merely to residents’ perceptions of it, for example through marketing. In either case, however, the route towards increasing neighbourhood satisfaction is a psychological one focused on changing the residents, not an urban one focused on changing the neighbourhood.
Second, neighbourhood satisfaction may be driven not simply by individual characteristics or objective features of the place, but by an interaction between the two. Different people may find different neighbourhood features satisfying, as for example in Greif’s (2015) finding that black homeowners find neighbourhoods that offer economic advantage more satisfying, while black renters do not. In a neighbourhood that offers economic advantage and is home to both homeowners and renters, the homeowners’ increased satisfaction may offset the renters’ decreased satisfaction, thereby making it appear that economic advantage (an objective feature of the neighbourhood) is not related to neighbourhood satisfaction, despite the fact that it is. In the context of a mixed model, this is an example of a cross-level interaction, the effect of which may not be fully captured by the ICC, leading the ICC to underestimate the true neighbourhood effect on neighbourhood satisfaction. 4 However, even if the ICCs are underestimated for this reason, and neighbourhoods do have more impact on neighbourhood satisfaction than the reported ICCs suggest, improving neighbourhood satisfaction through changes to the neighbourhood would still be challenging because any given change may increase the satisfaction of some residents while decreasing that of others. Seeking to improve neighbourhood satisfaction through neighbourhood changes in these cases seems impractical because it would require first knowing how specific changes would impact the satisfaction of specific (types of) residents, then identifying the change or set of changes that would yield a net increase in satisfaction. However, perhaps with sufficient needs assessment and public engagement in the planning process this form of population-specific neighbourhood engineering is possible.
Third, ICCs may provide a poor indicator of the association between neighbourhoods and neighbourhood satisfaction because the areal clustering unit used in the ICC computation does not match residents’ conception of the ‘neighbourhood’ when reporting their satisfaction. For example, Arundel and Ronald (2017), Van Assche et al. (2018) and Greif (2009) each measured respondents’ satisfaction with their ‘neighbourhood’, but computed the ICC with respect to Dutch postcodes, German Kreis districts and US census tracts, respectively. Moreover, different residents living in the same areal unit might have different perceptions of the boundaries of their ‘neighbourhood’, and changes to the built environment such as the construction or removal of a motorway can influence these perceived boundaries. One solution to this challenge might involve future studies using satisfaction measurement instruments that match objective areal units, for example asking respondents about their satisfaction with their postcode. However, this may introduce different measurement difficulties if the clustering unit is not relevant for the respondent’s daily life. An alternative solution has involved computing the ICC with respect to several possible clustering units (Cutchin et al., 2011; Hipp, 2010a; Hipp et al., 2012), and focusing on the unit that yields the largest ICC as the best match to the subjectively defined neighbourhood. Future studies should consider the implications of mismatches between neighbourhoods and clustering units when computing ICCs and estimating mixed models. However, it is important to note that across studies using different clustering units, reported ICCs were heavily skewed towards small values, and that the largest ICC observed across all studies examining neighbourhood satisfaction was still only 0.34. Thus, while it is possible that neighbourhoods matter more for neighbourhood satisfaction than the meta-analytic ICC estimate of 0.16 would suggest, even under the best case scenario their direct effect is modest.
Finally, it is possible that researchers are simply unable to reliably and validly measure neighbourhood satisfaction. Indeed, a review of satisfaction instruments concluded that ‘too little thought and effort are put into developing and validating the questionnaires employed’ (Smrke et al., 2018: 79; see Parkes et al., 2002). Consistent with this conclusion, the studies included in this review measured neighbourhood satisfaction using many different instruments that varied in terms of both the number of items and their content. If neighbourhood satisfaction measurement is flawed, then the ICCs examined in this study are difficult to interpret and the implications of the meta-analytic findings are unclear, but so too are the findings of thousands of other articles dealing with issues of neighbourhood satisfaction. A more charitable perspective is that although neighbourhood satisfaction is difficult to measure, the different instruments employed in neighbourhood satisfaction studies each capture some aspect of the phenomenon, and that triangulating these diverse studies’ findings via meta-analysis offers some clarity. Supporting this perspective is the finding that, across many studies, satisfaction scores are tightly clustered around a mean of 0.71 on a 0–1 scale and ICCs are consistently skewed towards zero (see Table 2).
It is impossible to determine from the meta-analytic results exactly why the effect of neighbourhoods on neighbourhood satisfaction is so weak, which is a limitation of this study and an important direction for future research. In addition to clarifying why neighbourhoods appear to matter so little for neighbourhood satisfaction, this study points to several additional directions for future research. First, researchers should aim to use validated methods for measuring neighbourhood satisfaction, ideally relying on the same instruments as past studies to facilitate comparison and replication. Second, when using mixed models to estimate effects in cluster-sampled data, researchers should aim to measure neighbourhood satisfaction using questions that ask about the same areal unit used for clustering. Third, as a theoretical bridge between the ecological (Wirth, 1938) and systemic (Gans, 1962) perspective, researchers should explore the potential for cross-level interactions in mixed models explaining neighbourhood satisfaction.
The practical implications of this finding are more challenging. If neighbourhoods do not matter much for neighbourhood satisfaction, then should planners and local leaders give up on building better neighbourhoods? Not necessarily, but this finding does suggest that there are limits to how much efforts directed at shaping the built and social environment can impact neighbourhood satisfaction. Specifically, it suggests that there is likely no panacea for neighbourhood satisfaction. A new park, lower crime or better schools might increase neighbourhood satisfaction slightly, but such objective features have a limited role to play. Instead, to the extent that neighbourhood satisfaction is a highly personal experience, efforts focused not on the neighbourhood but on the residents – either changing their perception of their neighbourhood or facilitating their move to a neighbourhood they find more satisfying – may be more effective.
Footnotes
Declaration of conflicting interests
The author(s) declared no potential conflicts of interest with respect to the research, authorship, and/or publication of this article.
Funding
The author received no financial support for the research, authorship, and/or publication of this article.