




Abstract
Internal migration is critically important in China, where the fertility rate is declining and international immigration is under strict control. This study explores the massive population movement in China, examines the migration pattern of non-hukou migrants, 2010–2015 and 2014–2015 migration patterns through the urban hierarchy of the urban system using migration trajectories derived from the 2015 One Percent Population Sample Survey. Results reveal an emerging reversal from a predominantly upward pattern (e.g. most of the net flows move to high-level cities) to a downward one (e.g. from super-large/extra-large cities to large cities) in the recent migration trend. Regional disparities are significant. An upward and eastward tendency still dominates in the western, central and northeastern regions, whereas a downward and decentralised tendency has been initiated in the eastern region. The causes for the structural change include common factors found in developed countries, such as the influence of age and life courses. The age structure of China’s population caused by the ‘one-child’ policy weakened the upward momentum and led to a strengthening downward trend in the current migration pattern. The contextual and institutional factor hukou also has a significant effect on people’s migration directions. Hukou attracts people to move up or down the hierarchy to their registered place or where they can acquire registration. The characteristics of registered migrants reflect the different criteria of cities in granting hukou.
Introduction
Internal migration has a more prominent effect on the variation in city size in developing countries than in developed countries. Over recent decades, China’s natural population growth has declined from 1.47% in 1990 to 0.33% in 2019. The 2010 population census reported that there were only 1.02 million overseas immigrants – 0.08% of the overall population. This proportion is in stark contrast with that in many developed countries where international immigrants are an important complementary labour force. With low natural population growth and very few immigrants, internal migration plays a key role in restructuring the urban system and influencing the socioeconomic trends in China. Understanding the internal migration patterns at different stages of development can help forecast the evolution of the urban system and determine socioeconomic trends. Massive population movement in today’s developing countries has been occurring over a short period of time, whereas developed countries have moved at a more leisurely pace (Henderson, 2010). Hence, whether the migration pattern and influential factors (such as age and life courses) in a country on the move would continue along the lines of existing experiences remains inconclusive. Moreover, large cities in China have been growing fast during recent decades, however, there seems to be a recent slowing trend. What the current trends and causes of the migration pattern are remain to be revealed.
Differing definitions of migration affect the conclusions on migration patterns. Migration is defined broadly as a permanent or semi-permanent change of residence through space during a time interval (Lee, 1966). Intervals of 5 and 1 years are recommended and frequently used in many official statistics (United Nations, 2017). An international consensus on the definition or standard timescale for migration has yet to be reached. Besides 5- and 1-year migration patterns, migration in China is often combined with the household registration system, hukou. Non-hukou migrants are those who reside in a place other than their registered household and have been absent from their registered household for at least 6 consecutive months. Hukou records the geographical location of one’s household. These records have played different roles in various periods (Chan, 2019; Chan and Zhang, 1999). Hukou was used to monitor migration in the early 1950s and was later used to control migration from the late 1950s to 1970s. After the 1980s, hukou was no longer a permit for migration but hukou registration was still subject to strict regulation. The Chinese government had long managed hukou in a dual system (agricultural and non-agricultural). This dual system ensured priorities, such as housing, education, healthcare and employment, to the non-agricultural hukou type but restricted access to the agricultural hukou type. In 2014, the State Council announced the abolition of the dual system of hukou. However, priorities that used to be associated with the non-agricultural hukou type appear to have become attached to the hukou location. For example, hukou registered in larger cities have ‘location dividends’ and have access to better social welfare services. Thus, larger cities often set entry barriers such as age, educational attainment, professional skills, achievements or other qualifications in granting hukou, to control population growth (Fang and Zhang, 2016). Non-hukou migrants may change their destinations more than once after they leave their hukou place. The population distribution in China is a cumulative result of multiple migrations of millions of migrants.
Using authoritative and representative survey data of China, this study explores the migration patterns of three types of migrants, namely, non-hukou migrants, 5-year (2010–2015) migrants and 1-year (2014–2015) migrants. This paper is structured as follows. First, we review previous studies on urban hierarchical migration and address the research gaps in the internal migration of China regarding urban hierarchy. Second, we introduce the data and analytical approaches used in this study. Third, we suggest a new emerging structural change in the migration pattern and provide explanations for this change in the Chinese context. Finally, we summarise the conclusions and discuss the implications of our findings.
Literature review
Patterns of urban hierarchical migration
Migration patterns are complex and context-dependent, and they vary between various stages of development (Zelinsky, 1971). Throughout much of the developing world, a conventional scenario of population movement is to follow the migratory steps of moving from rural areas to nearby towns and then up the urban hierarchy to large cities (Ravenstein, 1885). This upward pattern is still predominant in today’s developing countries such as Albania (Lerch, 2016) and some developed countries such as Canada (Newbold, 2011). However, a downward trend has become the norm in some other developed countries such as the USA (Manson and Groop, 2000; Plane et al., 2005). Although different patterns have been observed, we should note that the time interval and type of migrants in different countries are not directly comparable. For example, the UK followed an upward pattern along the urban hierarchy in the 1880s by defining migration as movement from place of birth to place of current residence (Ravenstein, 1885). The USA followed a downward pattern in 1999–2000 by defining migration as place of previous residence to place of current residence (Plane et al., 2005). A time interval of 17 years (1990–2007) was used in the study of Albania (Lerch, 2016) while 5 years (1996–2001) was used in the study of Canada (Newbold, 2011). Moreover, the division of urban hierarchy also varies between countries. For example, USA studies often use ‘Core-Based Statistical Area (CBSA)’ (Plane et al., 2005), while Canadian studies use census metropolitan area (CMA) and census agglomeration (CA) (Newbold, 2011) to classify urban hierarchy. These statistical units usually consist of at least one urban core plus adjacent counties/municipalities having a high degree of integration with the core. The use of time interval and study unit in existing literature largely depends on the available statistics in different countries.
The study of urban hierarchical migration in China started in the 1980s after internal migration was less strictly controlled. These studies can be classified into three categories. The first category is at the national scale (urban–rural difference). Migration studies in this category often focus on non-hukou migrants or floating population (floating population is a subset of non-hukou migrants excluding those moving within or between the districts of the same city). Rural to urban migration was the dominant feature in the mid-1980s (Ma et al., 1997) and has been the norm for decades (Liang and Ma, 2004).
The second category is at the regional scale (regional difference, e.g. western-central-eastern regions). China has been experiencing an eastward migration (from the western and central regions to the eastern region). Although the eastward direction remains dominant over the decades, the destination choices differ in various periods. For example, the most popular destination was Pearl River Delta (PRD) in 2000 but later changed to Yangtze River Delta (YRD) in 2010 (Liang, 2016). Scholars found significant differences in geographical patterns of hukou migrants and non-hukou migrants. In 2000–2005, southeast coastal provinces were preferred by non-hukou migrants because of employment opportunities, while south-central and southwestern provinces were more popular among hukou migrants because of the low entry barriers and return migration (Liu and Xu, 2017). In this category, the interprovincial population movement over 5 years, which is often derived from the decennial population census and intercensal One Percent Population Sample Survey (OPPSS) data, is also widely discussed (Fan, 2005; Shen, 2012).
The third category is at the city scale (urban hierarchy), which is the main focus of this study. Case studies have been carried out in large cities. These studies often start with household homeownership or the willingness of migrants to purchase housing to analyse their intention to move or stay (Fang and Zhang, 2016; Song and Zhang, 2019). Some scholars also carried out surveys in counties or small cities to analyse the possibility of destination choice (Fan and Xiang, 2020; Wang and Fan, 2006). Return migration has been observed, though of limited scale (Zhao, 2002) and the phenomenon has become more predominant in recent years (National Health Commission of China (NHCC), 2019).
Factors that may affect urban hierarchical migration
Cross-discipline theories have been developed to understand the processes and mechanisms of migration. Reasons for urban hierarchical migration are complicated and personal at the individual level; however, there could be commonalities at the macro level. People’s changing priorities on urban sizes at different ages and life stages are often regarded as the main cause affecting migration patterns across the urban hierarchy (Clark, 2013; Plane and Jurjevich, 2009). Economic reasons, such as different disposable incomes and costs of living, are also important factors affecting the migration direction between hierarchical levels (Korpi et al., 2011). Scholars also found that prospect theory, for example, familiarity with the local area, social ties and feelings of security, can explain people’s migration decisions (Clark and Lisowski, 2017).
In China, migration across regional or rural/urban hierarchies may be spurred by enormous disparities and wage differentials (Chan, 2012). Economic incentives and socio-cultural conditions are regarded as important determinants when migrants make settlement-versus-return decisions (Chen and Liu, 2016). Empirical studies in Beijing and Shanghai indicate that hukou is an important qualification for accessing many types of urban housing, thus affecting migrants’ decisions to move or stay (Sheng et al., 2019; Wu, 2006). Fang and Zhang (2016) pointed out that city entry barriers influence the housing tenure decisions of migrants in large cities. Cities with fewer entry barriers, good access to amenities and ample opportunities for personal development become attractive (Song and Zhang, 2019). Moreover, benefits tied to rural hukou become increasingly valuable, such as farming, housing land and potential compensation for land requisition (Chen and Fan, 2016), which may cause people to return. Small cities and counties from where non-hukou migrants come may be favoured by return migrants because of their family demands, a desire for family reunion and policy encouragement from the local government (Wang and Fan, 2006).
Similar to numerous other countries, China has limited available migration data at the city level. A fine structure of migration up and down the urban hierarchy in China has yet to be established. Previous Chinese studies mostly focus on large spatial units such as provinces or regions but ignore the variation between cities. How hukou status affects the direction of migration in the urban system is paid less attention. Moreover, whether findings of hukou restriction in case studies could apply to a national migration system remain to be explored. In this study, three research questions are addressed. (1) What are the migration patterns up and down the urban hierarchy of these three types of migrants, that is,non-hukou migrants, 5-year (2010–2015) migrants and 1-year (2014–2015) migrants? (2) Do migrants in different life courses and with different socioeconomic characteristics have equal chances of moving up or down the urban hierarchy? (3) How does hukou status influence people’s migration directions in the urban system?
Data and methods
Data
Our migration analyses are mainly based on a micro-sample data set extracted from the 2015 OPPSS data. The 2015 OPPSS was carried out by the National Bureau of Statistics of China (NBSC) in the first 2 weeks of November 2015 and the reference time was 0:00 on 1 November 2015. It employed a stratified multi-stage cluster sampling method to ensure the representativeness of samples. Thus, it can provide authoritative and reliable social, economic and demographic information on migrants, such as age, hukou, educational attainment and marital status. The 2015 OPPSS covers 1.55% of the national population (NBSC, 2016). The micro-level data set is extracted from the 1.55% data set using a systematic sampling method by the NBSC, it covers a population of approximately 1.37 million, and accounts for 0.1% of the national population. All the released data have been weighted by the NBSC at the individual level to ensure the samples’ composition represents that of the actual population.
Urban hierarchy
Chinese cities are officially designated administrative entities, and designation criteria are a function of the political-administrative status, economic performance, openness and population of an urban area (Song and Honglin Zhang, 2002). Our study covers 649 designated Chinese cities. The list of city names can be found in some Chinese yearbooks, such as the China Urban Construction Statistical Yearbooks (Zhongguo Chengshi Jianshe Tongji Nianjian). In this study, urban population size, that is, the number of people who live in the urban area of a city, determines the size of a city. The urban or rural status of an address was recorded in the data set under the Statistical Standard A Statistical Division of Urban and Rural Areas by the NBSC. Taking The Notice on Adjusting the Standard of City Size Division issued by the State Council in October 2014 as a reference, we classify cities into five categories using the 2010 full-sample data (NBSC, 2003). The criteria for and results of the classification are listed in Table 1. 1 In 2015, the average urbanisation level in super-large cities, extra-large cities, large cities, midsized cities and small cities was 86, 87, 80, 68 and 54, respectively. The geographical distribution of cities at different levels of the urban hierarchy is presented in Figure 1. 2 Over 1600 non-city units (counties or equivalent) are also included in the analysis, and the average urbanisation level was 36%.
Six-level urban hierarchy classified by urban population size.


Distribution of the Chinese cities at different levels of the urban hierarchy.
Definition of migrants
We use the different terms in the 2015 OPPSS data set to define migrants. A person is defined as a non-hukou migrant if their place of current usual residence is different from their place of hukou. A person is defined as a hukou migrant if they have changed their usual residence during a time interval (e.g. 1-year interval) and successfully registered their hukou in the destination. A person is defined as a 1-year/5-year migrant if their place of current usual residence is different from their place of usual residence 1 year/5 years ago. The analyses include 161,944 non-hukou migrants, 43,563 intra-provincial migrants during 2010–2015 and 23,734 migrants during 2014–2015.
Analytical approach
We use demographic effectiveness (DE) to measure the directionality of population movement (Plane and Jurjevich, 2009). DE is calculated by the formula:

where
We use the binary logistic regression model to test whether stages of life course, socioeconomic characteristics and hukou status influence people’s migration directions.

where
Moreover, we also use the visualisation method to present migration flows, for example, we visualise the net migration between different hierarchical levels across regions using the chord diagram (Gu et al., 2014).
Results
Shift in migration patterns through the urban hierarchy
We calculate the demographic effectiveness between urban hierarchical levels. This study compares the migration patterns of intra- and inter-provincial types for two reasons. One is that the experience of many countries has shown that short-distance migration differs qualitatively from long-distance migration (Clark and Maas, 2015). The other is that the accurate city of origin of 5-year inter-provincial migrants was not recorded by the OPPSS, which may be due to the consideration of avoiding inaccurate information and reducing the resources required to code the data.
Long-term migration pattern
In 2015, about 20% of the non-hukou migrants had been away from their hukou place for 5–10 years and 18% for at least 10 years. Thus, the migration pattern of non-hukou migrants represents a relatively long-term pattern compared with 5- and 1-year migration. Non-hukou migrants mainly follow a significant upward movement from their hukou place to the current residence place, whether intra- or inter-provincial migration (Figure 2a and 2b). Nearly 60% of the non-hukou migrants come from counties, another 30% come from small or midsized cities. Major net flows of non-hukou migrants are from counties to large or higher-level cities. Over 70% of the non-hukou migrants move to large or higher-level cities and most of them (nine out of ten) move to the urban area of these cities. Non-hukou migrants have a great influence on the size variation of Chinese cities. By 2015, more than one-third of the usual residents in super-large and extra-large cities was composed of non-hukou migrants from other cities or counties.
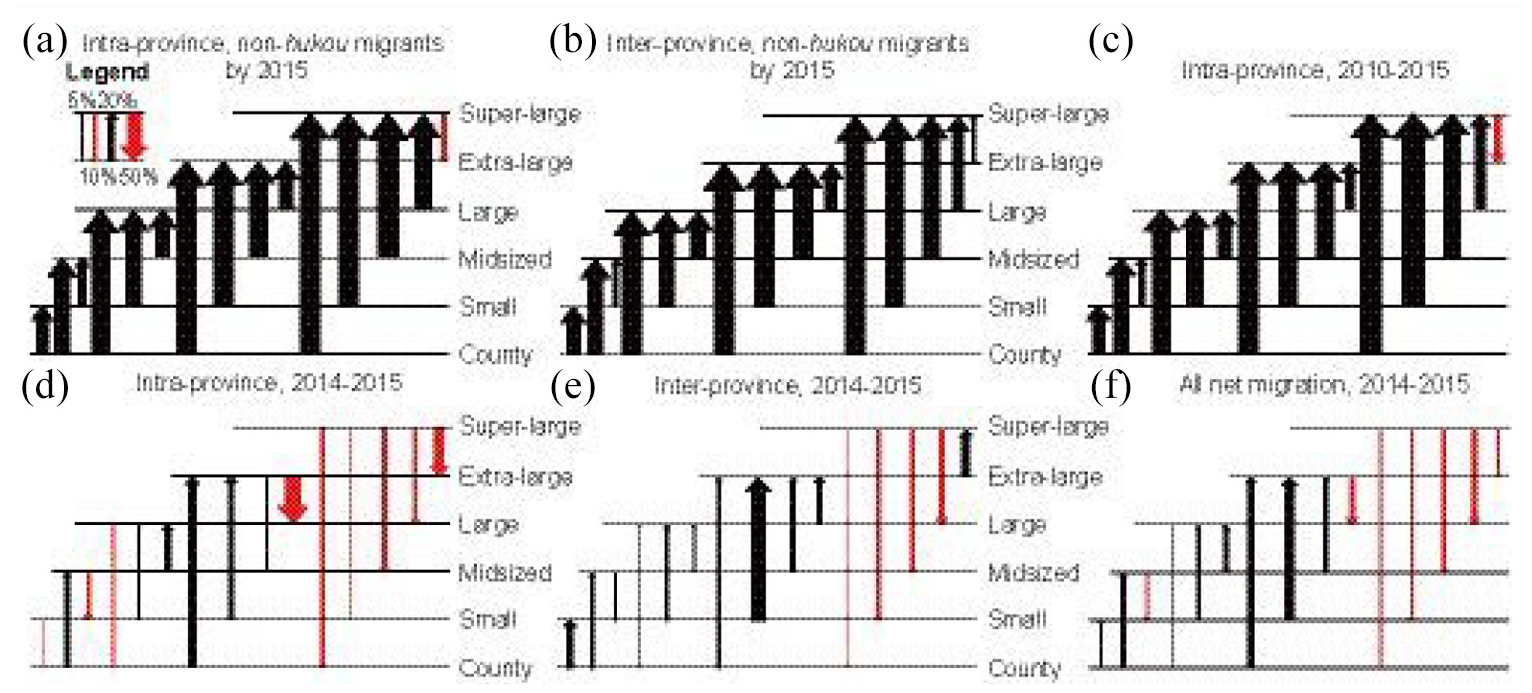
Demographic effectiveness between urban hierarchical levels. (a) and (b) Vigorous upward trends of intra- and inter-provincial net migration of non-hukou migrants by 2015. (c) A vigorous upward trend of intra-provincial net migration, 2010–2015. (d) A remarkable downward pattern of intra-provincial net migration, 2014–2015. (e) Downward pattern from super-large cities and upward pattern from lower hierarchical levels of inter-provincial net migration, 2014–2015. (f) A structural change of net migration from an upward pattern to the opposite direction, 2014–2015.
A new downward migration trend is emerging from the top of the hierarchy (Figure 2a). For example, non-hukou migrants move from the super-large city Shenzhen to the nearby extra-large city Dongguan in Guangdong province (DE: 65). This may be a result of the outward transfer of industries. Meanwhile, the highly interlinked transportation in Guangdong province also facilitates commuting between cities, so living in one city and working in another becomes possible (Mu and Yeh, 2020). Under such circumstances, some migrants may move away from the super-large cities because of population pressure. They can improve their living conditions in the surrounding cities, where housing prices are lower.
However, when non-hukou migrants return to their hukou place, the return behaviour that contributes to the urban system’s restructuring is not recorded by the hukou data. To understand the complete picture of short-term and recent migration patterns, we analyse the net flows of 5- and 1-year migration defined by the change of usual residence.
Urban transition
The net flows of 5-year intra-provincial migration still show a vigorous upward trend during 2010–2015 (Figure 2c). However, the upward trend weakened and the downward pattern, particularly from super-large cities, became prominent during 2014–2015 (Figure 2d). Downward net flows are also observed in the adjacent levels, for example, from extra-large to large cities or from midsized to small cities. In contrast to the emerging downward pattern of intra-provincial net migration, most inter-provincial net migrants are still moving upward, except those from super-large cities (Figure 2e). The overall effect of intra- and inter-provincial migration in 2014–2015 is that a structural change of net migration is taking place from an upward to a downward pattern (Figure 2f).
Regional inequality and geographic patterns
A significant difference exists between migration patterns in different regions (see regional division 3 ). An upward and eastward tendency dominates the western, central and northeastern regions for non-hukou migrants (Figure 3a). Eastern cities are primary receivers of net flows. However, a downward tendency was initiated in the eastern region during 2014–2015, such as people spreading from large (or higher level cities) to low-level cities or counties (Figure 3b).
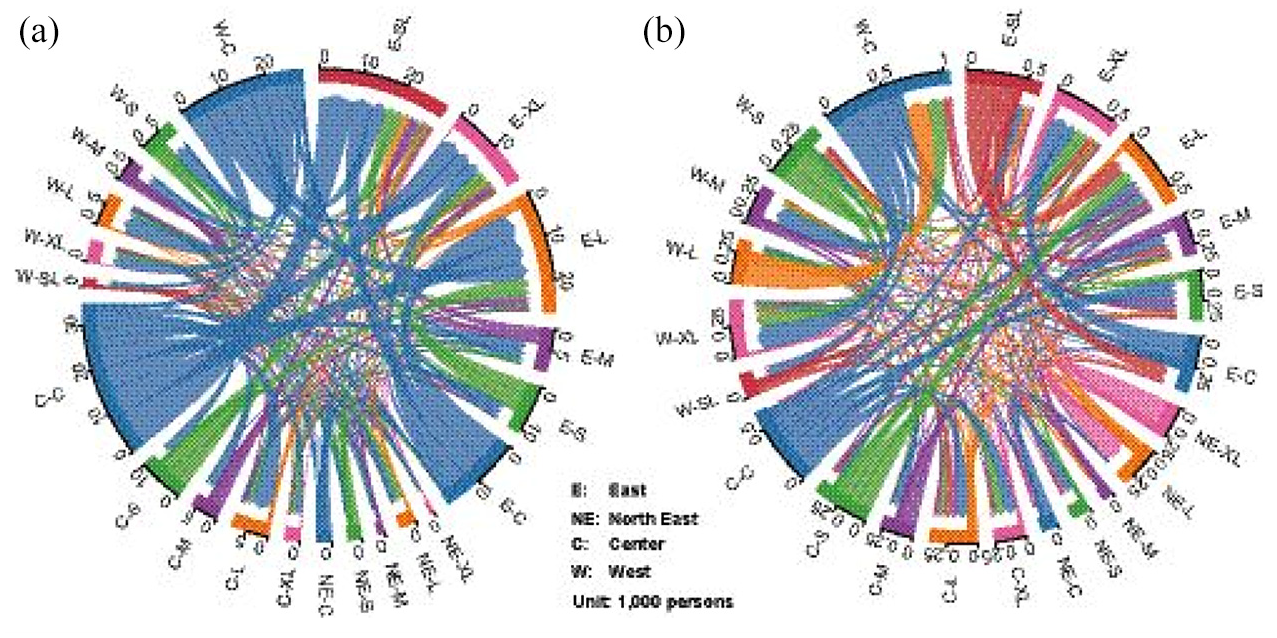
Population exchange between different levels of the urban hierarchy among regions. (a) Net flows of non-hukou migrants by 2015. (b) Net flows of 1-year migrants during 2014–2015. The line width represents the relative volume of net flows. The line colour represents the hierarchy of origin. The arrowhead represents the direction of net flows from origin to destination.
Changes in geographic migration patterns happen not only in long-distance migration but also in intra-province migration. Most of the intra-provincial net flows of non-hukou migrants and 5-year migrants follow an upward and centripetal direction, whereas those of 1-year migrants show decentralising trends, for example, from super-large cities Beijing and Shanghai to their surrounding counties. Some move from extra-large cities to the lower-level cities or counties, for example, from Hangzhou to Wenzhou (DE: 22), from Nanjing to Suzhou (DE: 54), and from Wuhan to Yichang (DE: 70).
Migration trend
The phenomena from several other perspectives and statistics after 2015 likewise indicate that China is undergoing a pivotal transition. According to the annual Statistical Communiqué on National Economic and Social Development, the number of non-hukou migrants has declined remarkably steadily from its peak of 298 million or 21.8% of the overall population in 2014 to 280 million or 20.0% of the overall population in 2019. The China Migrants Dynamic Survey issued a report in December 2018 which indicated that return migration became more predominant after 2015 (NHCC, 2019). Furthermore, economic growth slowed over the previous years. A widely recognised reason is that the demographic dividend, which is derived from a specific feature of the population age structure, has been diminishing since 2010 (Cai and Lu, 2013). The demographic dividend has contributed to the unprecedented economic growth and urbanisation in China over the past 30 years. After the working-age population reached its peak around 2012, the factors that have driven the rapid economic growth and urbanisation gradually faded. All the signals indicate the transition that happened in migration patterns is not occasional. It could be a part of a new emerging ‘turning point’ in Chinese society.
Dynamics of the structural change
Different migration patterns are found among various age groups (Figure 4). People aged 15–19 and 20–24 years mainly contribute to upward migration. Besides work/business reasons, studying is a major force that compels young people’s upward migration. This is because most of the higher education resources in China are located in large or higher-level cities, which are usually the provincial capitals. This situation is in contrast to that of the USA where many universities are found in small cities (Plane et al., 2005). The same logic may result in entirely opposite migration outcomes in different contexts. Figures 4e and 4f show that people’s migration preference significantly turns to a downward direction after the age of 35 years.

Demographic effectiveness percentage for age-specific net migration exchanges between urban hierarchical levels during 2014–2015 for persons: (a) 15–19 years; (b) 20–24 years; (c) 25–29 years; (d) 30–34 years; (e) 35–39 years; (f) 40–44 years.
To examine how migrants’ stages of life course, socioeconomic characteristics and hukou status affect their migration directions (dichotomous nominal variable – up versus down), we select migrants who had an across-hierarchy migratory event during 2014–2015 and run binary logistic regressions. Migrants whose origins are super-large cities or counties are omitted because they have limited options for migration directions. After the selection, 11,951 migrants are included in the analysis. The descriptive statistics of these migrants are listed in Table 2. Results of logistic regression models are listed in Table 3 and described as follows.
Descriptive statistics on migrants moving up and down the urban hierarchy during 2014–2015.
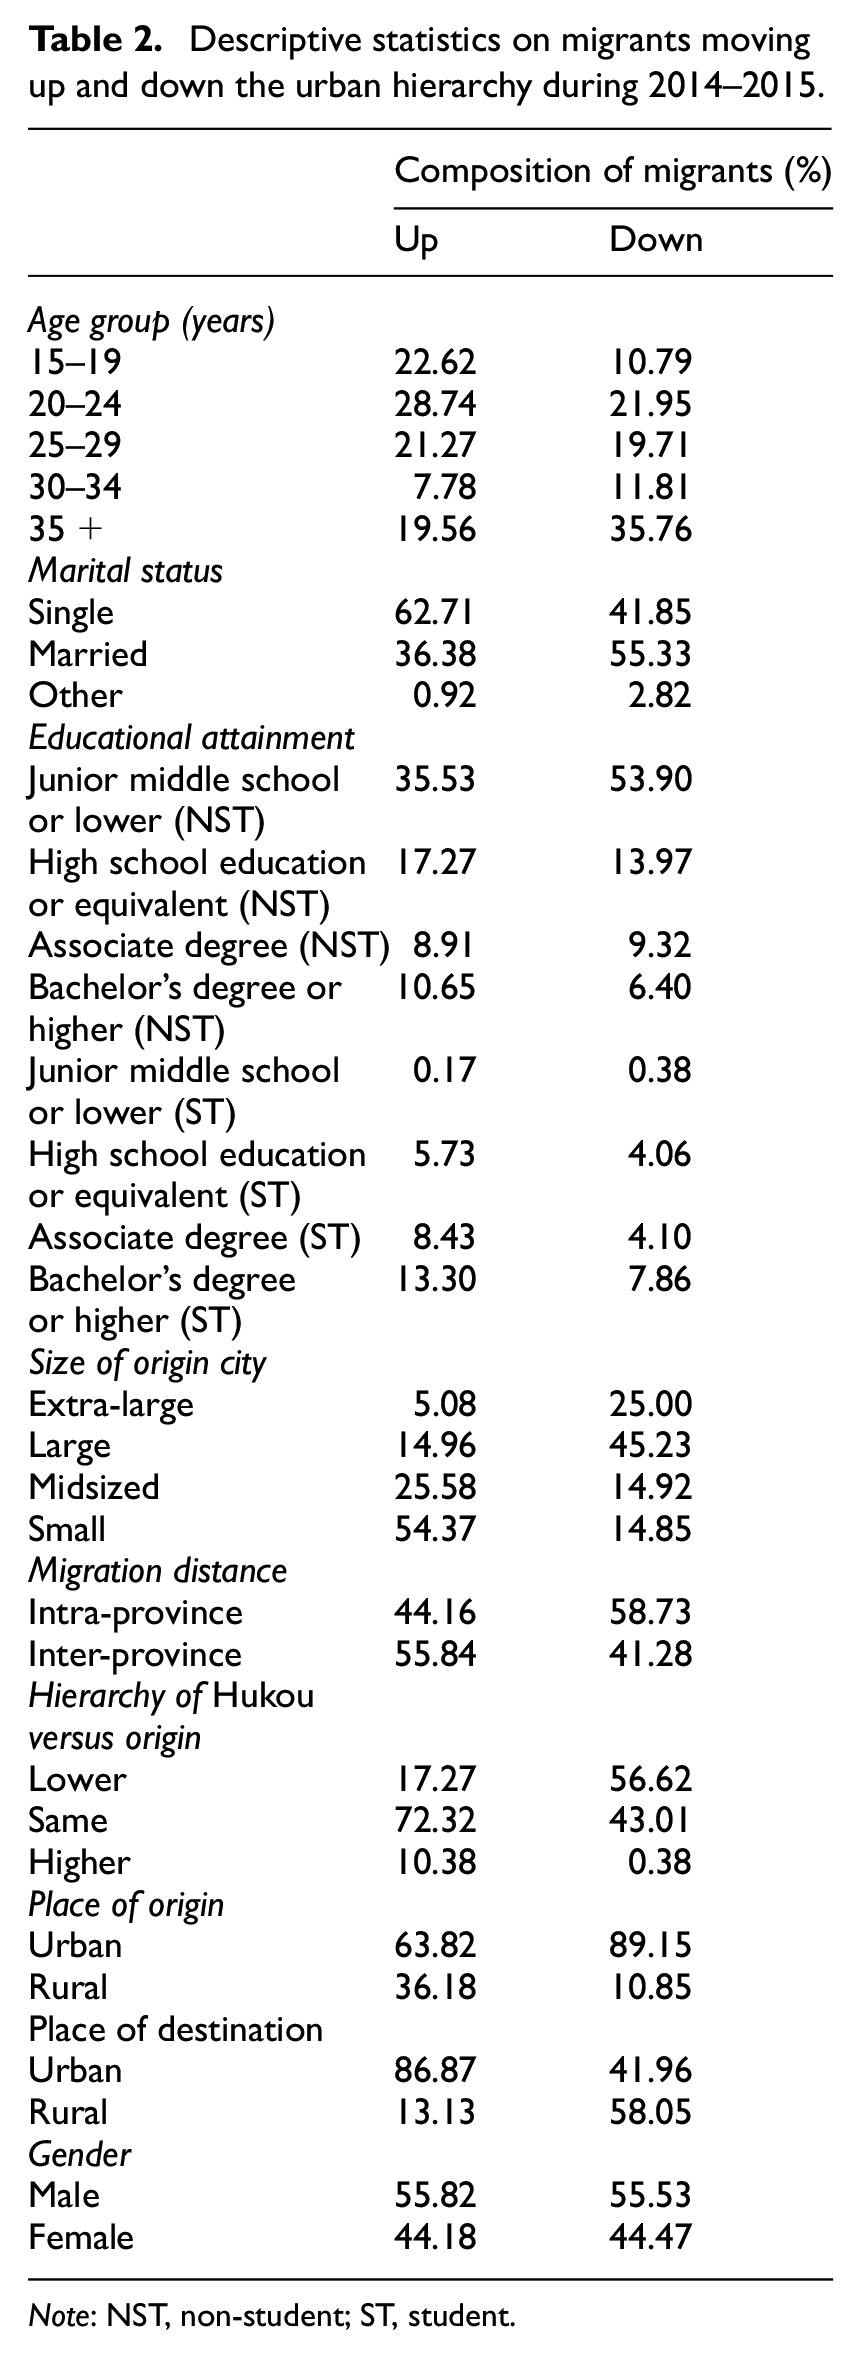
Note: NST, non-student; ST, student.
Results from the logistic regression model for testing the association between migration directions and variables.
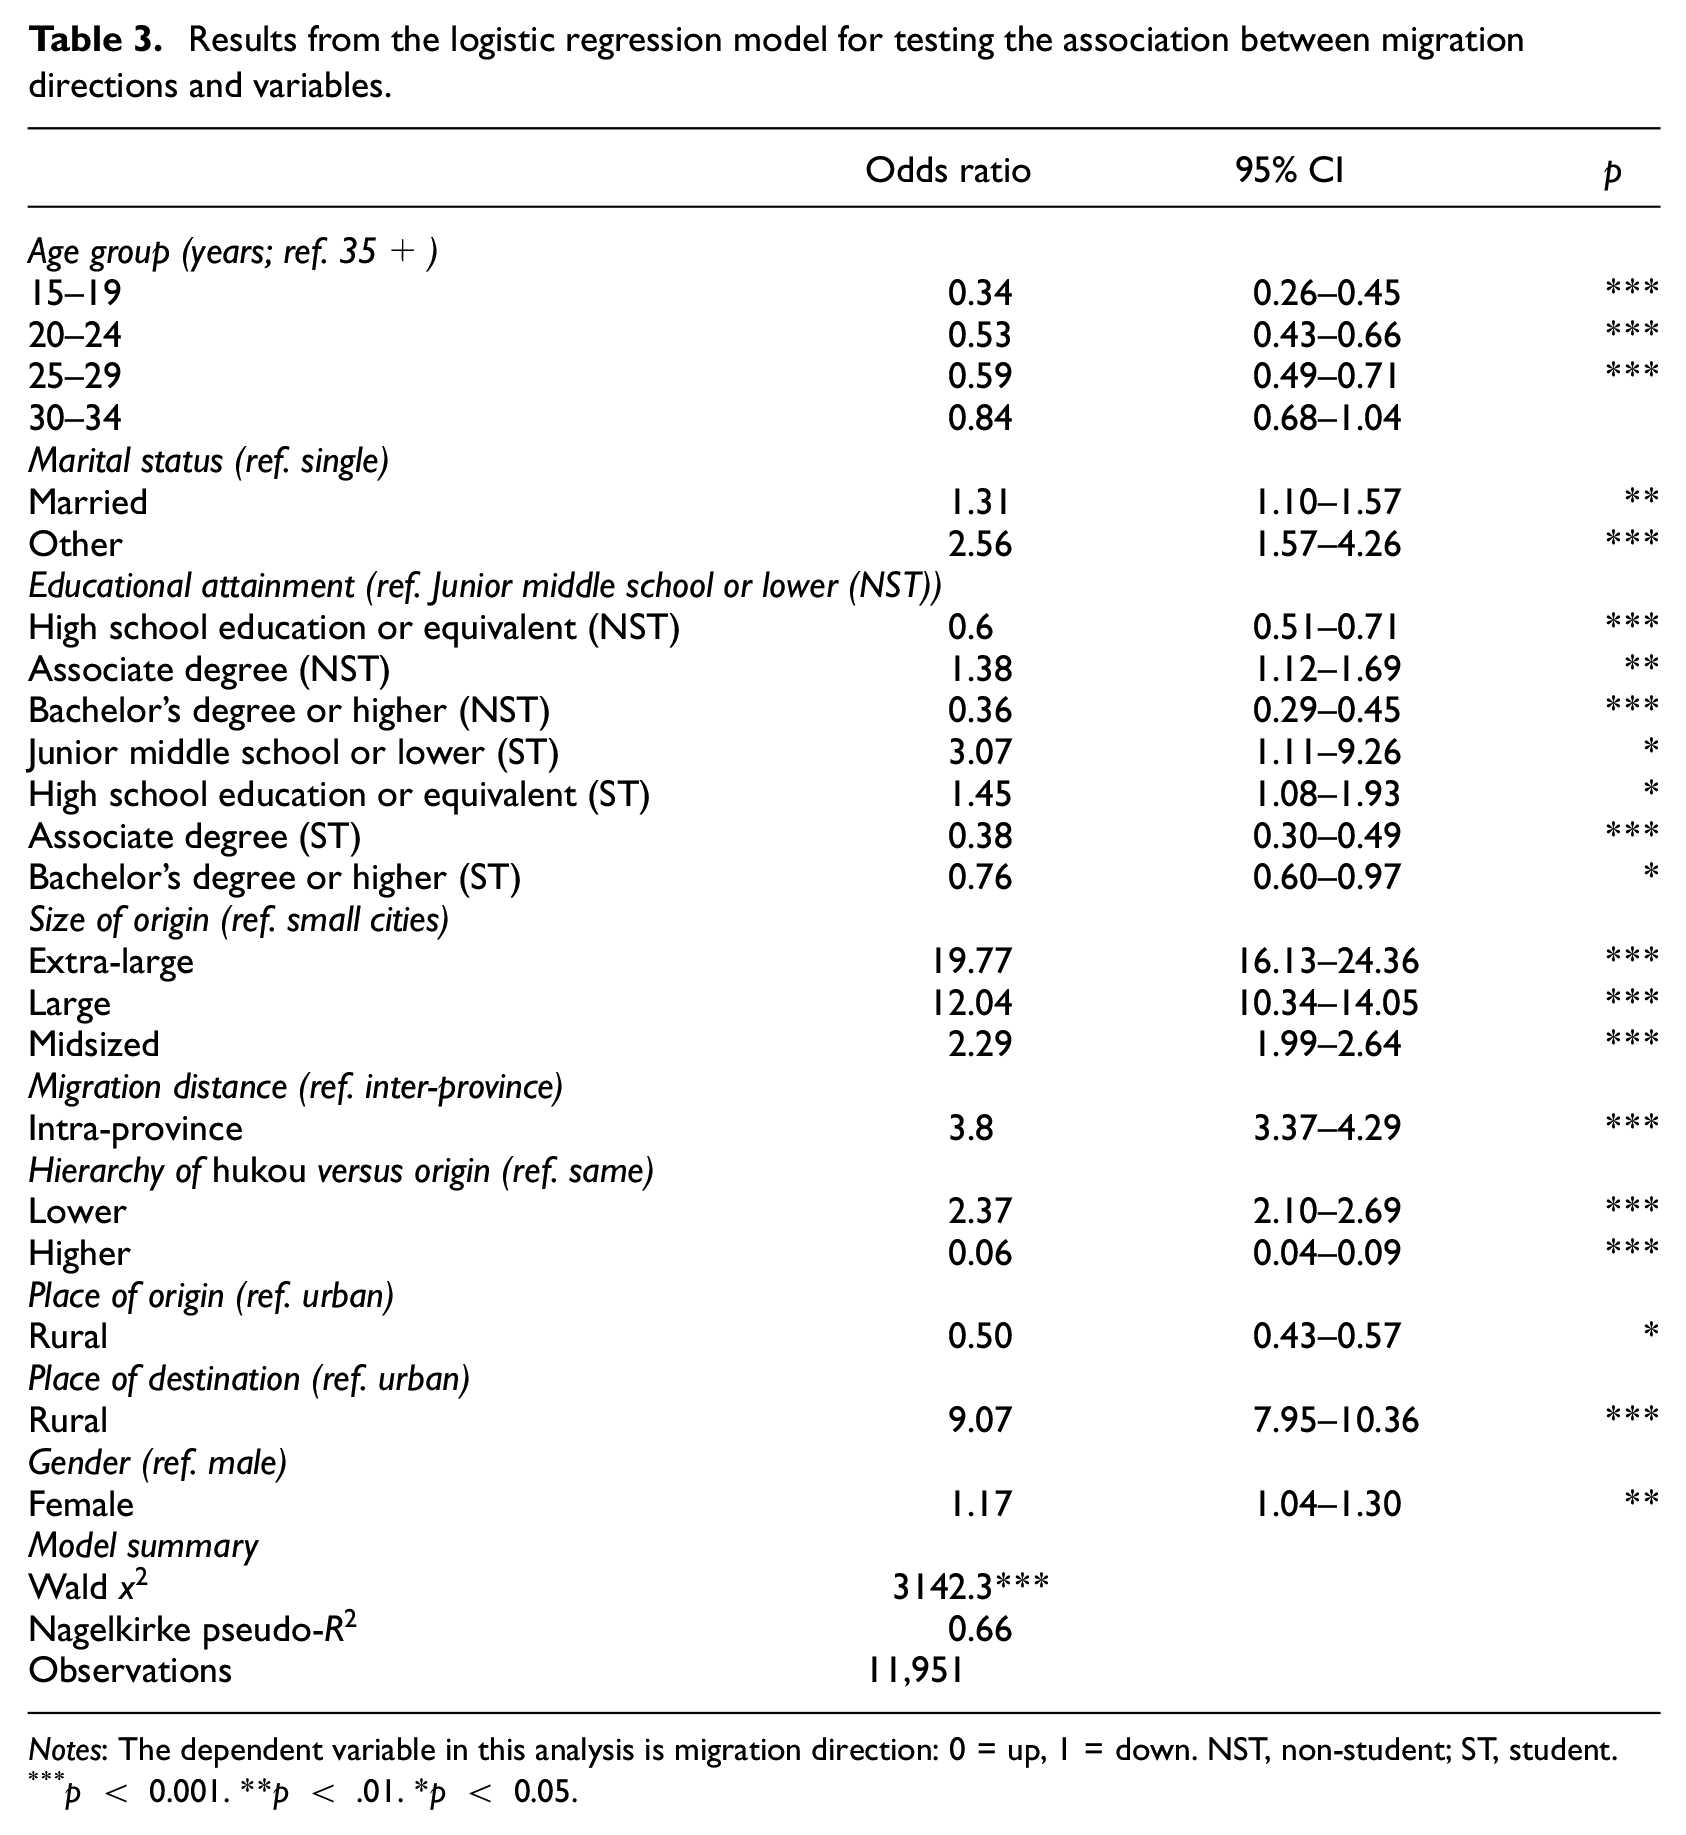
Notes: The dependent variable in this analysis is migration direction: 0 = up, 1 = down. NST, non-student; ST, student.
p < 0.001. **p < .01. *p < 0.05.
First, age group and life course play expected roles, for example, young people aged 15–29 years are significantly less likely to move downward compared with people aged 35 or older; people in married and other (divorced and widowed) groups also have a significantly higher likelihood to move downward compared with people in the single group. Second, compared with the less-educated group, people who received a bachelor’s degree or higher have a lower likelihood to move downward (0.36, 95% CI [0.29, 0.45], p < 0.001). We also note that students in high school, junior middle school or lower have a significantly higher likelihood to move downward. These students may have stayed in the cities where their parents work. However, because of restricted access to education resources, particularly to the entrance examination to high school or university, they have to go back to their household registered place (a lower-level city or county) to receive education. Third, migrants in the high-level cities are more likely to move down the urban hierarchy. Compared with migrants in small cities, migrants in extra-large, large and midsized cities have a higher likelihood (19.22, 12.04 and 2.29, respectively, p < 0.001) to move downward. Fourth, compared with inter-provincial migrants, intra-provincial migrants have significantly a higher likelihood (3.80, 95% CI [3.37, 4.29], p < 0.001) to move downward. This result is consistent with our findings shown in Figure 2. Fifth, people’s migration directions are associated closely with the hierarchy of people’s hukou. Compared with people who hold hukou of the same hierarchy as the origin, people who hold lower-level hukou are considerably more likely (2.37, 95% CI [2.10, 2.69], p < 0.001) to move downward and those who hold or potentially hold higher-level hukou have a lower likelihood (0.06, 95% CI [0.04, 0.09], p < 0.001) to move downward. Sixth, people in rural areas have lower odds (0.50, 95% CI [0.43, 0.57], p < 0.05) to move downward compared with those in urban areas. Meanwhile, people who move to rural areas have significantly higher odds (9.07, 95% CI [7.95, 10.36], p < 0.001) to move downward compared with those who aim at urban areas. The former result may be because people in urban areas face more challenges to settle down. Thus, they are more likely to move downward. The latter may be because many migrants come from rural areas of low-level cities or counties. Therefore, return migration is most likely in a downward direction.
Evolution of the population pyramid
Among all factors, age structure may play a key role in the shifting migration patterns. China’s younger generations exhibit a sharp drop in population size under the ‘one-child policy’ that began in the 1980s. Although the policy was formally phased out in 2015, the low fertility rate may continue. Numbers of people aged 15–19 and 20–24 years who contribute mainly to the upward migration pattern decreased by 52 million or 23% in 2015 from 2010. China’s population has been ageing rapidly in recent decades. The median age increased from 25 years in 1990 to 35 years in 2010, and to 37 years in 2015. It will further increase to 40 years by 2025, 45 years by 2035 and finally close to 50 years and will remain at around 50 years according to the medium variant forecast of the United Nations (2019). This ageing trend will bring a more significant downward impact on the current migration pattern. We utilise the age of 35 years as a cut-off because people younger than 35 years are the primary source of upward flows and after 35 years migration rates begin to decline precipitously. The share of the population aged 15–34 years, the major force of upward flows, decreased from 38.4% in 1990 to 31.9% in 2010, and further decreased to 29.5% in 2015. A weakening upward momentum and a strengthening downward trend may have changed the overall migration pattern.
Downward and return migration driven by hukou
Hukou may be another factor contributing to the shifting migration structure. The features of hukou migrants reflect the criteria of cities in granting hukou: as the city size increases, hukou migrants become younger and the length of their education becomes longer. The average ages of hukou migrants are 22.3, 25.8, 28.9, 31.2, 31.5 and 31.5 years in super-large, extra-large, large, midsized, small cities and counties; and their average education lengths are 14.5, 13.2, 12.3, 10.9, 10.3 and 9.7 years, respectively. These numbers indicate that most successful hukou migrants in super-large cities such as Beijing and Shanghai are university students or new graduates. Students who enrolled in bachelor’s degree programmes or above acquire hukou more easily than others. However, students still need to find jobs in the city after graduation and relocate their hukou from the collective address of the university to their workplace or home address to ensure the validity of hukou. Even well-educated groups face difficulties in obtaining hukou permanently, not to mention the less-educated groups. Hukou’s importance becomes more apparent in the later stages of life because access to social welfare or services such as housing, healthcare and education resources become essential if one starts a family. China has been encouraging the development of midsized and small cities while restricting the excessive population growth in large or higher-level cities. Strict hukou policies hinder migrants’ access to hukou-combined welfare and affect migrants’ willingness to reside permanently. Approximately 8%, 6%, 5%, 19%, 31% and 52% of the 1-year migrants in super-large cities, extra-large cities, large cities, midsized cities, small cities, and counties, respectively, were hukou migrants. The differences between registration rates of hukou reflect the effect of the population management policy. As the small percentage of hukou migrants in large and higher-level cities demonstrates the difficulty in relocating hukou, a relatively high rate of hukou migrants in small cities and counties may indicate the possibility of return migrants. For those without the qualifications desired by cities with strict hukou policies, moving down the urban hierarchy and finding a city in which to settle becomes a choice. Returning to the place of hukou is another choice.
Conclusion and discussion
This study explored the migration patterns of non-hukou migrants, 5-year migrants and 1-year migrants in the urban system of China. The results revealed a possible new trend in the internal migration structure of the urban system. The current population distribution among Chinese cities is the cumulative result of multiple migrations of millions of migrants over the years. The recent trend shows that net migration through the urban hierarchy has been deviating from previous years, shifting from a predominantly upward pattern to a new emerging downward direction (e.g. from super-large/extra-large cities to large cities). Regional inequality has brought significant differences between various migration categories. People from less-developed regions are still moving up the urban hierarchy across long distances, whereas those from the prosperous eastern coast region are moving down to surrounding cities or counties. We considered that the causes for the structural change could consist of common features found in developed countries, such as the influence of life course and specific factors that reflect the unique circumstances of China, including the evolving age pyramid and hukou system. People who can register in a high-level city will have a more significant probability to move upward. For many non-hukou migrants, restrictive hukou policies may result in downward movements or the return to their hukou place.
According to the 2015 OPPSS, about 42% of the urban population in China is concentrated in cities of 1 million people or more. Compared with that of the rest of the world, China’s population distribution is not as concentrated in large metro areas (Henderson, 2010). Current experience suggests that China’s continuing urbanisation will bring more upward flows to large or high-level cities. However, a new emerging reversal deviating from an upward pattern through the urban hierarchy to a downward direction has been observed in the current stage. Moreover, according to Zelinsky’s (1971) hypothesis of the mobility transition, when there is a slight rate of natural increase or none at all, urban to urban migration will become vigorous. However, during 2014–2015, over half of the migration (54%) up and down the urban hierarchy still took place between urban and rural areas in China. Only 40% happened between urban areas. The demographic change and the unique return mechanism caused by the population management system may have contributed to the uniqueness of migration in China’s urban system. These findings are crucial for building a theoretical and substantive understanding of migration in different contexts. Although this possible new trend is only observed for one year (2014–2015), the possibility that the overall downward migration trend will continue into the future is highly likely. It is necessary to continue to monitor this new emerging urban transition with future census data and studies. The discoveries likewise suggest the urgent need for policy designers to prepare for the new transition. The labour force in many large or higher-level cities heavily depends on in-migrants. These cities will face severe and accelerating ageing problems as the urban transition continues. Cities should facilitate the settlement process and ensure the benefits for migrants, particularly those who have been working in the city for decades. The migrant-origin area may receive more returners in the future. The medical, educational and housing demands of these returners should be considered ahead of time. Local authorities should also create opportunities to meet the re-employment requirements of returners and their occupational transition.
Footnotes
Declaration of conflicting interests
The author(s) declared no potential conflicts of interest with respect to the research, authorship, and/or publication of this article.
Funding
This study is supported by the Chan To-Haan Endowed Professorship Fund of the University of Hong Kong, General Research Fund of the Hong Kong Research Grants Council (17603617, 17614320), Special Scientific Research Fund of Public Welfare Profession of China (201411015) and the National Science Foundation of China (41971408, 41701182 and 41371534).
