
Abstract
The urgent need for housing in London will be met almost exclusively through building on brownfield sites. While Inner and suburban Outer London are both home to a range of brownfield sites, the politics of delivering new housing varies between the two. First, Outer London is built at significantly lower density and therefore densification has a more noticeable impact. Second, many residents in Outer London value living at lower density and will see densification as undermining that which they value. Third, homeownership is more common in Outer London and as housing is the most significant asset for most homeowners any threat to its value is likely to be strongly resisted. Our research tests whether design can positively impact both the perception and acceptability of densification. For this, we run a randomised control trial presenting 939 Outer London residents with simulated images representing different design features. We find that the effects of building design are limited and relate almost exclusively to low and medium density options. Our research shows that vernacular design can make some increase in density acceptable but for significantly higher density the influence of design declines. As density increases, the perception and acceptability of density are more influenced by people’s views on, for example, the extent of London’s housing crisis. This indicates that planners and politicians must reach beyond design and seek to better inform and persuade residents about housing need if the impasse on densification is to be overcome.
Introduction
Like many cities internationally, London has a highly stressed housing market, with strong demand pressures for new housing (Gallent et al., 2018; Wetzstein, 2017) coupled with a long-term deficit in delivering new housing. The result has been intense upward pressure on prices, leading to a crisis of affordability (Antoniucci and Marella, 2018; Gallent et al., 2017). New housing will overwhelmingly be delivered on previously used (brownfield) land, primarily on ex-industrial land. Substantial brownfield opportunities also exist in suburban Outer London, where industrial sites were developed along with housing between the First and Second World Wars (Hebbert, 1998: 147). The extent of these sites is significant, reflected in land use figures: in 2005, across Inner London, non-domestic land uses accounted for 11.7 per cent of building land coverage while in Outer London the proportion was 26 per cent (London Datastore, 2020). 1 This helps to explain why an extensive academic study of Outer London concluded that it comprised a flexible and adaptable physical form (Vaughan et al., 2009).
But while Outer London is home to extensive brownfield sites, planners and local politicians may encounter greater resistance to developing there. Homeownership remains more prevalent in London’s suburbs; in 2018 only 40 per cent of households in Inner London were owner occupiers or owned outright, compared to 62 per cent in Outer London. Homeownership is generally the most significant asset for households and therefore is associated with a strong defence of its value (Van Gent, 2010), making homeowning residents, ‘highly vigilant of land-use changes’ (Whittemore and BenDor, 2019: 1360). Furthermore, residents have expressed a preference for suburban living, trading off centrality for a basket of ‘benefits’ linked to lower density, more and larger parks, less pressure on public goods including road space and so on (Mace, 2013). Densification threatens to undermine that which they value.
Differences in preference for city or suburban living, including related differences in tenure, have been linked to voting behaviour (Walks, 2005), with political parties having long seen the suburbs as representing a distinct and decisive battleground (Clapson, 2003). This held true in the 2008 London mayoral race, which Boris Johnson won by successfully depicting the incumbent, Ken Livingstone, as anti-suburbs (including for having foisted higher housing targets on the suburbs). In partial fulfilment of his promise to be a more suburban-friendly mayor, Johnson established an Outer London Commission. However, this did not provide a solution to the tension between the mayor’s strategic function and his promise to give more control back to the suburbs (Holman and Thornley, 2015). The challenge remains of delivering strategic priorities (not least a step change in housing delivery), in the face of local resistance.
A step change in housing delivery will be realised through higher density – oftentimes much higher density in London, as a suite of policies constrains land supply. This includes the decision to meet the city’s housing need within its own borders, which has remained steadfast since the election of the first London Mayor in 2000. The city’s own land supply is constrained by an almost exclusive focus on brownfield sites, required to maintain existing policies such as the greenbelt which applies to 22 per cent of London’s landmass. But development on brownfield sites can be limited in density and/or height by other policy constraints such as conservation areas and protected views, both of which particularly impact Inner London. Therefore, those brownfield sites that are available and relatively free of policy constraints will attract high prices on the open market, reflecting their scarcity. Outbidding the competition reflects a developer’s view that, on these sites, they can achieve sufficient density to make a development viable (Bowie, 2010; Dong and Hansz, 2019). This is evidenced through development densities under the post-2000 London Plan regime, where the Plan’s recommended density ranges have been routinely exceeded, sometimes manyfold (Gordon et al., 2016).
Where this happens in Outer London, the low density of the existing suburb makes sharp increases in density even more evident and, in turn, may potentially make communities view them as more threatening (Sivam et al., 2012). The threat of ‘citification’ jeopardises the lower density single-family home aesthetic, which is one of the attractors to the suburbs. In addition to challenging the suburban aesthetic, high density development is also tarnished by a longer story of quality relating to the poor design of new housing in England. Different governments have established a variety of advisory bodies to seek to achieve better quality design. The Commission for Architecture and the Built Environment (CABE, 2004: 4) has produced a large body of work including assessments of design quality, one of which reported that over a fifth of schemes were of poor quality.
CABE was abolished in 2011 as part of the Conservative coalition government’s post-2008 austerity measures. However, in 2018 a later Conservative government announced the establishment of the Building Better, Building Beautiful Commission. Unlike CABE, this was set up as a time-limited body and was headed by a leading right-wing philosopher (Roger Scruton), rather than by members of the architect/design profession. It was therefore informed by a different philosophical perspective. However, of significance to our work, both highlight the importance of respecting the vernacular in contemporary development.
In this context, our research tests how design and attitudes can shape residents’ views on density. Design is relevant as it is often portraited as a primary way that planners can impact the perception and production of the built environment (Carmona, 2009; Churchman, 1999, cited in Mousavinia et al., 2019; Imrie and Street, 2009). Tying back to the design advice of CABE and the Commission, we asked whether the echoing of the vernacular suburban form through the design of higher density buildings and streetscapes would make new development be perceived to be less dense, altering people’s emotional response and therefore making density more acceptable (Rapoport, 1975). However, design is only one element affecting human perception within a complex intersection of rational resource concerns, economic interests and more subjective elements including belonging (Degen and Rose, 2012; see also Whittemore and BenDor, 2019 for a fuller discussion in a North American context). Therefore, we also look at the effects of residents’ attitudes on several issues, including the extent of the housing crisis, to test how this impacts their perception of density and/or its acceptability.
Method
We conducted an online randomised control trial (RCT) with 939 Outer London residents during March and April 2020. Participants were recruited via local associations networks, their newsletters and through social media. During late 2019, initial contact was made with 304 local association groups, covering residents’, civic, housing, minority and religious associations; 57 agreed to share their network. The online survey method proved to be prescient as by the time it went live a COVID-19 lockdown had been imposed in England. Descriptive statistics of participants are shown in Table 1. As can be seen, the sample has a relatively higher share of people who are UK born, female, older, white and owner occupiers compared to Outer London in general (Greater London Authority [GLA], 2016, 2019; Ministry of Housing, Communities and Local Government [MHCLG], 2018; Office for National Statistics [ONS], 2020). Therefore, as with any RCT, while the results of this study have strong internal validity, results should be interpreted carefully when extrapolating them to the larger population of outer London residents.
Characteristics of participants.
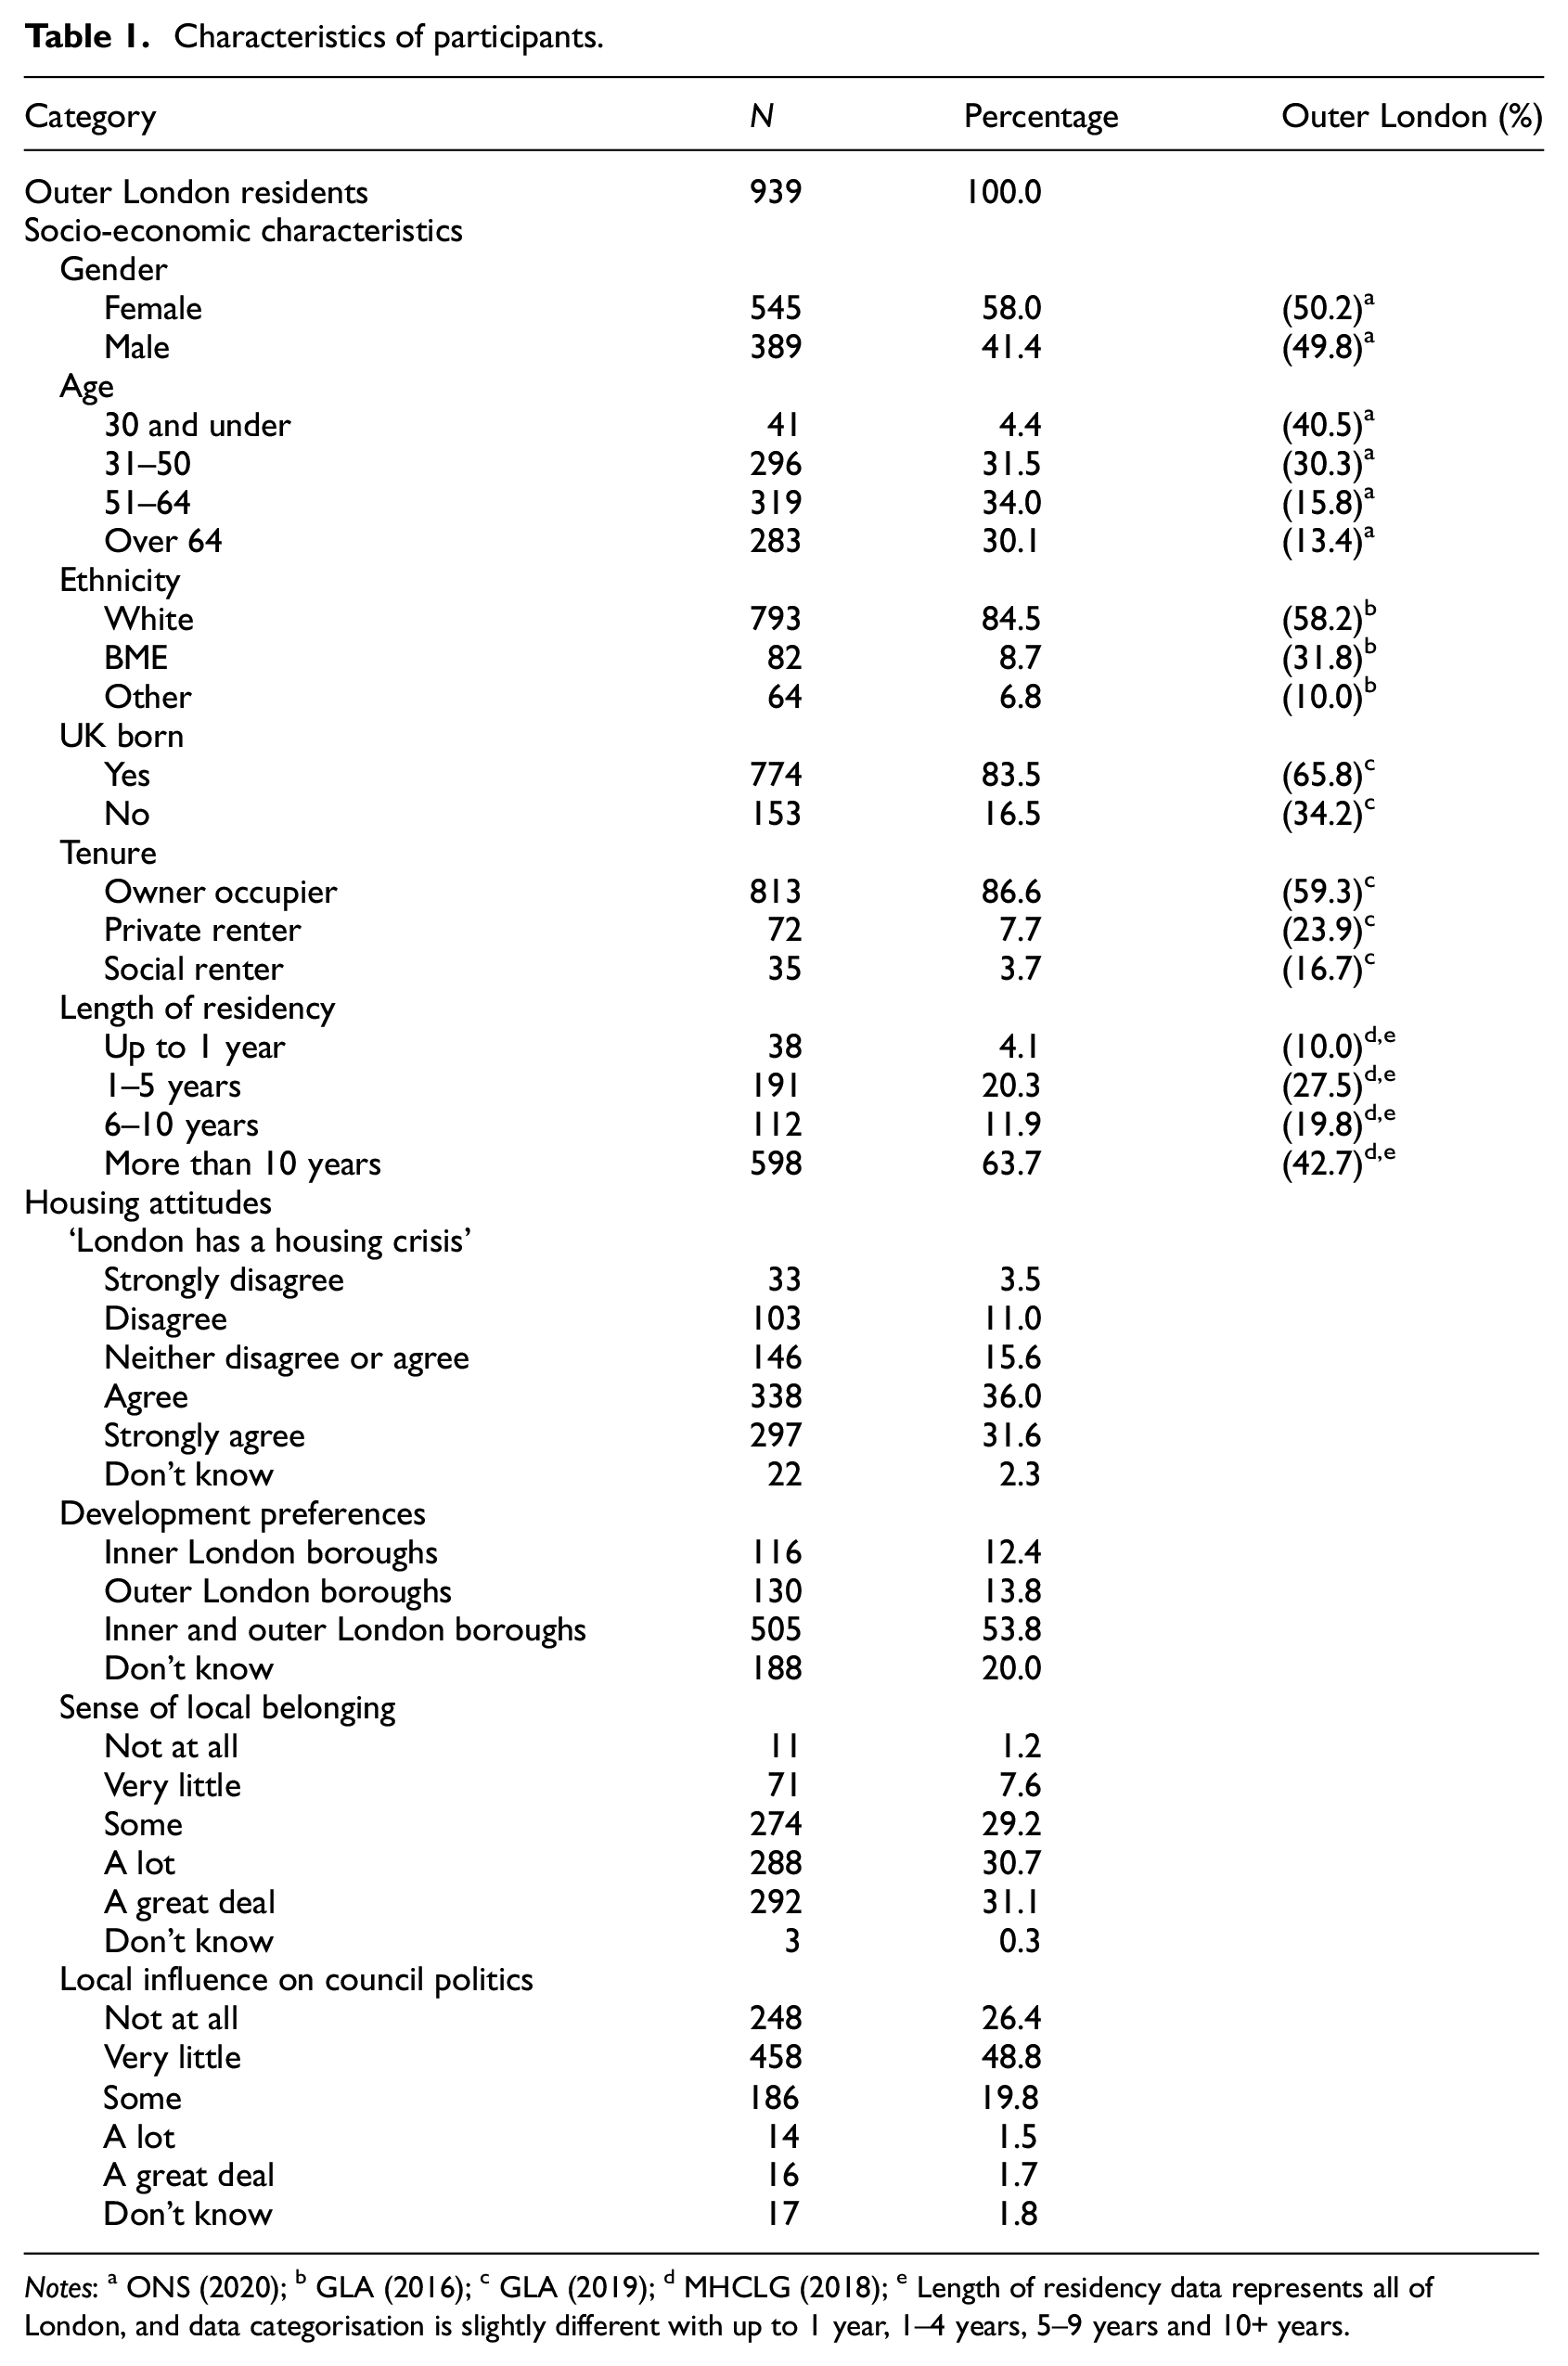
Notes: a ONS (2020); b GLA (2016); c GLA (2019); d MHCLG (2018); e Length of residency data represents all of London, and data categorisation is slightly different with up to 1 year, 1–4 years, 5–9 years and 10+ years.
The survey employed the online platform www.urban-experiment.com. The platform utilises photo simulation to gather data on respondents’ perceptions of a series of digitally altered pictures with varying degrees of intervention. We chose this method as visual simulations are a useful tool when measuring public attitudes on different development scenarios (Jorgensen et al., 2002; Kuo et al., 1998; Navarrete-Hernandez et al., 2021; Rodiek and Fried, 2005). Several studies have found that participants respond to, and rate, photographs similarly to real places, making photo simulation a low-cost and preferable alternative for accurately measuring residents’ perceptions and attitudes (see Kaplan and Kaplan, 1989; Rossetti and Hurtubia, 2020; Zube et al., 1987).
In the first section, in addition to demographic data, respondents were asked about their attitudes to housing development in London, their sense of belonging and perceptions on local government efficiency. In the second section, participants were asked to rate a series of 24 randomly assigned pictures either according to the perceived density, ranging from very low to very high, or to rate how acceptable they found the presented development’s density level, from completely unacceptable to fully acceptable, on 10-point scales. Respondents were asked to imagine that the developments shown in the picture series were to be built within a 10-minute walking distance of their homes, to capture sentiments towards local development.
We created 24 sets of control and treatment pictures. Each set consisted of one control picture of a current London housing development and two or three treatment images of the same development with varying degrees of design intervention (see Figure 1 for examples). The images were divided into two overarching typologies, together covering eight intervention categories. Setback, public greenery, private greenery and parking belonged to landscaping, whereas fenestration, facade articulation, roofing and facade material were part of the building design typology. These categories were selected as they cover major aspects of housing development and were assumed to be the most influential design attributes for neighbouring residents.
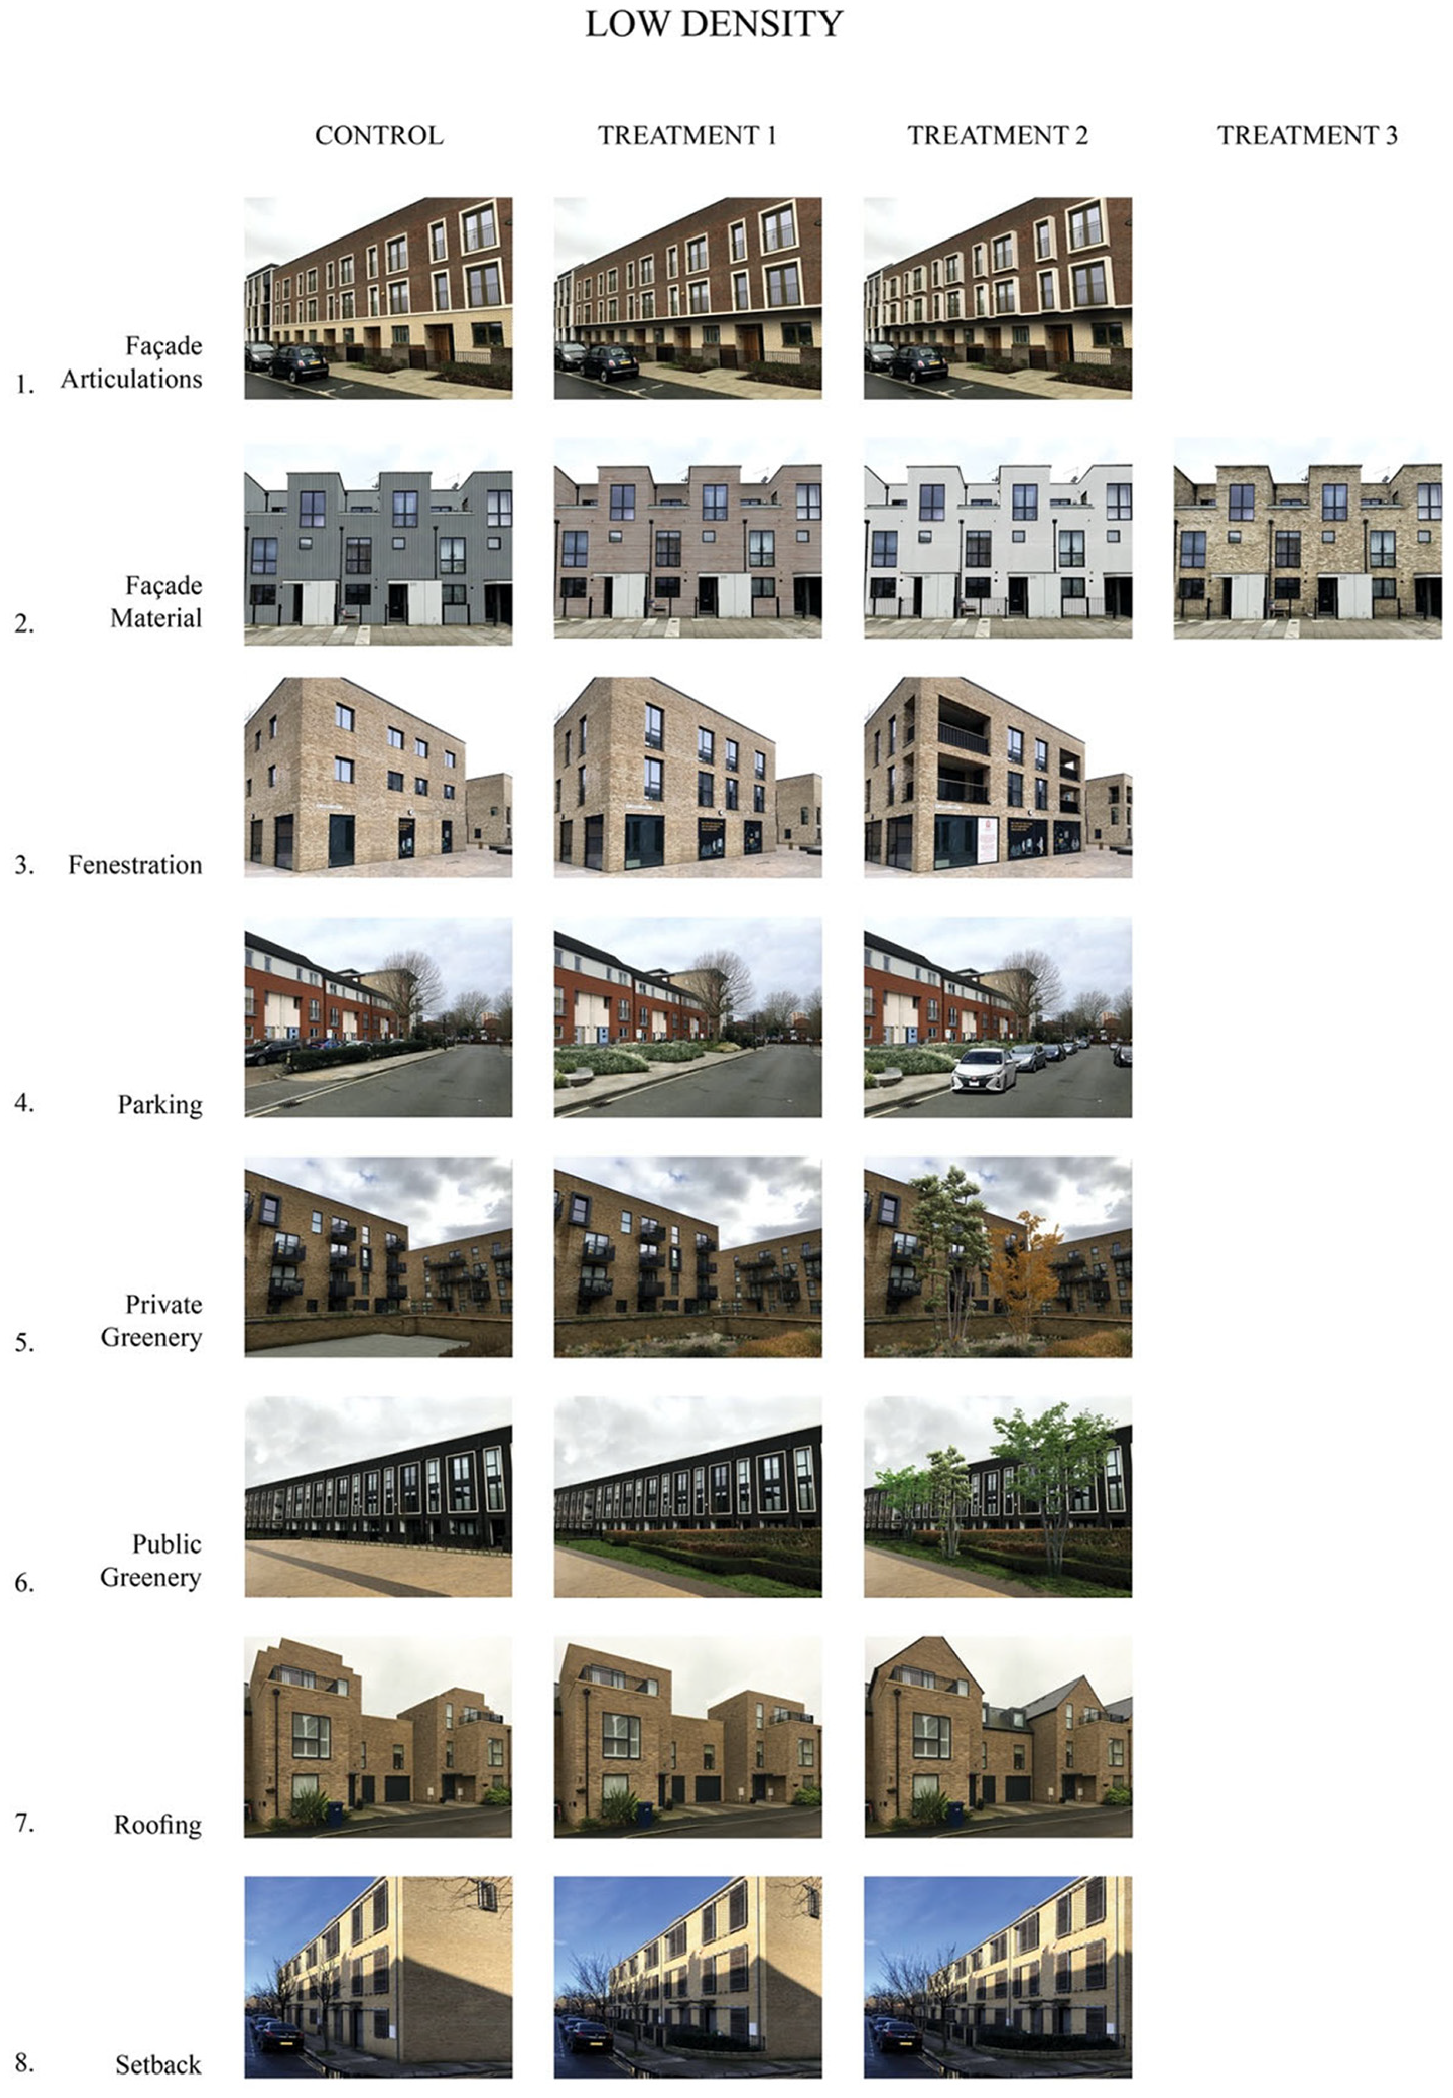
Example of photographic simulations of building design interventions.
We assumed that the proportion of a site covered by any given use other than buildings, open land, streets and so on would remain constant. Therefore, increasing density would require increasing the heights of buildings rather than greater coverage of the site by the building. Each intervention category covered three densities reflected by height levels: low density (around three storeys), medium density (around six storeys) and high density (around nine storeys). We assume that three storeys produce a floor area ratio (FAR) of 1:1, where one third of the site is built on at three storeys and two-thirds of the site is given to highways, gardens, etc. Therefore, with the same one third to two-thirds split, six storeys gives a FAR of 2:1, doubling the density, and nine storeys gives a FAR of 3:1, tripling the density. These configurations produce heights that reflect the prevailing new housing development range in Outer London and would therefore be familiar to our respondents. It is important to note that our low density option nevertheless represents approximately a doubling of the density at which housing in Outer London was originally developed.
As our preference was to show participants images as viewed from street level, we could not show a whole site. Rather, participants were presented with our design interventions applied to a series of buildings of different heights. While building height alone does not correlate with density, it can offer a useful proxy for density for respondents (Rapoport, 1975). Treatments for each image set (for an example, see Figure 1) were applied in such a way that except for the treatment, all other important features were held constant (such as weather, light or passers-by). While many of the intervention categories showed treatments on a scale of intensity (none, low, medium), such as levels of fenestration and setback, others simply featured design alternatives, like facade material (e.g. brick, steel, clay or wood).
Images were allocated to each respondent according to a double randomisation process to ensure that all covariates were balanced between participants and treatments (Navarrete-Hernandez and Laffan, 2019). First, the image order was randomised to control for potential fatigue and spillover effects for the respondents rating several images. Second, as customary in an RCT setting, the online platform randomly assigned the participant one image from every picture set. Together, this resulted in a unique combination of viewing order and control-treatment images for respondents. To test that randomisation was successful, we carried out balance tests before the analysis. From a total 1590 tests conducted, 49 were significant at the 5% level. This indicates that the randomisation was successful in equalling out group characteristics across each treatment and control image (the results and readouts of the balance tests are available upon request).
Data
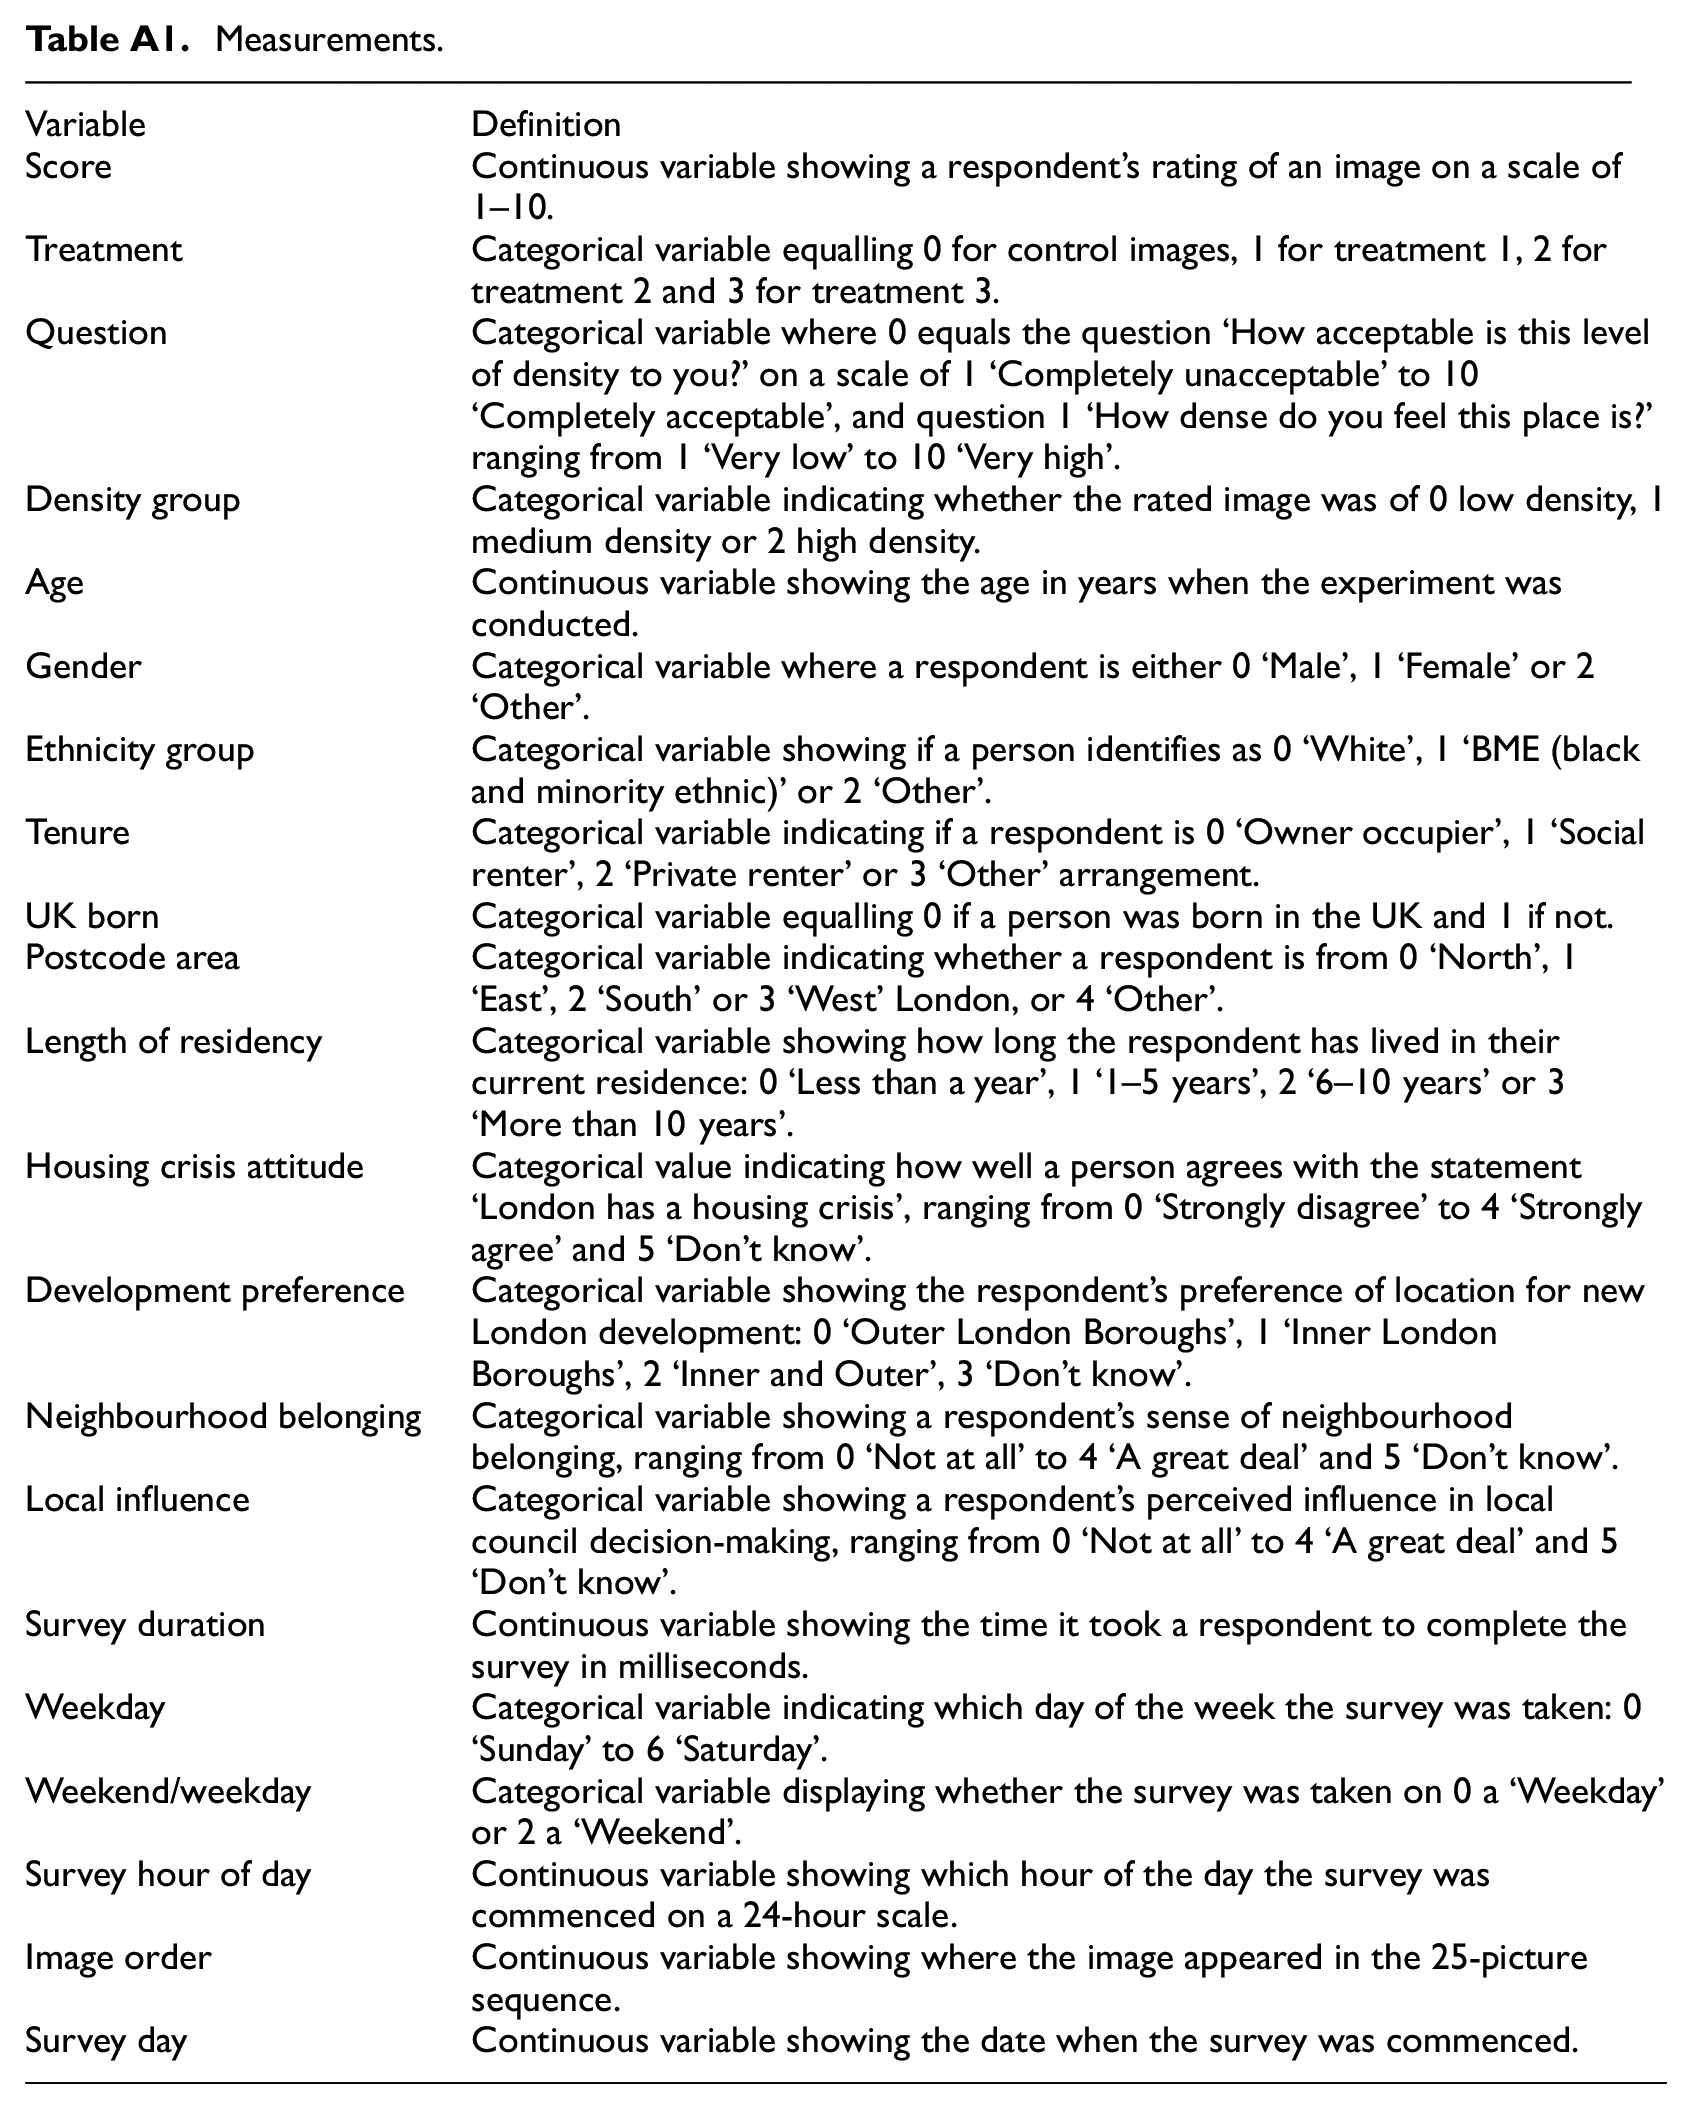
Through the online survey, we gathered four sources of data to enable our analysis. A detailed description of this data, along with the measurements used, can be found in Table A1 in the Appendix. The first source contains participants’ demographics (age, ethnicity, gender, residential location, country of birth, tenure and length of time lived in the neighbourhood). Second, we collected information on respondents’ attitudes on whether they agree that London is experiencing a housing crisis, their subjective sense of belonging in their local neighbourhood, how much they feel they can affect decisions made by their local council and where in London they think new development should occur. The third source contains data on the experimental conditions of the survey and covers image order, treatment status, time taken to complete the survey and date, day of the week and time of the response. Last, the fourth data source consists of participants’ stated perceptions of acceptability and perceived density of each development shown in each presented photo simulation.
Regression analysis
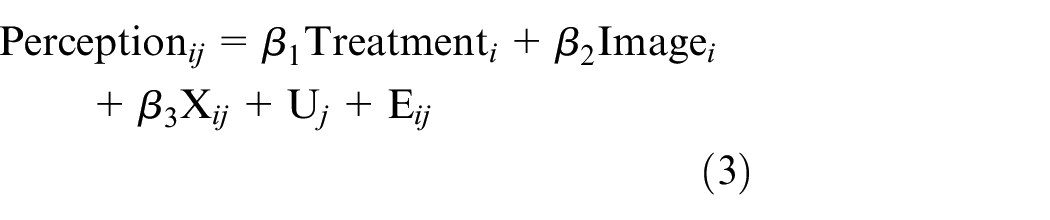
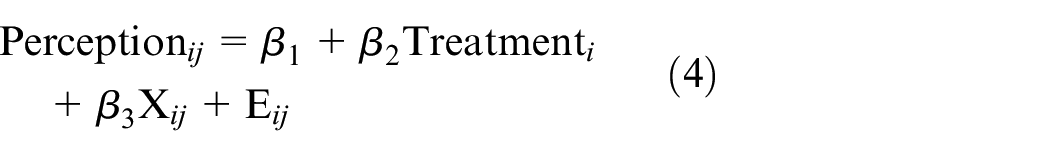
We estimated two different regression models. The first is a mixed-effect model with fixed effects at the image level and random intercept at the individual level (equation (1)). We use random effects at the individual level to account for the fact that each participant rated 24 images, thus image scores are not independent from each other. Additionally, we add image fixed effects to control for any image-specific attributes. The second model is a linear regression model with neither the image-level fixed effect nor individual-level random intercepts (equation (2)). The regression models take the following forms:


The dependent variable Perception ij gives the perception rating for the ith image by the jth individual on a scale of 1–10. Treatment, the independent variable of interest, is a categorical variable and the magnitude of its average effect on people’s perceptions of density and acceptability in the ith image is indicated by the coefficient β1 in equation (1) and β2 in equation (2). For equation (1), β2 shows the image fixed effect for picture i, Uj the random intercept associated with individual j and Eij is the error term. In equation (2), β1 represents the intercept. Significance levels of 10%, 5% and 1% are reported across all regressions.
To understand better how density and treatments related to acceptability and perceived density on a general level, we ran equations (1) and (2) on three different density levels (low, middle and high). Additionally, each model was applied separately for both questions asked in the survey. In the first instance, we focused on the effect of increased density. This was achieved by using equation (1) and only utilising the control images for each density level. While this gave us an indication of how actual density relates to perceived density and acceptability, the nature and composition of developments vary significantly across density levels meaning we were only able to draw suggestive connections. The second way that equation (1) was applied was by pooling all treatments and studying their effect compared to the control for each density level. This was to uncover the overall possibility that treatments have to alter density perception and acceptability. As these models were applied to each density level individually, a clearer direction of the causality emerged. Finally, equation (2) was applied to each image group to study the effect a specific treatment has at a particular density level.
In the final stage of the analysis, equation (2) was used to test how attitudes on housing development impact density acceptability and perception. Treatments were substituted with each variable in these data sources. Each specification was applied for each density level and question. We provide a pairwise comparison test to identify significantly different participants’ demographics or attitudes categories. For this, we performed an analysis of variance testing for equality of means reporting p-values with Bonferroni corrections, as a conservative approach to mitigate against type I errors.
Robustness checks
To test the robustness of our results, we re-ran previous regressions and controlled for the following variables: age group, ethnicity group, gender, location, whether the individual was born in the UK, tenure, length of time lived in the neighbourhood, development preferences, attitude towards London’s housing crisis, local influence in council politics and sense of local belonging, along with the order of appearance of the images and the time, date and day of the week that the survey was taken. This gives the following model for equation (1):
And the following model for equation (2):
In both, Xij represents all the variables previously mentioned and β3 their corresponding coefficients. The results of these regressions are presented in the section below.
Results
Relationship between perceptions of density and acceptability
In this section, we conduct a preliminary analysis to test if the different densities presented (reflected in differing building heights) impact on Outer London residents’ perceptions of density and in turn, the acceptability of a new housing development. Figure 2a shows that as we increase building height, perceptions of density change significantly, providing evidence of its use as a good proxy for building density (see further detail in Table A2.A in the Supplemental Material). Figure 2b shows a strong correlation between perception and acceptability for the three given densities. As can be seen, the acceptability of density decreases as the perception of density increases (see also Table A2.B in the Supplemental Material). Moreover, ratings for images containing low, middle and high density tend to cluster together, with images of low density developments being perceived as lower density and more acceptable and high density developments being perceived as higher density and less acceptable.

Relationship between building height, perceptions of density and acceptability. (a) Perception of density by building height. (b) Perception of density versus acceptability.
Changing perceptions of density and acceptability by building design
Following the notion that vernacular design might make density more palatable to residents, we showed our respondents various photos of our three densities with altered design features (our treatments) to gauge how design (especially suburban features) impacted on perceived density and its acceptability. As explained above, we focused on design treatments that are integral to the building (e.g. fenestration and roof lines) as well as on design treatments relating to the public and private realm (e.g. green space and car parking arrangements). In this section, we present findings which show that while design can influence the perception and acceptability of density, the effect is only marginal. Moreover, the impacts of treatments relate almost exclusively to low and medium density options. Virtually no treatments were statistically significant for transforming the negative perceptions of higher density options.
Low density housing developments
We first consider the impact of different design features on perceptions of and the acceptability of density for low density developments (Figure 3a). Design treatments had the most impact on our low density options in terms of both perception and acceptability (see Table A3.A in the Supplemental Material). Buildings finished in brick (acceptability = 0.757) or wood (acceptability = 0.757), rather than with steel facades, made low density developments more acceptable. The preference for brick facades reflects the existing UK housing stock, which contrasts to much of Europe. 2 High levels of fenestration (acceptability = 0.788; perception = −0.444) and large public green space (acceptability = 0.763; perception = −0.530) also increased acceptability and decreased perceptions of density. Finally, a pitched roof (acceptability = 0.714) and no parking space (acceptability = 0.763) increased the acceptability of low density development, but did not modify residents’ perceptions of the density.
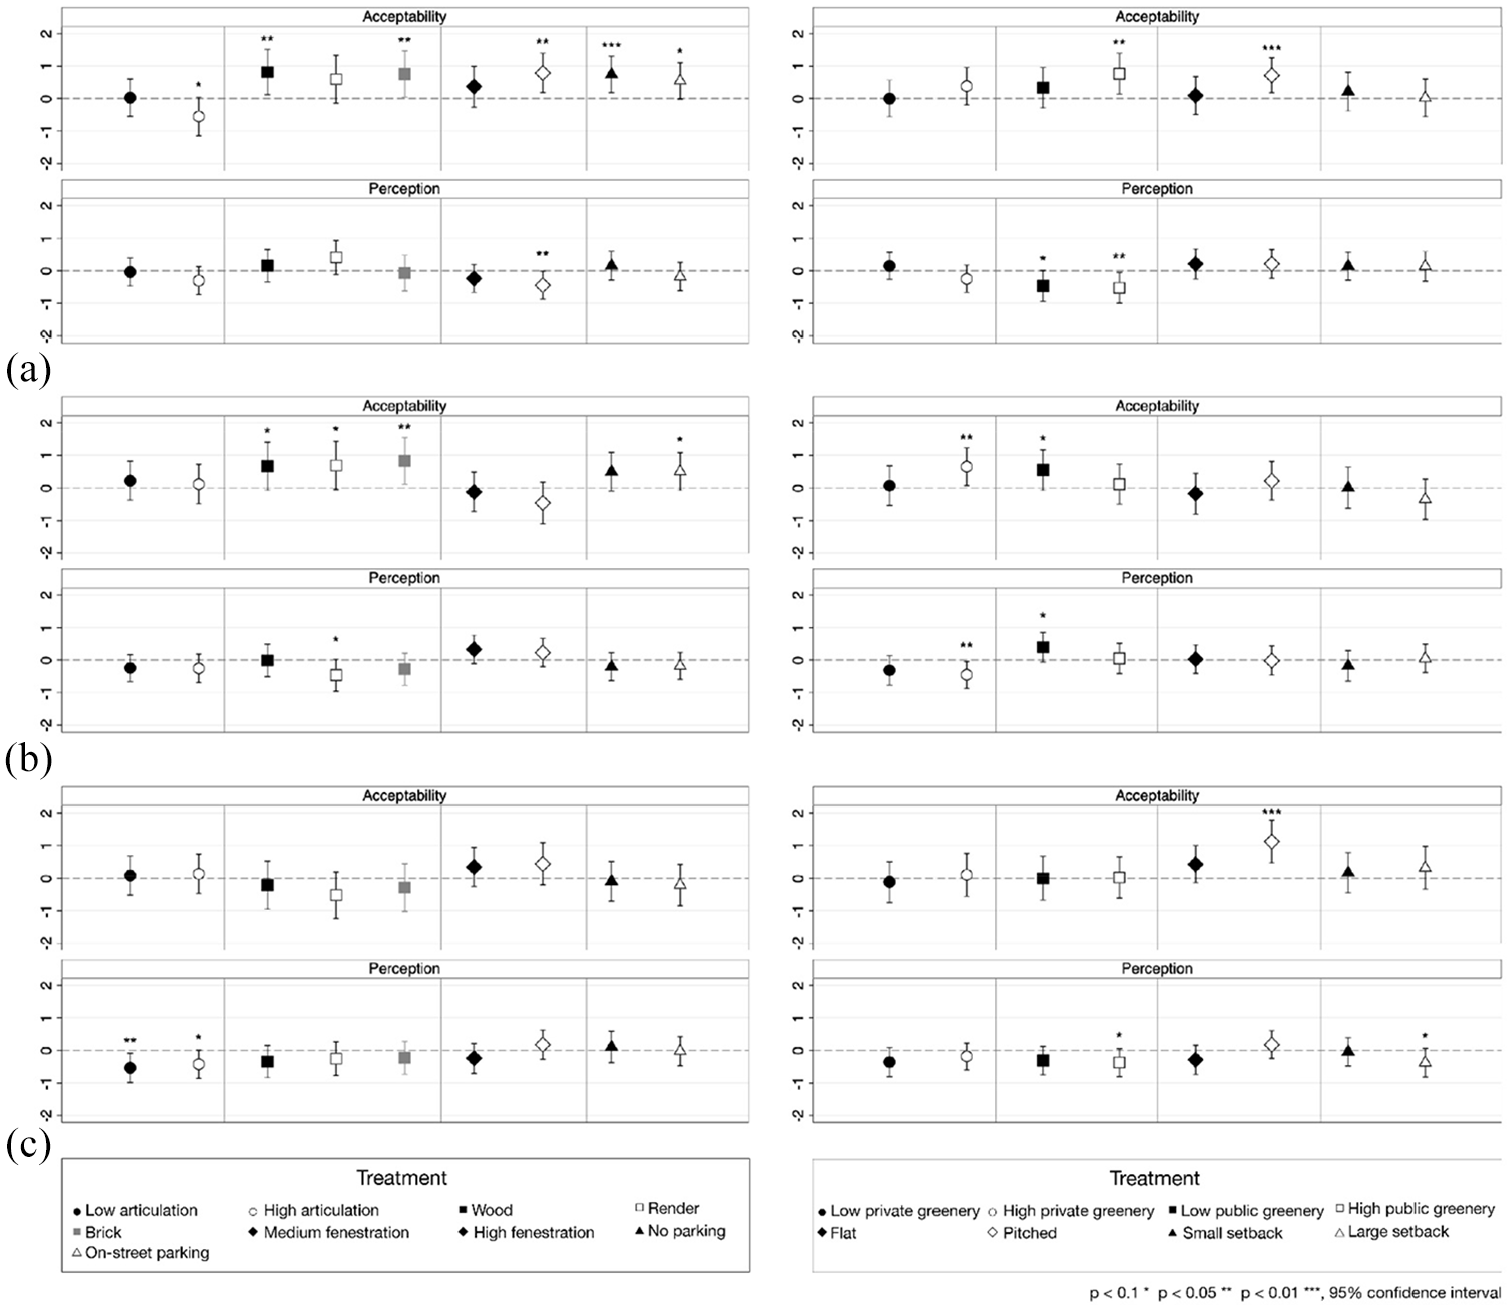
Impacts of design features on acceptability and perceptions of density. (a) Low density. (b) Medium density. (c) High density.
These results suggest that for low density housing developments in London suburbs, vernacular or traditional architecture is more acceptable. This is reflected in the higher acceptability of brick facades, reflective of the typology of many London suburbs, and of wood finishes, which echo wooden decoration used in the past to produce a so-called ‘mock Tudor’ effect. Large green spaces also recreate a more rural feel to developments, recalling earlier design ambitions for the suburban public realm, typified by the Radburn principles of the ‘village green’. Overall, these results seem to support the greater acceptability and lower density perception of vernacular suburban design that support the attempt to achieve an illusion of the rural in the city (rus-in-urbe).
Medium density housing developments
Second, we consider the impact of each intervention category on the perception and acceptability of medium density developments (Figure 3b). Concerning building design, compared with a steel facade, again brick finishes significantly enhance the acceptability of a development (acceptability = 0.830), while render or wood have a weakly significant positive effect. The design of the private and public realm also enhances acceptability. High levels of private greenery meant that medium density buildings were perceived as lower density and more acceptable (acceptability = 0.649; perception = −0.458), while large public spaces had a positive but weakly significant effect in increasing acceptability (see Table A3.B in the Supplemental Material).
This again indicates a greater preference for traditional design, echoing the original ‘rus-in-urbe’ intent of London’s 20th-century suburbs. The acceptability of developments containing large private green spaces might speak to the early purpose of the suburbs which was to achieve the mixing of rural and urban, where the front lawn was an essential aspect of delivering the impression of a home built in parkland (Fishman, 1987). 3
Higher density housing developments
We next consider our high density developments with respect to design treatments (see Figure 3c, and Table A3.C in the Supplemental Material). Moderate facade articulation reduces perceptions of density (perception = −0.534), while large facade articulation, large public spaces and large building setback have a weakly significant negative effect on perceptions of density. The one intervention that significantly increased acceptability for the higher density option was a pitched rather than a flat roof (perception = 1.127). This may have a double significance: positively, the pitched roof echoes the suburban vernacular of the single-family suburban house, 4 whereas negatively, a flat roof echoes the public housing blocks of the 1950s which, for multiple reasons including a lack of maintenance, came to be viewed as problematic. Notwithstanding the positive perception of pitched roofs, our findings show that, for high density buildings, their design, or indeed that of the public realm around them, is unlikely to improve residents’ views on these types of developments, which runs counter to the dominant discourse (Campoli and MacLean, 2007; Sivam et al., 2012).
To summarise, our findings indicate that by itself, design can do relatively little to change the acceptability of the density of developments in the suburbs. This is particularly true in the case of higher densities. However, in addition to design, an individual’s views might also shape perceptions of and the acceptability of density; we turn to these in the following section.
The effect of an individual’s attitudes on perceptions of and the acceptability of density
In this section, we carry out an exploratory analysis on the relationship between an individual’s attitudes and their perceptions of density and acceptability of new housing developments at given densities. For this, we ran equation (2) at each building’s density, observing variations in a selected attitude. Below, we comment on those that are statistically significant at the 5% significance level after Bonferroni corrections.
We analyse how four attitudes shape people’s perceptions of density and its acceptability. Figure 4a presents the results of density perceptions and acceptability of new developments based on people’s attitudes in response to the statement, ‘London has a housing crisis’. The level of agreement with the statement significantly decreases perceptions of density and increases its acceptability for all levels of buildings (see Table A4 in the Supplemental Material). It is worth noting here that the effect size of the ‘London’s housing crisis’ attitude is so pronounced that it has a larger impact in lowering perceptions of density and increasing acceptability than any of the design treatments that we tested.

Impact of resident attitudes on perceptions of acceptability of density. (a) London housing crisis attitude. (b) London development preferences. (c) Local political influence.
Figure 4b presents the results where respondents expressed a preference for the location of new development; Outer London, Inner London or both. This question was included to test the existence of potential NIMBY (not in my back yard) attitudes, that new housing development should happen elsewhere. Compared with those residents who think that development should happen in Outer London, residents who thought new housing should be built in Inner London significantly perceived all building densities as less acceptable, while changes of density perception were not significant (see Table A4.B in the Supplemental Material). This means that while both groups perceive density similarly, the NIMBY group is less willing to accept new housing developments at any density. The effect size of this NIMBY attitude is in many cases larger than any change in perception made by any of the design features presented above.
Figure 4c presents the results according to how much influence participants felt they had over developments in their area. With this, we wanted to see what impact, if any, that a sense of local agency would have. We found that those with some sense of agency perceived developments as more acceptable and less dense than those who felt disempowered (responding no or very little influence over local planning) (see Table A4.C in the Supplemental Material). We cannot conclude much about those who reported that they believed they had a great deal of planning influence, as only a few people selected this option, resulting in large standard deviation and less reliable point estimates. This suggests that empowering communities / achieving a greater sense of agency could potentially create a sense of control over shaping developments to obtain desirable outcomes, resulting in higher levels of development acceptability and lowering perceptions of density.
Our findings indicate that an individual’s attitude plays a crucial role in shaping perceptions of the density and acceptability of new housing developments. A low level of awareness of London’s housing crisis, a NIMBY sentiment and perceptions of low capacity to influence new developments remain major obstacles for the development of new housing at any building density. Compared with building design strategies, attitudinal factors have, in general, a larger effect, indicating the importance of working with and on local attitudes when trying to deliver higher density developments.
Discussion
Our research establishes a strong correlation between increasing density and decreasing acceptability of new developments, indicating that there is a problem that planners and politicians need to address. In this context, we sought to test whether suburban ‘vernacular’ treatments could lessen perceptions, and/or increase the acceptability of densification. We also sought to test how personal characteristics and attitudes impact the perception and/or acceptability of differing densities.
Our starting point was that design was only one of many elements that would impact existing residents’ acceptance of or resistance to higher density development. Even with this in mind, our findings show that overall, design is likely to have only a limited impact, with just a few treatments being significant. Starting positively, the low density option produced the most treatments that made a significant difference. This suggests that the incorporation of vernacular design offers possibilities to improve the acceptance of density and therefore design should be more attentive to local features. Framing our low density option as suburban by incorporating familiar traditional design elements will make them seem less dense and make them more acceptable to their neighbouring community. It is important to note that our low density proposition is still considerably higher than typical existing suburban densities and so, if made more acceptable by design, it could contribute to significantly increasing housing density in the suburbs.
But once we move beyond our lower density option, design has a diminishing effect. At medium density, there are still some ‘vernacular’ suburban treatments that can make development more acceptable and, although not a ‘silver bullet’ to overcoming opposition, they should not be dismissed. Rather, they should be employed with more understanding that their impact will be limited and that there is a need to address more than just design to make density more acceptable. As the real density level increased, so did people’s perception of density, while acceptability decreased. Design did little to reduce the impression of density. This was firmly the case for higher density development where, aside from the clear positive impact of a pitched roof, no other treatments were significant. There is very little that design can do to either make higher density development appear less dense or to make it more acceptable.
Thus, design can make a difference in promoting density that is higher than the existing suburban fabric. This supports the importance of resecting the local vernacular advocated by CABE and the ‘Building Better’ Commission. But the benefits of reflecting the vernacular decline rapidly for our medium and higher density options. Put bluntly, these cannot be designed to look vernacular in the suburban context. We might then conclude that to make suburban densification acceptable to existing residents we should not exceed our lower density options. But to do so while achieving a step change in housing delivery would require policy makers to abandon the suite of policies that constrain land supply. The present approach has been challenged (Stringer et al., 2016), but it seems likely to endure. The economics of land supply will drive exponential increases in density. On very large suburban sites such as at Meridian Water in North London there may be scope for the sensitive management of densities as an entire new urban quarter is created. But on smaller sites there are limited options to mitigate the impacts, and new development will be in stark contrast to the existing urban form. As this is the most likely case for London in the immediate future, the choice is to do what is possible through design and then to ‘face down’ opposition or to seek to alter existing residents’ views.
The limited potential for design to make a difference is less problematic if we see it alongside other elements that might reduce resistance. When we consider the responses to density against the ‘attitudes’ of residents, we start to see the importance of influencing people across several fronts (with design being just one). More significant are attitudes, which are open to challenge and change (Forester, 1988; Healey, 2005) and thus can become an active policy arena for urban planning. The challenge of persuading existing residents of the need for higher density development is significant (in the case of the US, see Whittemore and BenDor, 2019). However, as our results show, there is evidence that the effort is worthwhile as changes to opinions can significantly influence the perception of density and/or its acceptability independent of the design route. A good example of this disconnect is where respondents agreed that London had a housing crisis. Those holding this view recorded a significant reduction in their perception of density as well as a strongly positive view of the acceptability of density. We need further work to understand the full range of attitudes that can have a positive impact on increasing the acceptability of much-needed housing supply, as well as the effectiveness of communication strategies to make communities more receptive to London’s challenges.
There is ample evidence of significant change in London’s suburbs which could play into more positive attitudes towards densification. Perhaps most significantly, homeownership is steadily declining, falling from 68 per cent of households in 1991 to 62 per cent in 2018 (reflecting a general shift in England from home ownership to renting since the latter part of the 20th century). The shift to renting includes younger professionals historically associated with gentrified parts of inner London who (at least until COVID) have been priced out to the suburbs (Paccoud and Mace, 2018). Another well-established social change has been a significant increase in the ethnic diversity of Outer London (Johnston et al., 2015), although it is less clear how this might change attitudes to density. All these changes are unevenly distributed spatially (see Paccoud and Mace, 2018 in the case of tenure shifts) and therefore some suburban areas may become more open to new higher density development while others are likely to remain opposed.
In our study, we limited the number of questions capturing attitudes to limit the time required to respond, in order to maximise completed surveys (we required a large number of responses to provide statistical robustness). As the method necessarily required each participant to respond to many images of alternative designs, we restricted questions on attitudes. This provides for strong validity and allows us to make causal claims over the effectiveness of design strategies and to study attitudes across different buildings proposals. Further research could expand on ‘attitude questions’, and could test the reliability of the findings – to what extent can we generalise across Outer London or indeed to other suburbs? Outer London is a highly varied social and built environment and we would expect this to be reflected to some extent in local responses to densification.
Our design options are not exhaustive, and further research on different treatments would be valuable, as would testing the impact of a broader range of attitudes than we have here. Our sample of building images is composed of stand-alone multi-storey buildings, and therefore our findings are restricted to this widely used type of development. In contrast, the impact of building design might be different for larger and more comprehensive neighbourhood re-development plans.
Conclusion
When seeking to lessen resistance to new development in London’s suburbs, design can play a positive role, but it is a limited one and needs sensitive application. On their own, design treatments have some impact on the perception and acceptability of new development in suburban areas. Employing vernacular treatments in the lowest of our increased densities was effective. However, these treatments need to be applied with sensitivity by designers. The use of pitched roofs produced positive outcomes in all cases, but private and public greening had a positive or negative influence depending on the tested level of density. This suggests that for design tropes to have a positive influence on acceptability and/or perception we need great sensitivity to how design impact varies across densities.
With few exceptions, as densities increase further, we cannot ‘trick the eye’ of existing residents to make densities appear less than they are. However, design is not the only tool available to politicians and planners. Our research shows that residents’ attitudes are significant and therefore, directing attention to informing and shaping these attitudes may prove a way forward in making density more acceptable. For higher density housing developments, we saw that an individual’s attitudes had a powerful influence in shaping perceptions and acceptance of density. New development can be at higher density and acceptable where existing residents see it as part of a wider picture, where they are convinced of its need. Alongside design, attitudes related to the need for density are open to change and are a potentially powerful policy arena to further the delivery of new housing on brownfield sites in the suburbs.
Supplemental Material
sj-xlsx-1-usj-10.1177_00420980211036633 – Supplemental material for Delivering higher density suburban development: The impact of building design and residents’ attitudes
Supplemental material, sj-xlsx-1-usj-10.1177_00420980211036633 for Delivering higher density suburban development: The impact of building design and residents’ attitudes by Pablo Navarrete-Hernandez, Alan Mace, Jacob Karlsson, Nancy Holman and Davide Alberto Zorloni in Urban Studies
Footnotes
Appendix
Measurements.
| Variable | Definition |
| Score | Continuous variable showing a respondent’s rating of an image on a scale of 1–10. |
| Treatment | Categorical variable equalling 0 for control images, 1 for treatment 1, 2 for treatment 2 and 3 for treatment 3. |
| Question | Categorical variable where 0 equals the question ‘How acceptable is this level of density to you?’ on a scale of 1 ‘Completely unacceptable’ to 10 ‘Completely acceptable’, and question 1 ‘How dense do you feel this place is?’ ranging from 1 ‘Very low’ to 10 ‘Very high’. |
| Density group | Categorical variable indicating whether the rated image was of 0 low density, 1 medium density or 2 high density. |
| Age | Continuous variable showing the age in years when the experiment was conducted. |
| Gender | Categorical variable where a respondent is either 0 ‘Male’, 1 ‘Female’ or 2 ‘Other’. |
| Ethnicity group | Categorical variable showing if a person identifies as 0 ‘White’, 1 ‘BME (black and minority ethnic)’ or 2 ‘Other’. |
| Tenure | Categorical variable indicating if a respondent is 0 ‘Owner occupier’, 1 ‘Social renter’, 2 ‘Private renter’ or 3 ‘Other’ arrangement. |
| UK born | Categorical variable equalling 0 if a person was born in the UK and 1 if not. |
| Postcode area | Categorical variable indicating whether a respondent is from 0 ‘North’, 1 ‘East’, 2 ‘South’ or 3 ‘West’ London, or 4 ‘Other’. |
| Length of residency | Categorical variable showing how long the respondent has lived in their current residence: 0 ‘Less than a year’, 1 ‘1–5 years’, 2 ‘6–10 years’ or 3‘More than 10 years’. |
| Housing crisis attitude | Categorical value indicating how well a person agrees with the statement ‘London has a housing crisis’, ranging from 0 ‘Strongly disagree’ to 4 ‘Strongly agree’ and 5 ‘Don’t know’. |
| Development preference | Categorical variable showing the respondent’s preference of location for new London development: 0 ‘Outer London Boroughs’, 1 ‘Inner London Boroughs’, 2 ‘Inner and Outer’, 3 ‘Don’t know’. |
| Neighbourhood belonging | Categorical variable showing a respondent’s sense of neighbourhood belonging, ranging from 0 ‘Not at all’ to 4 ‘A great deal’ and 5 ‘Don’t know’. |
| Local influence | Categorical variable showing a respondent’s perceived influence in local council decision-making, ranging from 0 ‘Not at all’ to 4 ‘A great deal’ and 5 ‘Don’t know’. |
| Survey duration | Continuous variable showing the time it took a respondent to complete the survey in milliseconds. |
| Weekday | Categorical variable indicating which day of the week the survey was taken: 0 ‘Sunday’ to 6 ‘Saturday’. |
| Weekend/weekday | Categorical variable displaying whether the survey was taken on 0 a ‘Weekday’ or 2 a ‘Weekend’. |
| Survey hour of day | Continuous variable showing which hour of the day the survey was commenced on a 24-hour scale. |
| Image order | Continuous variable showing where the image appeared in the 25-picture sequence. |
| Survey day | Continuous variable showing the date when the survey was commenced. |
Acknowledgements
We thank the two anonymous reviewers whose suggestions helped us to improve this article.
Declaration of conflicting interests
The authors declared no potential conflicts of interest with respect to the research, authorship, and/or publication of this article.
Funding
The authors received no financial support for the research, authorship, and/or publication of this article.
Supplemental material
Supplemental material for this article is available online.
Notes
References
Supplementary Material
Please find the following supplemental material available below.
For Open Access articles published under a Creative Commons License, all supplemental material carries the same license as the article it is associated with.
For non-Open Access articles published, all supplemental material carries a non-exclusive license, and permission requests for re-use of supplemental material or any part of supplemental material shall be sent directly to the copyright owner as specified in the copyright notice associated with the article.