



Abstract
Neighbourhood environments are a known social determinant of health. Vacant and abandoned buildings and lots and poor or hazardous housing conditions, combined with crime and violence, can affect residents’ health and wellbeing. Nationwide Children’s Hospital and its partners launched the Healthy Homes initiative in 2008, which sought to improve nearby residents’ health and wellbeing by rejuvenating vacant and abandoned properties and increasing homeownership in the South Side neighbourhood of Columbus, Ohio. Between 2008 and mid-2019 the initiative funded 273 repairs or renovations in this neighbourhood. We conducted a ZIP-code-level comparative case study of the Healthy Homes housing interventions using synthetic control methodology to evaluate changes in crime rate in the intervention area compared with those in a synthetic control area. While findings were mixed, we found some evidence of reduced thefts in the Healthy Homes area, relative to its synthetic control. This initiative to repair, rebuild and increase ownership of housing has the potential to reduce crime rates for neighbours of the Nationwide Children’s Hospital.
Introduction
A decades-long decline in population and resources of post-industrial US cities has left many vacant and abandoned lots and buildings, including a large number of dilapidated and potentially dangerous housing units. Neighbourhood environments with such conditions may negatively influence the health and safety of their residents. Long-term structural disinvestment, depopulation and housing abandonment have been associated with violence, including firearm assaults and homicides (Raleigh and Galster; 2015; Spelman, 1993; Wei et al., 2005). Over time, excess housing foreclosures and vacancies appear to pre-date increases in violent crime and, to some extent, property crime, though specific relationships remain inconsistent across studies (Cui and Walsh, 2015; Lacoe and Ellen, 2015; MacDonald, 2015).
A set of theories – social disorganisation, broken windows and opportunity theories – attempt to explain the spatial distribution of crime that might help explain potential mechanisms for the association between housing vacancy and crime. Social disorganisation has been defined as ‘the inability of a local community to regulate itself in order to attain goals that are agreed to by the residents of that community’ (Bursik, 1988). Shaw and McKay’s (1942) social disorganisation theory and subsequent extensions focused on social disorganisation as the link between neighbourhood characteristics such as economic decline, instability and variations in crime. Similarly, the broken windows theory posits that if neighbourhood spaces are left untended and dilapidated they become signals that residents are not invested in their communities and may be less likely to intervene in deviant behaviour, and as informal social controls continue to erode these areas potentially become targets for more serious crimes (Wilson and Kelling, 1982). The theory was originally applied to renovating or rebuilding of vacant homes in order to improve neighbourhoods for existing residents (Klinenberg, 2018). However, the theory has been mistakenly used to justify ‘zero tolerance’ policing policies that disproportionately target and punish people of colour and has been linked to efforts to remove residents for the benefit of waiting redevelopment investors (Mitchell, 2010). Nevertheless, this theory may explain reduced crime due to revitalising informal engagement by residents at the street level and in their homes, and signalling that opportunities for crime are diminished in and around newly renovated spaces (Heinze et al., 2018).
Routine activity theory posits that the ingredients of a crime, in particular crimes such as burglary, theft and assault (Spano and Freilich, 2009) include ‘motivated offenders’, ‘suitable targets’ and a lack of ‘capable guardians’ (Cohen and Felson, 1979). Renovating vacant homes could change routine activities of those who live in and around the area, and it could increase the supply of capable guardians. Alternatively, renovating vacant homes could increase crime by increasing the supply of suitable targets, such as the number of residents living in an area that have items worth stealing (Freedman and Owens, 2011). Situational crime prevention and crime prevention through environmental design theories articulate similar mechanisms and suggest that features of the built environment make areas more or less attractive to offenders by affecting natural surveillance, access control, target hardening and signs of territoriality (Cozens et al., 2005). There is not a consensus on whether and when we should expect to see either an increase or decrease in crime after intervention such as housing renovations.
Available empirical evidence supports these theoretical mechanisms between housing vacancy and health. Abandoned housing and physical dilapidation are associated with outcomes such as anger, anxiety and depression (Kim, 2010; Ross, 2000; Ross and Mirowsky, 2009). Studies have found associations between presence of vacant properties and physical health indicators including premature mortality (Cohen et al., 2003), drug-dependence mortality (Hannon and Cuddy, 2006), cardiovascular disease (Augustin et al., 2008; Chaix, 2009; Roux et al., 2001), teen births (Wei et al., 2005) and sexually transmitted disease (Cohen et al., 2000). Vacant properties also increase the risk of fire (Schachterle et al., 2012). Vacant and abandoned lots and buildings, and hazardous housing conditions, present a significant cost to the public, to municipalities and other entities including healthcare institutions.
Despite the emerging evidence that abandoned and blighted housing stock affects the health of local residents, there have been no experimental and few quasi-experimental studies published on the impacts of housing remediation on crime or violence. A pre-post study of vacant building demolitions in Detroit, MI, found a significant decline in firearm assaults compared with control locations (Jay et al., 2019). A quasi-experimental study of vacant property rehabilitations associated with a neighbourhood stabilisation programme in three US cities found no measurable effects on crime, although authors suggest this could be due to lack of statistical power for measurement and heterogeneity in the interventions (Spader et al., 2016). Another quasi-experimental study of abandoned building remediations, the vast majority of which were residential properties, in one major US city found statistically significant decreases post-intervention in total crimes, assaults and nuisance crimes around remediated properties compared with control properties (Kondo et al., 2015). Cost-benefit calculations based on these findings demonstrate significant financial returns to taxpayers, government bodies and other institutions if investments are made in abandoned building remediations (Branas et al., 2016).
Nationwide Children’s Hospital in Columbus, Ohio, in partnership with a faith-based partner, Community Development for All People, launched its Healthy Homes initiative in 2008 to rejuvenate vacant and abandoned properties and increase homeownership and housing stability in and around the nearby South Side neighbourhood. Healthy Homes is one component of the multi-faceted Healthy Neighbourhoods/Healthy Families (HNHF) Initiative, which also targets education, economic development, community engagement and health. This neighbourhood has been impacted by a long history of systemic exclusionary housing policy (e.g. redlining) and other institutional disinvestment (Kelleher et al., 2018). These HNHF local neighbourhood investments were done in the hope of countering decades of community disinvestment and improving the health and wellbeing of residents. Between 2008 and mid-2019 Healthy Homes significantly decreased neighbourhood vacancy (Kelleher et al., 2018), and funded and/or contracted 309 housing repairs or renovations in the surrounding neighbourhood.
We tested the hypothesis that targeted infrastructure investment through Healthy Homes created positive changes in the community that go beyond improved properties. We conducted a comparative case study using synthetic control methodology (SCM) to examine whether changes in crime rates from before to after the implementation of Healthy Homes in the intervention area were different from changes in crime rates in surrounding but comparable non-intervention areas.
Methods
Initiative description
Healthy Neighborhoods Healthy Families (HNHF), established in 2008 by Nationwide Children’s Hospital (NCH) and other partners around Columbus, was designed to promote the health of children and their communities. HNHF aims to address specific needs of families in the community in five target areas: affordable housing, education, health and wellness, safe neighbourhoods and workforce development.
Healthy Homes, a not-for-profit entity established by NCH, Community Development for all People and a faith-based partner, implements the initiatives for the HNHF’s first aim of increasing affordable housing. Healthy Homes works to rejuvenate vacant and abandoned properties, increase homeownership and expand the number of affordable rentals in the South Side of Columbus (initially focused in a 31 square block neighbourhood comprising approximately one-third of the land area of ZIP code 43206). With funding from NCH, the United Way of Central Ohio and the City of Columbus’ Department of Development between 2008 and 2019, as of May 2020 Healthy Homes has impacted 273 residential properties through home repair grants and full gut rehabilitations/new builds. This includes 172 substantial renovations or new constructions and 101 home repairs. Substantial renovations and new construction addressed unusable homes and/or vacant lots were rebuilt and transformed into safe and affordable homes, which can be purchased at below-market prices with the help of programmes such as homebuyer assistance (Healthy Homes, 2016). Most renovated properties were vacant and boarded-up, with varying levels of physical decay. Vacant lots on which new homes were built were generally overgrown and littered. The home repair programme further improved the neighbourhood aesthetic (Figure 1 depicts a typical property before and after renovation). Homeowners in the HNHF geography can apply for grants to fund exterior improvements to their homes (full-time residences), including roofs, windows, porches, siding, fences and walkways. These grants do not support internal (non-visible) repairs. During this same period, approximately 60 scattered site rentals and 58 rental units in a low-income housing tax credit site have also been added in the South Side neighbourhood with 200 more in various stages of development.

Before and after photos of a Healthy Homes property.
The primary goal of Healthy Homes was to improve access to affordable, safe housing in a historically disinvested community. Reduction in crime was not an expressed objective at the outset of the initiative and the project staff did not directly consider impacts on crime in their approach to selecting properties for development or repair, or for selecting residents. As the project has grown and developed, however, so too has interest in measuring crime as an ancillary outcome. Our hypothesis that this intervention reduces blight and stabilises the housing market in a concentrated area is grounded in prior empirical work and various decades-old theories – broken windows, busy streets, human territorial functioning. If visible signs of urban decay create an encouraging environment for crime, then there is hope that neighbourhood improvement will yield the opposite effect.
Analytic approach
SCM is a data-driven technique developed for comparative case studies to improve quasi-experimental evaluations of the effects of policies or programmes on outcomes of interest, particularly when the selection of appropriate counterfactuals is challenging (Bouttell et al., 2018). Specific to this analysis, challenges included lack of spatio-temporal records for intervention-equivalent control units (e.g. vacant property records) throughout the study period and clustering of Healthy Homes repairs/rebuilds in one neighbourhood, making it impossible to estimate the individual effects of each housing repair or renovation.
To overcome these challenges, we used SCM to derive a control series by calculating a weighted average from a pool of potential control units that have not experienced the intervention (the so-called ‘donor pool’). The weighting algorithms use prediction errors, such as mean squared prediction errors (MSPE), to minimise systematic differences between the treated and control series’ pre-intervention trends (Abadie and Gardeazabal, 2003; Abadie et al., 2010). The method is designed to improve causal inference by identifying a well-matched control series, thus addressing selection bias and time-varying confounding, including the parallel trends assumption (Abadie and Gardeazabal, 2003; Abadie et al., 2010). We conducted a SCM analysis to examine changes in crime rates from before to after the implementation of the Healthy Homes initiative, throughout a study period of 2008–2018. Though a smaller unit of analysis would be preferable, we conducted analyses at the ZIP-code-level because of a lack of higher-resolution outcome data for the entire study period.
While we knew the exact date of completion for rebuilt properties, we only knew the year of completion of Healthy Homes initiative-sponsored housing repairs. Therefore, we modelled a yearly step change in our main analyses. The Healthy Homes initiative began in 2008 but only delivered a small number of interventions until 2012–2013. Therefore, for our main analyses we set the intervention date as 2012, so that years 2008–2011 were included in the pre-period. Figure 2 shows the frequency of Healthy Homes interventions by year in ZIP code 43206.

Frequency of Healthy Homes interventions by year in ZIP code 43206 through September 2019.
In addition, we conducted a sensitivity analysis (Abadie et al., 2010) using a different intervention date. The Healthy Homes initiative made the largest number of repairs/rebuilds in 2013 (see Figure 2). Prior to 2013, only about 20 or fewer repairs/rebuilds occurred per year. We ran our analyses again using 2013 as the intervention start date, with 2008–2012 as the pre-intervention period.
We also obtained estimates for every year of the study period of total population, median household income, percent of the population below the federal poverty level, percent of the population without a high school diploma, percent Black, percent Hispanic, percent unemployed and percent occupied housing from five-year samples of the American Community Survey of the US Census. We interpolated tract-level estimates and assigned mean values to ZIP codes.
Data
The intervention unit was ZIP code 43206 where Nationwide Children’s Hospital implemented the bulk of the Healthy Homes initiative home repair/rebuild programme (see Figure 1). Although Healthy Homes has, thus far, concentrated its housing efforts in a 31-block area within the 43206 ZIP code, it could have a ZIP-code-wide effect.
From the donor pool, we excluded ZIP codes that fall partially outside the county because we did not have counts of crimes that occurred outside the county. We also excluded ZIP codes with unavailable or incomplete Census data (43082 and 43147) or crime data (43062 and 43064).
We excluded three additional ZIP codes from the donor pool. SCM assumes that outcomes in the non-intervention units are not influenced or contaminated by the intervention in the treated unit. Therefore, we excluded ZIP code 43205 where one home repair and four rentals were established in 2018. The hospital is also located in this ZIP code. We also excluded ZIP code 43207 where there was a confined area of Low-Income Housing Tax Credit (LIHTC) property interventions in 2013 and ZIP code 43215 which is adjacent to the hospital (see Figure 3). The remaining 29 non-intervention units (ZIP codes) formed the donor pool from which we constructed the synthetic control unit.
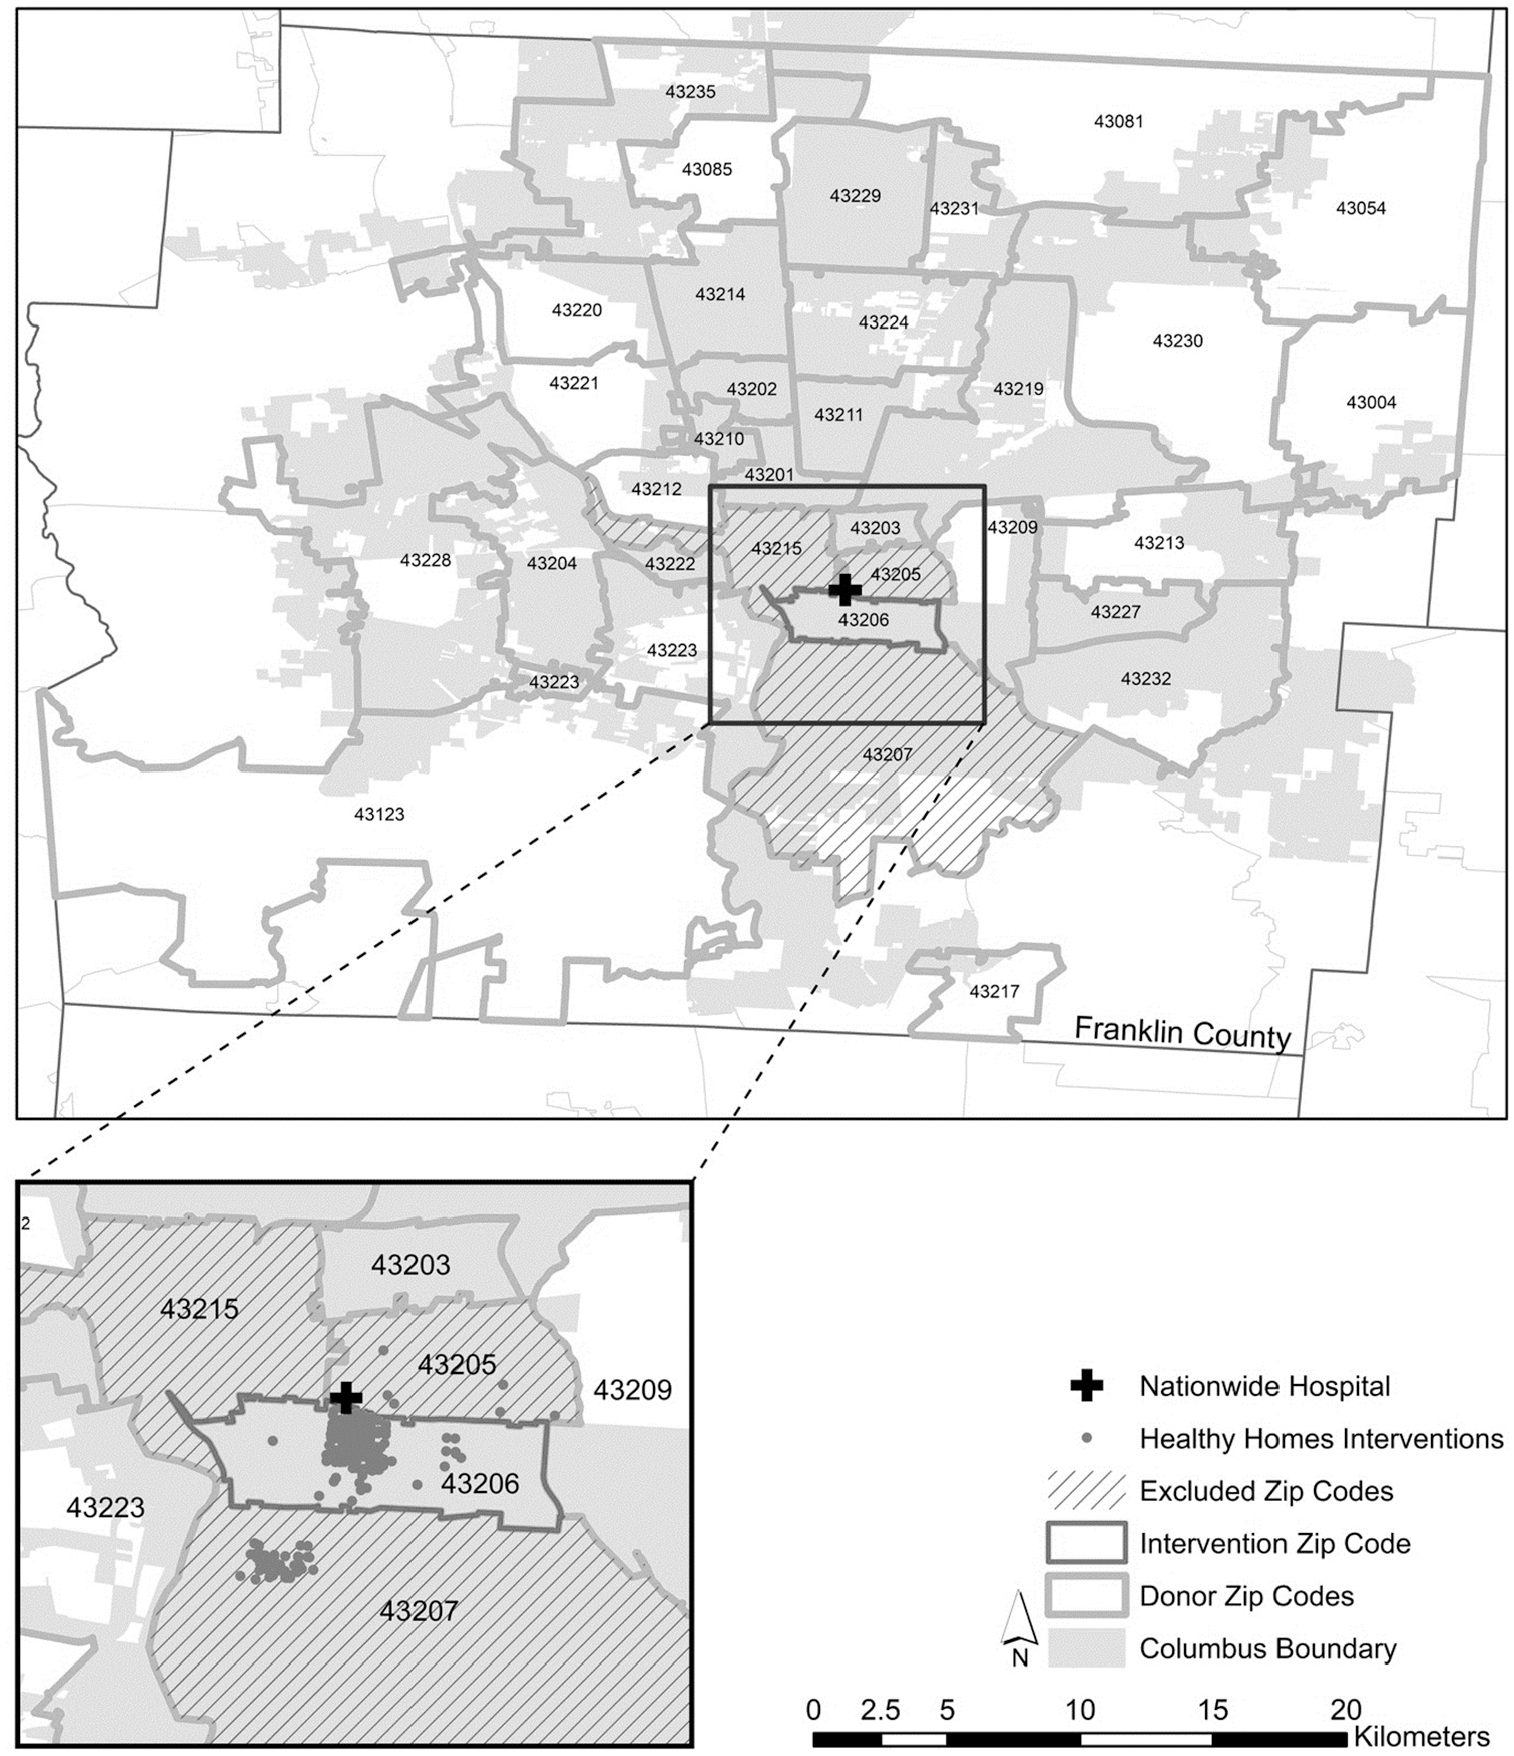
Map showing Columbus Nationwide Hospital, its Healthy Homes intervention point locations, intervention ZIP code and exclusion ZIP codes for the synthetic controls analysis.
From the Ohio Department of Public Safety, we obtained unduplicated offences reported to the Ohio Incident-Based Reporting System (OIBRS) by participating law enforcement agencies for years 2008 through 2018 geocoded by ZIP code location. While Franklin County has 32 law enforcement agencies, only 27 report to the OIBRS. Non-reporting enforcement agencies include Columbus Developmental Center, CSX Railroad Police Department, Ohio Casino Control Commission, Ohio Health Police Department and Twin Valley Behavioral Healthcare. Prior to year 2014, crime locations were not systematically recorded at the address level, but all included ZIP code. Our dependent variables were the rate of crimes per square mile to account for the large variation in the ZIP codes’ geographical size. We calculated crimes per person in addition to crimes per square mile because land area is a true constant and resident population may not reflect daytime populations which can vary with land use. We included serious assaults (comprising homicides and assaults categorised as felonies because they involved ‘serious physical harm’), burglaries, robberies, theft and drug trafficking, drug possession and motor vehicle thefts. Examining a range of personal and property crimes enabled us to test the initiative’s effects on different types of behaviours.
Statistical analyses
All analyses were implemented in R (version 3.52) using the Synth Package (Hainmueller and Diamond, 2014). We first calculated average raw crime rates and population-weighted demographic characteristics in the intervention ZIP code and in the donor pool. We then used synthetic control methods to identify a weighted average of the 29 ZIP codes in the donor pool for each crime outcome. The Synth package constructs the synthetic control unit by identifying a weighted combination of control units (from the donor pool) to approximate the unit affected by the intervention in terms of characteristics during the pre-intervention period. Because of observed multicollinearity between percent poverty and remaining sociodemographic variables, we removed this variable from the models. We used mean squared prediction errors (MSPE) to minimise the differences between the intervention ZIP code and synthetic control unit for each crime type and identify the weights which best match the intervention ZIP code’s characteristics and outcome trends before the Healthy Homes initiative was implemented (before 2012). MSPE is the squared deviations between the outcome for the treated and the synthetic control unit summed for all pre-intervention periods.
The primary results from the synthetic control method are outcome paths for the intervention ZIP code compared with the synthetic control unit for each crime type. We also plotted the gaps in the trends (intervention ZIP minus synthetic control unit) (Hainmueller and Diamond, 2014). In addition, we calculated the average post-intervention treatment effect.
We assessed the goodness of fit between the synthetic control and the intervention ZIP code for each crime type by (1) examining the equivalence of pre-intervention characteristics and (2) calculating the MSPE. A MSPE value of 0 indicates perfect fit between the intervention ZIP code and synthetic control unit. Larger values suggest less overlap in pre-intervention period, and therefore post-intervention trends could be due to unseen factors. We used MSPE values to select our outcome measure (crimes per person versus square mile).
We carried out three robustness checks to examine whether our results may be attributed to chance. First, we used linear regression to model the effect of the intervention on each crime outcome. While accounting for underlying temporal trends, we modelled dummy variables that represented the period before and after the Healthy Homes initiative was implemented and that represented whether the series was the intervention or synthetic control. We also incorporated an interaction term to provide difference-in-difference estimates for the change in each crime outcome before and after the Healthy Homes initiative in the intervention ZIP relative to the change in the synthetic control unit.
Next, we conducted a permutation test, or placebo study (Abadie et al., 2010), in which we generated a synthetic control for all ZIP codes in the donor pool that did not receive the intervention, excluding the ZIP codes that received the intervention or that were adjacent to the hospital (i.e. ZIP codes 43205, 43206, 43207, 43215). We could then compare the estimated effects, checking to see whether the effect for the intervention ZIP code (43206) is larger than the effects estimated for the non-intervention ZIP codes. The results were presented graphically to enable visual inspection of the differences between the intervention ZIP code and all non-intervention ZIP codes. In addition, we ran all tests using the intervention date of 2013.
Finally, we calculated the post-/pre-treatment MSPE ratio and associated quasi p-value which serves as the equivalent of a significance test of the synthetic control results. This ratio represents the before/after difference in outcomes between a unit and its synthetic control unit and is an indicator of how extreme the treated unit’s ratio is in comparison with that of placebos. When we calculate the ratio for all placebo intervention units, the test represents how likely the result for the true intervention unit could have occurred by chance (Abadie et al., 2011, 2015). In addition, we present ordered bar charts of post-/pre-treatment MSPE ratios for each ZIP code based on 2012 intervention date to provide an image of how likely it is to find an effect of the size in the treated unit conditional on pre-intervention fit.
Results
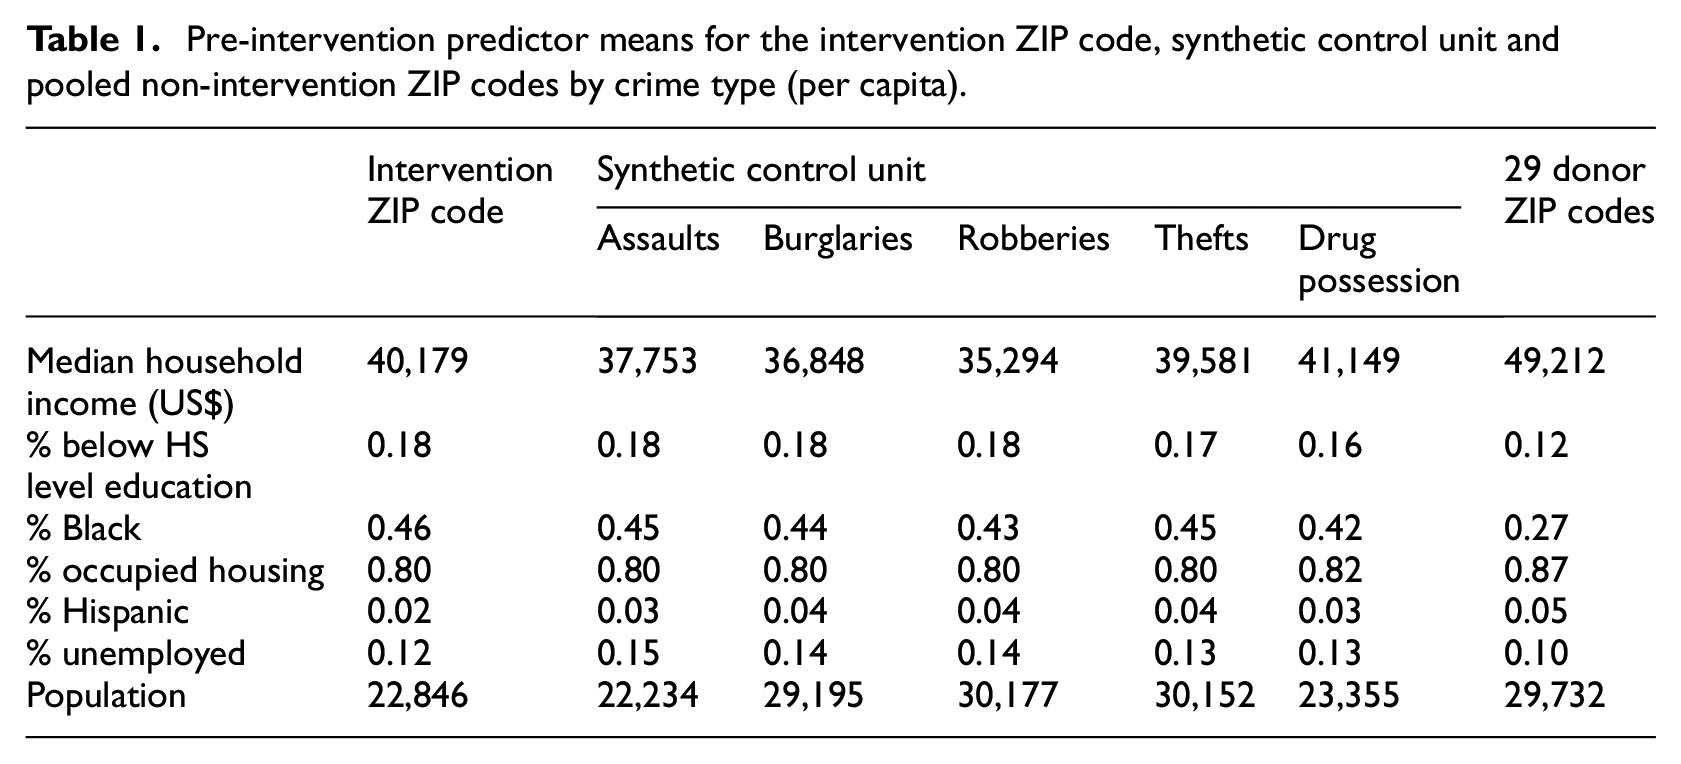
We included five crime types in outcome measures, including assaults, burglaries, robberies, thefts and drug possession. Drug trafficking and motor vehicle thefts were excluded because of inadequate sample size to run the SCM. The pre-intervention characteristics of the intervention ZIP code with the synthetic control for all crime types (crimes per capita) tested, as well as with the population-weighted average of the 29 ZIP codes in the donor pool, are shown in Table 1. Differences in sociodemographic characteristics between the intervention ZIP code and synthetic control unit are minimised, relative to averaged values for the donor ZIP codes.
Pre-intervention predictor means for the intervention ZIP code, synthetic control unit and pooled non-intervention ZIP codes by crime type (per capita).
ZIP-code-level crime rates per square mile in the intervention ZIP code 43206 versus averaged rates in the non-intervention ZIP codes (n = 29) are shown in Supplemental Material S1. During the post-intervention period, we see declines in many crime types for both the intervention ZIP code and donor pool, but steeper declines in the intervention ZIP code (although we see fluctuations in serious assaults and drug possession). Unit weights assigned to each ZIP code in the donor pool to construct the synthetic control, for each crime type, are shown in Supplemental Material S2.
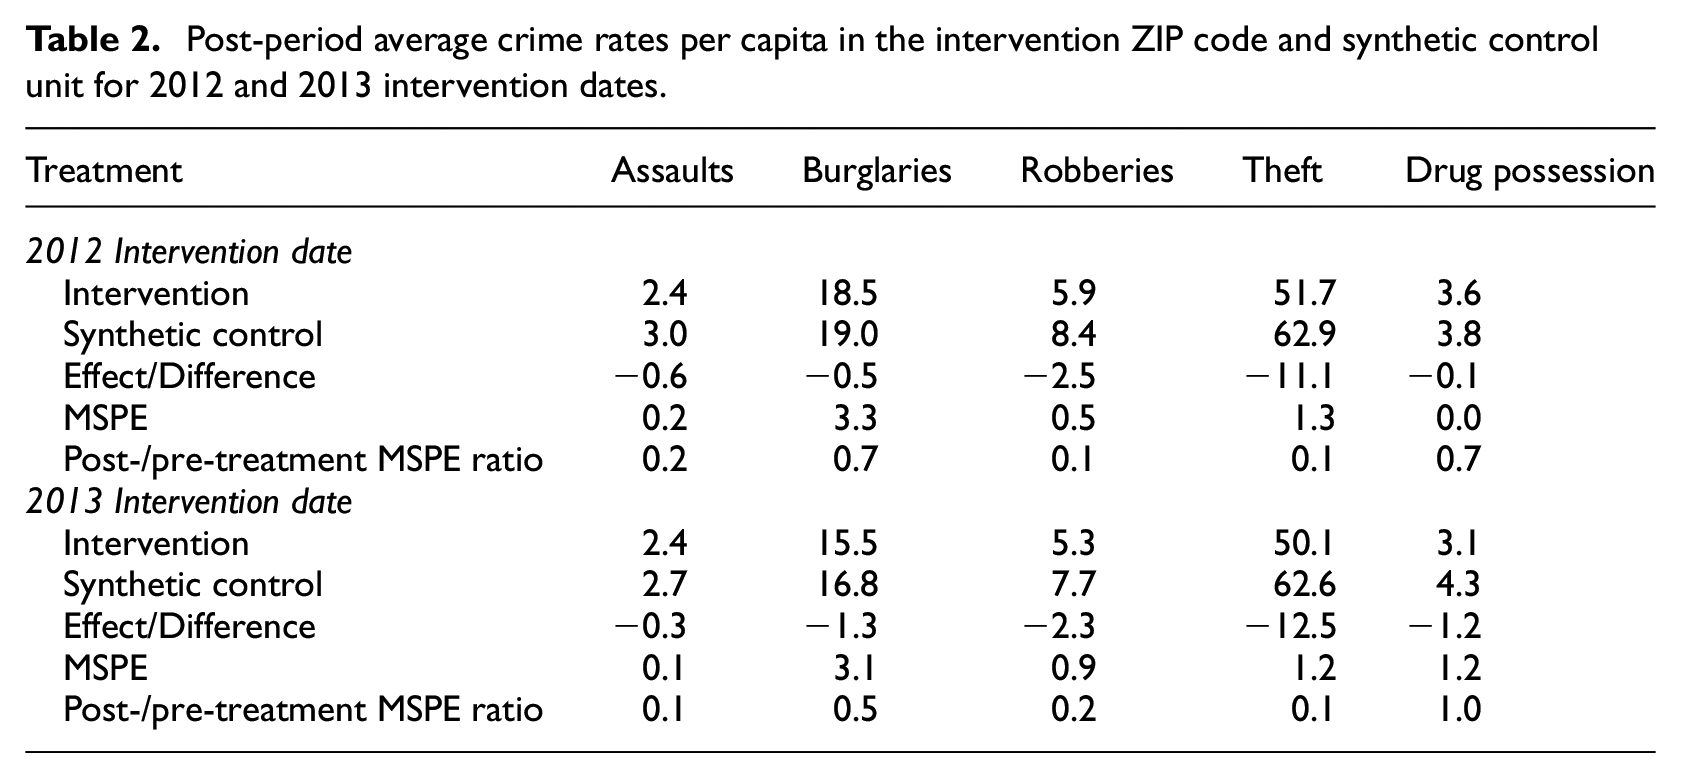
Mean post-intervention crime rates (per capita) for the intervention ZIP code and synthetic control unit are shown in Table 2. The differences in the mean post-intervention crime rates between the intervention ZIP code and synthetic control unit are all negative, however values for assaults (−0.6), burglaries (−0.5) and drug possession (−0.1) are all close to 0 values. The average post-intervention difference for robberies was −2.5 and for theft −11.1 crimes per capita. MSPE values for all crime per capita outcomes suggest good pre-intervention fit, except for burglaries (3.3). MSPE values for crimes per square mile were 0.9 (assaults), 1.7 (drug possession), 2.8 (robberies) 14.3 (theft) and 21.8 (burglaries), which indicates poor pre-intervention fit compared with crimes per capita. Therefore, we conducted the remainder of the analyses on crimes per capita.
Post-period average crime rates per capita in the intervention ZIP code and synthetic control unit for 2012 and 2013 intervention dates.
However, the SCM estimates effect change over time for the synthetic control unit, and averaged rates over the post-period do not reveal the dynamic nature of these effects. Yearly crime rates in the intervention ZIP code versus synthetic control unit throughout the study period are shown in Figure 4. We see steeper post-intervention decreases (initially) in burglaries, robberies and drug possession in the intervention ZIP code versus the synthetic control unit. The graphs confirm our conclusions from MSPE values; crime rates in the pre-intervention period align well between the intervention ZIP code and synthetic control unit, except for burglaries.
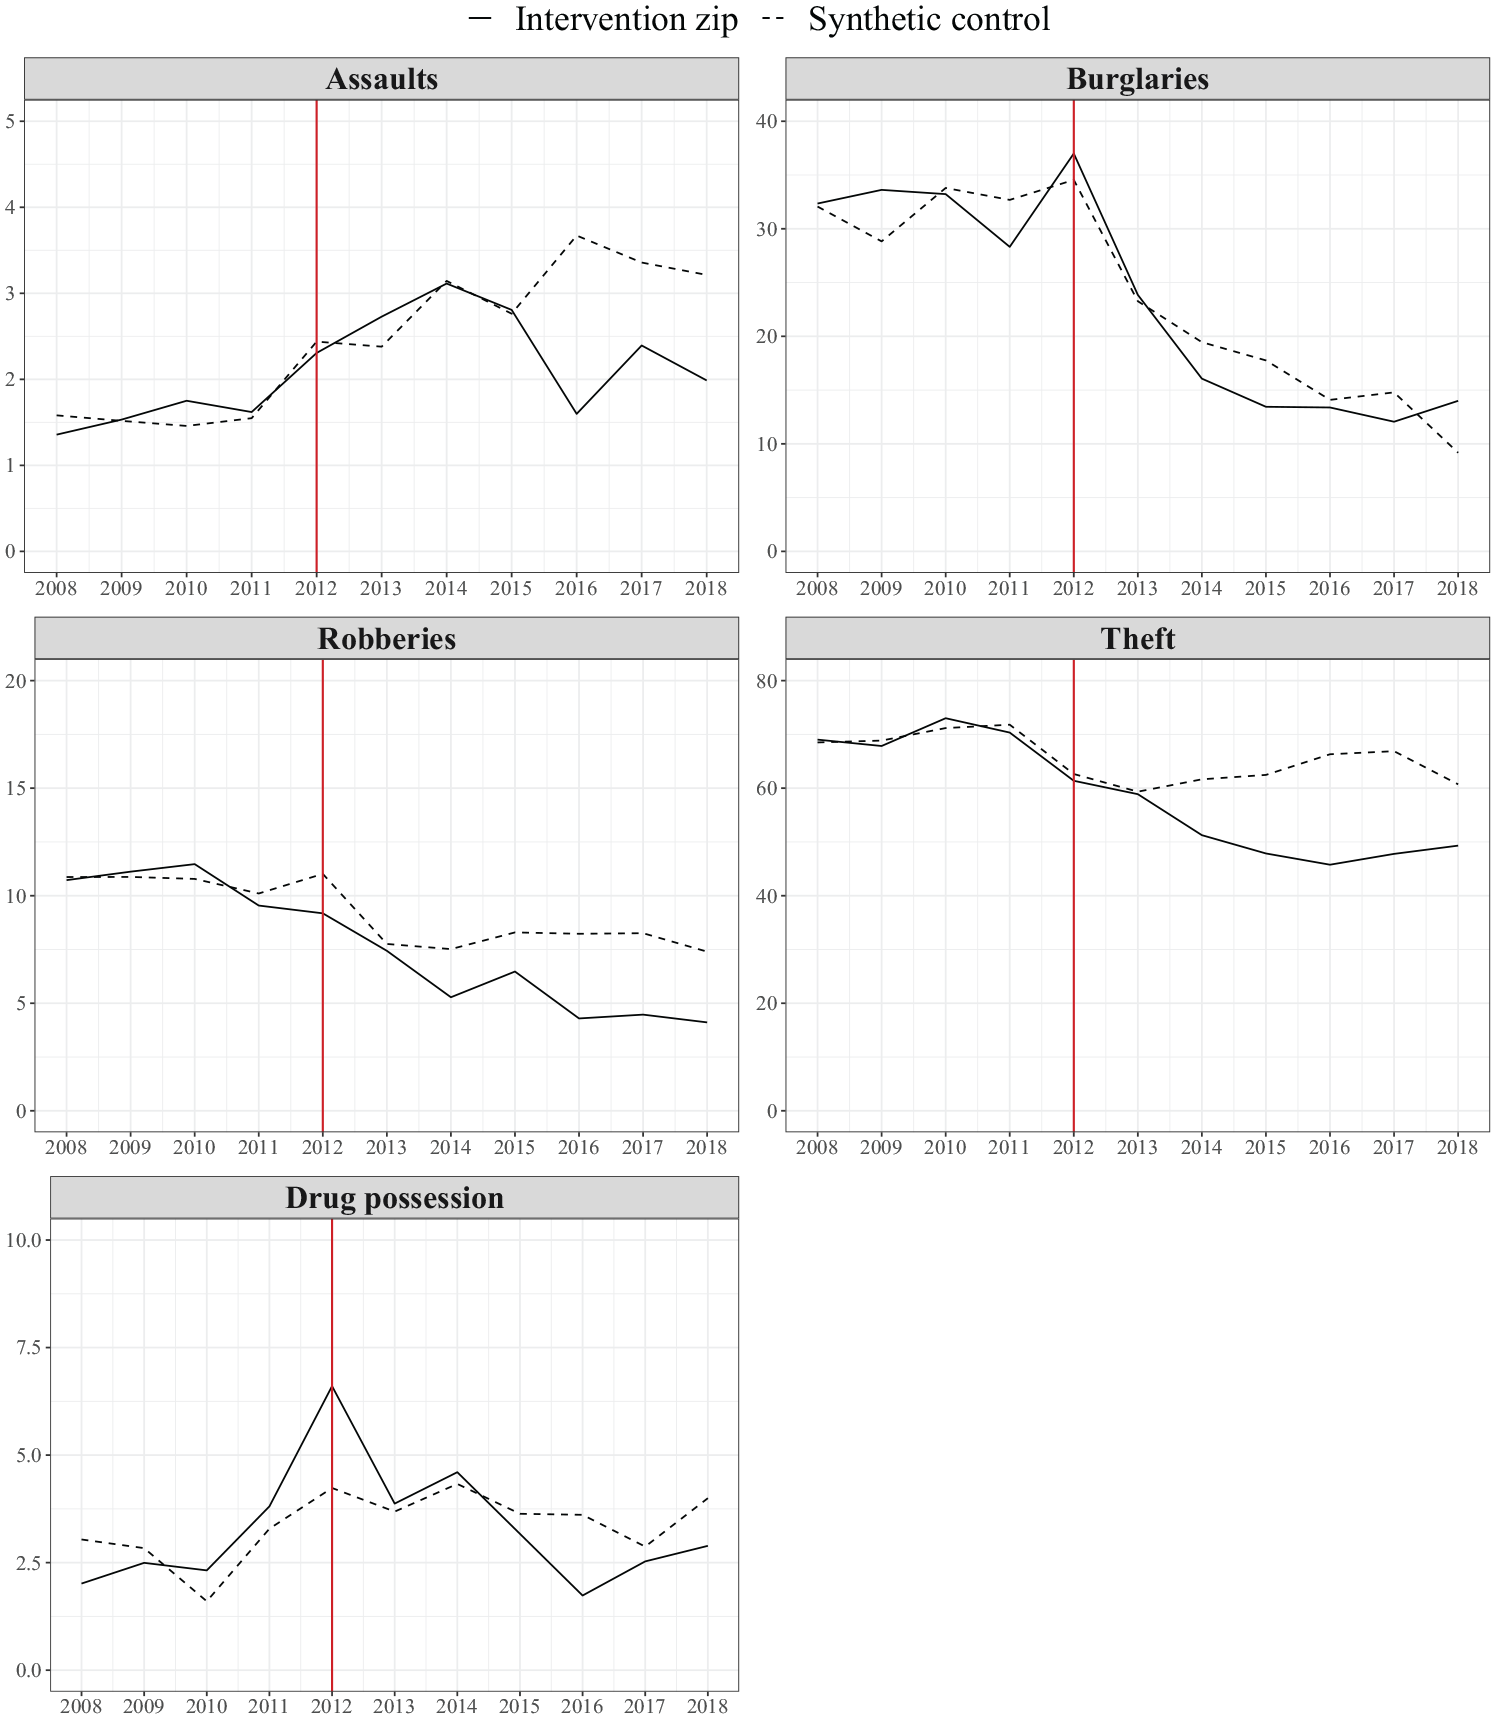
Crime rates in the intervention ZIP code and synthetic control unit with 2012 intervention.
The difference in crime rates between the intervention ZIP code and synthetic control unit are shown in Figure 5. Values below 0 indicate that the intervention could be having a positive effect (i.e. decreasing crime) in the intervention ZIP code relative to the synthetic control unit.
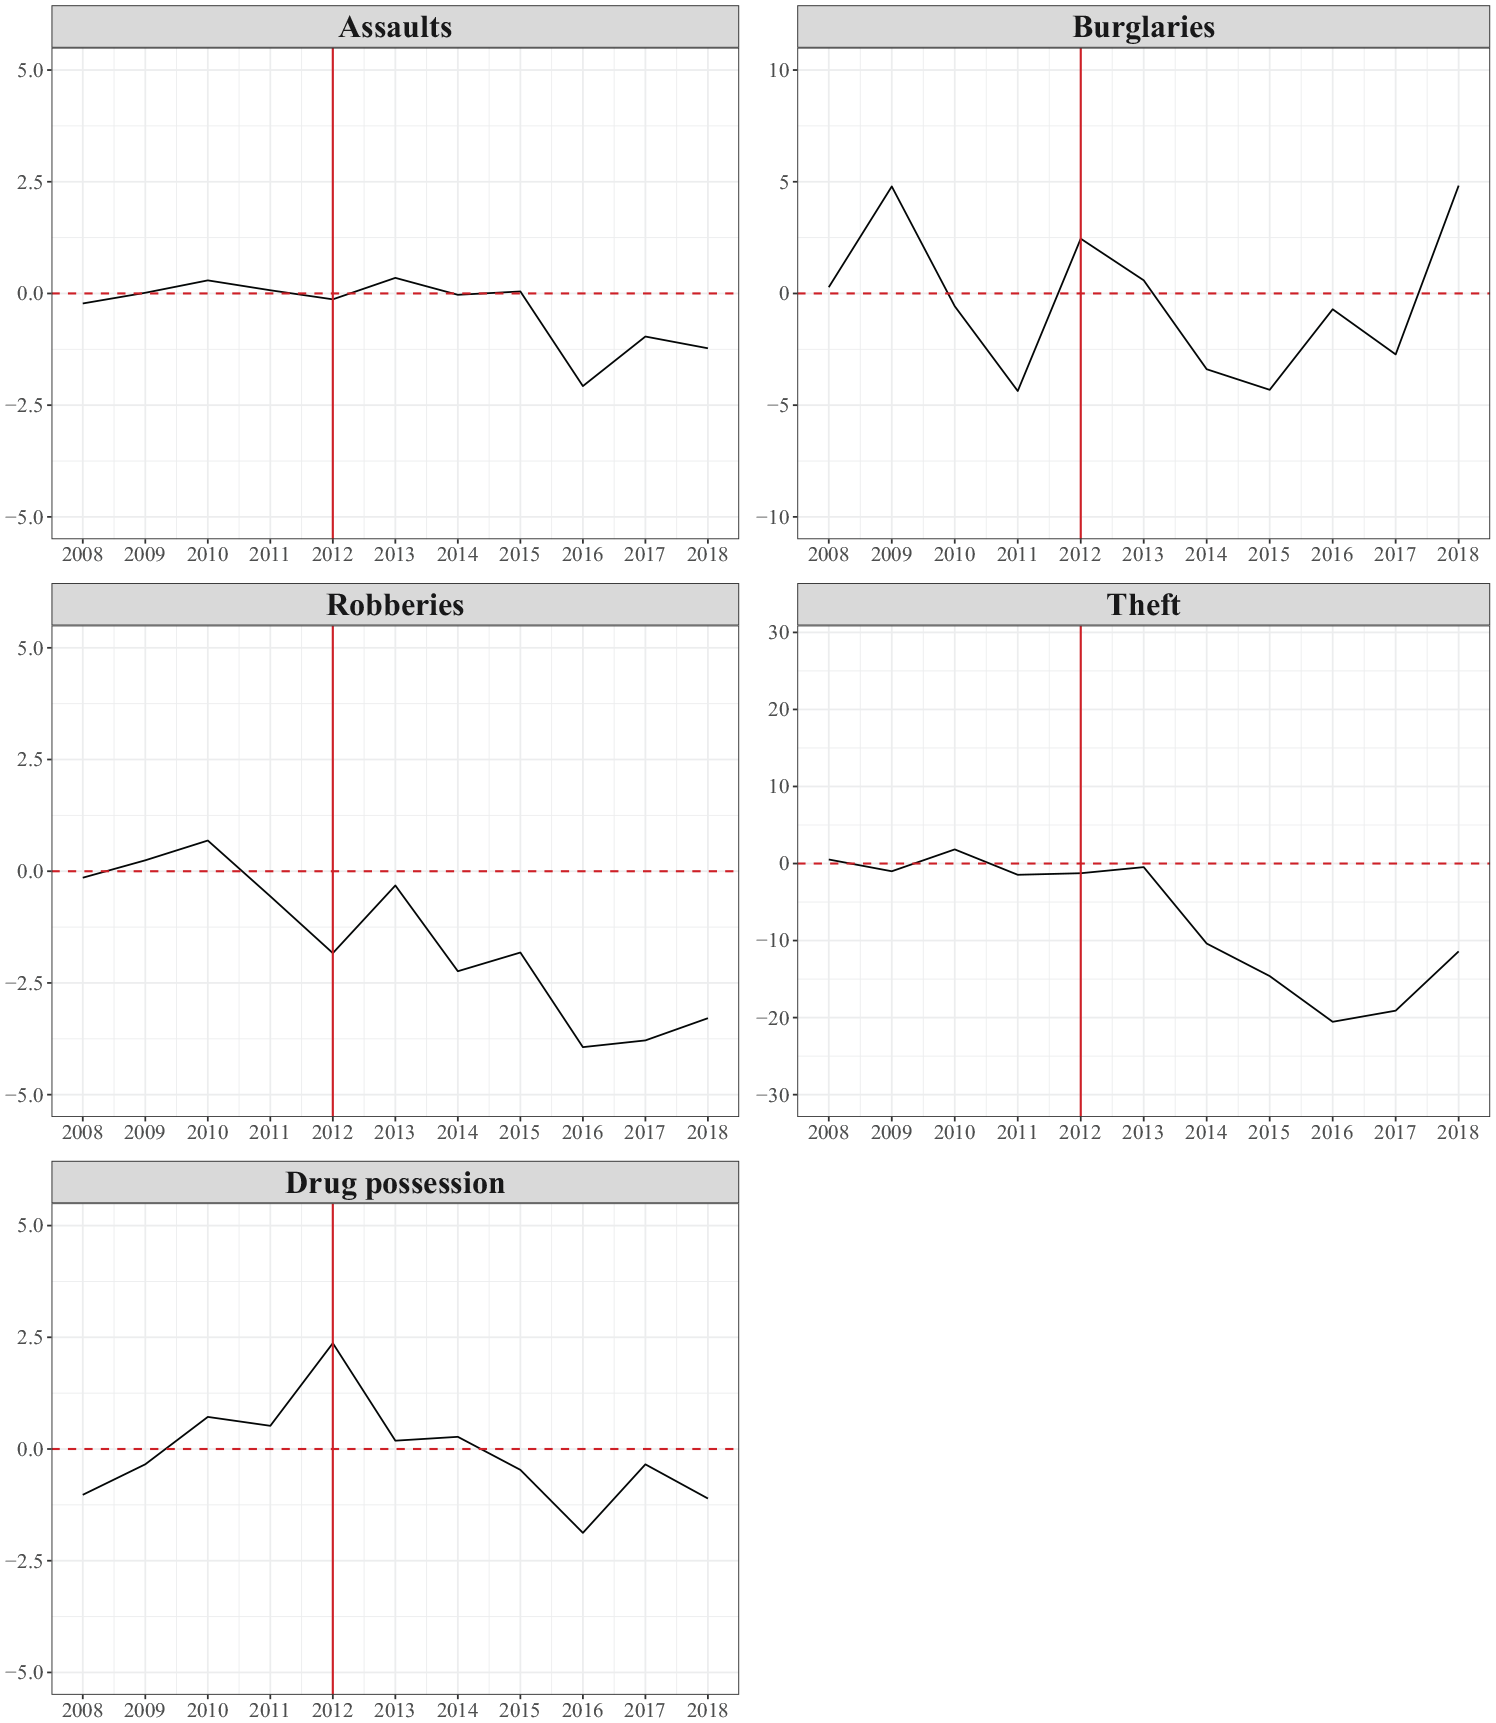
Gaps in crime rates per square mile between the intervention ZIP code and its synthetic control with 2012 intervention.
The intervention could be reducing theft and robbery in the intervention ZIP code relative to the synthetic control. We also see negative effects in assaults and drug possession compared with the synthetic control after 2015. The rate of burglaries fluctuates in both the intervention and synthetic control ZIP codes and no clear effect can be seen.
Difference-in-differences estimates from linear regression comparisons of the intervention and its synthetic control before and after the intervention were negative for all crime types, however only the estimate for theft (−11.1; p < 0.01) was statistically significant. Estimates are shown in Supplemental Material S3.
Sensitivity analyses
Permutations
In addition to calculating difference-in-differences estimates, we ran placebo studies by applying the synthetic control method to ZIP codes that were not host to the initiative during the sample period. The goal of these sensitivity analyses is to assess whether the placebo tests create gaps that are similar to the one for the intervention ZIP code (suggesting no negative effect on crime rates), which would indicate that the results could be driven only by chance. Figure 6 shows the results for the placebo tests. The grey lines represent the gap between each unit and its synthetic control. That is, the grey lines show the difference in assault rates per square mile between each non-intervention ZIP code and its respective synthetic version. The superimposed black line denotes the gap estimated for the intervention ZIP code. For placebo tests of robberies, we removed ZIP code 43217 because of zero values in the outcome.

Graphs of crime rates in the iterations of intervention versus synthetic control unit.
As shown in Table 2, the quasi p-value for post-/pre-treatment MSPE ratio for robberies is 0.1, which suggests that only 10% of donor units from placebo tests have a pre/post MSPE ratio higher than that of the intervention ZIP code. A low ratio indicates a small difference in outcomes between a unit and its synthetic control. Quasi p-values for theft (0.13) and assaults (0.17) also suggest that findings could be due to chance. Quasi p-values for burglaries (0.47), robberies (0.24) and drug possession (0.97) suggest findings are likely due to chance. Ordered bar charts of post-/pre-treatment MSPE ratios for each ZIP code based on 2012 intervention date are shown in Figure 7. Given pre-intervention fit, the intervention ZIP code is less likely than three control ZIP codes for thefts and four control ZIP codes for assaults, to show effect of similar size.
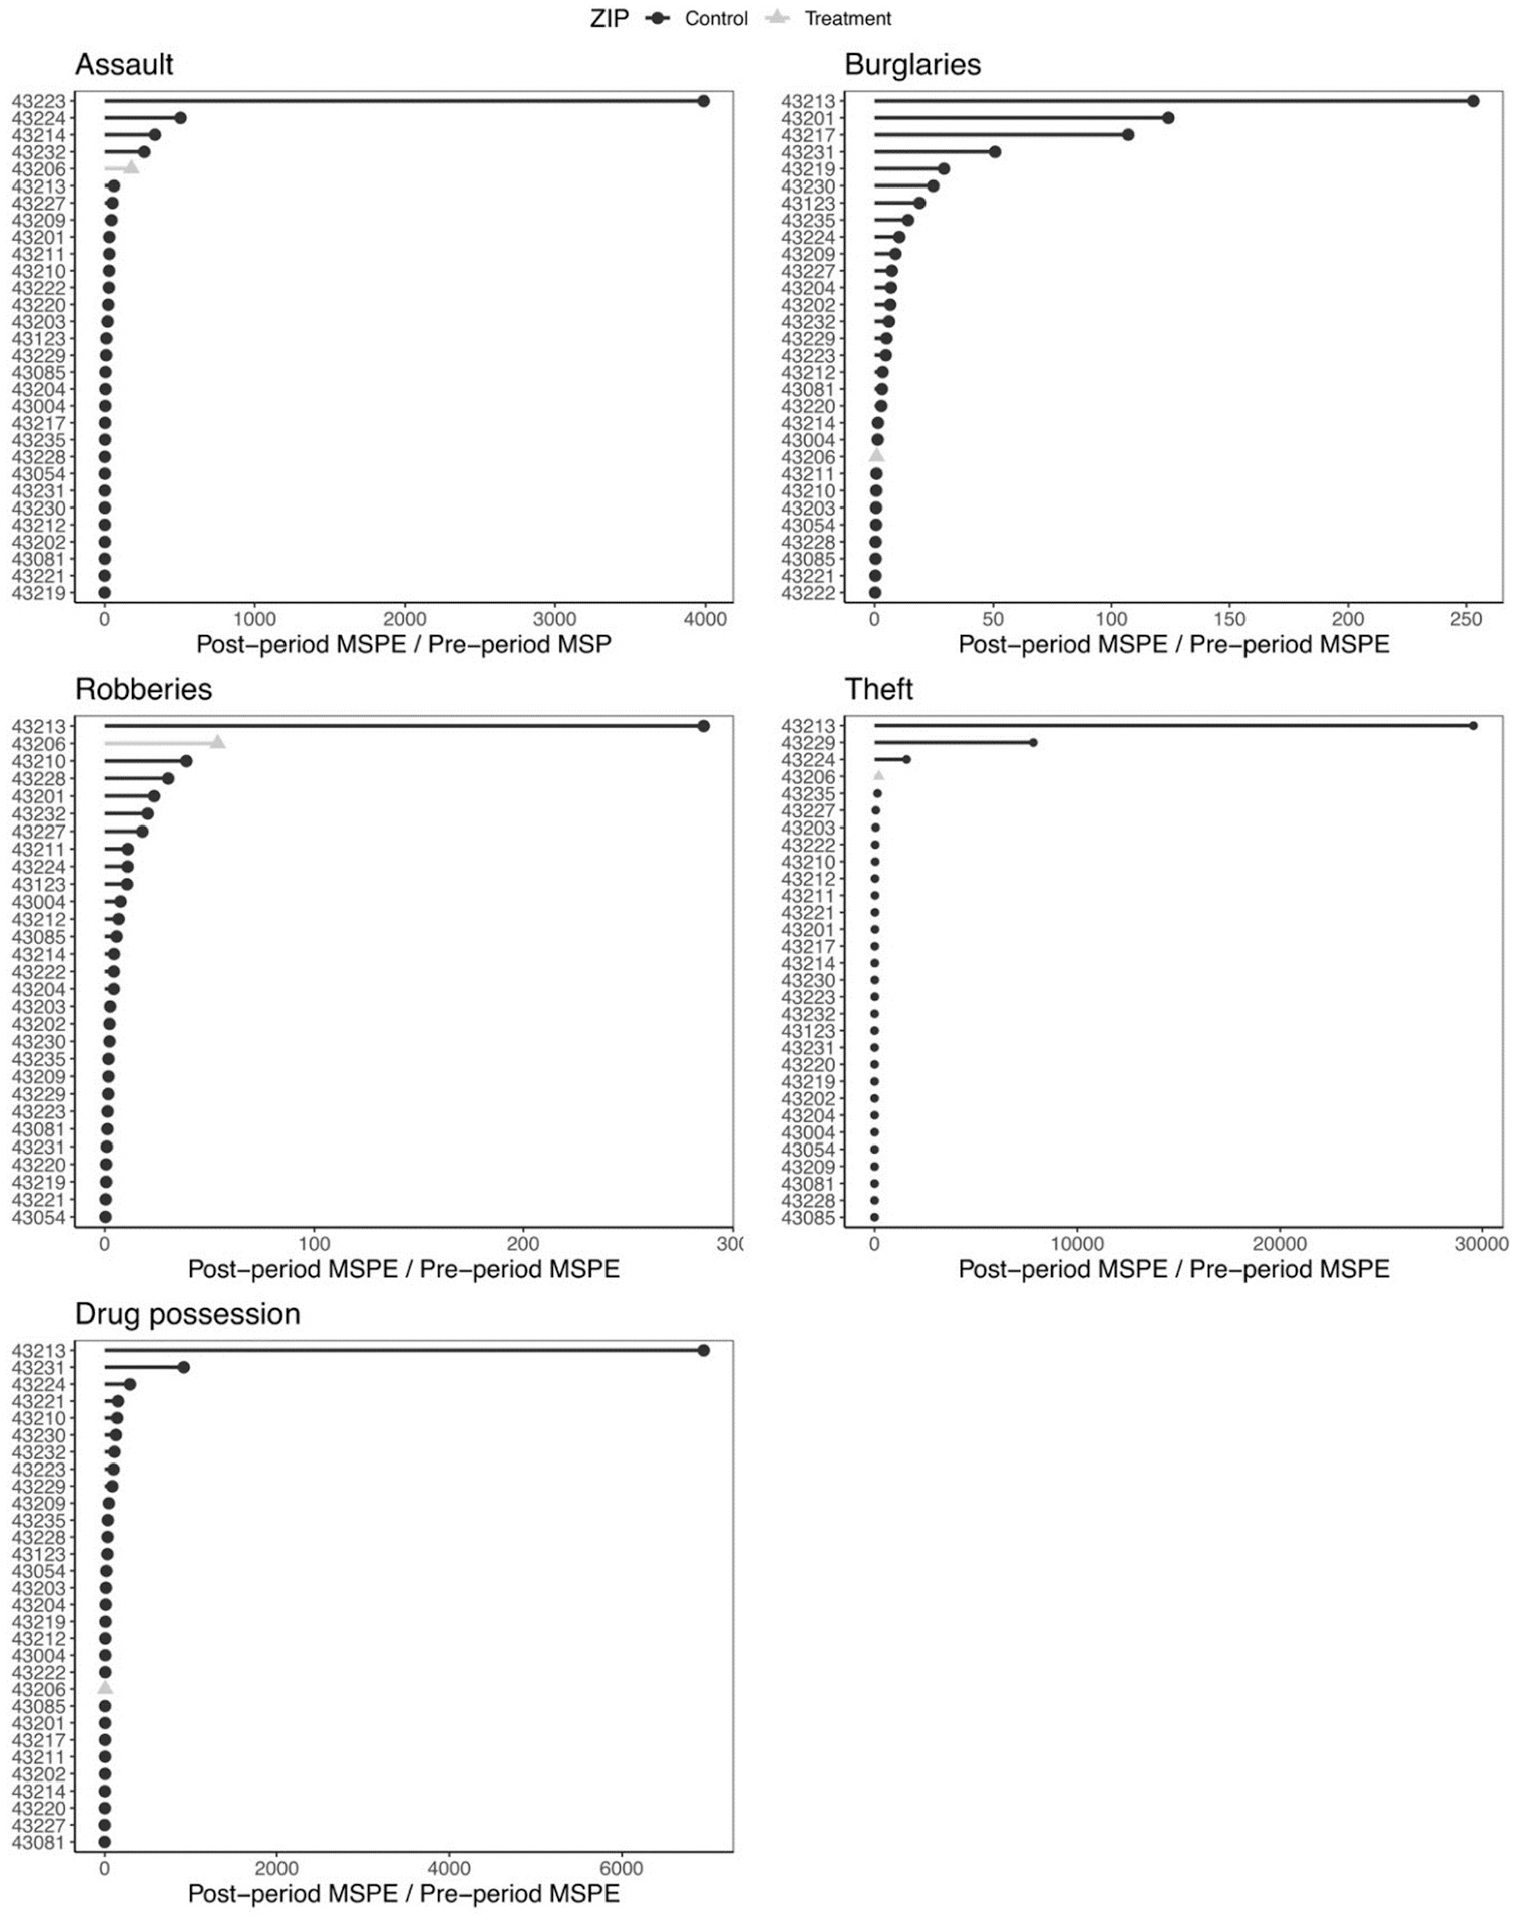
Ordered bar charts of post-/pre-treatment MSPE ratios for each ZIP code based on 2012 intervention date.
Changing the intervention date
The Healthy Homes initiative made the largest number of repairs/rebuilds in 2013 (see Figure 2). Prior to 2013, only about 20 or fewer repairs/rebuilds occurred per year. We tested associations again using 2013 as the intervention start date and including 2008–2012 as the pre-intervention period. We removed ZIP code 43054 from the donor pool because of zero values in the first intervention year for assaults.
Mean post-intervention crime rates (per capita) for the 2013 intervention ZIP code and synthetic control unit are shown in Table 2. Crime rates for the intervention ZIP code (in 2013) and synthetic control unit throughout the study period are shown in Supplemental Material S4. The difference in crime rates between the intervention and synthetic control are shown in Supplemental Material S5. Results for the 2013 intervention date are similar to those for the 2012 intervention date. Pre-intervention fit based on MSPE values is very similar, mean post-intervention effects are in the same direction and of similar magnitude and post-intervention trendlines show similar effect.
Discussion
Our study contributes to a small set of studies that employ a quasi-experimental study design to examine effects of abandoned housing and property remediation on crime. We used a comparative case study design and synthetic control methodology to examine the effects of housing repairs, rebuilds and rehabilitations of the Nationwide Children’s Hospital Healthy Homes initiative in the South Side neighbourhood of Columbus, OH on crime between the years 2008 and 2018. We looked for abrupt differences in crime rates after a substantial number of properties had been rehabilitated in the ZIP code of the South Side neighbourhood, compared with the synthetic control unit. We found mixed evidence of programme impacts. While we did not find evidence of programme effects on burglaries or drug possession, we saw some evidence of positive effect on robberies, assaults and thefts, although findings could be due to chance. The strongest evidence of post-intervention effect was with thefts (quasi p-value = 0.13).
If indeed the programme had a positive effect on reducing thefts, we did not test mechanisms driving this. However, vacant properties have been found to be hotspots for property crimes (Chen and Rafail, 2020; Roth, 2019). The Healthy Home Initiative repaired and rebuilt houses which then became occupied over time. Although some theories point towards poor maintenance of properties signalling a lack of guardianship and increased opportunity for crime, individuals and families occupying new and rebuilt housing also provides new opportunities for interpersonal crime, which may explain why we did not see more prominent effects on robberies and assaults. For example, vacant structures could contain valuable building materials (e.g. copper pipes, tubing or wiring) or other contents targeted for theft and it could be that the housing intervention signalled guardianship and increased informal social control enough to reduce this type of property crime. These structures could also provide cover for illegal activities such as drug dealing, drug use or prostitution and the intervention reduced the opportunity for these activities (Cui and Walsh, 2015; Ellen et al., 2013; Lacoe and Ellen, 2015).
Very few experimental or quasi-experimental studies of housing-related blight remediation interventions have been published (Kondo et al., 2018). Previous studies have found either no effect of rehabilitations (Spader et al., 2016) or effect on violent crimes (Kondo et al., 2015). While our findings do not align with those of these two previous studies, the interventions and contexts were not equivalent and more studies, especially using a prospective approach, are needed in order to situate our findings.
Importantly, the Healthy Homes initiative is not specifically a crime-reduction programme. Crime reduction is, however, a desired ancillary outcome and a core component of improving quality of life in the community. Other potential outcomes include changes in community health, economic development and community pride. Over time, incremental improvements across all of these outcomes has the potential to re-energise this once-thriving community.
Limitations
Owint to the incremental strategy or approach of Healthy Homes, our intervention date did not exactly align with the start of the initiative. With more spatially explicit vacancy data, we could apply a property- or cluster-level treatment-control matching system that could account for the incremental nature of this type of initiative (e.g. see the study of abandoned building remediation by Kondo et al., 2015).
We were also not able to establish with our study the relative contributions of either housing remediation or increasing homeownership on crime outcomes. Nor were we able to control for the effects of other non-housing HNHF-implemented community improvements. We were not able to detect whether the decrease in thefts was a benefit for residents that were present prior to the Healthy Homes initiative intervention, or whether the change in crime could have been due to an influx of new residents, potentially as a result of the programme. We do know that population in the Healthy Homes initiative ZIP code 43206 increased a small amount from an estimated 21,864 in 2010 to 22,144 in 2017 (US Census Bureau, 2010, 2017). In the Census tract that contains most of the Healthy Homes initiative properties, population was estimated to actually decrease slightly from 1784 to 1765. The percent of vacant housing units went from 31.3% to 33.1%, compared with a steady rate at the county level (9.5% to 9.1% between 2010 and 2017), which could indicate that the Healthy Homes initiative was counteracting a spiralling vacancy crisis in the study area and similar neighbourhoods.
Police-reported crimes are imperfect measures of actual illicit behaviours, potentially reflecting differences in residents’ propensity to report incidents to police. However, our SCM approach controlled for demographic characteristics, including race and ethnicity, likely accounting for factors such as lower trust in police among communities of colour (Tyler, 2005). Moreover, while police incident data are sometimes limited in their spatial accuracy at high resolution, we only used crime counts at the ZIP code level, minimising this concern.
Our use of crime incident report data to indicate crime or violence comes with some limitations. While Franklin County has 32 law enforcement agencies, only 27 report to the OIBRS. However, this should not bias our numbers since the number of agencies reporting did not change over the course of the study. Non-systematic changes within these law enforcement agencies (e.g. increase in number of officers or change in patrol methods) during the study period could affect our outcome numbers. We were also not able to compare changes in motor vehicle thefts or drug trafficking because of low counts.
In addition, the ZIP code, our unit of analysis, did not neatly align spatially with the full intervention. Our temporal unit of analysis was also coarse, and other improvements in the study area during and after the intervention year could have biased the estimates. A finer-scale analysis, which would require more detailed spatiotemporal crime and vacancy data, could allow us to focus on the exact areas of investment and potentially detect a stronger signal in crime response. We had to exclude some ZIP codes that contained a small number of home repairs or rehabilitations or where interventions were located in a very small area of the ZIP code. While some of our synthetic controls did show great pre-intervention fit (especially for robberies), overall we may not be able to detect some spatiotemporal aspects of the Healthy Homes intervention.
Despite the limitations of the data available to us, using the SCM allowed us to examine the Healthy Homes initiative’s possible effects on crime using a validated case study method. Approaches such as these will be necessary to understand the effects of the growing number of programmes aimed at improving public safety through small- and medium-sized efforts to improve the physical environment. Community development inter- ventions, for example housing development and parks or greenspace installation, frequently occur at single or clustered sites, in locations where site-level control or outcome data are not fully available. Although the method lacks statistical inference, supplemental analyses such as those conducted in this study suggest that the synthetic control methodology is a viable case-control technique to assess impacts of such community development projects.
Conclusion
Vacant and abandoned lots and buildings, and hazardous housing conditions, present a significant cost to the public, to municipalities and other entities including healthcare institutions. In an effort to improve the health of their patients and their surrounding communities, hospitals such as Nationwide Children’s Hospital, are beginning to invest in neighbourhoods that are often proximal to their institutions and have been adversely impacted by decades of decreasing population and resources associated with histories of inequity, redlining and foreclosure. Large-scale, institutional investment in such housing improvements and in increasing homeownership rates has the potential to create less abandonment and healthier homes for local residents who are in need, as well as to reduce crime rates for entire communities.
Supplemental Material
sj-docx-1-usj-10.1177_0042098021995141 – Supplemental material for Changes in crime surrounding an urban home renovation and rebuild programme
Supplemental material, sj-docx-1-usj-10.1177_0042098021995141 for Changes in crime surrounding an urban home renovation and rebuild programme by Michelle Kondo, Michelle Degli Esposti, Jonathan Jay, Christopher N. Morrison, Bridget Freisthler, Claire Jones, Jingzhen Yang, Deena Chisolm, Charles Branas and Bernadette Hohl in Urban Studies
Footnotes
Declaration of conflicting interests
The authors declared no potential conflicts of interest with respect to the research, authorship, and/or publication of this article.
Funding
The authors received no financial support for the research, authorship and/or publication of this article.

Supplemental material
Supplemental material for this article is available online.
References
Supplementary Material
Please find the following supplemental material available below.
For Open Access articles published under a Creative Commons License, all supplemental material carries the same license as the article it is associated with.
For non-Open Access articles published, all supplemental material carries a non-exclusive license, and permission requests for re-use of supplemental material or any part of supplemental material shall be sent directly to the copyright owner as specified in the copyright notice associated with the article.
