
Abstract
Single-family homes make up a significant portion of the rental housing market in the United States. Single-family rentals grew significantly in recent years, especially with the emergence of large-scale investors in the single-family rental market. We investigate if the rise of single-family rentals provides more housing choice for renter families with children, and if a greater number of single-family rentals provides low-income families with children with access to neighbourhoods with high- or moderate-opportunity education. We utilise the Child Opportunity Index to identify low-, moderate- and high-educational opportunity neighbourhoods and, using both binomial and multinomial logistic regression, examine the relationship between the rise in single-family rentals and neighbourhood opportunity access. We find growth in single-family rentals provides more rental alternatives for families with children but does not provide families with children in poverty access to high- or moderate-opportunity neighbourhoods in education. Growth in single-family rentals does provide access to high opportunity for near-poverty families with children (150–185% of poverty), but only when there are few of these kinds of families and when there are large increases in single-family rentals. Our findings suggest that rental burden prevents families with children in poverty from accessing high- and moderate-opportunity neighbourhoods, and the Housing Choice Vouchers programme does not help.
Introduction
There are significant differences in school quality and educational resources for children across neighbourhoods in the US. High-performing schools are often concentrated in more advantaged neighbourhoods where there are greater social, economic and instructional resources (Owens and Candipan, 2019), especially in the suburbs (Rury, 2020). Efforts to reverse exclusionary zoning practices to better integrate neighbourhoods and offer low-income families the chance to avail of suburban amenities, including high-performing schools, are seen as vital for social equity (Whittemore, 2021). Urban scholars and practitioners are right now hotly debating the elimination of single-family zoning for this purpose (Manville et al., 2020; Wegmann, 2020a). In addition, federal housing policy, through the use of tenant-based housing vouchers, remains focused on connecting poor families to better-resourced neighbourhoods (Rosen, 2020), including those with high-quality schools. Unfortunately, the emphasis on suburban single-family homeownership and, as a consequence, the lack of rental housing in advantaged neighbourhoods can prevent this kind of integration.
Yet, in more recent years, there was significant growth in the single-family rental (SFR) housing market (Joint Center for Housing Studies, 2020). Could this provide the opportunity needed for low- and moderate-income families to access more advantaged neighbourhoods that are better resourced for their children’s education? This study investigates this possibility, examining if a rise in single-family rentals means better access to high- or moderate-opportunity neighbourhoods for families with children and those families with children in poverty or near poverty.
It is important to note that scholars question the merits of housing mobility programmes for low-income families (Goetz, 2018), suggesting that strategies like tenant-based vouchers do not lead to housing integration or upward mobility (Rosen, 2020). There is also debate over the efficacy of the elimination of single-family zoning (Kendig, 2020). In this paper, we are less concerned with evaluating the strategies or virtues of neighbourhood integration but rather investigate if this is even possible with the rise of SFRs. We aim to determine if additional SFRs, first, increase housing options for families with children and second, provide access to high or moderate childhood educational opportunity neighbourhoods for families with children in poverty or near poverty (Pfeiffer and Lucio, 2015).
Single-family units are a substantial component of the rental market in the United States. According to a recent study by Harvard’s Joint Center for Housing Studies (Joint Center for Housing Studies, 2020), about a third of the nation’s rental units were single-family in 2018. Almost 15 million households lived in SFRs in 2019 (US Census, 2019). Following the foreclosure crisis, the SFR market grew substantially, increasing by 18% between 2008 and 2018 (Joint Center for Housing Studies, 2020). Single-family homeowners opted to rent out their homes rather than attempt to sell them during the housing market slump. In addition, investors purchased, in some cases, large portfolios of foreclosed homes to rent, taking advantage of the availability of vacated properties at a steep discount (Fields et al., 2016; McMillan and Chakraborty, 2016). Individual or small investors are, by far, the biggest owners of SFRs (Joint Center for Housing Studies, 2020), but the market share by institutional investors in SFRs has grown in recent years (Charles, 2020a, 2020b; Chilton et al., 2018; Christophers, 2022; Colburn et al., 2021; Fields, 2018; Geiger and Walker, 2021), driven in part by the activities of Real Estate Investment Trusts (REITs) (Charles, 2020b) in a process deeply rooted in the increasing financialisation of housing (Christophers, 2022).
In our investigation into the effects of the rise of SFRs, we find that, on the national scale, they do provide rental alternatives for families with children, but, because of unaffordable rents and a lack of Housing Choice Vouchers (HCV) in moderate- and high-opportunity neighbourhoods, these SFRs do not provide access for families with children in poverty or near poverty to better educational opportunities. This finding is significant given the fact that, due to a lack of federal spending on housing programmes, an overwhelming number of low-income families with and without children rely heavily on the private rental market for housing. Reliance on private sector housing does not, we argue, provide these families with access to opportunity neighbourhoods for their children’s education.
We begin this paper with an examination of what the literature says about the characteristics of neighbourhoods where SFRs grew, and how this growth intersects with opportunity. In this section, we provide the background for our analysis that seeks to link the rise of SFRs and access to neighbourhoods with better educational opportunities for children. We then discuss our research design strategy, including a description of our data, variables and methods. Next, we provide the results of our analysis. We then offer a discussion of the meaning and implications of our findings.
Background on possible benefits of single-family rental
A recent study notes that families with children and, importantly, families with children in poverty, are more likely to live in SFRs than in other types of rental housing (Pfeiffer et al., 2021). A rise in SFRs can then have a positive outcome for these kinds of renter families, especially those with larger family sizes. In 2015, about 17% of SFRs had four or more bedrooms compared to just 2% of rentals in buildings of two to 19 units (Pfeiffer et al., 2021). In addition, research suggests families with children prefer single-family housing, in part, for reasons of privacy, outdoor space and amenities often associated with single-family home neighbourhoods (Wegmann, 2020b). The growth in SFRs, therefore, has the potential to fulfil the housing preferences and needs of renter families with children.
Second, SFRs could provide renter families with more choices in the kinds of neighbourhoods where they can live, especially in the case of minority renter families with children. A study of single-family home foreclosure conversions to rentals in Florida found that, because of increased SFRs, African-American families gained access to White neighbourhoods (Ihlanfeldt and Mayock, 2018). According to a recent study in Atlanta, rising SFRs increase the options for renters with children to live in suburban ethnically diverse neighbourhoods with good school systems (Immergluck, 2018). Other studies reveal similar findings that suggest SFRs can lead to more racial integration (Ihlanfeldt and Yang, 2021). A national study found that neighbourhoods where SFRs grew over the last ten years or so became more ethnically and racially diverse, although high gains in SFRs did not necessarily equate with high diversity gains (Pfeiffer et al., 2021).
Third, the rise in SFRs could provide renter families with access to more advantaged neighbourhoods. In her study of SFR REITs, Charles (2020b) found that one REIT, Real Estate Investment Trusts., sought out SFRs in neighbourhoods with higher home values, fewer families in poverty, and higher quality schools, often in suburban locations. The location of SFRs in these kinds of neighbourhoods could, it seems, offer certain kinds of amenities for families with children, including high-performing schools. A study of SFR growth in the 2000s found that SFRs grew faster in more advantaged than disadvantaged neighbourhoods, offering again the potential for better access for renters (Schwartz and McClure, 2014), although this study does not determine if low-income renters specifically gained access as a result.
Other studies determine if the growth in SFRs has led to any real gains in economic integration. In one study, scholars found no relationship between the rise in SFRs and the likelihood that low-income renters could gain access to higher-income neighbourhoods (Pfeiffer et al., 2021). Another study of SFRs in Phoenix, however, found evidence that, because of investor purchases of foreclosed homes to rent following the foreclosure crisis, low-income households could access a greater range of neighbourhoods. More specifically, through an examination of data from 2004 to 2014, Pfeiffer and Lucio (2015) found that conversion of single-family home foreclosures to rentals provided low-income renters the chance to rent in advantaged neighbourhoods, with low-income households who utilised subsidised housing vouchers making gains in the neighbourhood opportunity structure.
Overall, the research suggests that the growing SFR market provides renter families with children, including minority renter families with children, with more housing choices. In addition, some studies suggest that low-income renter families gained access to advantaged neighbourhoods because of a rise in SFRs following the foreclosure crisis, although it should be noted there is only one study of this kind, and it is for the city of Phoenix.
In this paper, we aim to expand on this literature in several ways. First, research suggests that more SFRs benefit families with children, but is it the case that those neighbourhoods with rising SFRs also experienced a rise in renter families with children? Second, questions remain about whether SFRs, especially in more advantaged neighbourhoods, are within reach of low-income families with children. It could be that there are more SFRs located in advantaged neighbourhoods, but it could also be that the cost-burden is too high for low-income renter families to avail of this housing (Acevedo-Garcia et al., 2016).
To delve into these possibilities, we ask three questions in this paper: (1) are neighbourhoods with increasing SFRs more likely to have families with children than neighbourhoods with no change or a decrease in SFRs; (2) are high and moderate childhood educational opportunity neighbourhoods more likely to experience a growth in SFRs than low childhood educational opportunity neighbourhoods, and what are the characteristics of neighbourhoods with varying degrees of childhood educational opportunity; (3) did renter families with children in poverty or families with children whose incomes are between 150% and 185% of poverty (i.e. near poverty) gain access to high- or moderate-opportunity neighbourhoods because of rising SFRs in these neighbourhoods? We focus our analysis on the timeframe between 2010 and 2015.
For these latter two questions, thus far, the research has found a positive relationship between SFRs and low-income household access to advantaged neighbourhoods in one city, Phoenix. Firstly, our paper, based on an examination of national data across neighbourhoods of the 100 largest Meropolitan Statistical Areas (MSAs) in the United States, considers a broader range of cities.
Second, in this study, we focus on neighbourhood educational opportunities for children specifically. We do this for a couple of reasons. Primarily, as mentioned, SFRs and single-family neighbourhood amenities, including high-performing schools, are important assets for renter families with children. Furthermore, the neighbourhood opportunity literature recognises the benefits, educational and otherwise, for children living in advantaged over disadvantaged neighbourhoods (Chetty et al., 2016). By the third grade, the impact for children living in a severely disadvantaged neighbourhood is equivalent to missing one whole grade of school (Sampson, 2008). The potential benefits for children living in neighbourhoods with high educational opportunities are significant .
Third, some studies consider the relationship between the growth in SFRs and racial, ethnic and income integration. Our study focuses on the relationship between the growth in SFRs and the accessibility of low-income families with children to neighbourhoods of varying child educational opportunities. While potentially related to racial, ethnic and income integration, our research approach and question are slightly different, although, as we demonstrate later, we consider race and income as important variables in our statistical analyses. Racial disparity in children’s educational outcomes is well-documented (Conchas et al., 2017), and, additionally and relatedly, there are serious racial inequities in neighbourhood opportunity. This research adds to this body of work.
Data, variable selection and statistical models
We utilise data from the Child Opportunity Index (COI) (diversitydatakids.org, 2020) to measure neighbourhoods with different levels of childhood educational opportunity. We use the most recent COI data available for the year 2015. The COI, developed in 2014 by researchers from Brandeis University and the Kirwan Institute for the Study of Race and Ethnicity at Ohio State University, measures the opportunity of a neighbourhood relative to all the other neighbourhoods located in the same metropolitan area.
In our study, we use the index in the domain of education. The index includes 12 different indicators listed in Appendix 1. The researchers who developed the COI for childhood education chose these indicators based on a grounded and comprehensive cross-disciplinary literature review of the most prominent neighbourhood features that affect children’s outcomes in education (Acevedo-Garcia et al., 2020). In technical documentation, the index creators note the sources of data for each indicator (Noelke et al., 2020), and conduct various tests to determine the predictive and content validity of the indicators. Details on the weighting schema used when developing the index are outlined in this document (Noelke et al., 2020). In the COI database, there is a variable that indicates if a neighbourhood is very high, high, moderate, low or very low in terms of childhood educational opportunity. In our statistical analysis, we collapse these categories into low-, moderate- and high-opportunity neighbourhoods.
In addition to data from the COI database, we utilised data from the American Community Survey five-year estimates to obtain neighbourhood residents’ and renters’ demographics and socio-economics for 2015. We also used data from the US Department of Housing and Urban Development to identify Housing Choice Vouchers by census tract for 2015.
There are a couple of shortcomings in our data. First, we might observe a circular effect between rising SFRs and childhood opportunity since SFRs, if occupied by lower-income groups between 2010 and 2015, might result in a decline in the childhood opportunity index score by 2015. We want to note, though, that our focus is on whether children in poverty or near poverty are accessing high-opportunity neighbourhoods, regardless of how the neighbourhood opportunity level is changing over time or might change by them moving into the neighbourhood. Second, we do not use household-level data, and therefore do not know the specific characteristics of tenants living in SFRs or the SFRs themselves. Our analysis can only imply neighbourhood-level effects.
We use these data to develop two different regression models. The first model is a binary logistic model which answers the first question (are neighbourhoods with increasing SFRs more likely to have families with children than neighbourhoods with no change or a decrease in SFRs?) by investigating the relationship between a binary variable (an increase or decrease or no change in SFRs from 2010 to 2015 in a neighbourhood) and the proportion of families with children, controlling for a set of demographic and socio-economic neighbourhood measures. The second model is a multinomial logistic regression that answers the second set of questions (are high and moderate educational opportunity neighbourhoods more likely to have growth in SFRs than their counterpart low-opportunity neighbourhoods, and what are the characteristics of neighbourhoods with varying degrees of childhood educational opportunity?) by examining the neighbourhood level child opportunity in education (low, moderate or high childhood opportunity neighbourhood) with increasing SFRs, controlling for variation of neighbourhood characteristics.
The variables used in Model 1 and Model 2 are listed in Table 1.
Descriptive statistics of household and rental household characteristics.
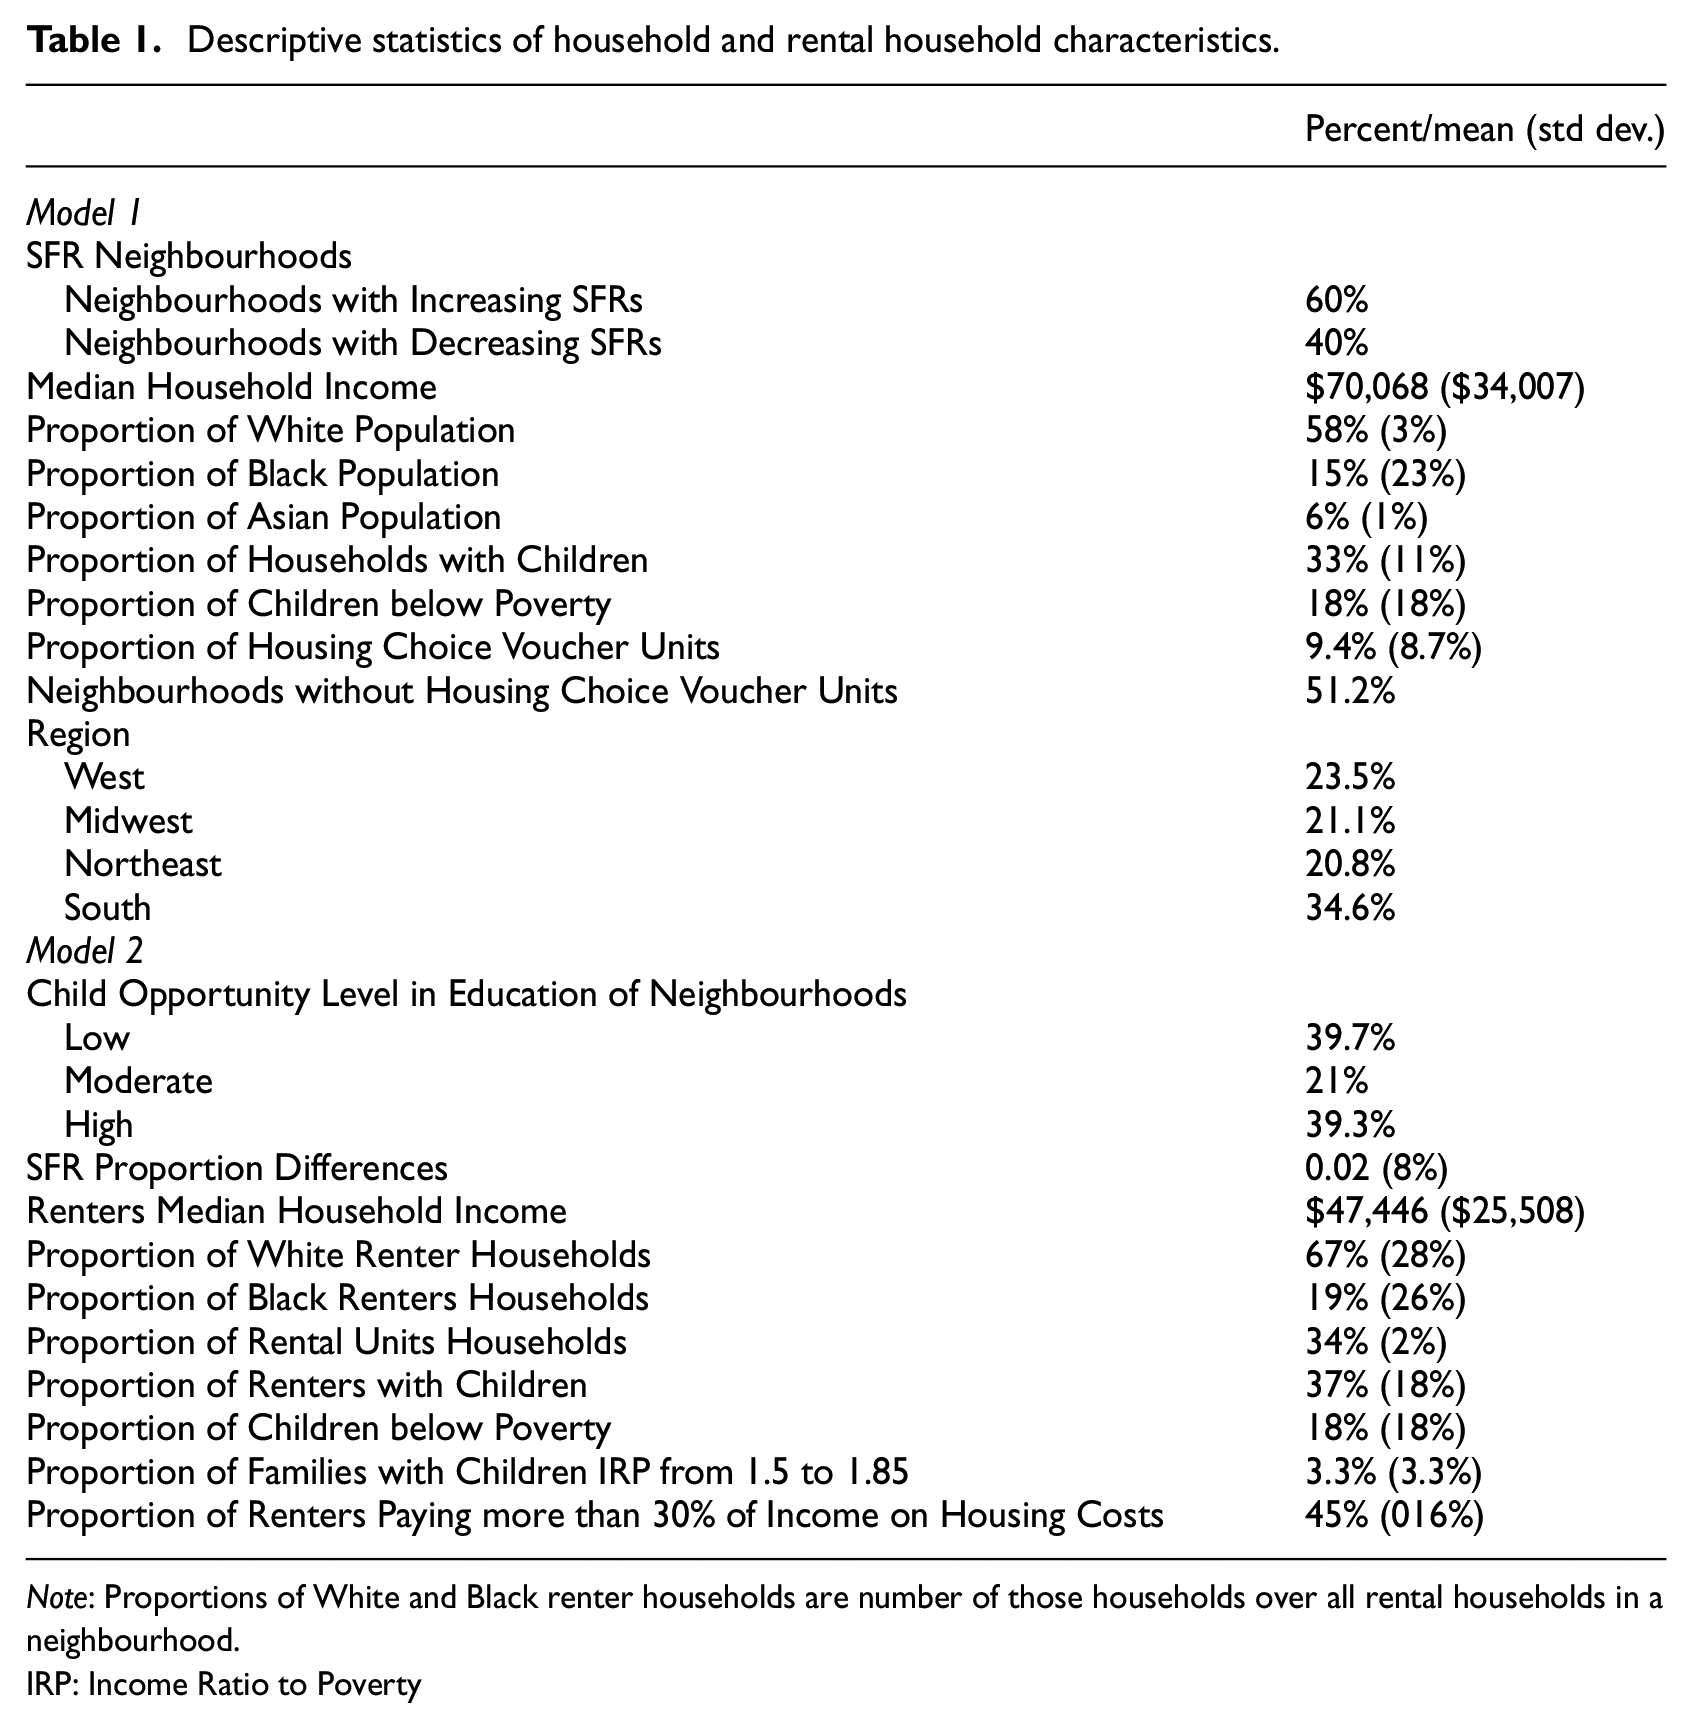
Note: Proportions of White and Black renter households are number of those households over all rental households in a neighbourhood.
IRP: Income Ratio to Poverty
Model 1 variables
Dependent variable
The dependent variable is a binary categorical variable where neighbourhoods fall into two categories: they either have experienced an increase in the percentages of SFRs (60% of the sample), or a decrease or no change in the percentage of SFRs (40% of the sample). For these measures, we subtracted the percentage of SFRs in a tract in 2010 from the percentage of SFRs in that tract in 2015.
Variable of interest
Our variable of interest is the proportion of families with children under 18 years old in a neighbourhood in 2015. This variable is a continuous variable and is presented as a percentage.
Control variables
The model controls for the demographic and socio-economic neighbourhood characteristics in 2015 including household income level, children below poverty, families with children and racial structure. These variables are continuous, typically in percentages. In addition, we control for percent of housing units utilising Housing Choice Vouchers (HCV) for each neighbourhood. We note that 51.2% of neighbourhoods in our sample had no HCVs at all. On average, 9.4% of housing units had HCVs in those neighbourhoods that utilised these vouchers. Finally, we have a set of dummy variables for the four main regions of the United States with the West being the base region.
Model 2 variables
Dependent variable
The dependent variable in the second regression model is a categorical variable; the level of child opportunity in education for a neighbourhood in 2015. This variable indicates which neighbourhoods fall into one of three categories: (1) very low and low educational opportunity; (2) moderate educational opportunity; and (3) high and very high educational opportunity.
Variable of interest
The main variable of interest in this model is the differences in the percentage of SFRs from 2010 to 2015, which is a continuous variable ranging from −1 to 1.
Control variables
Other variables in the model include the race of renters; the percent of renters with children; the proportion of rental units in a neighbourhood; affordability measures which in this case is the proportion of renters paying more than 30% of their income on housing. Non-renter-related variables include the percentage of children below poverty and the percentage of families with children where the income-to-poverty ratio is 1.5 to 1.85 (what we refer to as families with children near poverty). We also include the percentage of housing units with Housing Choice Vouchers (HCV) units. Like Model 1, we control for the four US Regions. We utilised 2015 data for all these variables.
The results from Model 2, the multinomial logistic model, motivated further investigation into the possibility that the rise of SFRs provides children in poverty and families with children near poverty access to neighbourhoods of high educational opportunity. This is our third research question: did renter families with children in poverty or families with children whose incomes are between 150% and 185% of poverty (i.e. near poverty) gain access to high- or moderate-opportunity neighbourhoods because of rising SFRs in these neighbourhoods? We answer this question by including two interactions. First, we created an interaction between differences in SFRs over time and the proportion of children in poverty for different opportunity neighbourhoods. Second, we interacted the differences in SFRs over time and the proportion of families with children near poverty for different opportunity neighbourhoods.
Sample neighbourhoods
To define our sample, we identified neighbourhoods with high rates of single-family units using a Single-Family Location Quotient (SFLQ) which was calculated as follows:

where the SFLQ measures the percentage of single-family units of census tract i in 2015 compared to the percentage of the total single-family units in the Metropolitan Statistical Area (MSA) j where census tract i is located. Charles (2020a) used this same equation in her study of SFRs. A count of SFLQ equal to 1.0 means that the percentage of SF units in a census tract is the same as the percentage of all SF units in the MSA where that tract is located. More than 1.0 means that the census tract has more SF units compared to its MSA, and less than 1.0 means that it has fewer SF units. In our study, we identified SF neighbourhoods as census tracts that have a SFLQ measure that is above or equal to 1.25. Out of the 47,000 census tracts within the 100 largest MSAs, we identified approximately 41,000 as SF neighbourhoods (about 88% of all census tracts in these MSAs).
Results
We first present the results for the following question: are neighbourhoods with increasing SFRs more likely to have families with children than neighbourhoods with no change or a decrease in SFRs?
Table 2 shows the coefficients and odds ratios of the binomial logistic regression. The chi-square test shows that the model is a good fit (χ2 = 239.20, p < 0.001).
Binomial Logistic Regression where the dependent variable is change in single family rentals (SFRs) between 2010 and 2015 (1 = increase in SFRs and 0 = decreased or no change in SFRs).
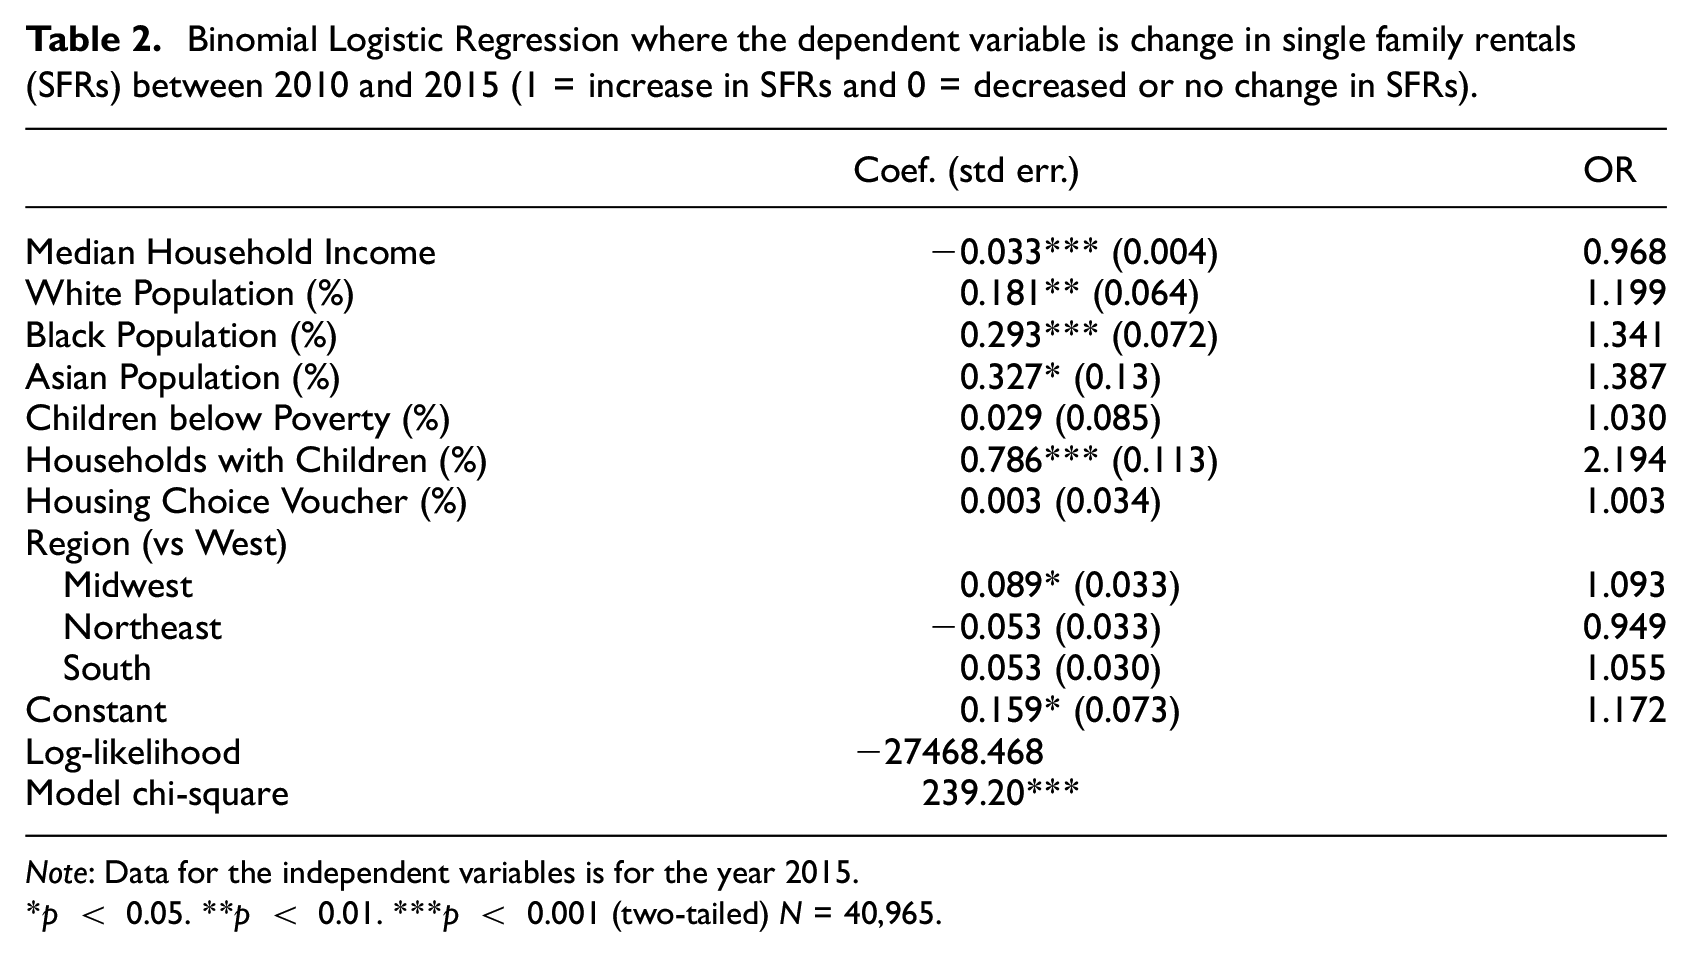
Note: Data for the independent variables is for the year 2015.
p < 0.05. **p < 0.01. ***p < 0.001 (two-tailed) N = 40,965.
Focusing on our variable of interest, we find that for every one percent increase in households with children in a neighbourhood, the odds that this neighbourhood experienced increased SFR is 2.2 times more likely compared to neighbourhoods where SFRs decreased or had no change. SFRs increased considerably in neighbourhoods with more households with children. As other studies suggest, the growth in SFRs provides housing to renter families with children.
Yet, there are some caveats to this finding. We find no statistically significant relationship between children below poverty and SFR increase or between the presence of Housing Choice Vouchers (HCV) and a rise in SFRs. So, while growth in renter families with children corresponds with rising SFRs, this is not the case with families with children in poverty or those families who might be using HCVs.
Some other statistically significant results are interesting. Neighbourhoods where SFRs increased were more likely to have lower rather than higher household incomes, controlling for other characteristics. Although SFRs increased in neighbourhoods with White, Black and Asian populations, the increases in SFRs were much higher for those neighbourhoods with higher percentages of Black and Asian residents. Therefore, similar to other studies, we see higher rates of SFR growth in minority neighbourhoods.
To summarise findings from this first model, SFRs were more likely to increase in neighbourhoods where there were households with children. They were also more likely to increase in neighbourhoods with lower-income households and in neighbourhoods with more minority residents. Finally, and this is significant, SFRs were not more likely to rise in neighbourhoods with households with children in poverty or neighbourhoods with HCVs. This indicates that the growth in SFRs in recent years does not necessarily benefit poor children or those households who might rely on subsidies to support their housing needs. We present the results for Question 2 (are high-opportunity and moderate childhood educational opportunity neighbourhoods more likely to experience the growth of SFRs than low childhood educational opportunity neighbourhoods, and what are the characteristics of neighbourhoods with varying degrees of childhood educational opportunity?)
In Table 3, in part A, we list the percentages of total SFRs over the total occupied units in low-, moderate- and high-opportunity neighbourhoods for childhood education. Between 2010 and 2015, there was an overall increase in SFRs percentages in all types of neighbourhoods. The increase is significantly greater in the high-opportunity neighbourhoods (10.4%), and at a relatively slower pace in the moderate- and low-opportunity neighbourhoods (1.2% and 1.9% respectively). This growth in SFRs especially in high childhood educational opportunity neighbourhoods seems promising, potentially improving housing and neighbourhood choices for renters. Yet, there are questions about whether it means improved access to more advantaged neighbourhoods for low-income families with children and children in or near poverty.
Descriptive statistics for the percentage of SFRs (Part A) and results of multinomial logistic regression (Part B).
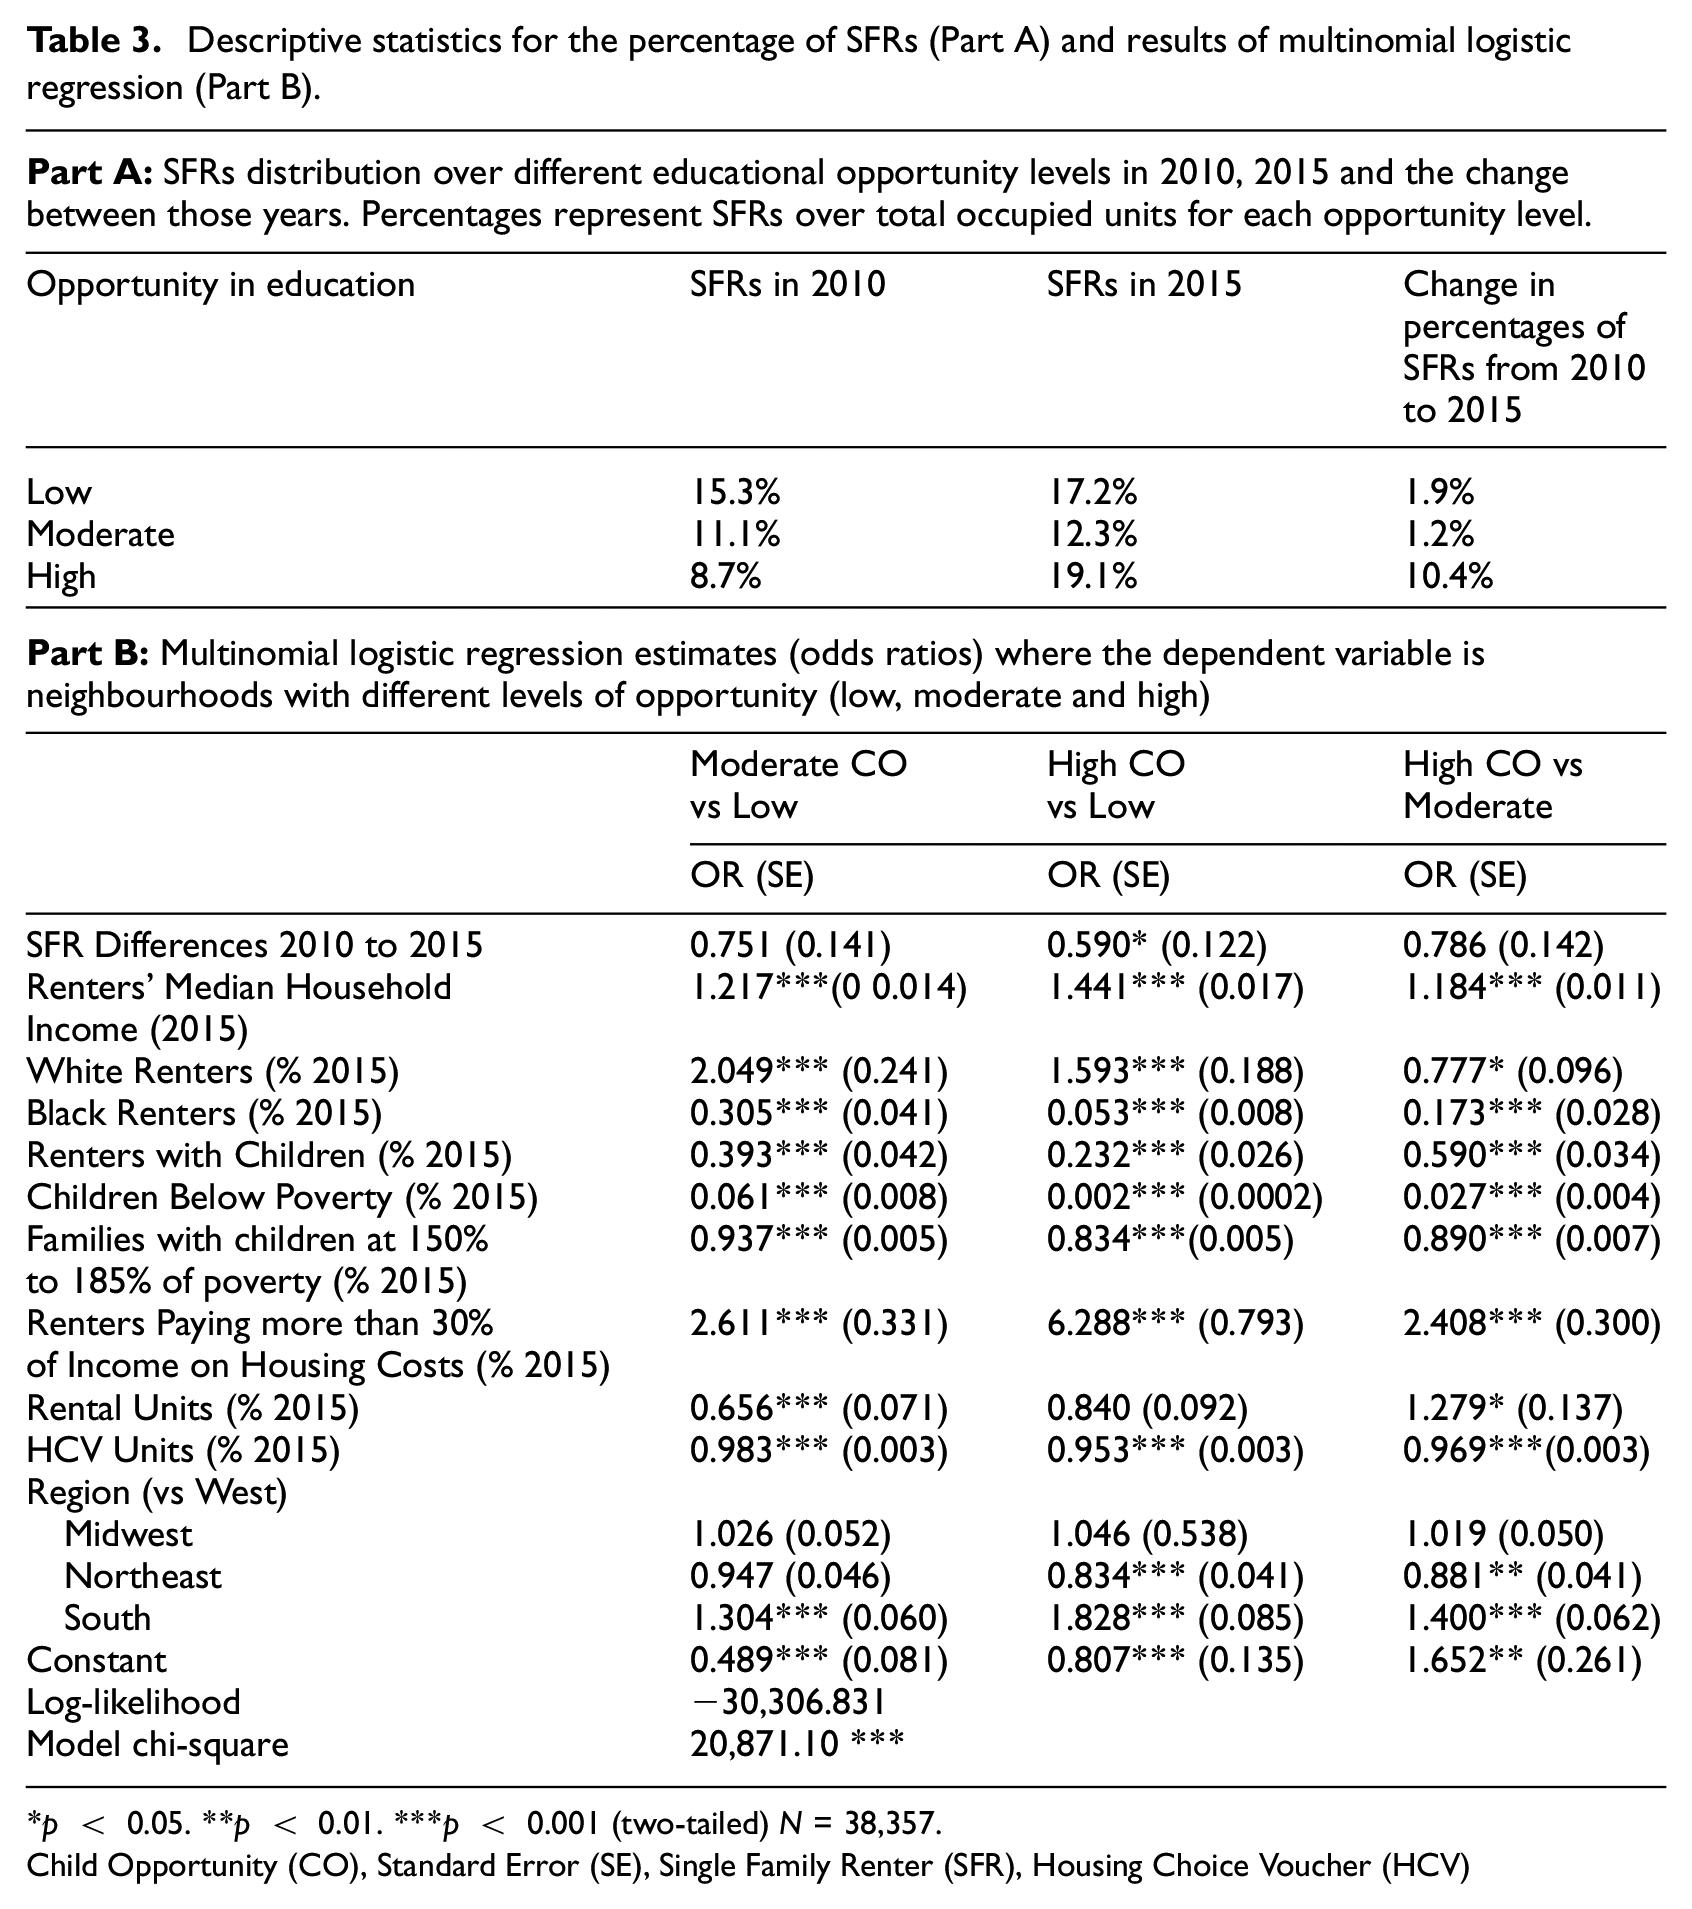
p < 0.05. **p < 0.01. ***p < 0.001 (two-tailed) N = 38,357. Child Opportunity (CO), Standard Error (SE), Single Family Renter (SFR), Housing Choice Voucher (HCV)
The results from our multinomial logistic regression are listed in Table 3, part B. This table shows the odds ratios from this model. The chi-square test shows that the model is a good fit (χ2 = 20871.10, p < 0.001).
Focusing on our variable of interest, we find that for every unit increase in the percentage of SFRs in a neighbourhood, the odds that neighbourhood was a high- rather than low-opportunity neighbourhood decreased by 41%. This finding suggests SFRs were much more likely to grow in neighbourhoods where childhood educational opportunity was lowest.
There are several findings relevant to our interest in access to better opportunity neighbourhoods. Importantly, we found that for every unit increase in the proportion of children in poverty in a neighbourhood, the odds of being a moderate-opportunity neighbourhood relative to being a low-opportunity neighbourhood decreased by 93.3%. Meanwhile, for every unit increase in the proportion of children in poverty in a neighbourhood, the odds of being a high-opportunity neighbourhood decreases by 97.3% relative to being a low-opportunity neighbourhood, and by 97.2% relative to being a moderate-opportunity neighbourhood. For families with children between 150% and 185% of the poverty level, for every unit increase in the proportion of those families in a neighbourhood, the odds of being a moderate-opportunity neighbourhood relative to being a low-opportunity neighbourhood decreases by 6.3%. Meanwhile, for every unit increase in the proportion of these kinds of families, the odds of being a high rather than low opportunity neighbourhood decreases by 16.6%, and by 11% when we compare low- to moderate-opportunity neighbourhoods. In other words, and not surprisingly, children in poverty and near-poverty families with children are more likely to live in low-opportunity neighbourhoods.
Regarding housing affordability, we found that renters in moderate- and high-opportunity neighbourhoods were the most cost burdened. For every unit increase in the proportion of renters paying more than 30% of income on housing, the odds of living in a moderate- over a low-opportunity neighbourhood increases by 2.6 times. Meanwhile, for every unit increase in the proportion of renters in a neighbourhood paying more than 30% of income on housing, the odds of being a high- over a low-opportunity neighbourhood increases by 6.2 times, and by 2.4 times in a high- over a moderate-opportunity neighbourhood.
The model also controlled for percentages of Housing Choice Voucher (HCV) rental units. Results show that for every unit increase in the percentage of HCVs in a neighbourhood, the odds of being a moderate- rather than a low-opportunity neighbourhood decreases by 1.7%. Meanwhile, for every unit increase in the percentage of HCVs in a neighbourhood, the odds of being a high-opportunity neighbourhood relative to being a low-opportunity neighbourhood decreases by 4.7%, and relative to being a moderate-opportunity neighbourhood by 3.1%.
To sum up, low-opportunity neighbourhoods, compared to neighbourhoods at other opportunity levels, were associated with higher increases in SFRs, higher rates of HCVs, lower levels of income, higher Black populations, and more families with children, children in poverty, and families with children at near-poverty levels. Finally, in terms of cost-burden, renters of high-opportunity neighbourhoods are the most cost-burdened, followed by moderate-opportunity neighbourhoods. These findings suggest that, despite a rise in SFRs there is little chance that SFRs in high- or moderate-opportunity neighbourhoods are affordable or have housing subsidies for low-income renters. To delve deeper into this, we provide the results to question 3.
We now present the results related to Question 3 (did renter families with children in poverty gain access to high- or moderate-opportunity neighbourhoods because of rising SFRs in these neighbourhoods?)
To answer this question, we utilise an interaction term in the multinomial logistic regression model. We interact, for neighbourhoods at different levels of opportunity, the change in SFRs over time with different percentages of children in poverty. We also interact the change in SFRs over time with the percentage of families with children at different levels of near poverty (i.e. different income-to-poverty ratios). One way to identify these marginal effects is through a graphical comparison of predicted probabilities plots before and after the interaction. These graphs are outlined in Figure 1.

(Part A) Predicted probabilities of living in a specific level of neighbourhood opportunity for children in poverty versus change in percentages of SFRs. Plots are shown before interaction for neighbourhoods of low 1(a), moderate 1(b) and high opportunity 1(c), and after interaction for neighbourhoods of low 2(a), moderate 2(b) and high opportunity 2(c). (Part B) Predicted probabilities of living in a specific level of neighbourhood opportunity for families with IRP between 1.5 and 1.85 versus change in SFR. Plots are shown before interaction for neighbourhoods of 4(b), and high opportunity 4(c).
Focusing on the plots before the interaction in Figure 1, part A and Figure 1, part B, the results confirm what we already found. Neighbourhoods with higher proportions of children in poverty and with higher proportions of families with children near poverty are more likely to be low-opportunity and less likely to be high- or moderate-opportunity, and that poor children and near-poverty families are more likely to live in low-opportunity neighbourhoods as the percentage of SFRs grows over time.
When we compare predicted probabilities before and after the interaction, we highlight three important findings.
First, as expected, when we consider differences in predicted probabilities for low-opportunity neighbourhoods before the interaction (plot 1(a)) to after (plot 2(a)), a neighbourhood is more likely to be low-opportunity as it experiences a combination of high rates of children in poverty (50% of children in poverty or more) and high increases in SFRs (20–100% increase from 2010 to 2015). As SFRs rise, higher levels of children in poverty also rise in low-opportunity neighbourhoods.
Second, when we compare plot 1(b) and 2(b), we note that a neighbourhood is more likely to be a moderate-opportunity neighbourhood when we see a combination of low rates of children in poverty (less than 10%) when SFR growth hits 20% or more. The chances are less for high rates of children in poverty. This means that rising SFRs in moderate-opportunity neighbourhoods did not necessarily lead to high concentrations of poor children but did accommodate for low rates of children in poverty. We see a similar result for high-opportunity neighbourhoods.
Finally, when we turn to the graphs related to different percentages of families with income-to-poverty-ratios of 150% to 185% (i.e. near poverty), we only focus on high-opportunity neighbourhoods (plots 3(c) and 4(c) in Figure 1) since the interaction is not statistically significant for low- and moderate-opportunity neighbourhoods. We find that a neighbourhood is more likely to be high-opportunity when the increases in SFRs range from 20% or more and then the percent of families with children near poverty are around 10% or less. This indicates that growth in SFRs provides access to high-opportunity for near-poverty families with children, but only when these neighbourhoods have just a few of these kinds of families and when there is a larger increase in SFRs. For this last finding, our analysis does not allow us to identify why certain high-opportunity neighbourhoods had significant growth in SFRs or the specific mechanisms that enabled near-poverty families with children to gain access to these neighbourhoods but, based on other findings in this study, we can assume that these families are utilising a large proportion of their income to live in SFRs in these places.
To summarise, SFRs are providing housing for more children in poverty but mostly to live in low- rather than moderate- or high-educational opportunity neighbourhoods. Children in poverty are not gaining access to the moderate- or high-opportunity neighbourhoods because of increasing SFRs. However, when there are very high percentage increases in SFRs and when there are few near-poverty families with children, SFRs can provide access to high childhood educational opportunity neighbourhoods for these kinds of families. This latter finding suggests that efforts to really increase the levels of SFRs in high-opportunity neighbourhoods can help near-poverty families with children, but based on other findings from our analysis, we argue that these families will likely pay a premium (with high cost-burdens and no housing subsidy) to live in these types of neighbourhoods.
Discussion and conclusion
Aligning with previous studies, we find that SFRs increased significantly in neighbourhoods with renter families with children between 2010 and 2015. Findings also show that SFRs have increased disproportionately yet considerably in all levels of child educational opportunity neighbourhoods. However, the rise of SFRs provides families with children in poverty with access to neighbourhoods with low- rather than moderate- or high-opportunity in child education. Those neighbourhoods with increasing SFRs are also more likely be neighbourhoods with lower income households and with more minority residents. Such results suggest that on the national scale, the rise of SFRs provides better housing alternatives for families with children but does not provide access for families with children in poverty to higher-opportunity neighbourhoods in education. It does provide some access to high-opportunity neighbourhoods for families with children whose incomes are between 150% and 185% of poverty, but only if those neighbourhoods have few of these kinds of families and if they had a significant increase in SFRs. Based on other findings from our analysis, we argue that these few near-poverty families with children living in high childhood educational opportunity neighbourhoods likely struggle with high rent cost-burdens.
Our results also demonstrate that high- and moderate-opportunity neighbourhoods are the most unaffordable to rent. In addition, the results also show that HCVs are more commonly used in low-opportunity neighbourhoods compared to moderate- and high-opportunity.
Overall, we demonstrate that relying on the private housing market to enable low-income families with children to access high- or even moderate-opportunity neighbourhoods is problematic. There are significant burdens hindering families with children in poverty from potentially benefiting from the rise of privately owned SFRs to access relatively higher child educational opportunity neighbourhoods. These burdens are caused by diverse and interrelated factors including rental affordability and the weak role of HCV in providing access to higher-opportunity neighbourhoods.
The problem of rental affordability is a barrier for poor renters to access moderate- and high-opportunity neighbourhoods. This is a difficult problem to solve. Affordable housing developers face many obstacles in high-opportunity neighbourhoods, including high land prices, competition from private developers, and community resistance. Some recent strategies to provide affordable housing in better neighbourhoods include up-zoning and the development of Accessory Dwelling Units (ADU). The evidence on the performance of these strategies is still debatable (Rodríguez-Pose and Storper, 2020) and some argue that they are unlikely to occur in neighbourhoods with higher shares of homeowners (Gabbe, 2017).
Other than focusing on density, we argue that one way to help with reducing the rent burden for SFRs tenants is to regulate large institutional investors (e.g. REITs) in the SFR market. While our research does not allow us to specify if SFRs are owned by large investors, previous research shows that when large investors quickly penetrate and take over large shares of local single-family rentals, they monopolise the rental market and take the lead in raising rents to gain for higher investment returns (Edelman et al., 2014; Harwell, 2013). Strategies to mitigate these problems include regulations to prevent large investors from gobbling up large portfolios of single-family homes in the market, rent control regulations and an increase in the ownership share of the SFR market by non-profit groups and the public sector. SFRs can be bundled together by affordable housing providers to create ‘multisite multifamily’ housing (Magder and Goodman, 2015).
Regarding the role of HCVs, our results show that HCVs do not necessarily provide low-income families with children access to better neighbourhoods. However, there are policies at the local level that might help. For instance, local governments should consider passing source of income ordinances to prevent discrimination against families utilising vouchers for rent as a way to open up their communities to lower-income families. In addition, the relationship between HCVs, and REITs should receive attention. Requiring corporate landlords to set a portion of its SFRs for voucher-holders is a potential strategy to broaden the base of affordable SFRs in moderate-opportunity neighbourhoods.
Finally, the private SFR market relies on formal screening processes that are particularly detrimental for low-income renter families. There is a wide range of data available on potential tenants including rental, utility and cell phone payment history (Bundrick, 2014). Risk criteria based on immigration status, criminal history, or eligibility for housing subsidy prevent rental of certain units in certain neighbourhoods (Perlberg and Gittelsohn, 2013), and tenants are prone to discrimination among both ‘mom and pop’ as well as corporate landlords (Reid et al., 2018). Tenants involved in litigation with landlords, regardless of the nature or outcome of the case, can be blacklisted for attempting to protect themselves from discrimination or protect their rights (Richman, 2002). Tenant protections are vital in the different neighbourhoods where SFRs exist, especially with increasing corporatisation within the SFR market.
Footnotes
Appendix
Educational opportunity by subdomain in the Child Opportunity Index.

| Educational opportunity indicators | |
|---|---|
| Early Childhood Education (ECE) | |
| Number of early childhood education centers | Number of ECE centres within a 5-mile radius (own data collection from state and federal sources) |
| High quality early childhood centers | Number of National Association for the Education of Young Children (NAEYC) accredited centres within a 5-mile radius (own data collection from state and federal sources) |
| Early childhood education enrollment | Percent three- and four-year-olds enrolled in nursery school, preschool or kindergarten . American Community Survey (ACS). |
| Elementary Education | |
| Third grade reading proficiency | Percent third graders scoring proficient on standardised reading tests, converted to National Assessment of Educational Progress (NAEP) scale score points (U.S. Department of Education EDFacts Data, Great Schools (GS) data and Stanford Education Data Archive (SEDA)) |
| Third grade maths proficiency | Percent third graders scoring proficient on standardized math tests, converted to NAEP scale score points (EDFacts, GS and SEDA) |
| Secondary and Postsecondary Education | |
| High school graduation rate | Percent ninth graders graduating from high school on time (EDFacts and GS) |
| Advanced Placement course enrollment | Ratio of students enrolled in at least one AP course to the number of 11th and 12th graders Civil Rights Data Collection (CRDC) |
| College enrollment in nearby institutions | Percent 18–24 year-olds enrolled in college within 25-mile radius (ACS) |
| Educational and Social Resources | |
| School poverty | Percent students in elementary schools eligible for free or reduced-price lunches, reversed National Center for Education Statistics (NCES), and NCES Common Core of Data (CCD). (NCES CCD) |
| Teacher experience | Percent teachers in their first and second year, reversed (CRDC) |
| Adult educational attainment | Percent adults ages 25 and over with a college degree or higher (ACS) |
Acknowledgements
The authors would like to thank Reviewers and Editor for taking the time and effort necessary to review the manuscript. We sincerely appreciate all valuable comments and suggestions, which helped us to improve the quality of the manuscript.
Declaration of conflicting interests
The author(s) declared no potential conflicts of interest with respect to the research, authorship, and/or publication of this article.
Funding
The author(s) received no financial support for the research, authorship, and/or publication of this article.