



Abstract
As legal marijuana is emerging as an important component of cities across the United States, it is important to understand the factors that contribute to legal marijuana facility siting. Although land use and zoning are expected to determine where commercial marijuana facilities are located, if residential characteristics also enter siting considerations, some neighbourhoods may either bear the burden of undesired facilities or reap the benefits of legal marijuana, underscoring equitable considerations in marijuana facility siting. Thus, this study examines how neighbourhood change associated with locally unwanted land uses and gentrification influences the amount of retail marijuana facilities across three US cities: Denver, Colorado; Portland, Oregon; and Seattle, Washington. Using a series of Poisson-related regressions, this study finds that neighbourhood residential characteristics influence retail marijuana facilities in ways exceeding siting restrictions alone, like zoning. Notably, quantitative results suggest that there are fewer retail marijuana facilities in neighbourhoods experiencing locally unwanted land use-related change than non-locally unwanted land use neighbourhoods in Denver and Seattle; and more retail marijuana facilities in gentrified compared to non-gentrified neighbourhoods in Denver. Overall, these findings advance understanding of the connection between legal marijuana and neighbourhood changes and aim to influence guidelines for integrating legal marijuana facilities into communities.
Introduction
Marijuana legalisation is growing in popularity in the United States. By 2021, 19 states plus the District of Columbia had legalised recreational marijuana. With this legalisation, the placement of retail marijuana facilities (RMFs) for the sale of marijuana deserves increased attention. Precisely, the motivating factors behind RMF placement is important to consider and understand, because marijuana, as seen with its increasing legalisation, is likely to have long-term impacts on neighbourhood dynamics.
Research has largely examined RMF placement in two regards. On the one hand, RMF placement has been seen as a burden on neighbourhoods, with their siting in line with other commercial locally unwanted land uses (LULUs). In this regard, RMFs would be considered to have detrimental characteristics and be placed in neighbourhoods with existing LULU characteristics. For instance, Németh and Ross (2014) indicate that cities have regulated marijuana facilities as if they were LULUs – which have been disproportionately sited in poorer and minority neighbourhoods. Commercial LULU-related establishments can be considered burdensome largely due to real and perceived externalities: for instance, increased crime, decreased housing or property values or community stigmatisation (Act, 2021). Thus, if RMFs are going into neighbourhoods with LULU-related characteristics, they too can be considered detrimental.
While still vastly under-studied, selected research suggests RMFs are associated with increased housing prices, placing RMFs within gentrification discussions (Cheng et al., 2018; Conklin et al., 2020). RMFs could, thus, be sited in neighbourhoods with gentrifying characteristics and seen as ‘beneficial’– even if gentrification itself is inherently detrimental. While gentrification is detrimental due to displacement, beneficial in this regard refers to perceptions that RMFs could be associated with other businesses targeting a more affluent clientele, as indicated by van de Voorde et al. (2023), providing more costly goods and services, and increasing property values. Municipalities and property owners could thereby perceive RMFs as beneficial. RMFs could be an opportune addition to neighbourhoods and cities and likely to be sited in gentrified spaces.
This research examines the factors influencing RMF placement across Denver, Colorado; Portland, Oregon; and Seattle, Washington – three of the earliest US cities to legalise recreational marijuana. It specifically examines the influence of land use regulations on RMF siting while also determining if pre-legalisation and changing residential characteristics influence RMF siting beyond land use regulations. This research, thus, makes the following contributions. First, it identifies whether and how siting requirements influence the amount of RMFs in neighbourhoods. Second, it shows the extent to which residential neighbourhood characteristics like those related to LULU and gentrification affect neighbourhood RMFs, in addition to siting requirements. Examining how residential characteristics may influence RMF siting additionally speaks to understanding an equitable distribution of RMFs and encourages RMF siting to minimise neighbourhood burdens and maximise benefits. Third, as part of identifying characteristics reflecting LULUs or gentrification, it also contributes conceptually to the modelling of LULUs and gentrification by arguing that these are dynamic processes with various residential characteristics contributing to each. Overall, this research aims to illuminate how different factors contribute to RMF placement. As more cities legalise marijuana, understanding the mitigating factors contributing to RMF placement can help cities better determine how to site RMFs in an equitable manner.
Background
Residential conditions and commercial siting decisions
Before describing LULUs, gentrification and their relevance to the locations of legal marijuana facilities, it is first necessary to articulate why residential conditions are important more generally. Scholars have long examined the relationship between commercial facilities and residential characteristics (Immergluck, 1999; Moore and Diez Roux, 2006) and have shown that local ordinances and regulations do not solely influence commercial or retail location decisions. For instance, Schmidt and Lee (1978) found that while income or population changes did not alter commercial structures, changes in racial composition significantly affected neighbourhood commercial composition across three Denver neighbourhoods. In analysing commercial building activity across Chicago neighbourhoods in the 1980s, Immergluck (1999) found that increases in poverty and the numbers of Black residents and Hispanic residents, and decreases in median incomes reduced commercial investment activity. Similarly, Meltzer and Capperis (2017) found that consumer-related characteristics – such as income, housing prices and rents, and racial and ethnic composition – explained retail store turnover more than commercial infrastructure characteristics like available commercial building space across New York City neighbourhoods. Importantly, Meltzer and Capperis (2017) also found that consumer characteristics ‘influence the first-time entry of chains into the market’ (p. 3049), which may have particular relevance for a new industry like recreational marijuana.
LULUs and marijuana
LULUs are defined as land uses that communities need or that provide a (real or perceived) benefit but that residents do not want due to (real or perceived) costs (Boggess et al., 2014; Németh and Ross, 2014; Popper, 1983). The benefits of LULUs can include tax income (from vice related facilities like sex shops or liquor stores), healthcare (e.g. rehab facilities), or waste management (e.g. a landfill). The costs could include smell, contaminated water runoff and environmental degradation, or crime, to name a few. Scholars have also characterised LULU neighbourhoods as having higher minority and poverty rates prior to LULU siting, with such rates increasing over time (Boggess et al., 2014).
Research has recently started to examine whether marijuana facilities behave like LULUs (Boggess et al., 2014) or are zoned as LULUs (Németh and Ross, 2014). Németh and Ross (2014) suggested that the zoning of medical marijuana dispensaries (MMDs) would fit patterns akin to nuisance/vice establishments (i.e. regulated more like liquor stores) rather than as a Human Service, despite MMDs providing a service to patients. Thus, marijuana facilities’ regulation as LULUs largely stems from their being zoned like a nuisance. Besides zoning, research has pointed towards the assumed societal or neighbourhood burdens for describing marijuana facilities as LULUs. These perceived burdens generally include increased marijuana use in youth (Haines-Saah and Fischer, 2021), decreased property values (Thomas and Tian, 2021) and fears of crime (McComas, 2016).
Indeed, much research has focused on the association between marijuana dispensaries and crime. Some research has supported the assumption of increased crime in areas with marijuana dispensaries. For instance, Freisthler et al. (2017) found positive associations between the density of marijuana outlets in Denver and property crimes but not violent crimes in block groups with marijuana retail outlets and adjacent block groups. Meanwhile, Zakrzewski et al. (2020) did not find an increase in crime rates from before to after the opening of a MMD in Washington, DC. While crime is not necessarily the focus of this present study, the debates surrounding crime and marijuana point to the perception that RMFs could be associated with increased neighbourhood crime and perceived as going into more LULU-related spaces.
Nevertheless, research has not definitively shown the connection between marijuana and LULU-related burdens. Instead, perceptions of negative externalities or costs may drive RMF siting rather than actual costs. For instance, Iannocchione et al. (2020) measured dispensary owners’ and managers’ perceptions of community backlash to marijuana dispensaries but found that they experienced little backlash upon opening which eventually dissipated over time. Research has also noted that the public’s perceptions of impacts are often unrelated to the more formally assessed, scientific impacts (Schively, 2007). Questions, therefore, remain regarding marijuana facility siting. This is further complicated by research that suggests the opposite – that neighbourhoods with marijuana facilities coincide with increases in home prices (Conklin et al., 2020) and reductions in crime (Brinkman and Mok-Lamme, 2019). This leads to questions regarding whether marijuana facilities are possibly opening in gentrified, gentrifying, or at least upgrading neighbourhoods, rather than LULUs.
Gentrification and Marijuana
Gentrification is a process of neighbourhood change characterised by neighbourhood upgrading coupled with displacement at rates greater than the area average. In line with Hom (2022), Marcuse (1985) and Slater (2009) gentrification includes displacement and is an inherently detrimental process. Indeed, neighbourhood upgrading alone is necessary but insufficient for gentrification to occur. Displacement – the relocation of households due to conditions beyond their control – must also be present to identify the existence of gentrification.
Several scholars take a critical approach to measuring gentrification and, therefore, include or attempt to account for displacement in determining gentrification (Ellen and O’Regan, 2011; Essoka, 2010). Often, though, gentrification analyses exclude measures of displacement and instead focus on measuring neighbourhood upgrading or single residential change features to account for gentrification (Keels et al., 2013; Morel et al., 2022). Additionally, many scholars (e.g. Freeman, 2009; Vigdor, 2002) note an absence of residential turnover and Freeman and Braconi (2004) found less residential mobility in what they consider gentrifying neighbourhoods. In such cases, the poor or those most vulnerable to displacement actually remain in ‘gentrifying’ neighbourhoods.
With examining gentrification in these regards, the question of what distinguishes gentrification from neighbourhood change or incumbent upgrading persists. Omitting displacement results in an incomplete examination of gentrification that can lead researchers and decision-makers to overlook how forced relocation affects residents and communities. Displacement’s omission can have direct policy impacts whereby cities embrace gentrification without accounting for its negative impacts (Bernt and Holm, 2009). Simultaneously, omitting displacement can lead to the idea that any form of neighbourhood change could be labelled gentrification and, therefore, be subject to scorn and discontent – even when neighbourhood upgrades are needed and wanted by existing residents.
Despite the abundance of studies, there are two limitations in existing quantitative approaches to measuring gentrification. First, despite conceptual recognition of the necessity of capturing displacement, operationalisation of or proxies for displacement are largely missing or inadequate. Research has noted racial or ethnic turnover as possible indicators of displacement (Essoka, 2010). Unfortunately, this alone does not fully capture displacement because minority households may move for reasons within, rather than beyond, their control. Considering that displacement involves households being relocated based on conditions beyond their control, racial or ethnic change does not fully address forced location. Change in percentages of racial or ethnic compositions also does not necessarily involve the racial or ethnic groups moving out of the neighbourhood. Existing residents could very well remain, but increases in other racial or ethnic groups could lower overall percentages of the racial or ethnic minority groups in question. However, research notes that lower income households are generally less likely to move on their own due to limited housing choices and resources (Winke, 2021). Thus, an indicator representing lower-income households’ mobility may better address displacement – in place of knowing exactly why households moved. Second, gentrification is a dynamic process that reflects changes in various factors, which means that existing approaches that focus on the change of a single variable are not wholly adequate in representing the process of neighbourhood change.
Gentrification as a whole, dynamic process has yet to be empirically connected to the legal marijuana industry. However, the bulk of existing research focuses on the role of individual variables, such as housing prices, in relation to marijuana dispensaries. Research has generally shown a 6–8% increase in home values in municipalities with RMFs (Cheng et al., 2018) or within close proximity of a new RMF (Conklin et al., 2020). Other research, though, has shown decreases in home values in close proximity to dispensaries (Tyndall, 2021). While such research shows the impacts of RMFs on neighbourhoods, they do not examine the opposite relationship – how neighbourhood conditions influence RMF siting. Considering that RMFs are still relatively new, it may be too soon to understand how they contribute to different forms of neighbourhood change. However, considering the role of residential characteristics in determining retail siting as noted above, the influence of neighbourhood residential change on RMF siting could help researchers and municipalities better understand where RMFs are more likely to be sited.
Pre-existing conditions
Research notes that neighbourhoods most likely to experience LULU- or gentrification-related changes both have high minority rates and high poverty rates (or low incomes) at the beginning of the neighbourhood change process (Been, 1994; Kibert, 2018). The difference between LULU- and gentrification-related neighbourhoods is how they change over time. LULU neighbourhood changes reflect increased isolation (i.e. increased minority and poverty rates). Neighbourhoods experiencing gentrification generally decrease their minority and poverty rates while increasing income levels or housing costs, for instance – with these changes occurring simultaneously or as part of the same process. Nevertheless, research has suggested that marijuana facilities, and especially marijuana retailers, are disproportionately sited in areas with higher racial and ethnic minority and poverty rates along with lower income levels at the onset of or prior to legalisation (Berg et al., 2018; Boggess et al., 2014; Shi et al., 2016).
Regulatory context
In 2012, Amendment 64 and Initiative 502 for Colorado and Washington, respectively, legalised recreational marijuana for these states. Oregon’s Measure 91 legalised recreational marijuana in 2014. These were the first states to legalise marijuana for recreational purposes. Recreational sales began in 2014 for Denver, Colorado and Seattle, Washington and in 2017 for Portland, Oregon. For Portland, recreational marijuana sales actually began in 2015 – where previously licenced medical marijuana stores could sell recreationally through the end of 2016 due to Senate Bill 1511. However, recreational sales from Oregon Liquor Control Commission (OLCC) licenced retail establishments began in 2016 and, in 2017, only OLCC licenced stores could sell recreational marijuana. Similarly in Denver, prior to 2016, only medically licenced establishments that were licenced as of 1 October 2013 could receive a retail licence (Bordovsky, 2016).
In terms of specific regulations, marijuana facilities can only operate within certain land use zones as established by each municipality. Across the three cities, facilities are not allowed in residential zones. Marijuana facilities are generally permitted in zones based on their use: retail dispensaries in commercial zones, production and processing establishments in industrial zones. Municipalities also established ordinances regarding siting restrictions. Common among all three cities is that marijuana facilities cannot be within 1000 ft of schools or other marijuana stores with additional requirements for child-care and child-based activities like arcades or parks (500 ft, Seattle) and drug or alcohol treatment facilities (1000 ft, Denver) (City and County of Denver, 2021a; City of Portland, 2020; City of Seattle, 2020a).
Research strategy
This study evaluates: (1) the influence of regulations on the number of RMFs (Model 1); (2) the influence of pre-legalisation neighbourhood characteristics on retail marijuana facilities (Model 2); and (3) the likelihood of increased retail marijuana facilities in (a) neighbourhoods with LULU-related residential changes (Model 3) and (b) gentrified neighbourhoods (Model 4). A series of Poisson-family, generalised linear mixed models tests these relationships. Specifically, I use Poisson regressions for Denver and quasi-Poisson regressions for Portland and Seattle. This is due to there being no statistically significant indication of dispersion for the RMF count data for Denver, but statistically significant under-dispersion in the RMF count data for Portland and Denver. I use the census tract as the unit of analysis and as a proxy for neighbourhoods – thus, census tract and neighbourhood are used interchangeably. While the unit of analysis can influence results, the census tract presents an area to best identify residential influences on RMF siting. Studies highlighting the relationship between RMFs and crime often use smaller units of analyses such as the block or block groups (Freisthler et al., 2017) which are beneficial for examining relationships immediately surrounding dispensaries. However, given the local siting requirements, a smaller area like the block or block group may only have similar commercial land uses, which may not wholly account for area residential characteristics. Thus, the census tract provides a large enough area to include residential characteristics that could influence RMF siting.
Initially, I expected RMFs at one location to be influenced by RMFs at proximate locations – suggesting spatial autocorrelation. Moran’s I tests on model residuals confirmed spatial autocorrelation across all cities, which suggested a need to control for autocorrelation in the regression models. Following the work of Ameli et al. (2015), I relied on the spatial filtering technique (using the ME function in R –Bivand et al., 2021b). This technique adds spatial components or eigenvectors as independent variables to the regression models that control for spatial autocorrelation.
Data and variable descriptions
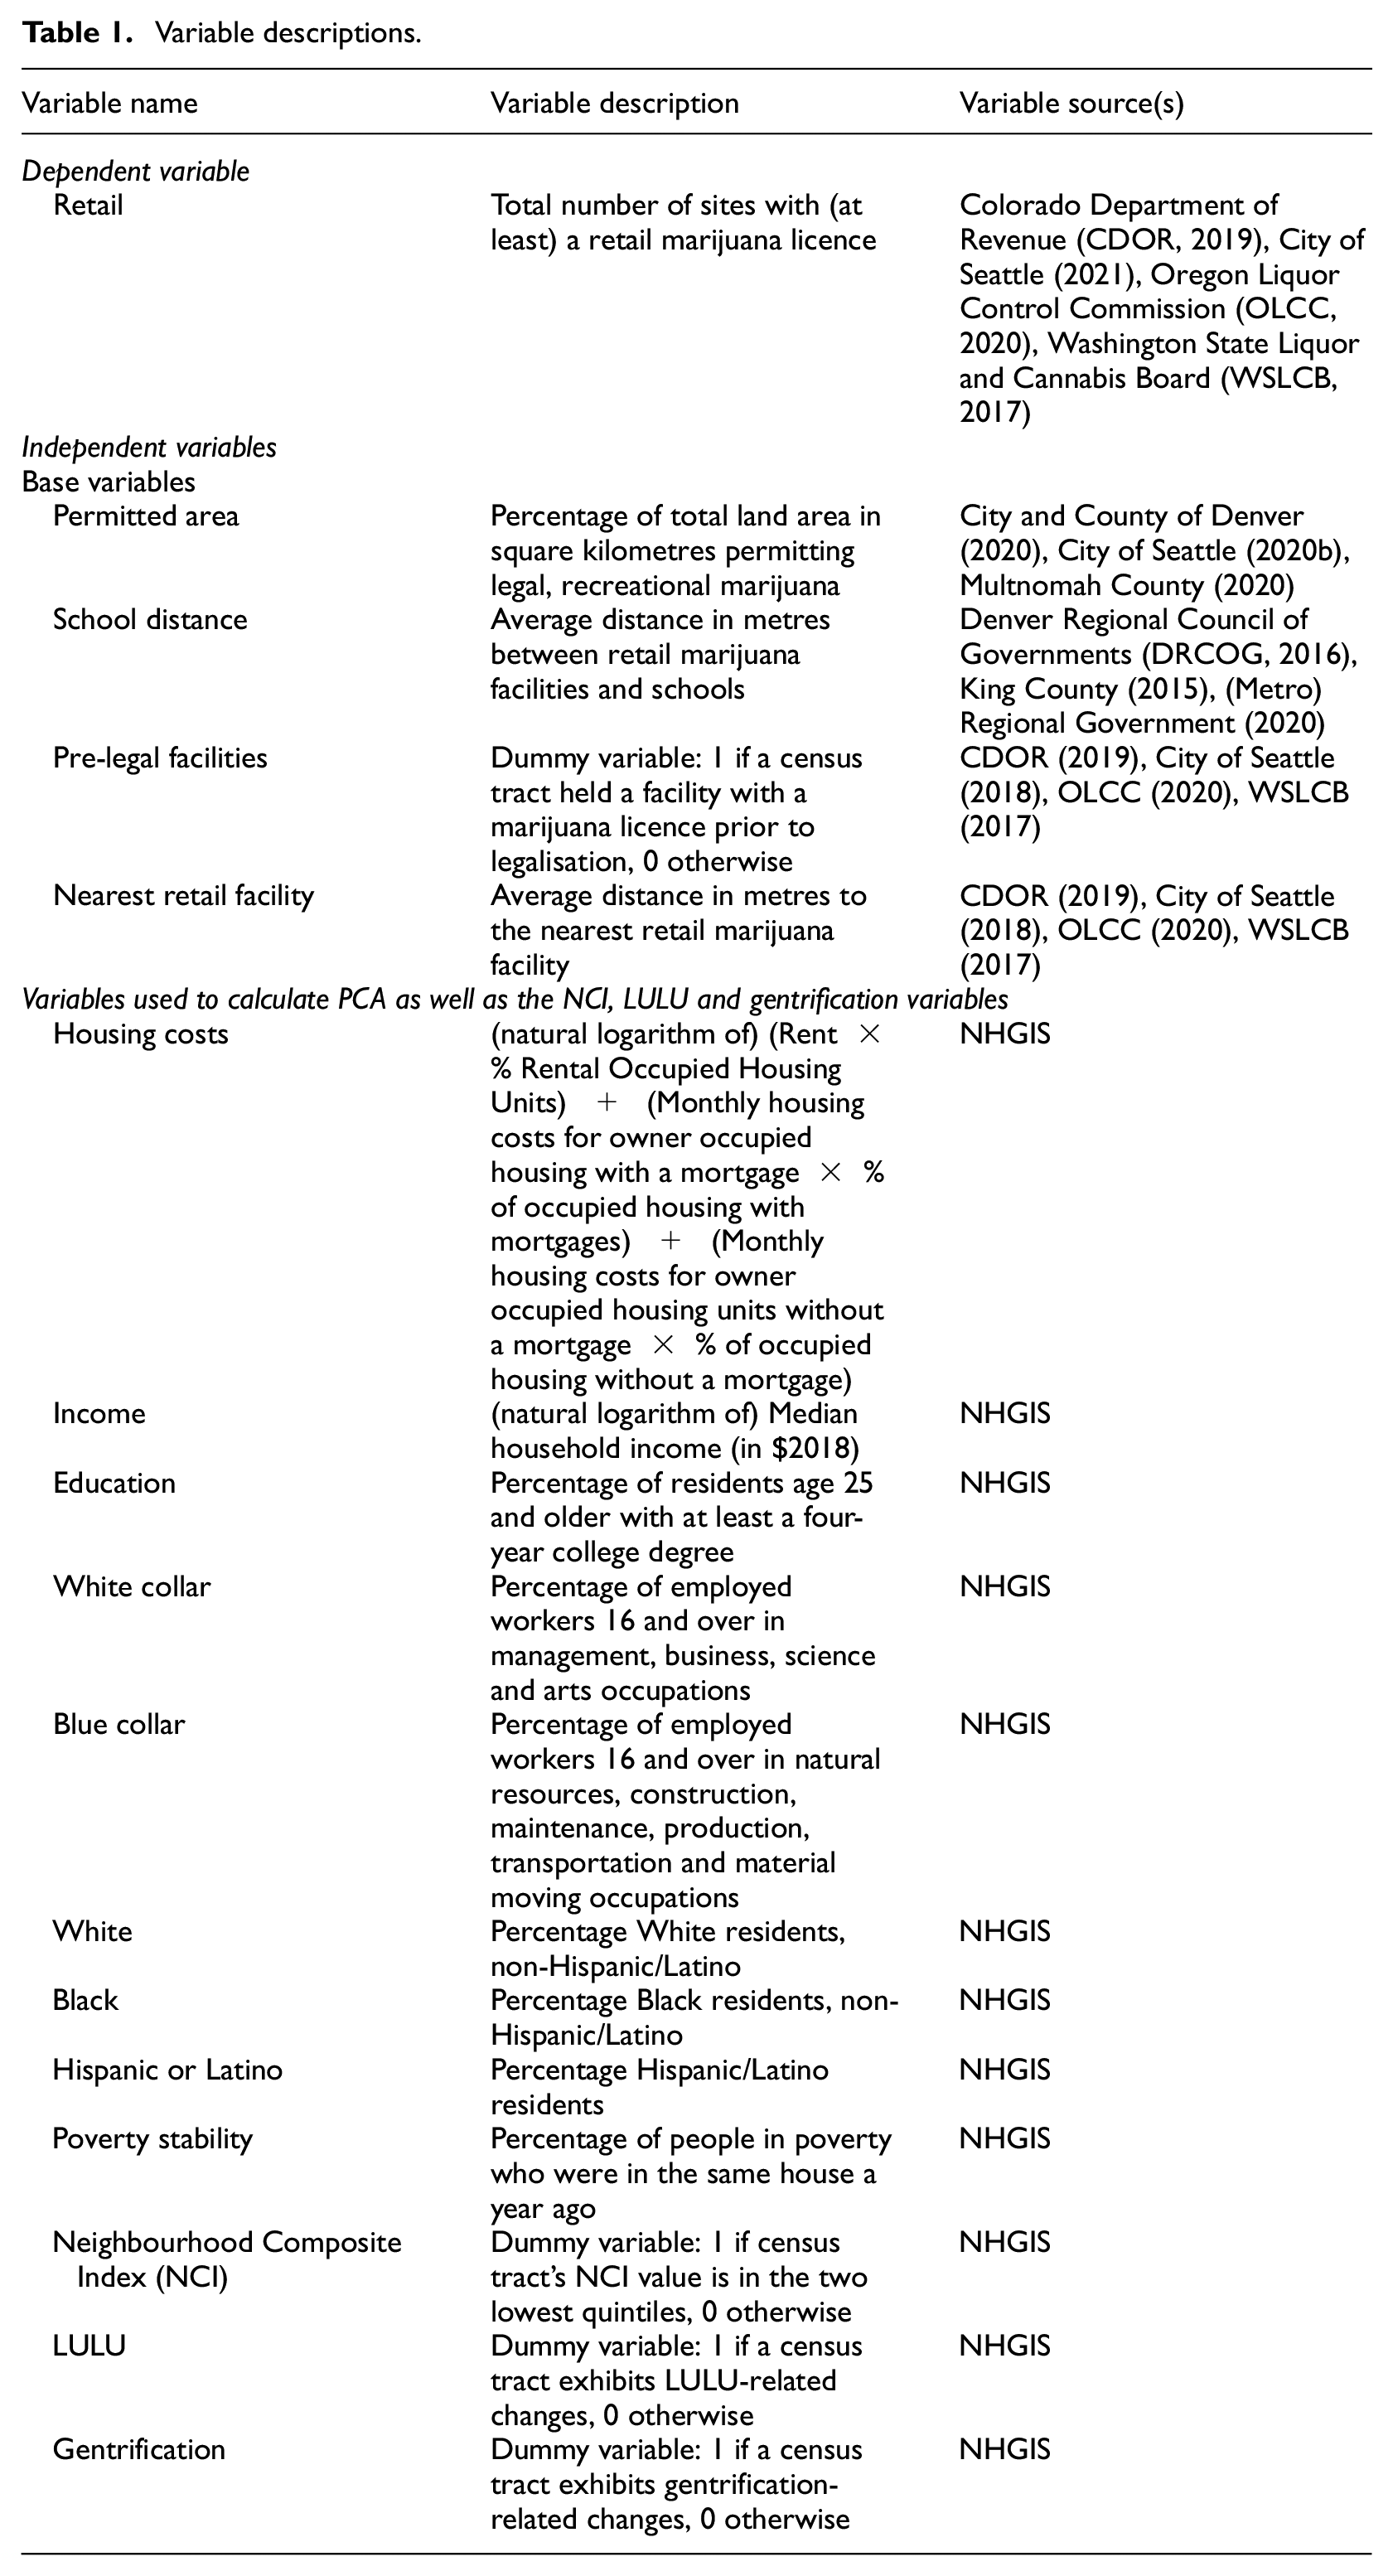
Table 1 provides a list of the variables used and their sources. I provide further variable explanations below. I used ArcGIS, R Studio along with select R packages, 1 data collected from the National Historical Geographic Information System (NHGIS), and the US Census Bureau’s TIGER/Line shapefiles to construct variables, produce maps and perform the analyses (Environmental Systems Research Institute (ESRI), 2019; Manson et al., 2017; R Core Team, 2021; US Census Bureau, 2010). NHGIS data provide 2006–2010 (for year 2010) and 2014–2018 (for year 2018) American Community Survey (ACS), US census based, 5-year estimates.
Variable descriptions.
Dependent variable
The RMF variable provides the total number of legal, retail marijuana sites by census tract from the beginning year of legalisation in each city until 2018 and serves as the dependent variable in all regression models. Essentially, the RMF locations are the addresses where retail marijuana business licences were granted between the legalisation dates of each city and 2018. I omitted facilities with missing business licence information or whose information deviated significantly from official local and state-based lists. Additionally, all RMFs indicate a storefront, physical business that held a retail marijuana licence and I omitted licences that were solely delivery or courier businesses. I also verified RMF locations through internet sources such as Yelp, WeedMaps, the actual website of the location, and Google Maps.
Independent variables
I used seven independent variables within the regression models. First, I identified base variables to control for siting requirements: Permitted Area, School Distance, Pre-Legal Facilities, and Nearest Retail Facility. Permitted Area controls for zoning and land use requirements. School Distance controls for distances between marijuana facilities and (public, private, and all other pre-kindergarten through high school) schools as all jurisdictions place requirements on minimum distances between retail facilities and schools. The Pre-Legal Facilities variable controls for sites that may have been ‘grandfathered-in’– for example, if a medical marijuana dispensary operated prior to legalisation or when no marijuana specific land use regulations were in place. Nearest Retail Facility controls for the distance between retail marijuana facilities as all cities have requirements prohibiting the siting of marijuana facilities within specified distances – generally 1000 ft. These base variables are included in all four models.
Neighbourhood composite index
To measure the influence of beginning year residential characteristics on retail marijuana siting, I first constructed a neighbourhood composite index (NCI) via principal component analysis (PCA). The NCI serves multiple purposes. First, it provides a composite index of neighbourhood residential characteristics used as the basis for an independent variable in the analyses. Second, it provides the basis for both LULU and gentrification variables. An underlying importance of the NCI is that it provides a metric of a neighbourhood composite identity based on residential characteristics and their relationships with each other for use within the models. This results in a more complete measure than individual characteristics alone.
The purpose of the PCA was to determine whether the separate variables formed a single composite PCA score – which I identify as the NCI score. Variables used include Housing Costs, Income, Education, White Collar, Blue Collar, White, Black, Hispanic or Latino and Poverty Stability. Statistical evidence supporting a single attribute or construct is inferred from the percentage of variance (i.e. eigenvalue) that is accounted for by the first factor. I found that this was supported for 2010 and 2018 data for Denver (66.1% and 70.4%, respectively), Portland (61.9% and 67.8%, respectively) and Seattle (60.7% and 68.3%, respectively). This means that for each city and for each time point, the majority of the variance was explained by the first factor, thus lending initial support for the NCI score to account for a single construct. The next step was to evaluate each variable’s weight on the NCI score; positive weights for a variable indicated that increases were associated with increases in the NCI score and negative weights for a variable indicated that increases were associated with decreases in the NCI score. I first observed that the sign of the weights was the same for both the 2010 and 2018 data and across all three locations. This means that each variable’s relationship direction was consistent across time and location. Importantly, the sign of the weights represented the relationship between that variable and the NCI score – negative weights for Blue Collar, Black, Hispanic or Latino, and Poverty Stability and positive weights for the remaining variables. For example, as housing costs increase and poverty stability decrease, the NCI score increases.
I next grouped the NCI scores for each city in 2010 into quintiles to form the LULU and gentrification variables as described below. They also help identify, relative to the median of each city, census tracts with well below, below, median, above and well above NCI values. For the NCI variable, I created a dummy variable with census tracts in the bottom two quintiles given a score of one (1) and census tracts with NCI values in the other quintiles given a score of zero (0). The NCI variable thus represents low NCI values in 2010. In this regard, low versus high NCI scores are not representative of status or (dis)advantage, nor do they indicate that neighbourhoods with a low NCI score are better or worse than a neighbourhood with a higher NCI score. The NCI score simply provides a quantitative measure of the different, combined neighbourhood residential characteristics. I also calculated the difference between 2018 and 2010 NCI values for use in the LULU and gentrification variables. The NCI (dummy) variable was included in Model 2.
Locally unwanted land use
As stated in previous research, the characteristics of neighbourhoods affected by locally unwanted land uses are that (a) neighbourhoods generally begin with high minority and poverty rates and lower income levels and (b) minority rates and poverty rates increase and income levels decrease over time (Been, 1994; Boggess et al., 2014; Kibert, 2018). However, I suggest that measuring such characteristics separately does not fully identify neighbourhoods more prone to LULU-type establishments. This is because neighbourhoods do not have single, separate features, but neighbourhood characteristics often work with each other – for instance, higher housing prices being associated with higher education levels. Thus, this study enhances existing research measuring LULUs by identifying how those characteristics interact with each other through the PCA and subsequent NCIs. Additionally, focusing on measuring changes in residential characteristics, the LULU variable, in effect, identifies neighbourhoods with residential characteristics prone to inducing LULU-type businesses rather than identifying businesses considered LULUs themselves. To identify a LULU neighbourhood, I first identified if the census tract’s NCI value was in the two lowest quintiles (i.e. NCI variable) for 2010 – this accounted for neighbourhood characteristics pre-legalisation. Then, if a census tract in 2010 was in the bottom two quintiles and had NCI differences in the lowest two quintiles, I identified it as a LULU neighbourhood. The LULU variable was included in Model 3.
Gentrification
Corresponding with this study’s gentrification definition, changes in Education, White Collar, Blue Collar, White, Black, and Hispanic or Latino account for neighbourhood change. Income and Housing Costs account for neighbourhood upgrading. Poverty stability accounts for displacement. As indicated previously, existing research notes that lower income, as well as higher minority, households are generally less likely to move on their own terms largely due to limited housing choices and resources to do so (Winke, 2021) whereas higher income households may be more likely to move (Clark and Lisowski, 2017; South and Crowder, 1998). Lower rates of poverty stability may better indicate that households in poverty relocated in the previous year due to conditions beyond their control. Additionally, this variable directly represents mobility rather than only total or percentages of persons within a neighbourhood like poverty alone or other proxies of displacement like racial or ethnic composition change. As such, lower rates of poverty stability represent a sign of displacement. Thus, I identified a gentrified neighbourhood where a census tract was in the bottom two quintiles (i.e. NCI variable) in 2010 and had NCI differences in the highest quintile. The gentrification variable was included in Model 4.
However, a question arises as to whether race, income, and class are already built into zoning and land use designations. Indeed, Whittemore’s (2017a, 2017b) work finds significant relationships between land use and race. Before running the regressions, I tested these assumptions through (a) t-tests, which measured whether the Permitted Areas variable was significantly different for low NCI compared to high NCI scores; and (b) correlations, which determined whether there were significant associations between Permitted Areas and different residential characteristics. The t-tests revealed that only Seattle showed significant differences between the means for Permitted Areas and NCI areas. The correlation results showed statistically significant associations between Permitted Areas and 2010 residential characteristics, where lower housing costs (all cities), incomes (all cities) and white-collar rates (Portland, Seattle), and higher poverty stability (all cities) showed significant relationships. Race and ethnicity rates, with the exception of Hispanic or Latino for Seattle, showed insignificant correlations. Furthermore, in line with Schober et al.’s (2018) explanation for correlation strength, significant correlations were relatively weak (less than 0.40), or exhibited just a moderate correlation as was the case with Income for Portland and Seattle and Housing Costs for Seattle (−0.45, −0.43 and −0.42, respectively). Such results suggest that zoning and land use permitting retail marijuana facilities may not have strong correlations with race/ethnicity and socio-economic status across the cities examined. Preliminary results including Dispersion tests, Moran’s I, PCA results, t-tests, Correlation Matrices, and non-spatial OLS Regressions are available within the Online Supplemental Material or upon request.
Results
Descriptive statistics
Table 2 displays descriptive statistics. All cities experienced similar general patterns regarding changes in residential characteristics. Average Housing Costs, Income, Education, and White Collar all increased from 2010 to 2018. Blue Collar, Black, and Poverty Stability all decreased. In Denver, the average White population rate increased and the average Hispanic or Latino population rates decreased while the opposite changes occurred for these variables in Portland and Seattle.
Descriptive statistics.

Figure 1 maps RMFs and NCI, LULU, and gentrified tracts across all cities. All three cities had approximately the same total beginning year populations: 576,708, 579,117 and 592,654 for Denver, Portland and Seattle, respectively. Interestingly, all cities held a similar percentage of NCI (40%), LULU (17% in Denver and Seattle, 19% in Portland) and Gentrified (11% in Denver, 9% in Portland, and 12% in Seattle) tracts. However, the cities differed regarding the percentage of census tracts with an RMF. Seattle had the smallest percentage of its census tracts with an RMF (21%) followed by Denver (54%), and Portland (66%). Out of Seattle’s total NCI census tracts, only 26% contained an RMF – compared to 54% in Denver and 71% in Portland. Interestingly, even though only 9% of census tracts gentrified in Portland, 85% of those census tracts held at least one RMF, compared to 63% in Denver and 25% in Seattle.
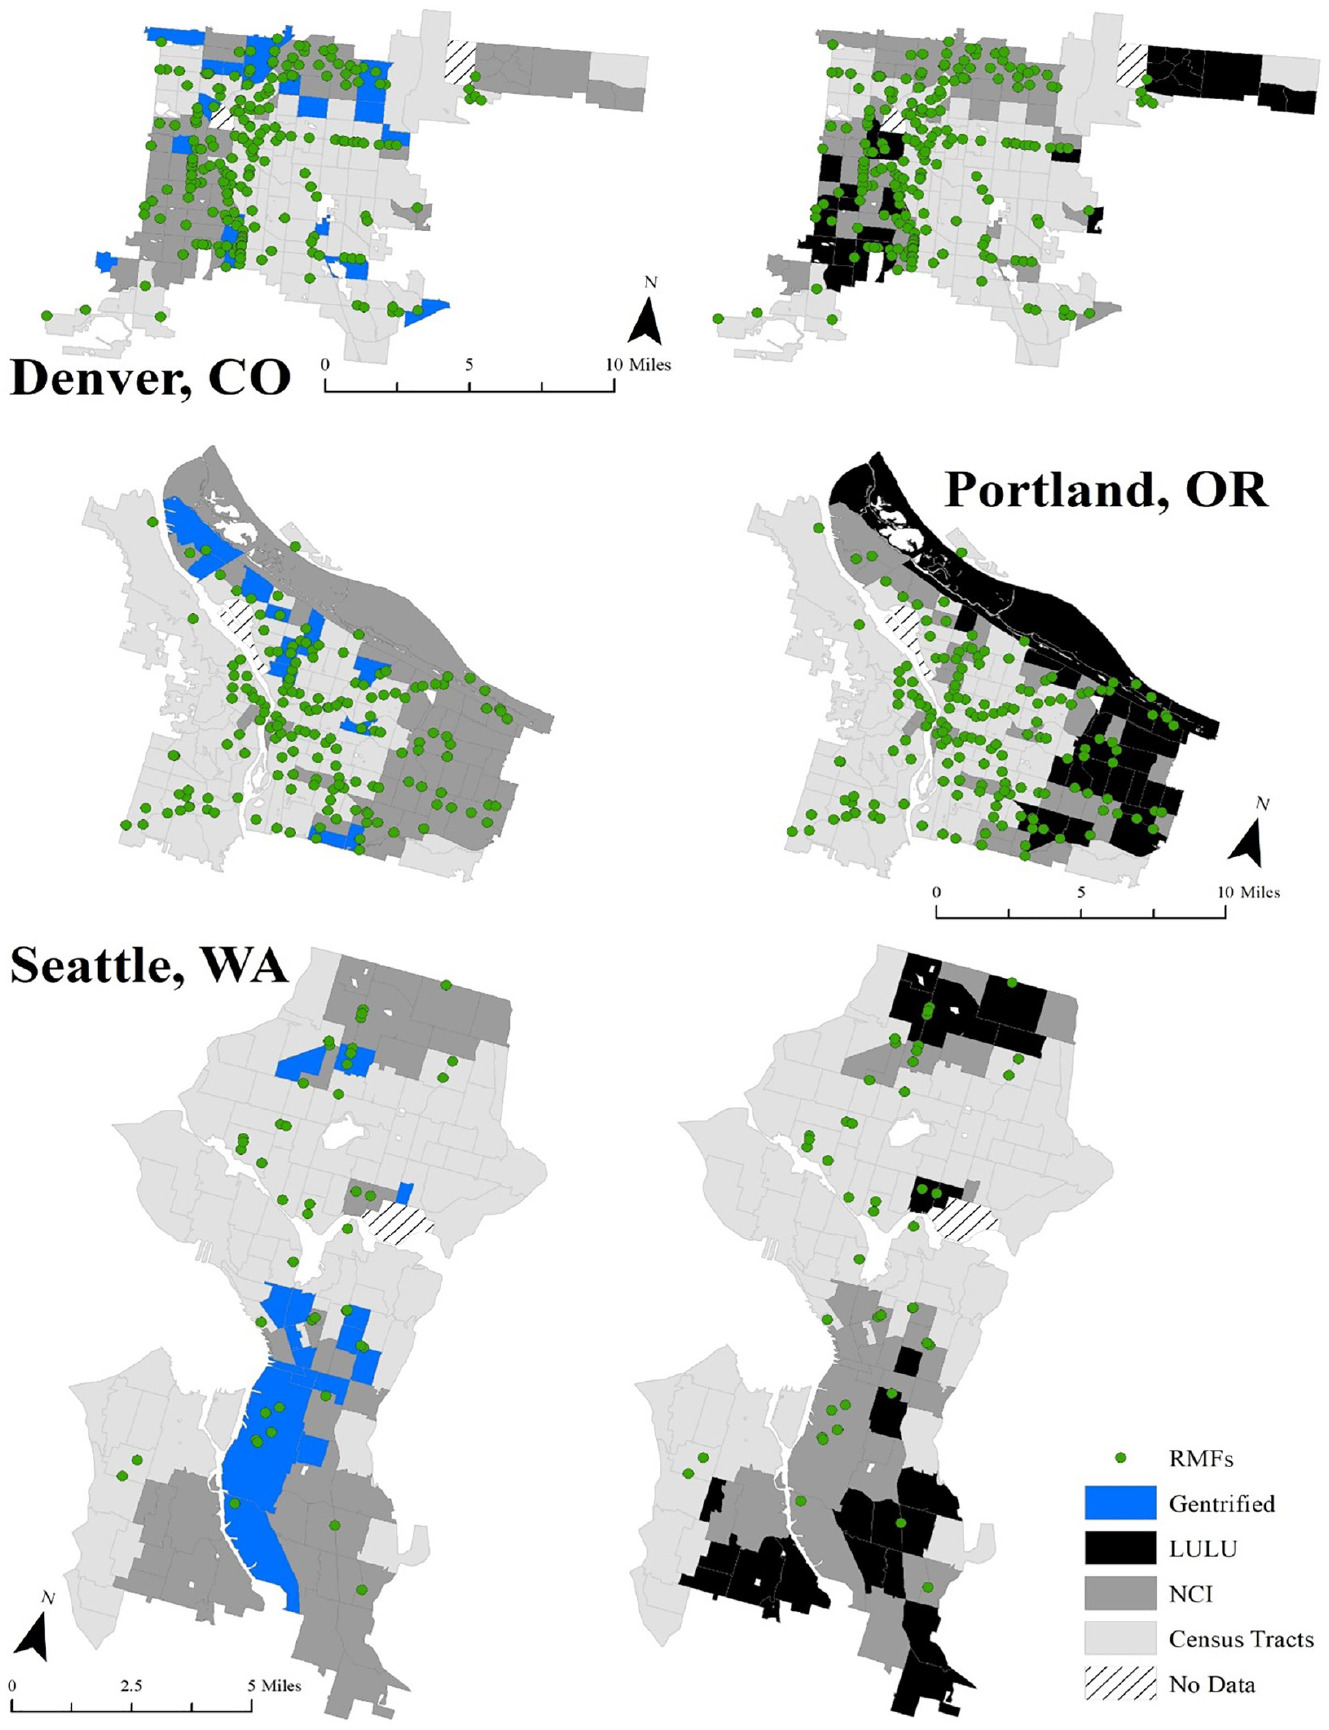
All cities: RMFs and NCI, LULU and gentrified census tracts.
Model 1: Base variables
Table 3 displays regression results for all models. For Model 1, almost all variables are significant with positive associations between RMFs and the siting restriction variables, except Nearest Retail Facility, which exhibits a negative association. Only Portland’s Pre-Legal Facilities did not display a significant relationship. This means that with increases in the percentage of the area permitting retail marijuana land use and zoning, average distance to schools, and number of pre-legal facilities along with decreases in the distance to other retail facilities, the number of RMFs is expected to increase. However, while School Distance and Nearest Retail Facility are statistically significant, the coefficient values are close to zero (0). This indicates that these variables have low practical significance in RMF siting. Overall, the results of Model 1 suggest that siting requirements play a significant role in determining the amount of RMFs per census tract. These patterns remain consistent even when incorporating residential characteristics as shown in subsequent models.
Spatial Poisson regression models, dependent variable: RMF.
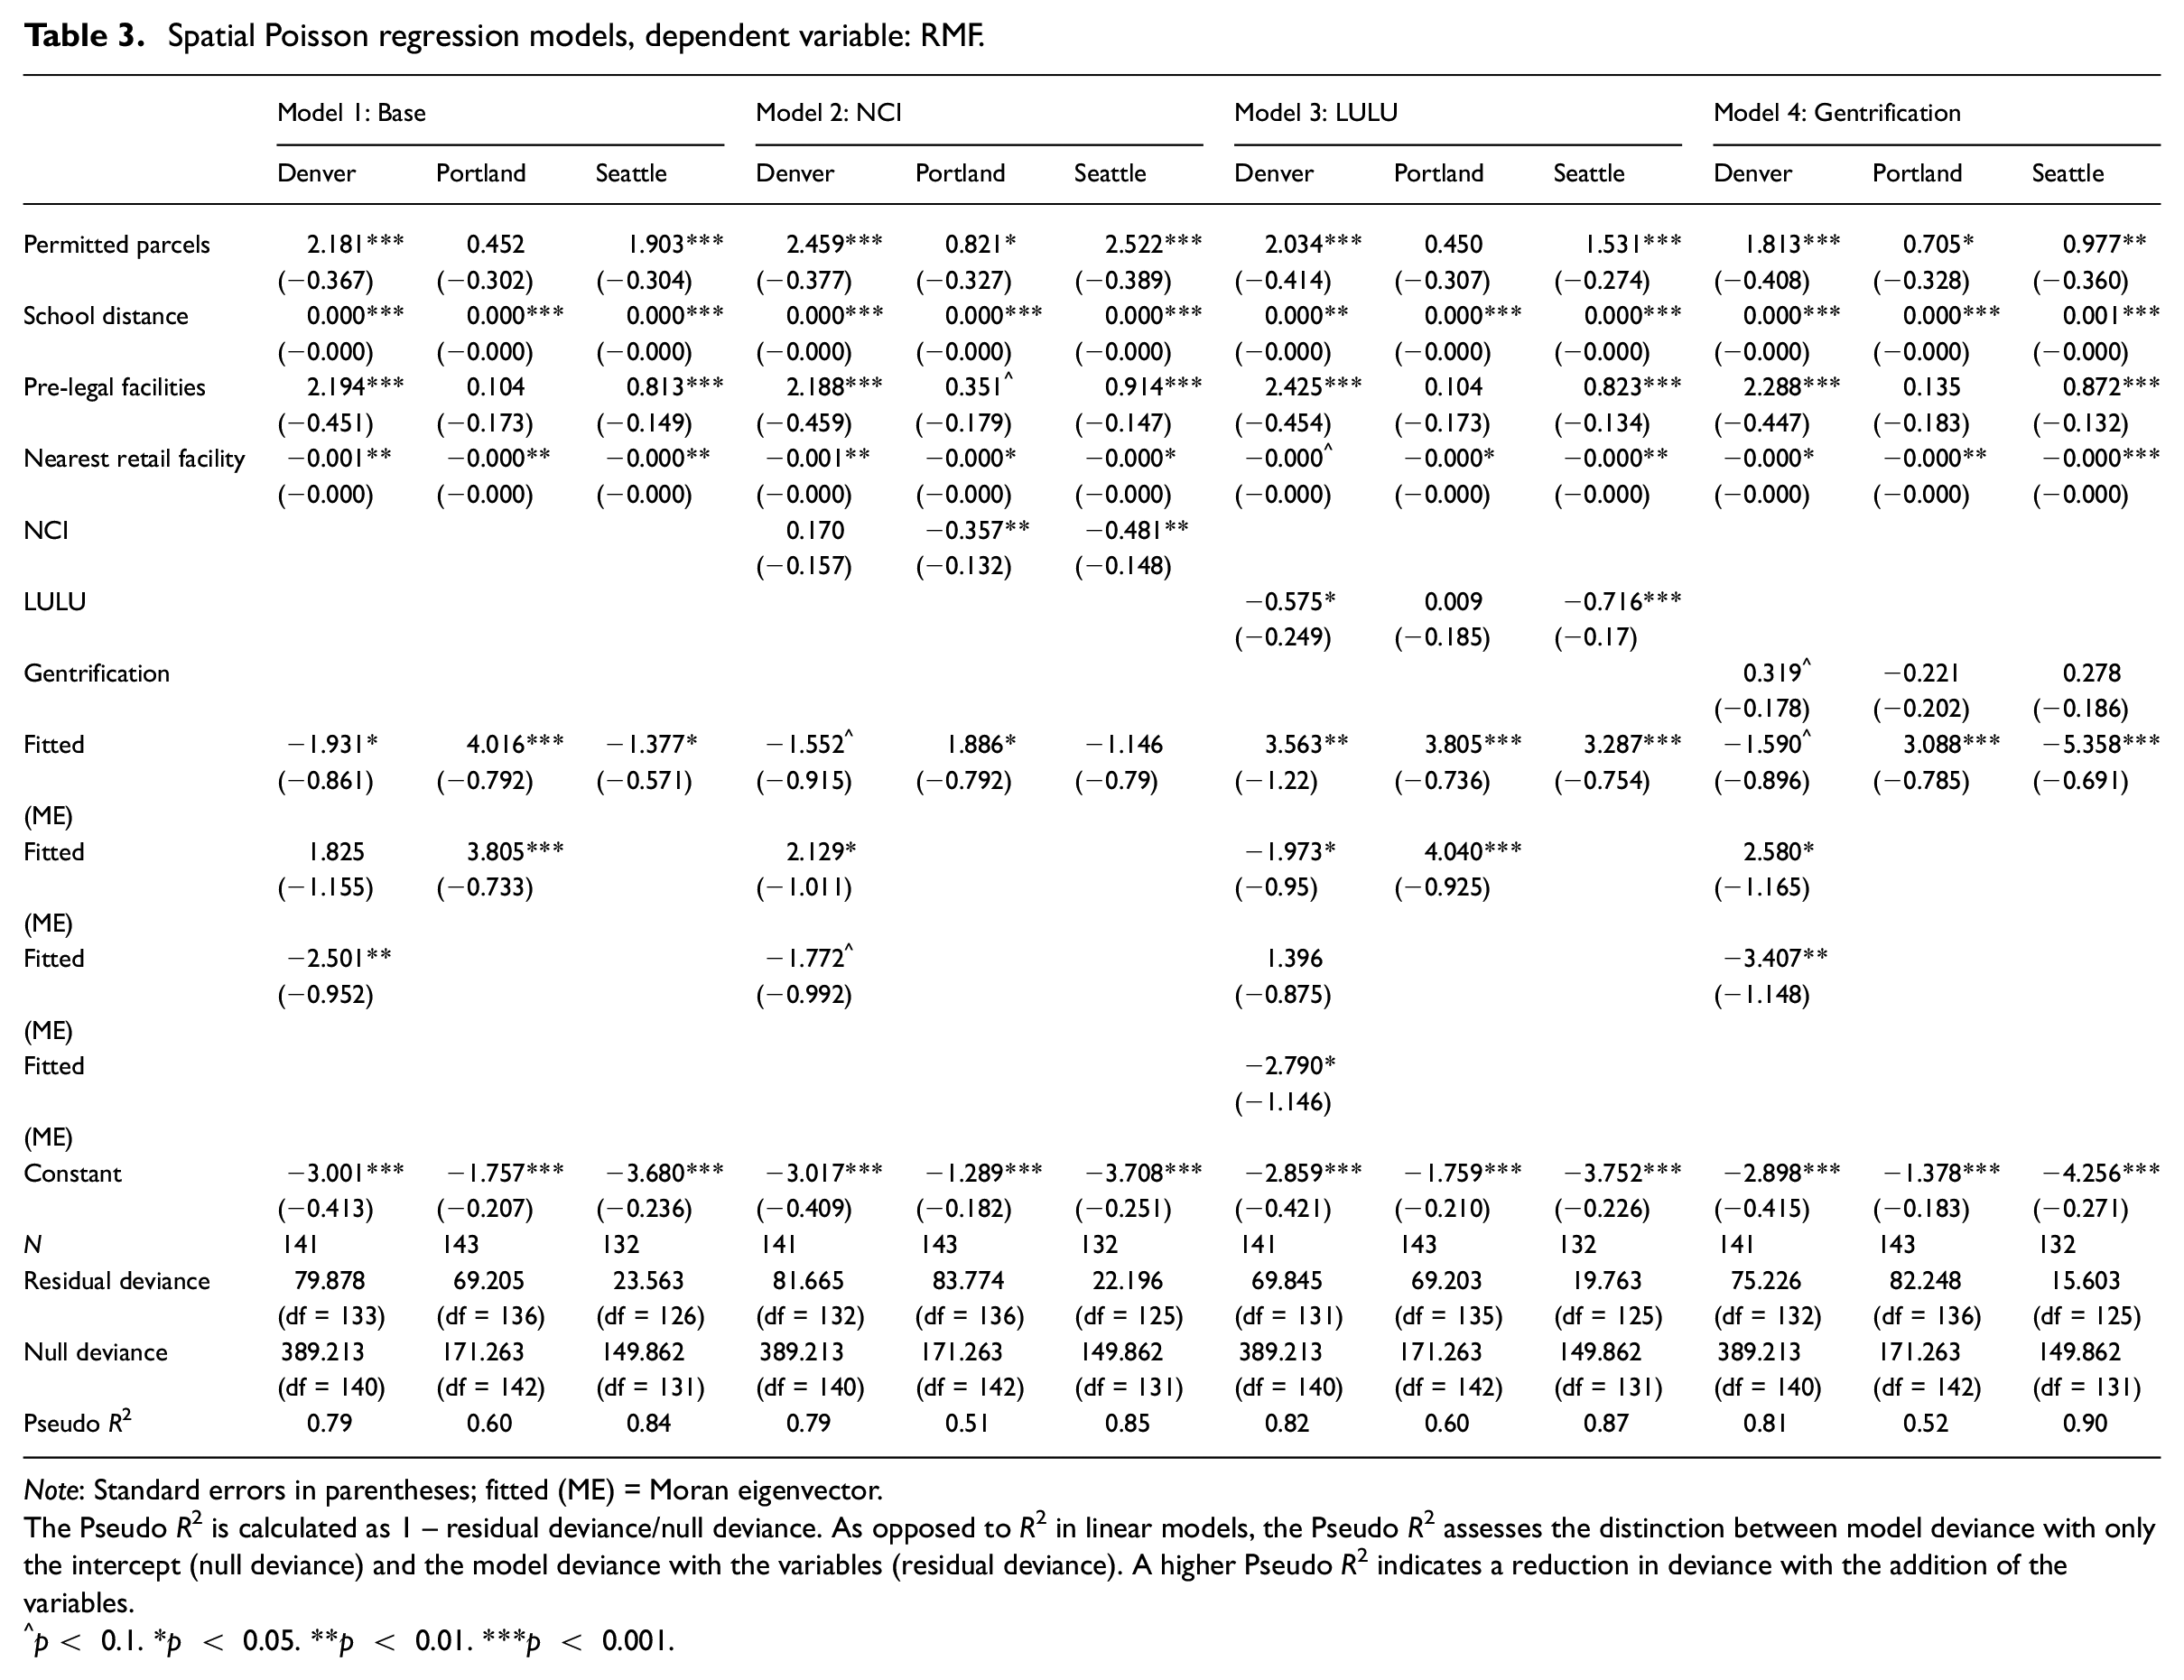
Note: Standard errors in parentheses; fitted (ME) = Moran eigenvector.
The Pseudo R2 is calculated as 1 – residual deviance/null deviance. As opposed to R2 in linear models, the Pseudo R2 assesses the distinction between model deviance with only the intercept (null deviance) and the model deviance with the variables (residual deviance). A higher Pseudo R2 indicates a reduction in deviance with the addition of the variables.
p < 0.1. *p < 0.05. **p < 0.01. ***p < 0.001.
Model 2: RMFs and NCI
Model 2 findings show a significant negative relationship between NCI and RMFs for Portland and Seattle, but no significant relationship in Denver. For Portland and Seattle, census tracts with a lower NCI have less RMFs compared to census tracts with a higher NCI. To better interpret the results, Musunuru et al. (2020) explain that given the log-transformation of the dependent variable, exponentiated categorical variable coefficients represent ‘the proportion of increase or decrease in the count of one group versus another’ (p. 85). For Portland, an NCI census tract would be expected to have 36% less RMFs compared to a census tract in the highest quintiles (where NCI = 0). For Seattle, an NCI census tract would be expected to have 48% less RMFs compared to a census tract in the highest quintiles. Hence, the results suggest that census tracts in Portland and Seattle with a higher NCI have more RMFs than census tracts with a lower NCI.
Model 3: RMFs and LULUs
Model 3 findings suggest significant negative relationships between LULUs and RMFs for Denver and Seattle, but no significant relationship in Portland. Results predict that LULU tracts have 58% and 72% less RMFs in Denver and Seattle, respectively, compared to non-LULU tracts. Thus, if a non-LULU tract in Seattle holds 10 RMFs, a LULU tract would hold about 3 RMFs. For Denver and Seattle, then, LULU census tracts are not predicted to have more RMFs than non-LULU census tracts.
Model 4: RMFs and gentrification
Model 4 findings show the relationship between RMFs and gentrified census tracts while controlling for siting restrictions. Only Denver results show a significant relationship (at the 0.10 significance level) between RMFs and gentrification. Here, gentrified census tracts are predicted to have 32% more RMFs than census tracts that did not gentrify.
Discussion
As legal marijuana continues to be an important addition to communities, it was necessary to evaluate whether siting requirements and neighbourhood conditions influence the locations of legal marijuana facilities. Overall, findings suggest that some patterns generalise across cities, but also that each city shows distinctions that are important to further examine. To summarise, all cities showed significant, positive relationships between RMFs and the siting requirements except Nearest Retail Facility, which displayed significant, negative relationships across all cities. Portland and Seattle were found to have significant, negative relationships between RMFs and NCI neighbourhoods. Denver and Seattle were found to have significant, negative relationships between RMFs and LULU neighbourhoods. Meanwhile, only in Denver was there a hint of a significant, positive relationship between RMFs and gentrified neighbourhoods.
Findings generally show that, the more zoning and land use that allows for retail marijuana establishments, the more RMFs are to be expected in a given neighbourhood. These results are unsurprising and verify an important assumption – local siting requirements and ordinances help regulate legalised marijuana activities in cities. As Owens (2018) notes, proponents of marijuana legalisation recognised taxation and regulation to offer greater social utility compared to criminalisation. Municipalities, through zoning, also have the power to exclude recreational marijuana from their zoning ordinances and effectively ban recreational marijuana within their jurisdictions (Owens, 2018). As municipalities’ main regulatory tool and power, zoning would no doubt influence RMF siting. Importantly, none of the cities examined in this present study established zoning explicitly for marijuana activities. Instead, they fitted marijuana activities into pre-existing zoning and land use categories. Going forward, identifying whether and how cities change zoning to include marijuana could be an important research area. If so, and considering the significance of residential characteristics, it would be interesting to understand how municipalities factor in residential characteristics in potentially new marijuana zoning. At the same time, variations in localities’ specific wants and needs must be considered in marijuana regulations. Indeed, previous research has noted the differences in municipalities’ regulatory approaches to RMFs within the same state (Dilley et al., 2017) as well as advocating for places to take a step-wise approach to offering equitable siting regulations (Németh and Ross, 2014). While this study’s results are consistent for siting requirements, the inconsistencies across neighbourhood residential characteristics reinforce Németh and Ross’s (2014) suggestion for planners and local officials to develop specified marijuana ordinances that match their communities’ needs.
Additionally, for Portland and Seattle, neighbourhoods with a lower NCI were actually associated with fewer RMFs compared to neighbourhoods with a higher NCI. These results empirically document that pre-legalisation neighbourhood characteristics have a statistically significant influence on locating RMFs in Portland and Seattle, even after accounting for regulations. Thus, socio-economic-related neighbourhood characteristics when factored together influence where legal marijuana facilities go. The finding that neighbourhoods with higher NCIs – and, thus, generally higher White population rates and higher socio-economic factors – have more RMFs provides evidence that RMFs may not be more likely to be placed in neighbourhoods with relatively higher minority rates and lower incomes. Such results support existing research noting that marijuana facilities are not disproportionately sited in minority or poor neighbourhoods (Boggess et al., 2014) and seemingly counter research suggesting that MMDs are likely to be in lower income, but higher minority neighbourhoods (Berg et al., 2018; Shi et al., 2016). This could be due to previous studies analysing medical, rather than solely recreational, dispensaries whereby the change in legalisation could also alter norms around marijuana use and sales. Additionally, as is the case with Shi et al. (2016), previous research does not include land use regulations in analyses that could also explain differences in study results. Nevertheless, while this study does not associate NCI values with advantage or disadvantage, results here could assist in future studies better focusing on legal marijuana in advantaged or disadvantaged spaces. Precisely, if RMFs are a lucrative commercial activity, neighbourhoods that are considered more disadvantaged may be receiving less revenue that could be beneficial for improvements and investment and, therefore, contribute to these neighbourhoods’ further isolation.
Given the finding that neighbourhood conditions influenced where RMFs are located, the third and fourth steps were to investigate whether LULUs or gentrification, respectively, predicted RMFs. This was important to gain insight into whether RMF location patterns could be considered burdensome (i.e. LULUs) or beneficial (i.e. gentrification). The results differed across cities. If RMFs were considered burdensome, LULU-related neighbourhoods would be positively related to RMFs. This was not supported. LULU neighbourhoods in both Denver and Seattle showed negative associations with RMFs – where LULU neighbourhoods were likely to have less RMFs compared to non-LULU neighbourhoods. In general, this finding indicates that in Seattle and Denver, RMFs are not located as though they are a burdensome activity.
If RMFs were considered beneficial, in contrast, then RMFs would be more likely to go in gentrified, rather than non-gentrified, neighbourhoods. While gentrification is a detrimental process due to displacement, businesses may locate to gentrified or gentrifying neighbourhoods due to perceived benefits – especially in terms of reaching higher income customers with disposable income. The work of van de Voorde et al. (2023) specifically notes the effects of commercial gentrification where businesses serving residents that are more affluent can attract additional businesses catering to such clientele. The assumption of RMFs being sited in gentrified neighbourhoods is not entirely supported by this study’s results. Still, findings for Denver are important in showing the potential for legal marijuana facilities to be associated with gentrification. As more time passes to examine change, researchers should evaluate more cities to identify if RMFs are likely to go into gentrified spaces, or if this relationship is unique to Denver. In doing so, new research can better discern if RMFs are influenced by changing neighbourhood conditions as shown in this study or if RMFs are drivers of residential or commercial gentrification.
Much work is still needed regarding the relationship between legal marijuana on neighbourhood change. For starters, while zoning plays a significant role with RMFs, whether zoning changes over time are associated with legal marijuana facilities remains unknown. In addition, next steps could include focusing on combining commercial change patterns with the residential patterns presented here to provide a more complete picture of marijuana siting. Indeed, research by van de Voorde et al. (2023) suggests a specific form of commercial gentrification introduced by legal marijuana: marijuana gentrification. Here, marijuana retailers act as gentrifiers, instead of higher income households and such a previously considered vice or undesirable activity is now made more desirable, thereby inducing commercial changes (van de Voorde et al., 2023). Indeed, understanding how RMFs influence commercial change or existing types of commercial establishments is an imperative next step in understanding marijuana’s overall neighbourhood impact. Additionally, all three cities have recognised the importance of equity in marijuana decisions. For instance, Denver recently initiated a social equity programme for marijuana licencing with Council Bills 21-0216 and 21-0217 in 2021 (City and County of Denver, 2021b). Portland established a social equity programme to offer licence fee reductions and reimbursements for qualifying marijuana businesses (City of Portland, 2021). Washington State also recently established a Social Equity Retail Cannabis Program to assist people in disadvantaged communities to become marijuana retailers (Health Equity, 2021). However, the extent of these programmes and their timeframes for implementation are still relatively unknown.
In terms of limitations, commercial land price data was not publicly available for all cities dating back to 2010 or prior to or immediately after legalisation. Monthly housing costs are included in NCI, LULU, and gentrification variables and housing costs; while not directly indicating commercial land use, they can reflect neighbourhood land values. For instance, Weterings (2014) draws connections between income and property values in the absence of directly using land values in assessing retail store turnover. Still, this is a potential limitation and future studies can include available commercial land price data. Additionally, measuring displacement remains a contentious topic in quantitative gentrification studies (Easton et al., 2020). This paper goes beyond existing methods of accounting for displacement, like only using racial or ethnic composition, and additionally includes poverty stability. More direct measures of displacement such as determining why households moved and especially if they were forced to move in addition to poverty stability or similar variables would better account for displacement. This study nevertheless expands on existing gentrification studies by including an additional proxy for displacement.
Overall, this study offers important contributions that advance understandings of the emerging marijuana industry. First, the location of RMFs is associated with regulations and siting requirements, indicating that zoning has been effective in RMF siting. Second, neighbourhood residential composition plays an important role in influencing RMFs. This means that planners and policy makers cannot simply assume that zoning is the only factor that determines where RMFs go. Rather, understanding existing neighbourhood characteristics is necessary to prevent concentrating RMFs in more advantaged areas. Therefore, it is necessary for planners and policy makers to be aware that despite their best efforts and use of zoning, the socio-economic compositions of neighbourhoods play an important role in where RMFs are located. Indeed, with historical patterns of zoning being used as a tool to the detriment of poor and minority neighbourhoods (see Whittemore, 2017a, 2017b), planners cannot just rely on zoning to keep RMFs equitable. They have to incorporate socio-economic characteristics as shaping influences of location decisions. Third, results here suggest that RMFs are not necessarily burdensome, yet determination of who or what spaces they benefit requires additional analysis. Nevertheless, cities may use these results to distribute RMFs more equitably. These three points emphasise the underlying, practical, implication of this study. That is, due to the effectiveness of zoning on RMF siting and as one of planners’ and municipalities’ more powerful tools, cities can use zoning to better guide the placement of RMFs in an equitable manner by understanding and incorporating neighbourhood conditions in siting decisions. Thus, planners and cities have a unique opportunity to better guide marijuana facilities during the emergence of this new industry.
Supplemental Material
sj-docx-1-usj-10.1177_00420980231198140 – Supplemental material for Burden or benefit: Is retail marijuana facility siting influenced by LULU- or gentrification-related neighbourhood characteristics?
Supplemental material, sj-docx-1-usj-10.1177_00420980231198140 for Burden or benefit: Is retail marijuana facility siting influenced by LULU- or gentrification-related neighbourhood characteristics? by Dwayne Marshall Baker in Urban Studies
Footnotes
Acknowledgements
I thank Anahi Viladrich for excellent suggestions and comments on early drafts and CUNY’s Faculty Fellowship Publication Program for the space for such helpful feedback.
Declaration of conflicting interests
The author declared no potential conflicts of interest with respect to the research, authorship, and/or publication of this article.
Funding
The author received no financial support for the research, authorship, and/or publication of this article.

Supplemental material
Supplemental material for this article is available online.
Notes
References
Supplementary Material
Please find the following supplemental material available below.
For Open Access articles published under a Creative Commons License, all supplemental material carries the same license as the article it is associated with.
For non-Open Access articles published, all supplemental material carries a non-exclusive license, and permission requests for re-use of supplemental material or any part of supplemental material shall be sent directly to the copyright owner as specified in the copyright notice associated with the article.
