
Abstract
Causal evidence of housing premiums of new metro lines is indispensable for financing and governing infrastructure investments. Previous studies have investigated the housing effects of urban rail transit with varying methods, while causality remains unsettled. This study used a natural experiment to estimate the causal effects of the new metro interventions on housing premiums in Shenzhen, China. We used metro planning knowledge, reasoning on pursuits in land finance and engineering efficiency to verify the as-if randomness of the treatment–control group assignment in the natural experiment to reinforce the power of causal inference. We applied hedonic difference-in-difference (DID) models to estimate the average treatment effects based on the longitudinal housing price and rent data. We found that housing rents increased significantly and consistently after the metro entered operation, but the price premium varied. In addition, the rent premiums around new metro lines showed a price gradient over the distance to stations. Our findings provide scientific evidence for designing value capture mechanisms (e.g. value-added property tax and rent revenue) to recover metro investment costs in China.
Introduction
Numerous metro lines (mass railway transit) have been rapidly built in developing cities in the past two decades (Sun et al., 2020; Xu et al., 2016). More than 40 cities had a metro system in China by 2019, with a total track length of 6730 km (Lin et al., 2021). These metros are expected to improve transit accessibility, tackle traffic congestion, and stimulate local economic growth (Billings, 2011; Loo et al., 2010; Mohammad et al., 2013). However, the massive metro investments create heavy fiscal burdens on local governments (Chang, 2014), urging them to devise financial tools for funding the metro projects. Theoretically, metro access could be capitalised into housing prices, and the government has applied various approaches to capture and offset the costs associated with metro development (Yang et al., 2020). For example, China widely used land leasing fees to fund infrastructure projects, including for the metro. However, the accessibility of new metro is typically harvested by developers and property owners as windfalls. China recently considered value-added tax reform as a more sustainable approach. A typical example is collecting capital gain taxes associated with property value increases after the new metro infrastructure (McIntosh et al., 2017). Causal evidence can support designing value capture mechanisms (e.g. tax rate and spatial fee collection area) with equity and feasibility (Billings, 2011).
Previous research mainly relied on observational studies to estimate housing premiums from urban rail transit stations (Bartholomew and Ewing, 2011). Most studies found a positive association between transit accessibility and housing prices (Mohammad et al., 2013). They applied statistical techniques to create the hypothetical treatment and control comparison to estimate the premium effects (Ibraeva et al., 2020). However, unobservable confounders (e.g. selection of transit location and attitude towards property investment) may distort the observed associational results on housing premiums (Cao and Lou, 2018). There is still a lack of research design to examine the before-and-after impact of a new metro line with treatment–control comparisons (Diao et al., 2017). Without a rigorous treatment–control group assignment, we cannot ensure that the measured access premium is not due to confounding factors. However, the difficulty is that a metro intervention cannot be manipulated experimentally, and the design is out of a researcher’s control.
Alternatively, quasi-experiment studies attempted to estimate housing premiums from a new urban rail transit (Ibraeva et al., 2020). These studies compared the price changes before and after new lines using hedonic difference-in-difference (DID) methods (Billings, 2011; Cao and Lou, 2018; Tian et al., 2020). Generally, they assigned the housing units to treatment and control groups based on cut-off points in the distance (Melser, 2020). For example, areas far from the stations are considered control groups, whereas housing in station catchment areas is considered treatment (Diao et al., 2017). However, there may exist a significant difference between treatment and control groups before the construction of rail transit lines, which might even be the reasons (e.g. density and land use pattern) for the government to develop the line in a chosen site. Given that the treatment–control group assignment cannot exclude unobservable confounding factors, the causality inferred is hardly convincing (Billings, 2011; Wagner et al., 2017).
Researchers are seeking more rigorous approaches to improve the credibility of the evidence. Recent reviews distinguished between natural experiment and quasi-experiment, since the latter would not be structured as approaching the power of a randomised controlled experiment, but the former does (Dunning, 2012). A natural experiment should use ‘naturally occurred’ interventions (e.g. rail transit lines) that can as-if randomly assign housing to treatment and control groups to estimate the treatment effects of the new metro. Quasi-experiment approaches might compromise experimental principles, as they usually are without as-if randomness in the treatment–control group assignment, thus making it difficult to obviate (un-)observable confounders.
The substantive knowledge of the interventions, especially transport planning knowledge, can assist treatment–control group assignment to create an as-if random distribution of (un-)observable confounders between the groups (Sun et al., 2022). Leveraging planning knowledge, we present a natural experiment research design to estimate housing premiums of metro access using two newly developed metro lines in Shenzhen, China. We compare the longitudinal outcomes in housing prices and rents between two groups before and after the operation of new metro lines (from construction to the post-operation stage) to infer causal effects on housing premiums in DID model. Our study aims to contribute to the current literature threefold. First, we use metro planning knowledge, reasoning on pursuits in land finance and engineering efficiency to verify the as-if randomness of the treatment–control group assignment. It will reinforce the power of causal inference. Second, we use both price and rent to estimate housing premiums, testing the effectiveness of metro access capitalisation on the two measures. Third, we provide causal evidence in rapidly growing Chinese megacities with radical metro investments and a booming housing market. This study will provide scientific evidence to support land and property policy development.
Related work
Causal inference in housing premiums from transit proximity
Urban rail transit systems have been expanded globally (He et al., 2022; Hurst and West, 2014). They can provide alternative travel options for users, reduce commuting costs, and encourage active living (Yang et al., 2023). Therefore, urban residents may be willing to live close to stations and pay more for transit access (Mohammad et al., 2013). The extra money paid was embedded in the price of housing purchasing or renting (Webster, 2010). Policymakers are eager to know whether and to what extent these premiums would be to design value capture instruments to recover rail transit investment.
Numerous studies have investigated the associations between urban rail transit proximity and housing premiums (Debrezion et al., 2011; Wu et al., 2020). Most studies found positive effects despite these results varying with transit types, neighbourhood characteristics, and city contexts (Debrezion et al., 2007). In addition, several studies used sophisticated statistical modelling to account for spatial autocorrelation and price gradients to transit stations (Ibraeva et al., 2020). However, since most of these studies measure associational relationships, they cannot infer causality between rail transit access and housing premiums.
Quasi-experimental approaches are more powerful than multivariable statistical modelling in estimating the effects of urban rail transit on housing premiums (Wagner et al., 2017). Broadly, a quasi-experiment is an observational study with an exogenous explanatory variable (e.g. treatment or exposure) that the researcher does not have control. In transport-related intervention studies, a controlled interrupted time series research design is widely used, and the DID model is the statistical tool to estimate the treatment effect by comparing housing outcome variables between treatment and control groups before and after the intervention (Melser, 2020). In general, housing around new metro stations that receives improved transit accessibility is the treatment group (Im and Hong, 2018). The control group comprises housing without exposure to the new stations; this group is assumed to have a similar housing value change pattern (Murray and Bardaka, 2021). Most studies identify control groups based on a cut-off point in the distance to the station, assuming that housing beyond the distance is unaffected by the new metro. In those studies, mixed housing premium effects were observed (Dubé et al., 2014; Wagner et al., 2017; Yen et al., 2018).
However, the treatment–control group assignment could be problematic in quasi-experiment studies. The credibility of causal inference rests on whether the treatment–control groups have a balance in (un-)observable confounders (de Vocht et al., 2021; Dunning, 2012). The typical limitations of most rail transit intervention studies are as follows. First, treatment and control group delineation was based on a distance threshold to transit stations, which cannot ensure that the control group is unaffected by the intervention (Billings, 2011). In this regard, the observed treatment effects may be underestimated. Second, the inconclusive findings from previous studies are likely due to difficulties in controlling (un-)observable confounders (Mohammad et al., 2013; Tian et al., 2020). The metro investment is often an endogenous decision made by local governments, in principle, based on urban development strategies and other political and economic reasons, such as the land development potential of the station areas. In China, numerous new stations are located in less-built areas to stimulate development (Yang et al., 2016). The line alignment and station location may be chosen intentionally, leading to biased estimates.
As-if randomness in group assignment in natural experiments
Natural experiments differentiated from quasi-experiments by pursuing as-if randomness in the treatment–control group assignment (Dunning, 2012; Sun et al., 2022). The difference between quasi-experiment and natural experiment lies in whether they would have pursued as-if randomisation of treatment–control assignment to exclude (un)observable confounders to infer causality. The quasi-experiment aims to exclude a list of threats to internal validity to obviate confounding factors, but the confounding may be from unobservable variables. Since random assignment is not under the control of researchers and is difficult to achieve, efforts towards as-if randomness are crucial for enhancing the credibility of the causal inference in natural experiments (Angrist et al., 2002). Several methods identified as as-if random processes were proposed, including carefully justifying the determinates and checking the covariates balance between treatment and control groups (Dunning, 2012).
Qualitative research was essential for understanding the as-if-random nature of the assignment process (Dunning, 2012). The approach is to use substantive contextual knowledge of the intervention to verify the randomness of a treatment and control group assignment (Phan and Airoldi, 2015). However, qualitative knowledge in transport infrastructure impact assessment typically comes as an adjunct to help interpret quantitative research findings. Qualitative research should be more central at the natural experimental design stage, with planning and design domain-specific knowledge employed to reinforce the power of causal inference by improving research design, not just to interpret statistical findings. Our methodology in this paper followed the principles.
Integrating metro planning knowledge into natural experiment design
Planning knowledge of the new metro lines may help achieve rigorous natural experiment research designs (Dunning, 2012; Sun et al., 2022). Optional line alignments and decision-making processes by local government in China provide possibilities for discovering as-if randomness in treatment–control group assignment. During the planning process, metro companies and planning institutes usually formulate several line alignment options for consideration by government officials (Yang et al., 2016). All these options would satisfy planning criteria such as ridership potential, population density, and advocacy of the master plan. However, the local government and metro company needed to fund the metro projects with municipal fiscal revenue or loans in the past two decades (Song et al., 2021). Tax revenue cannot help much, given that 75% of that should be submitted to the central government. In contrast, land leasing fees are under the discretion of local governments. They are the financial pillar of municipal finance to fund infrastructure projects (Sun et al., 2020). Government officials usually finalise metro plans to explore land leasing by locating metro lines and stations in relatively undeveloped areas and linking new towns (Shen et al., 2020).
Another characteristic of the process is the dominant role of engineering considerations in infrastructure provision. The National Development and Reform Commission (NDRC) releases the construction plan for each city’s metro lines every five years. Only when most of the goals (e.g. 70%) formulated in the previous plan were completed will NDRC consider approving a new quota of metro lines to a city. It is thus critical to finish a metro project within five years, from construction to operation. Therefore, metro lines in China are often constructed rapidly to get new line quota approval by NDRC for the next round. Planners and engineers are tasked to find an efficient line alignment. For example, they will reduce the demolition needed and avoid extra engineering difficulties (Lai and Schonfeld, 2016).
Neither land exploitation nor engineering constraints were related to the initial housing price or later housing premiums. This disjuncture allows us to discover a natural experiment with as-if-randomness in treatment – control group assignment by comparing treatment effects on housing premiums around the built with planned but unbuilt routes.
Housing price versus rent: Which better measures premium from the new metro?
Previous studies generally use housing prices to measure the metro effects, partly because data can be conveniently extracted from transaction records (Sun et al., 2015). However, a recent study challenged the reliability and validity of this measure (Melser, 2020). In principle, housing price changes before and after a new metro can be decomposed into speculation, anticipation, and operation effects (Yen et al., 2018). Housing prices might have increased once the metro project was publicly announced (Yiu and Wong, 2005). In China’s booming housing market, housing in megacities is largely unaffordable, driven by owner and investor speculation (Cui et al., 2021), making it difficult to indicate the actual premiums. Longitudinal housing price datasets covering the periods between the announcement and opening are thus required for assessing the accumulated effects (Melser, 2020). However, such data availability is challenging in rapidly developing countries like China.
By contrast, housing rents may better reflect the metro effects quickly. In China, rental contracts are signed for a fixed term, usually one year or shorter. Tenants will estimate housing utility over the given period when they sign a new or renewed contract, allowing the market signal to be more responsive to changes in metro accessibility (Melser, 2020). Theoretically, rent will not change until the metro starts to operate, and it can capture the treatment effect of the metro intervention using short-term data (e.g. one or two years). Moreover, housing rents are a more accurate indicator of preferences for end-users than investors (Hu et al., 2022). Therefore, housing rents could better reflect the causal effects of utility changes like the new metro on the housing market. This also holds in developed cities. For example, Melser (2020) found that rent prices performed better in estimating transit-induced housing premiums than housing prices in Sydney, Australia.
This study thus uses a stringent natural experiment reinforced by planning knowledge and leverages longitudinal housing price and rent data before and after new metro lines to provide robust causal inference. The causal evidence is particularly needed in rapidly developing cities that experienced soaring housing market and transport infrastructure investment, to support designing value capture mechanisms to recover some metro investments.
Method
Intervention: Two metro lines
We conducted the nature experiment by investigating metro lines 7 and 11 in Shenzhen, which have planned optional routes but were abandoned in the decision-making process. This enables us to compare changes in housing price and rent between the built and unbuilt routes. Shenzhen is located in southern China and had a population of 17.6 million in 2022 (Shenzhen Statistic Bureau, 2023). Ten metro lines were in operation in 2022, with a total length of 547 km. The city has expanded its metro system rapidly over the past two decades. The Shenzhen Transport Planning Guideline 2008 advocated speeding up the planning of the new lines, including lines 7 and 11 (Shenzhen Municipal Government, 2008). Meanwhile, Shenzhen has experienced a booming housing market in the past two decades, along with economic development and population growth (Zhou and Guo, 2015).
The local government and state council approved the two lines between 2010 and 2012. Line 7 connected the western and eastern parts of the city with a length of 30.2 km (see Supplemental Figure A1) and covered major residential and employment areas. The construction started in 2012, and the line went into service in November 2016. Similarly, line 11 started construction in 2012 and operation in June 2016, totalling 51.9 km. This line connected the western periphery (e.g. the new airport) and the high-speed rail station in the urban centre. Lines 7 and 11 cost about 25 and 20 billion CNY, respectively.
Treatment and control group assignment
Local planning institutes in Shenzhen proposed optional line alignments in certain segments of lines 7 and 11. Metro route selection among alternative line alignments was finished after consultations with key transport and urban planners and government officers in 2011. The selected routes were moved to the construction stage shortly. However, nearby residents were not informed about the detailed plan and route until the final metro plan was released. We assigned treatment groups that were housing in the catchment areas of the built metro route, and control groups were those in the route planned but not selected by decision-makers.
To strengthen the credibility of causal inference, we followed the criteria Dunning (2012) suggested to verify as-if randomness in the treatment and control group assignment. First, decision-makers have no information, incentives, or capacity to intentionally manipulate housing estates into the treatment or control group. In other words, we can verify if policymakers intentionally assign specific treatment or control groups. Second, if treatment assignments are random, the driving forces should be independent of potential outcomes, referring to housing prices, rents, and related pre-treatment attributes. To verify these, we conducted a document analysis of planning materials (e.g. meeting slides, written notes, reports) and the Shenzhen Immediate Rail Transit Plan (2011–2016), with results consulted with planners associated with the planning at the time.
The planning knowledge of each metro line helped us understand the planning process. Specifically, line 7 had two optional alignments near the Antuo Mountain area (Figure 1). One option crossed with existing line 2 at Antuo Mountain station (red line, Figure 1), while the other plan would intersect it at Qiaochengbei station (blue line). The rolling stock parking lot at Antuo Mountain was set in this area because there are several patches of greenfield land, which meant lower land acquisition and relocation costs for the metro company to be able to finish the line construction in the project period. Rolling stock would need to ascend from underground to the above-ground for parking when metro carriages are out of service. However, the high slope of the track posed engineering difficulties for the alternative scenario (the blue line), given that the elevation to distance ratio between the metro line and the rolling stock parking lot was high. The decision-makers did not anticipate the engineering restrictions until sub-system coordination was needed between the metro depot, rolling stock parking lot, and slope track design tasks. By contrast, the finally selected alignment (red line) can be built from the underground route to the above-ground parking lot with a longer track. From this investigation, we concluded that policymakers did not consider placing the metro line in a specific area for better housing premiums.

The initial line alignment plan and station placement of line 7.
Line 11 also had two optional line alignments in the central area of Baoan District (Figure 2). One plan was along the Baoyuan Road (red line, Figure 2) with two proposed stations, covering the Baoan New Town area and Bihai area. The other plan (in blue) was along the No. 107 national highway with three stations mainly serving the old town area of Baoan. The old town area experienced rapid industrialisation. The blue route should have prevailed because it could serve a large population with heavy traffic. By contrast, the other (red route) option for line 11 partly overlapped with existing line 1, which has been serving adjacent areas since 2011, and would not increase transit accessibility as much as the blue route. However, the red route plan was selected and built eventually. After discussion with the staff from Shenzhen Metro, we understood the reasons that drove the final decision-making. Like other metro lines in Shenzhen and elsewhere in China (Yang et al., 2016), land leasing fees around the new lines and stations need to be captured to finance the metro infrastructure. The land-leasing data provided further evidence of this driving force. We could see that numerous land transactions were concentrated around the red line alignment (see Figure 3), and the land-leasing fees of those parcels exceeded 28 billion CNY from 2012 to 2020. By contrast, few land parcels were leased along the blue line (the abandoned route) in the past decade. The logic is that the highly built area along the 107 National Highway constrained the land leasing potential, while the vacant lots along Baoyuan Road created leasing opportunities. This line planning process was independent of pre-treatment housing prices.
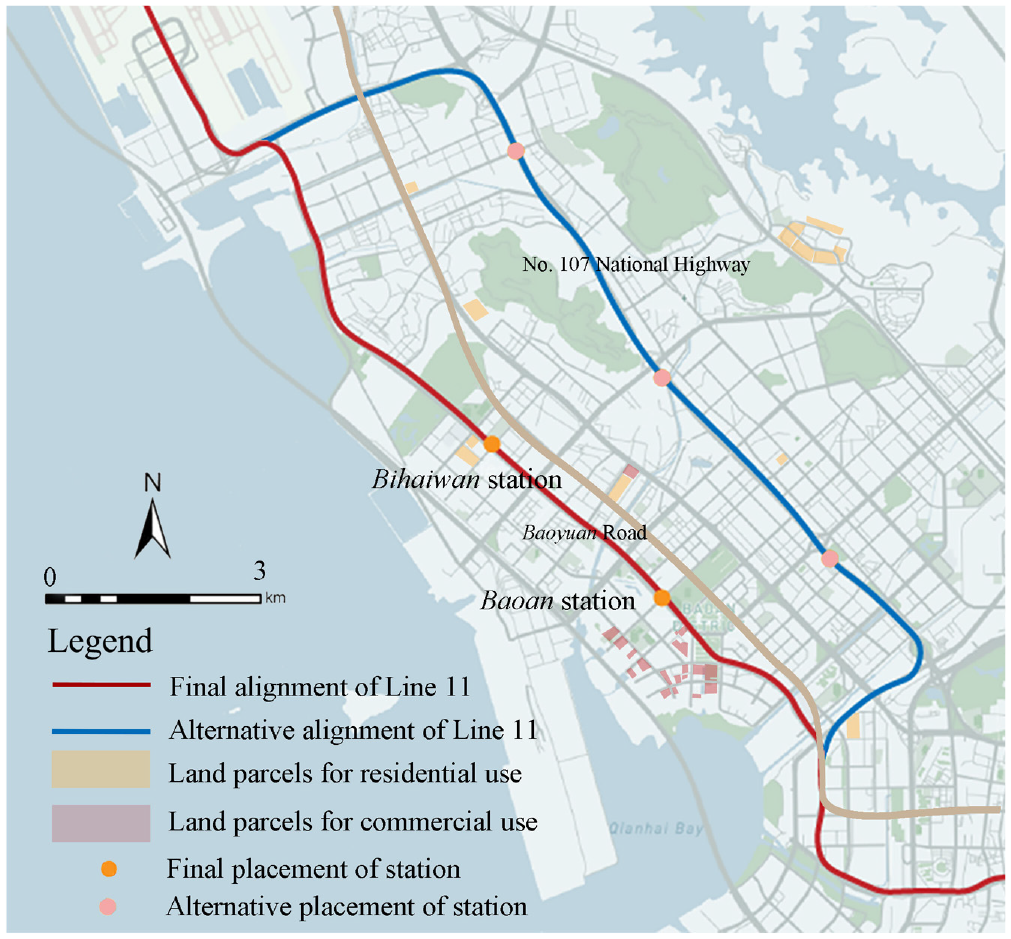
The initial line alignment plan of line 11 and transaction of land parcels in this area (data source: Shenzhen Land and Real Estate Exchange Centre).

Analysis framework of this study. (a) As-if random assignment of treatment and control group, (b) Assumed fluctuation trend between housing price and rent during intervention.
Study design
Figure 3(a) shows our analytical framework. The as-if randomness in the line planning assigns the housing units into treatment groups exposed to the new metro (red lines in Figures 1 and 2), and control groups without the new metro (blue lines in Figures 1 and 2). We applied a hedonic difference-in-difference (DID) approach to analyse the longitudinal data of housing prices and rents to tease out the housing premiums of the metro interventions. Our analysis covered periods from construction to completion stages (indicated in the red dashed line in Figure 3(b)) and assumed a common housing fluctuation trend between treatment and control groups within the time span.
Measurement
Repeat cross-sectional housing data
We collected housing price and rent data to estimate housing premiums from the new metro line. The housing price data were based on transaction records collected from Fang (https://www1.fang.com/), Lianjia (https://www.lianjia.com), and Zhongyuan (https://sz.centanet.com/). Rent data came from Fang and Leju (https://www.leju.com). These are mainstream housing agencies in China, and the data sources have been validated in previous studies (Su et al., 2021). We excluded duplicate transaction records collected from different agents. Our valid dataset ranged from January 2013 to December 2020, covering a reasonable period before and after the metro intervention.
Based on previous studies and planning practices in China, we used samples within a 1000 m walking distance of stations. About 800–1000 m walking distance is the proper covered station area for transit-oriented development (TOD) projects in China (Sun et al., 2016; Xu and Zhang, 2016). Housing data were geocoded in the Geographic Information System (GIS). In addition, we have accounted for changes in the value of the Chinese currency (CNY) by converting prices and rents into 2013 real values using the annual Consumer Price Index (CPI) from the National Bureau of Statistics.
Covariates
Covariates included commonly used unit-level attributes for each housing unit, including floor area, number of bedrooms, age, orientation, and number of total floors of the building. We also controlled for locational and amenities attributes, including floor area ratio, number of buildings in the estate, and covered school district (number of primary and middle schools). In addition, we controlled for walking distance to the nearest metro station, distance to the nearest metro transfer station, and distance to the central business district (CBD). All were measured for each transacted housing unit. Detailed information is shown in Supplemental Table A1.
Statistical modelling
Hedonic difference-in-difference analysis
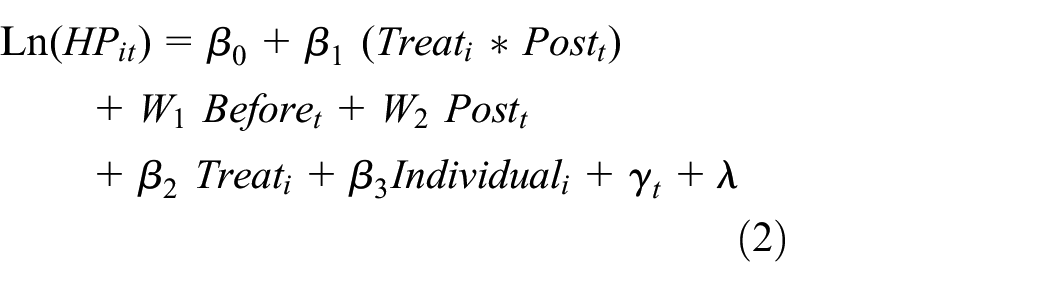
We applied hedonic DID models to estimate the average treatment effect by comparing housing premiums at different stages based on repeat cross-sectional datasets. DID models can overcome omitted variable bias and time-invariant effects often plaguing traditional hedonic models. For example, without DID, a hedonic model would be biased if metro stations were located in more (or less) expensive housing areas (Wagner et al., 2017).
There are 32 quarters in the study period (2013–2020), and the quarters in which the metro lines were opened (2016 Q2 for Line 7, and 2016 Q3 for Line 11) were used to distinguish the before and after intervention periods. The baseline model estimated average treatment effects (Model 1–4), with the hedonic DID model specified as:

where
We fitted several DID models to explore the accessibility effects of the metro stations. Following previous studies (Diao et al., 2017), three interaction items were created (Treatment (0–200 m) × Post), (Treatment (200–600 m) × Post), and (Treatment (600–1000 m) × Post), after dividing each treatment group into three categories: within 200, 200–600, and 600–1000 m (Models 5–8). The variance inflation factors (VIF) of the independent variables were less than 2 in all models, showing no multicollinearity.
All analyses were conducted in STATA 17.0.
Parallel trend analysis
We conducted a parallel trend analysis to check the internal validity of the DID model. We explored the plausibility of the common trend assumption over the study period. A revision of equation (1) was used to test the parallel trend:
where
Falsification test
We used a falsification (placebo) test by randomly assigning the sample observations to the treatment and control groups to test if unobservable variables may influence the estimated effects (Zheng et al., 2020). We had 123 sale/rental transactions randomly assigned to the treatment group. Falsification estimation was conducted using the same specification in our baseline model and this falsification test. We repeated the falsification test 500 times to increase the identification power. Ideally, the false interaction variable should have no statistical significance and carry a magnitude of estimate around zero.
Results
Descriptive statistics
Table 1 summarises the descriptive analysis of observations for Line 7, with 818 sales and 616 rental records. The average sale price was 66,432.2 CNY per m2, and the monthly rent price was 84.1 CNY per m2. The average price was higher in the treatment than in the control groups. Most covariates do not show significant differences between treatment and control groups for Line 7, except for the age of housing and whether oriented to the south.
Descriptive results of transaction records in study area (Line 7).
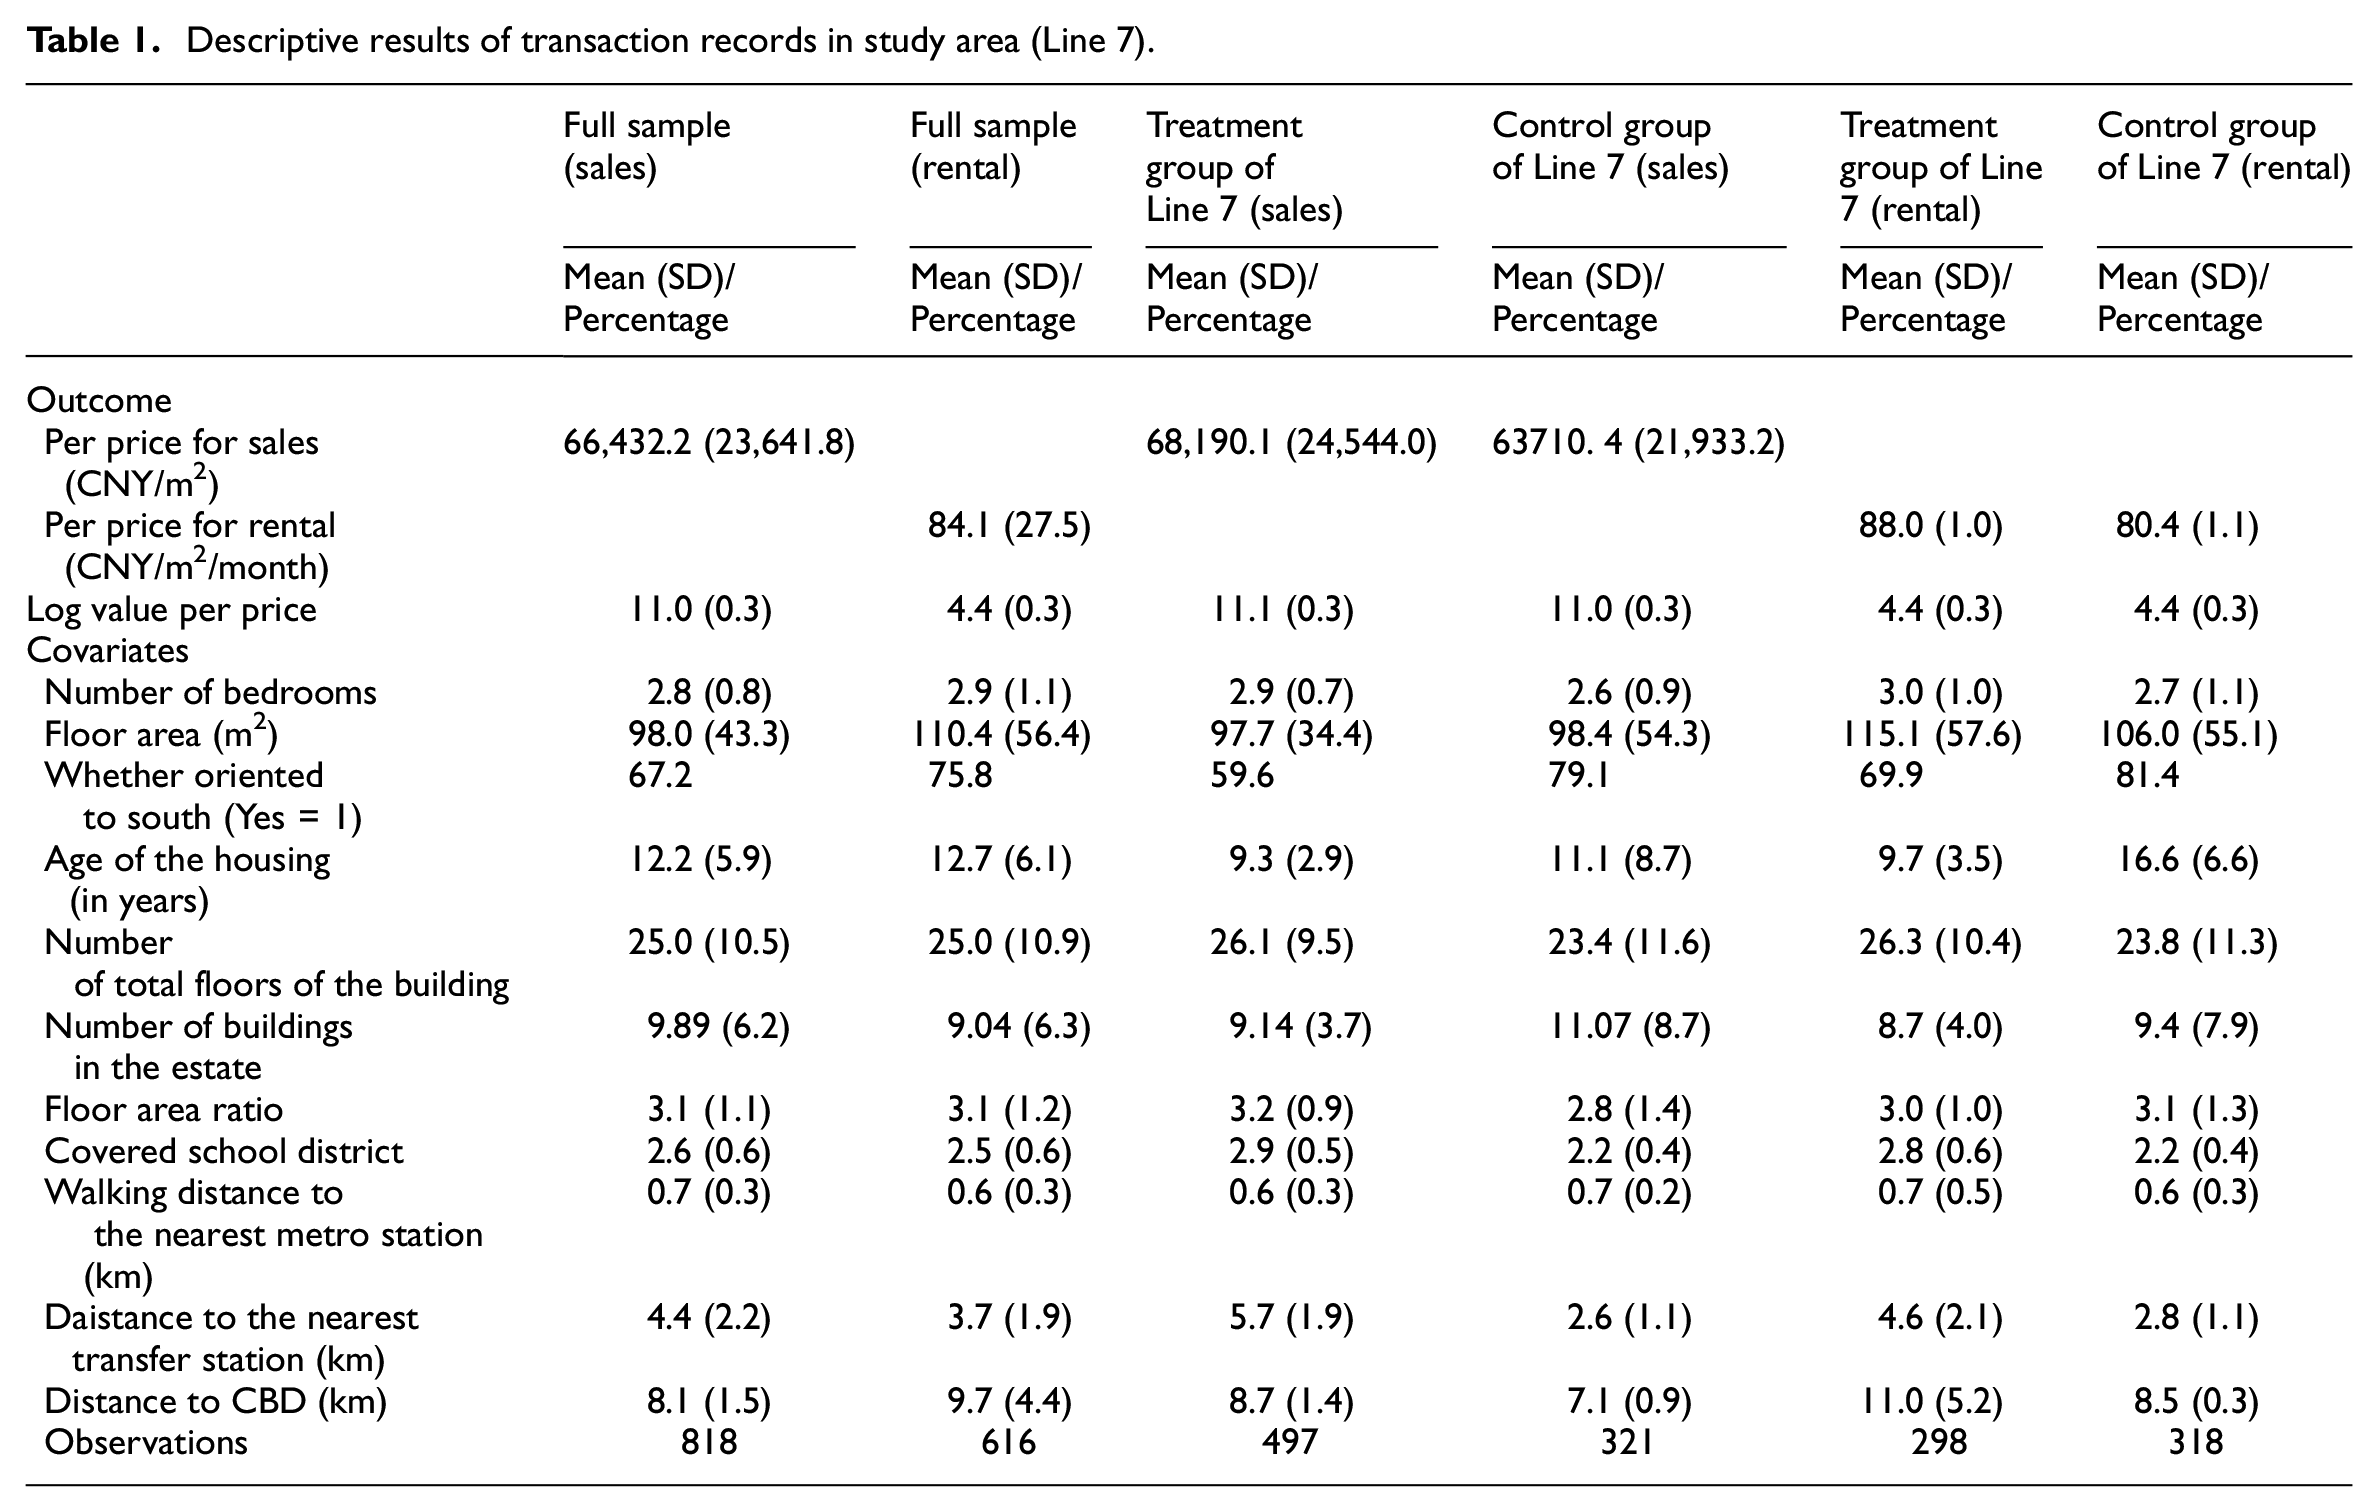
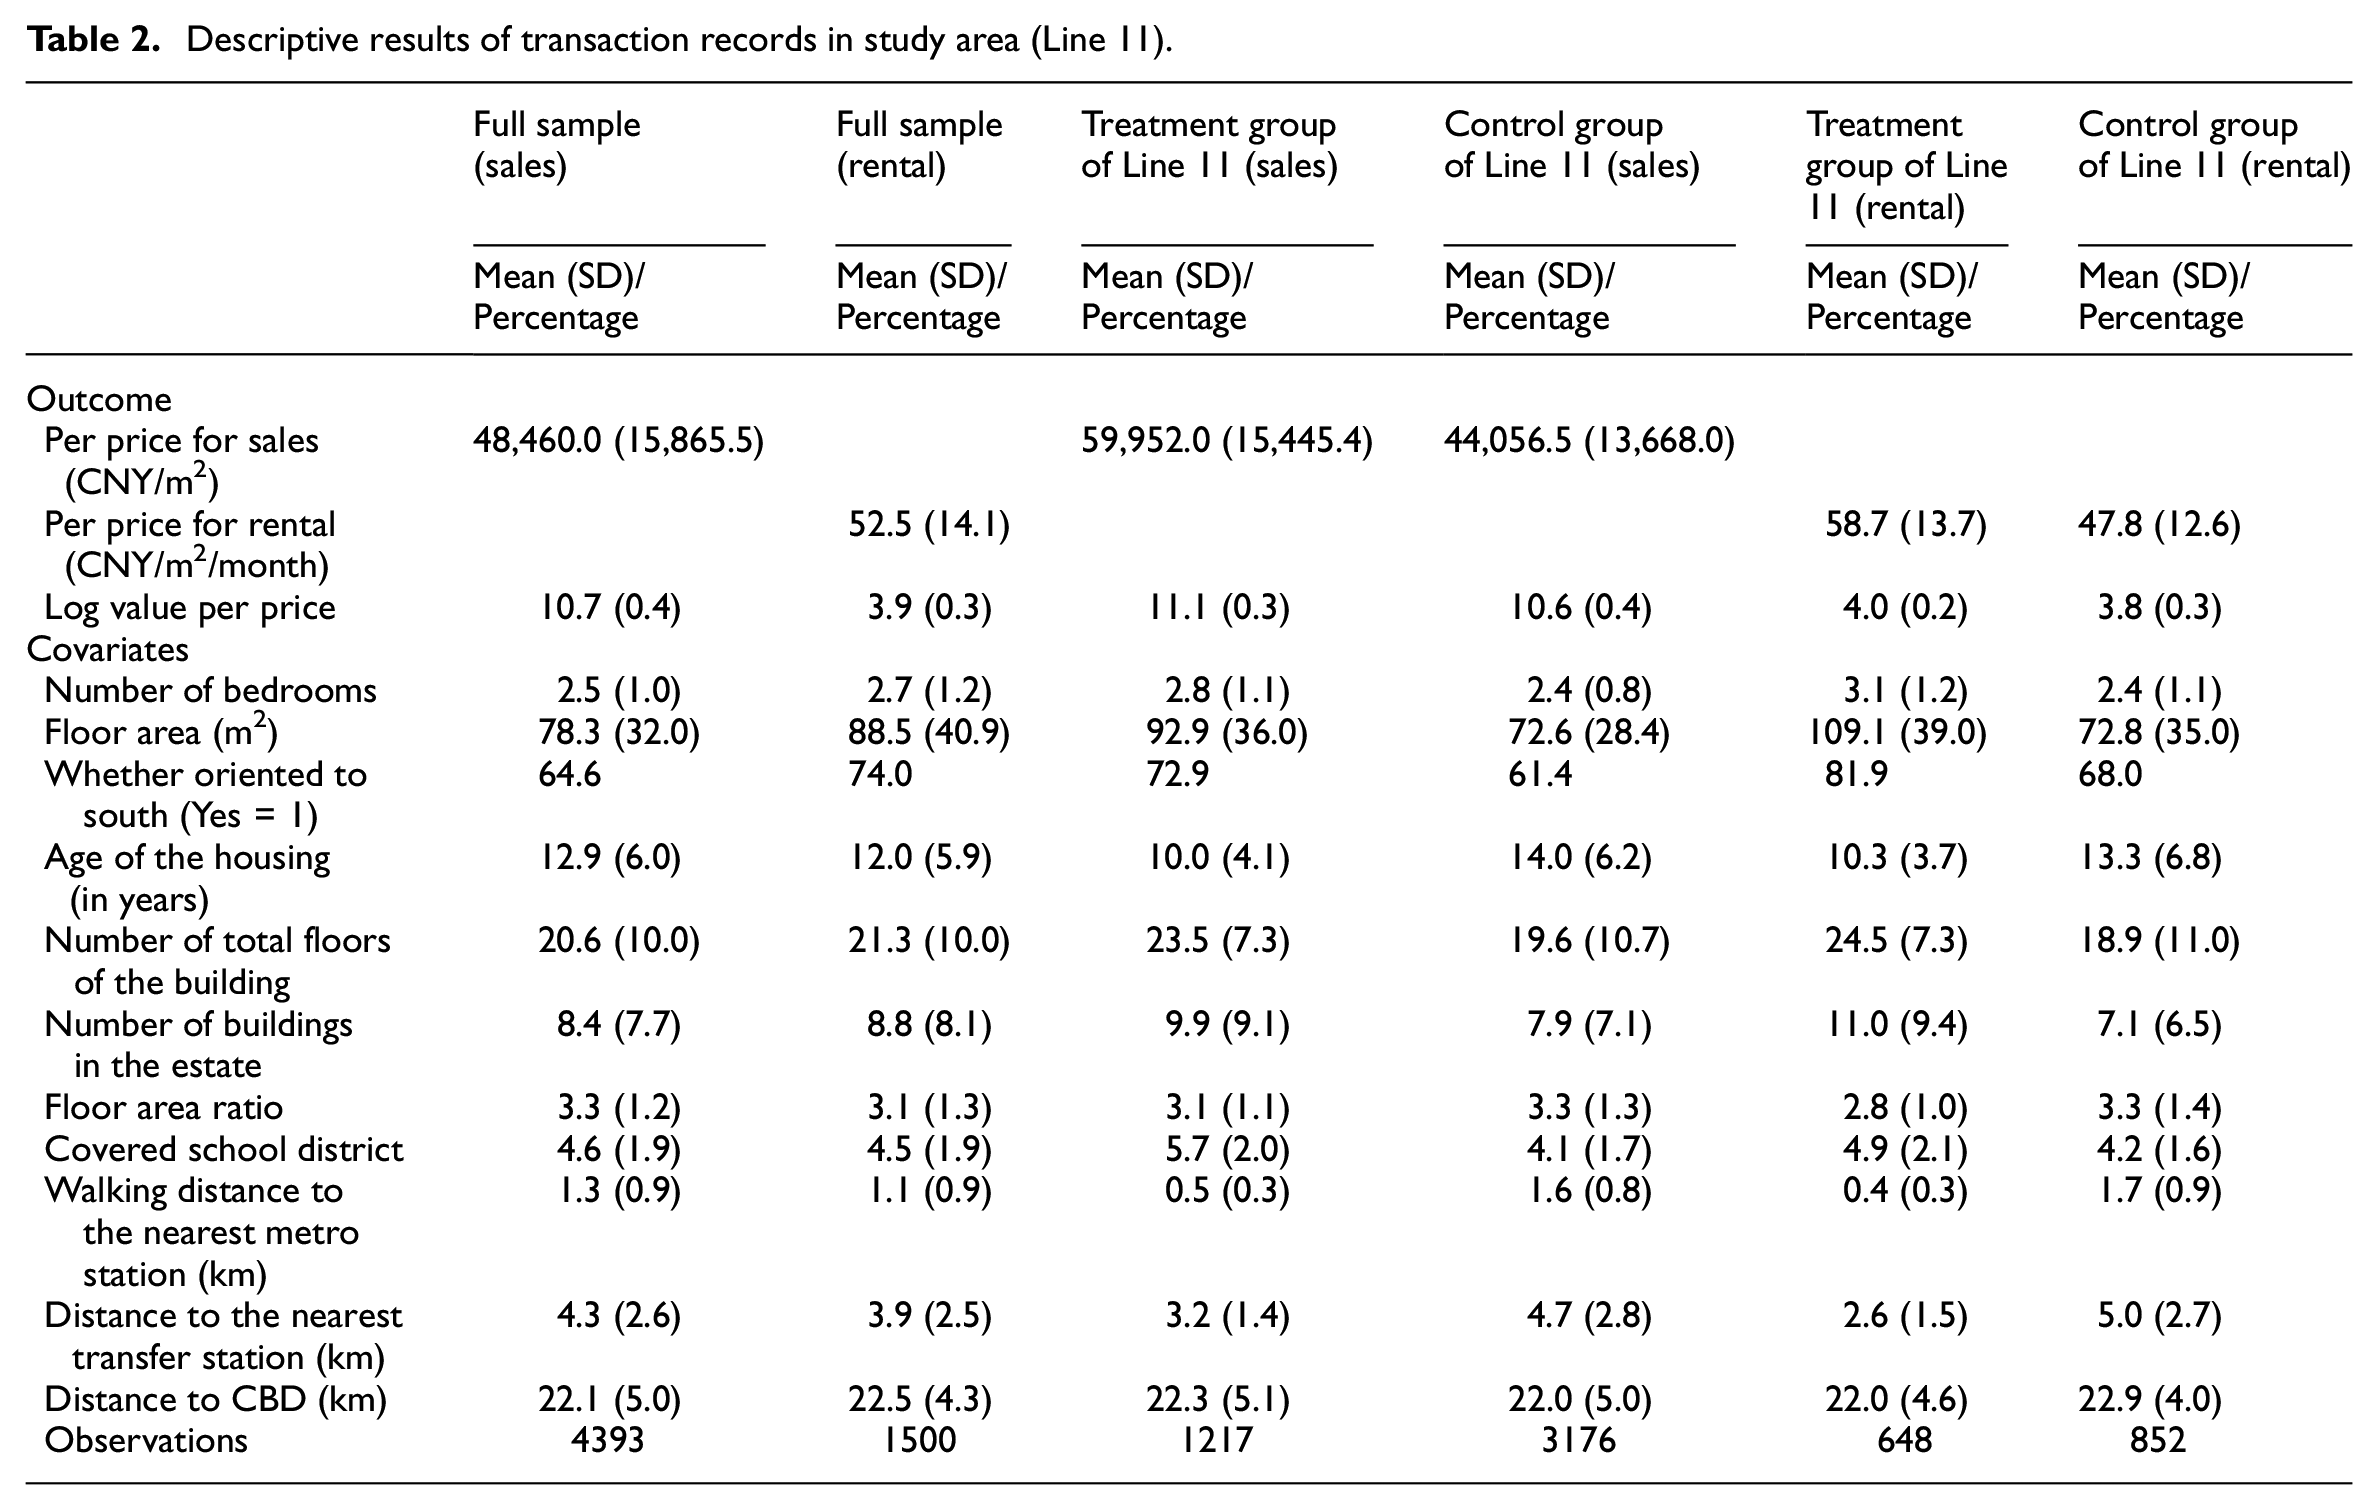
Table 2 shows the observations for Line 11, with 4393 sales and 1500 rental records. The average sales price was 48,460.0 CNY per m2, and the average monthly rental was 52.5 CNY per m2. The average price was also higher in the treatment than in the control group. Most covariates do not show significant differences between treatment and control groups for Line 11, except for walking distance to the nearest metro station.
Descriptive results of transaction records in study area (Line 11).
Housing premiums of new metro lines
Table 3 shows the results of the hedonic DID model for housing premiums in treatment and control groups of Lines 7 and 11. Note coefficient (β) differs from the estimated impact for interpreting dummy variable coefficients in a logarithmic equation, and the actual effect is calculated by
Results of average treatment effects on housing premiums.

Note. Unit-level, locational, and amenities attributes were incorporated in the models.
p < 0.05. **p < 0.01. ***p < 0.001.
DV represents the dependent variable.
For Line 11, Model 3 shows that the effect of the metro intervention on the housing price premium of treatment groups was insignificant, relative to control groups. Model 4 shows treatment effects on housing rents for Line 11, and the coefficient indicates that the rent premium is 16.4%, comparing treatment and control groups. The findings show that only housing rents experienced a premium for the treatment group in Line 11.
Spatial variations in treatment effects
Table 4 shows spatial variations in the treatment effects for Lines 7 and 11. The key variables are three interaction terms, capturing the housing value premium of different bands in treatment groups to that of control ones. For Line 7, coefficients illustrate that the two outer rings (housing units between 200–600 m and 600–1000 m) show significantly higher housing price premiums than the control group, while the inner ring (housing units within 200 m) shows no significant effects (model 5). Model 6 finds that rents in the three rings were 14.7% (0–200 m) and 20.7% (200–600 m) higher than those in the control groups, respectively, while the outer ring (housing units over 600 m) shows no significant effects.
Spatial diffusion effects of housing premium.
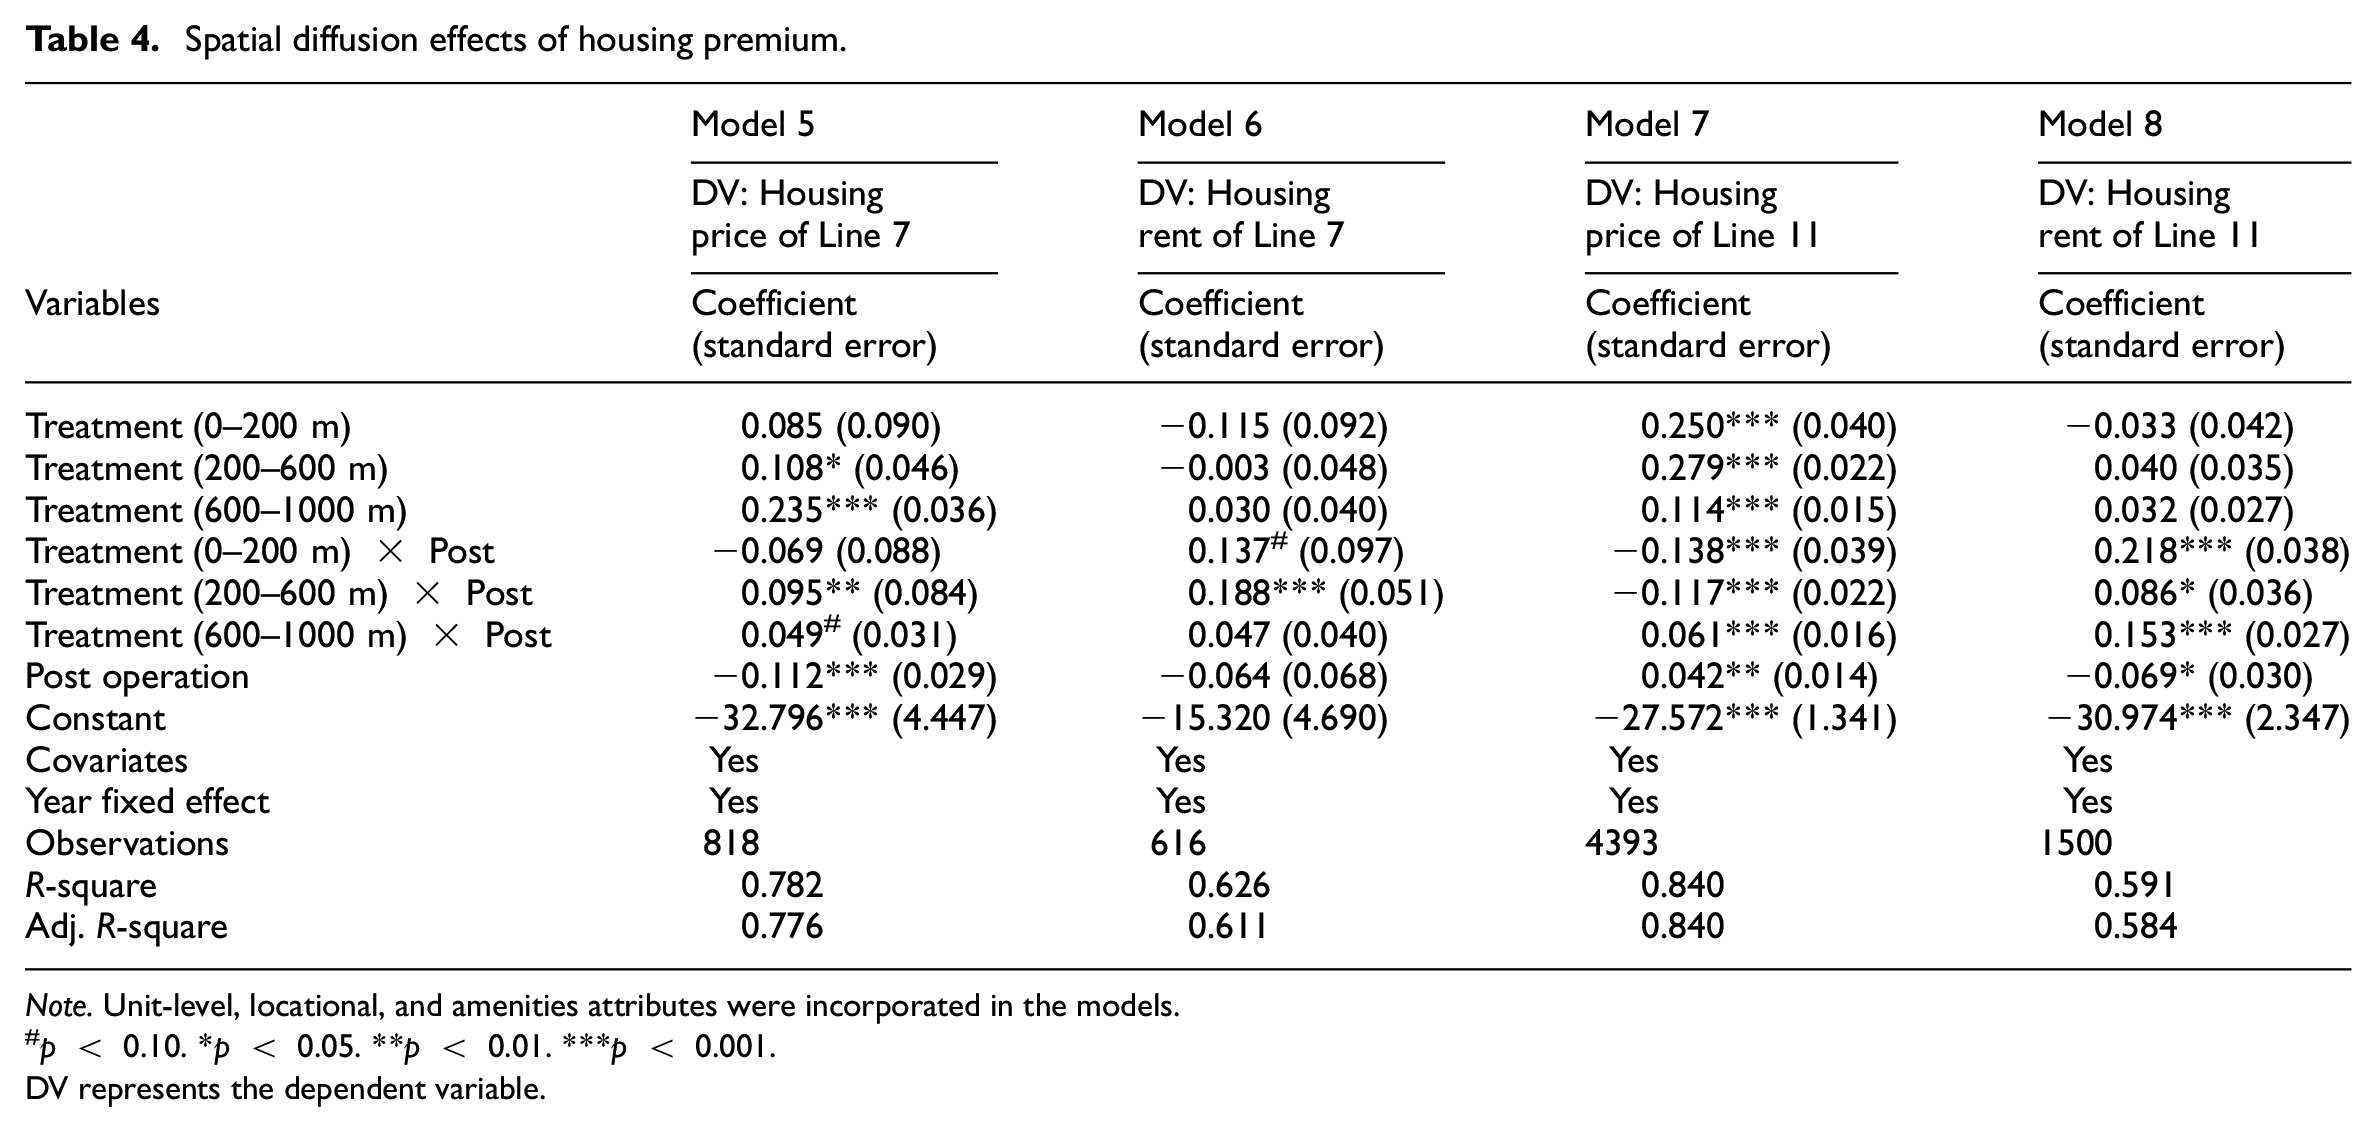
Note. Unit-level, locational, and amenities attributes were incorporated in the models.
p < 0.10. *p < 0.05. **p < 0.01. ***p < 0.001.
DV represents the dependent variable.
Regarding Line 11, the treatment effects show that housing prices closer to the station have lower housing premiums than those in the outer ring (Model 7). We discuss the possible reasons in the next section. Model 8 illustrates that treatment effects of rental records in different bands were 24.4% (0–200 m), 9.0% (200–600 m), and 16.5% (600–1000 m) higher than those in the control groups, respectively. Although the trend varied some with specific lines, we found an overall price gradient of housing rent premiums for both lines, while not on housing price.
Robust tests
Our parallel trend tests show treatment and control groups had a similar trend before 2016, especially one year before the operation (see Supplemental Figure A2). The statistical results confirmed that the hypothesised parallel trend holds. In addition, our falsification test confirmed the effects of metro intervention on housing premiums were unlikely to be affected by unobserved variables (see Supplemental Figure A3).
Discussion and conclusion
Causal inference of housing premiums of new metro lines is indispensable for financing and governing the infrastructure investments. Previous studies have investigated the effects of urban rail transit on housing outcomes with varying methods, while causality remains unsettled. This study investigated the causal effects of the new metro interventions on housing premiums in Shenzhen, China. Our research design used the substantive knowledge of the new metro line planning to achieve as-if randomness in treatment-control group assignment. Therefore, the group comparison in the housing premiums was supported by a logical reasoning of the data-generating process. For Line 7, our DID models found that both housing prices and rents increased significantly after the operation of the new metro, while we only observed increased housing rents for Line 11. In addition, both lines had a rent premium gradient to metro stations.
Our study showed that planning knowledge can reinforce the power of causal inference of natural experiments at the research design stage. The engineering constraints and land exploitation potentials assigned treatment and control groups as-if randomly, meaning that housing premiums measured through DID models are less likely to be distorted by confounders because as-if randomness should have created a balanced distribution of (un-)observable confounders between the treatment and control groups (Sun et al., 2022). Our parallel trend test also strengthened this argument. Natural experiments differed from other quasi-experimental research designs that rely on post-design statistical modelling approaches, which are challenging to exclude alternative explanations of housing premiums (Acton et al., 2022). Future natural experiment studies on this topic should incorporate planning knowledge (e.g. unique policy and planning practices) to enhance their research design for causal inference.
We provided causal evidence of new metro lines on housing prices and rent premiums in rapidly developing cities. Housing prices and rents in treatment groups achieved higher premiums than control groups along Line 7. The results were consistent with most longitudinal studies that highlight the housing premium effects of urban rail transit (Diao et al., 2017). We noted that the price premium is approximate to recent studies in North America and Australia, whose estimates ranged from 3.8% to 11.3% (Billings, 2011; Melser, 2020; Pilgram and West, 2018), while the rent premium is higher than the light rail transit project in Australia (Melser, 2020). Our study is consistent with the assumption that new metro lines significantly benefit housing values in Chinese cities. Likewise, we found a considerably higher premium in housing rents around Line 11 than in previous studies. However, housing prices in this line did not show a significant premium compared to the control group along the unbuilt route. A possible explanation is that the adjacent Line 1 has been in service since 2011, which may have created speculation and anticipation effects before the construction of Line 11 in 2012. In addition, the high housing supply resulting from recently leased land parcels made this area (built along the route of Lines 11) a hot spot for speculative housing investment. This might have suppressed the premiums that metro access brought. The results show that the new metro is a complex intervention, and its treatment effects on price premiums could be context-dependent. However, the research designs for causal inference are generalisable.
We found housing rents as a validated measure of metro-induced accessibility benefits (Melser, 2020). Capturing the aggregated housing price premium from the new metro requires data to cover the entire intervention (Yen et al., 2018). In Chinese cities with soaring housing prices and speculation, many factors could confound the observed housing price premium during the intervention. On the contrary, housing rent is a more reliable measure of assessing metro-induced premiums based on a short span of the dataset before and after the metro operation. Specifically, we found that housing rents experienced a higher premium than housing prices in the treatment group compared to controls, along both metro lines. Renting housing is much more affordable than purchasing, and the tenancy term is flexible. Therefore, the new metro infrastructure is more likely to affect it. Shenzhen has a long-distance commuting pattern; a single workplace–home trip could take over one hour. Tenants may value rail transit service and metro access more than housing buyers. Thus, metro intervention and utility changes would attract tenants in a competitive rental housing market. Since long-term data tend to be lacking and it is difficult to capture the overall premium level, housing rent premiums could be used to represent aggregated housing premium levels. Our study suggests future research on China metro-housing premium studies use housing rent to assess the effects of new transport infrastructure.
We also found a housing rent premium gradient from the station to the outer areas. In the dynamic leasing process after the metro operation, tenants with lower bids will likely be replaced by others with stronger preferences for metro access. Eventually, consumers with higher budgets occupy rental housing with better metro proximity. By contrast, a wider range of factors (e.g. education, housing environment) will influence people’s decisions when purchasing housing, and improving metro access is just one. Speculative property prices may be less sensitive to the distance decay to metro access.
The study has limitations. First, we do not have access to repeated sales or rents, which track transaction records of the same housing unit. Previous studies applied propensity score matching to create a statistical pair in the treatment–control groups. However, it would require complicated statistical hypotheses about the similarity of the pairs (Acton et al., 2022). Instead, our DID models accounted for the variance of the unit and estate covariates and time-fixed effects. The compositions (e.g. floor area, age of the housing) of housing transactions in different years showed similar patterns. Second, we only estimated average treatment effects from the construction to operation stages. We could analyse the anticipation effects between the project announcement and the beginning of construction if there is a better-established dataset in the future..
Despite the limitations, our study has notable strengths. We advance the causal estimation of new metro lines on housing premiums in a rapidly growing Chinese city. Our findings can support institutional designs for financing metro infrastructure and value capture models. Currently, no institutional schemes in China can capture the windfalls in property value increases created by metro investment. China started experimenting with a value-added housing tax in 2021, while the mechanism is still debated. Considering the complex housing price premium mechanism, devising property taxes like those in the U.S. may trigger controversy. Implementing a tax based on rent revenue from the new metro may be feasible to compensate for some of the metro investment. Our study offers methodologies and causal evidence to design value capture mechanisms, for example, specified rent revenue rates within spatial fee collection areas around metro stations.
Supplemental Material
sj-docx-1-usj-10.1177_00420980231208560 – Supplemental material for New metro and housing price and rent premiums: A natural experiment in China
Supplemental material, sj-docx-1-usj-10.1177_00420980231208560 for New metro and housing price and rent premiums: A natural experiment in China by Dongsheng He, Guibo Sun, Ling Li and Chris Webster in Urban Studies
Footnotes
Declaration of conflicting interests
The author(s) declared no potential conflicts of interest with respect to the research, authorship, and/or publication of this article.
Funding
The author(s) disclosed receipt of the following financial support for the research, authorship, and/or publication of this article: This study is funded by NSFC (No. 52078446). The funder had no role in study design, data collection and analysis, publication decision, or manuscript preparation.
Supplemental material
Supplemental material for this article is available online.
References
Supplementary Material
Please find the following supplemental material available below.
For Open Access articles published under a Creative Commons License, all supplemental material carries the same license as the article it is associated with.
For non-Open Access articles published, all supplemental material carries a non-exclusive license, and permission requests for re-use of supplemental material or any part of supplemental material shall be sent directly to the copyright owner as specified in the copyright notice associated with the article.