



Abstract
The changing class structure of cities has been a topic of considerable importance and debate for over a 150 years, since the industrial revolution created a large industrial proletariat in many western cities. But the rise of post-industrial society, the decline of the manufacturing industry, a shrinking industrial working class, and the growth of the professional and managerial class from the 1970s onwards has provoked fresh debate about this, as has the emergence of gentrification in many cities. This paper looks at the changing social class structure of London from 2001 to 2021 using data from the population Census. It shows that the higher professional and managerial class continued its long term growth after a pause in 2001–2011. But the number and proportions of small employers, the self-employed and routine workers have also grown. There is therefore continuing professionalisation but also ‘asymmetric polarisation’. The paper also examines the geography of social class change by borough over the period and shows that while the professional and managerial class grew in all boroughs, suggesting a gradual upward class change across London, it was highest in the most gentrified inner London boroughs. However, the percentage point growth of the self-employed and routine groups was generally higher in the mostly suburban boroughs where professional and managerial class percentage point change growth was smallest (and vice versa) which suggests an intensified social class sorting and divergence across London with the lower class groups growing most rapidly in suburban outer London where housing costs are less.
Introduction
The changing social structure of cities is of considerable interest and importance both to urban social scientists and urban policy makers and, not least, to urban residents themselves. Such changes range from changes in racial and ethnic structure to changes in religious and demographic composition and changes in migration. One of the key changes which has generated considerable debate for over 150 years is the changing social class structure of cities in developed western countries (Booth, 1901; Engels, 1846; Stedman-Jones, 1971; van Ham et al., 2020; Walks, 2001; Wilmott and Young, 1973). The Industrial Revolution led to the creation of a large unskilled urban working class in the 19th century and the Fordist period saw the expansion of a large industrial working class in the first half of the 20th century in western cities. The rise of post industrialism and offshoring of many industrial jobs, however, led to both a shrinkage in the number of industrial jobs and the creation of a greatly expanded office based labour force from the mid-1960s onwards. The number of professional and managerial workers, mostly university educated, also began to grow rapidly. This has led to debate about whether the occupational class growth was just at the top end (professionalisation), the bottom (proletarianization) or both with a declining middle (polarisation).
The key issue is simple: are different cities becoming more middle class, more working class or more polarised, with growth at both the top and bottom ends of the class distribution and a shrinking middle? The implications are important for an understanding of changes in incomes, living standards, health, education, housing costs and consumption. The debate was given impetus by Sassen (1991) arguing that global cities were becoming polarised with a high wage professional class and low wage service class but this was questioned by Hamnett (1996, 2003a). More recently, detailed comparative work by van Ham et al. (2020) and case studies by Clerval (2022) and Boterman and Van Gent (2022) have shown that London, New York, Tokyo, Paris and Amsterdam have all become much more middle class in recent decades (see Andreotti et al., 2015) This is not to suggest that the working class has disappeared: it clearly has not, and nor have the poor, but that the occupational class structure of many major western cities has shifted upwards in recent decades with strong growth at the top end. Nor are these trends confined solely to western cities as Marques (2020) has shown for Sao Paulo and Shi et al. (2017) for Beijing.
This process has also been linked to increasing gentrification which has been an important aspect of changing class structure. The argument about middle class growth has been criticised (Davidson and Wyly, 2012; Watt, 2008) as suggesting the triumph of the middle classes and a marginalisation of the working class. This seems misguided, not least because if the middle class is growing in size it is very important for working class life chances and for political and policy reasons (housing, education, health, voting). It is not an argument that the working class has ceased to matter. Some (Davidson and Wyly, 2012) even argue that there is no such thing as the ‘middle’ class, but although many lower middle class jobs are routine white collar office jobs (Kumar, 1978), given the large growth in upper professional and managerial jobs in most western countries over the last half century this is a difficult position to defend, and Marxist class theorists such as Ehrenreich and Ehrenreich (1979) and Ikeler and Limonic (2018) have pointed to the growing importance of the educated professional managerial class (PMC) in contemporary capitalist societies. The PMC also plays a key role in helping to power gentrification as Hamnett (2003a, 2003b), Butler et al. (2008), Hamnett and Butler (2013) and Cunningham and Savage (2017) argue for London, but two recent books have highlighted the process of upwards urban class change in other cities. The first, by Clerval (2013), a Marxist sociologist and no friend of gentrification, argues that social class change and the gentrification of Paris have transformed the social structure of the city by replacing, displacing or squeezing out much of the working class population, many of whom have moved out to the social housing estates outside Paris or beyond. Paris, she argues, is now ‘a city without its people’. She subsequently develops this argument using detailed census data (Clerval, 2022) showing that between 1982 and 2008 the professional and managerial groups grew substantially in Paris, while the working class population shrank significantly. Gentrification also pushed across the city into the remaining working class areas. She states:
From 1982 to 2008, Paris social singularity became more evident with an overrepresentation of managers and professionals and a clear underrepresentation of blue-collar workers compared to the region and the country … The overall transformation of the social structure followed that of jobs, matching the shifts experienced by industrialised countries in the past few decades. (Clerval, 2022: 40)
She adds that looking at the whole metropolitan area: ‘There are almost no working class areas left in Paris’ (Clerval, 2022: 42). While some aspects of her interpretation have been questioned (Hamnett, 2021), she views the growth of the professional managerial class as the key motor of this transformation.
The second work is by Boterman and Van Gent (2022). Entitled ‘Making the middle class city’ it is a study of the changing class structure, gentrification and politics of Amsterdam from the early 1980s to the present day. As they point out in the introduction:
In this period Amsterdam changed from a relatively poor city under a radical left wing government to a city dominated by middle classes, socially, culturally and politically. The majority of the city’s adult population is now highly educated, and the growth of the number of more affluent residents and their impact on politics and public life has meant that Amsterdam has essentially become a middle-class city (Boterman and Van Gent, 2022; 2).
They argue that there has been a reciprocal relationship between the changes in class structure and the changes in class politics in Amsterdam, and that the rise of the new middle classes has brought about a new urban politics that centres around their interests rather than those of the working class. More generally they suggest out that: ‘over the past five decades many major cities have become dominated by the (upper) middle classes at the expense of the working classes’ (Boterman and Van Gent, 2022: 7).
As with Clerval, their analysis does not necessarily imply that the changes are welcome but that they exist and cannot be ignored. Looking specifically at London, Hamnett (2003a, 2003b) and Butler et al. (2008) showed that London’s population became increasingly middle class from the early 1960s up until the turn of the century. The dominant process during the years from 1961 to 2001 was one of growing professionalisation with a concomitant shrinkage of the skilled, semi-skilled and unskilled industrial working class. What has happened subsequently? Have the first decades of the 21st century seen a continuation of this trend or the rise of new trends? May et al. (2007) argued that though professionalisation may have previously been dominant, a combination of neo-liberal government policy and growing migration into London in the 20th century was creating a growing group of low wage service sector workers, many from overseas, which was leading to growth at the bottom end of the occupational class structure but they did not utilise systematic large scale empirical evidence to support this. Manley and Johnston (2014) argued, using the 2011 Census, that the middle class population growth of London had stalled from 2001 to 2011. This was correct but, as Hamnett (2015) noted, it remained an open question whether the late 20th century growth would subsequently resume, halt or go backwards.
The recently published results of the 2021 UK Census allow us both to answer this question and to examine the geography of social class change in London over the whole 20 year period, which is important for discussion of gentrification and spatial polarisation. This can be done at a very detailed level, but this paper restricts itself to analysis of the structure and geography of occupational class change across the 32 London boroughs, which, excluding the City of London (which has a very small resident population but a large and globally important workforce), have an average population of 250,000. This enables a broad-brush analysis looking at both inner and outer London boroughs, and differences between more middle class and more working class boroughs. We can examine whether upwards social class change has continued in London and, if so, whether it has been concentrated in inner London or whether it has spread outwards across the whole of London. We can also ask what has happened to the rest of the social class structure. Is there growth at the bottom or elsewhere and if so, where? To what extent is the class geography of London becoming more similar or more differentiated as Butler et al. (2008) and Cunningham and Savage (2017) argue? While the borough level analysis inevitably loses local spatial detail it allows us to focus on the bigger picture of socio-spatial change. We discuss these questions in the remainder of the paper after a short discussion of the data sources and definitions.
Data and methodology
The paper relies on official British Census data on occupational social class for 2001, 2011 and 2021 or, more precisely, the National Statistics Social Economic Classification (NS-SEC) produced by the Office for National Statistics (Office for National Statistics, 2022a). It is based on occupation and job and rests conceptually on the widely internationally accepted Goldthorpe class schema which is based on employment relations and conditions. It is not based on income or wealth, although both of these are frequently related closely to social class, with higher social classes generally having higher incomes and, controlling for age, greater wealth. Nor it is based on ownership and control of the means of production, although again there are some linkages. The diffusion of share ownership (through ISAs, pension funds etc.) has meant that ownership of the means of production is now more widely spread than it was in the 19th century and more sophisticated recent neo-Marxist interpretations (Ikeler and Limonic, 2018) highlight the fact that control of capitalist enterprise is often in the hands of professional and managerial non-owners. Cunningham and Savage (2017) also stress the importance of the professional and managerial elite in their work although they focus on economic, social and cultural capital rather than employment relations. They argue that the focus on occupation and employment relations is unduly limited as it ignores cultural and economic capital and ‘fail[s] to fully register the full implications of urban social change in London’ (Cunningham and Savage, 2017: 27). While this is true, not least given the growth of the wealthy international elite (Atkinson, 2020), the Census social class classification offers a clearly defined and consistent basis for comparison over time.
From 2001 the previous occupation classification which was based on socio-economic groups (SEGs) was replaced by the new classification. Thus, while it is possible to have a consistent series of Census SEG data from 1961 to 1991 this was then replaced by NS-SEC which has eight main categories: (1) Higher managerial, administrative and professional, (2) Lower managerial, administrative and professional occupations, (3) Intermediate occupations, (4) Small employers and own account workers, (5) Lower supervisory and technical occupations, (6) Semi-routine occupations, (7) Routine occupations, and (8) Never worked and long term unemployed. In addition, there is an unclassified category (9) which includes students and others. These in turn are broken down into a number of more detailed sub-categories but the focus here is solely on the major categories which require some discussion and clarification (see Rose et al., 2005).
The ONS employs a number of specific protocols to classify individuals into occupational groups. For example, the higher managerial, administrative and professional category includes large employers (over 25 people and some delegation of managerial responsibility) and higher professionals such as doctors, lawyers, dentists etc. If an individual is a professional but has a supervisory position or is self-employed, the professional designation would take priority. The small employers’ category is rather more straightforward. The ONS defines small employers as having under 25 workers and often only one or two. They are similar to own account workers which the ONS describes as: ‘Self-employed positions in which people are engaged in any (non-professional) trade, personal service or semi-routine, routine or other occupation but have no employees other than family workers’ (Office for National Statistics, 2022a: n.p.).
The self-employed group has become numerically more important in recent decades which is a significant change. Giupponi and Xu (2020) found that solo self-employment, that is, sole traders or company owner managers with no employees, has grown dramatically in the UK since the 1970s. In 1975 just 8% of workers were self-employed, but by 2019 this had risen to 14%. Self-employment is highest in London and the 2021 Census showed that 20% of economically active workers in London were self-employed (ONS, 2022b). The growth of self-employment has been a long term trend but it has grown rapidly in recent years partly as a result of the growth of the ‘gig economy’ (Johnes, 2019; Sargeant, 2017; Woodcock and Graham, 2019). The gig economy is one where, rather than workers having a single employer, with regular hours and stable income, their income is derived from a series of one off, temporary, jobs, with one or more employers with fluctuating hours of work and no job security. While many taxicab drivers have operated on this basis, this employment model has grown rapidly post covid with many food and restaurant delivery bike riders. Johnes (2019: 198) finds that: ‘The incidence of gig economy activity is greatest in the London region, characterised by high population density and a concentration of service sectors in which gig economy work, particularly of a highly skilled nature, takes place’. The income structure of self-employment tends to be polarised with a group of high earning professionals and a large group of low earners. Giupponi and Xu (2020: 1) found that:
There is great diversity within the group of solo self-employed, and the occupations in which the solo self-employment has been increasing include professional jobs as well as those typically found towards the bottom end of the pay scale. But overall this growing group are much more likely to have low earnings than employees.
But the important point is that the classification has remained stable over the last three Censuses, enabling comparison over time. The data is for usual residents so people whose normal residence is overseas or elsewhere in Britain are not included unless they have lived in London for a year or more. This will exclude wealthy non-resident overseas investors. The ONS suggest the seven classes can be grouped into three broad groups, the middle class (1 and 2), the lower middle or intermediate class (3, 4 and 5), and the working class (6 and 7) but most of the analysis below focuses on the seven major categories with particular focus on the three rapid growth categories: the professional and managerial category (1), the small employers and the self-employed (4) and routine workers (7).
Changes in London’s social class structure in the new millennium
It is difficult to analyse the changing class structure of a city without considering whether the total population is growing, stable or shrinking as this can affect the share of different groups over time. Importantly, the size of London’s population aged 16–74 increased sharply: from 5.3 million in 2001 to 7.1 million in 2021. This is a result of substantial in-migration, particularly from overseas. Second, the size of the economically active and employed population also grew substantially from 3.7 to 5.7 million people: an increase of 52%. Although all classes grew in absolute size, the growth was extremely uneven with some groups increasing 100% or more, and others scarcely changing (Table 1). The result has been considerable changes in class structure of the economically active labour force. In analysing changes it is important to distinguish between percentage changes and percentage point changes (ppc) as the two may move in opposite directions. If a group grows by 50% over time, but the total population grows 60%, its share of the total will decrease. But percentage point changes of the shares of different groups in a population over time always sum to zero as although some groups grow and others shrink, the total always remains 100%.
London’s occupational class structure, 2001–2021.
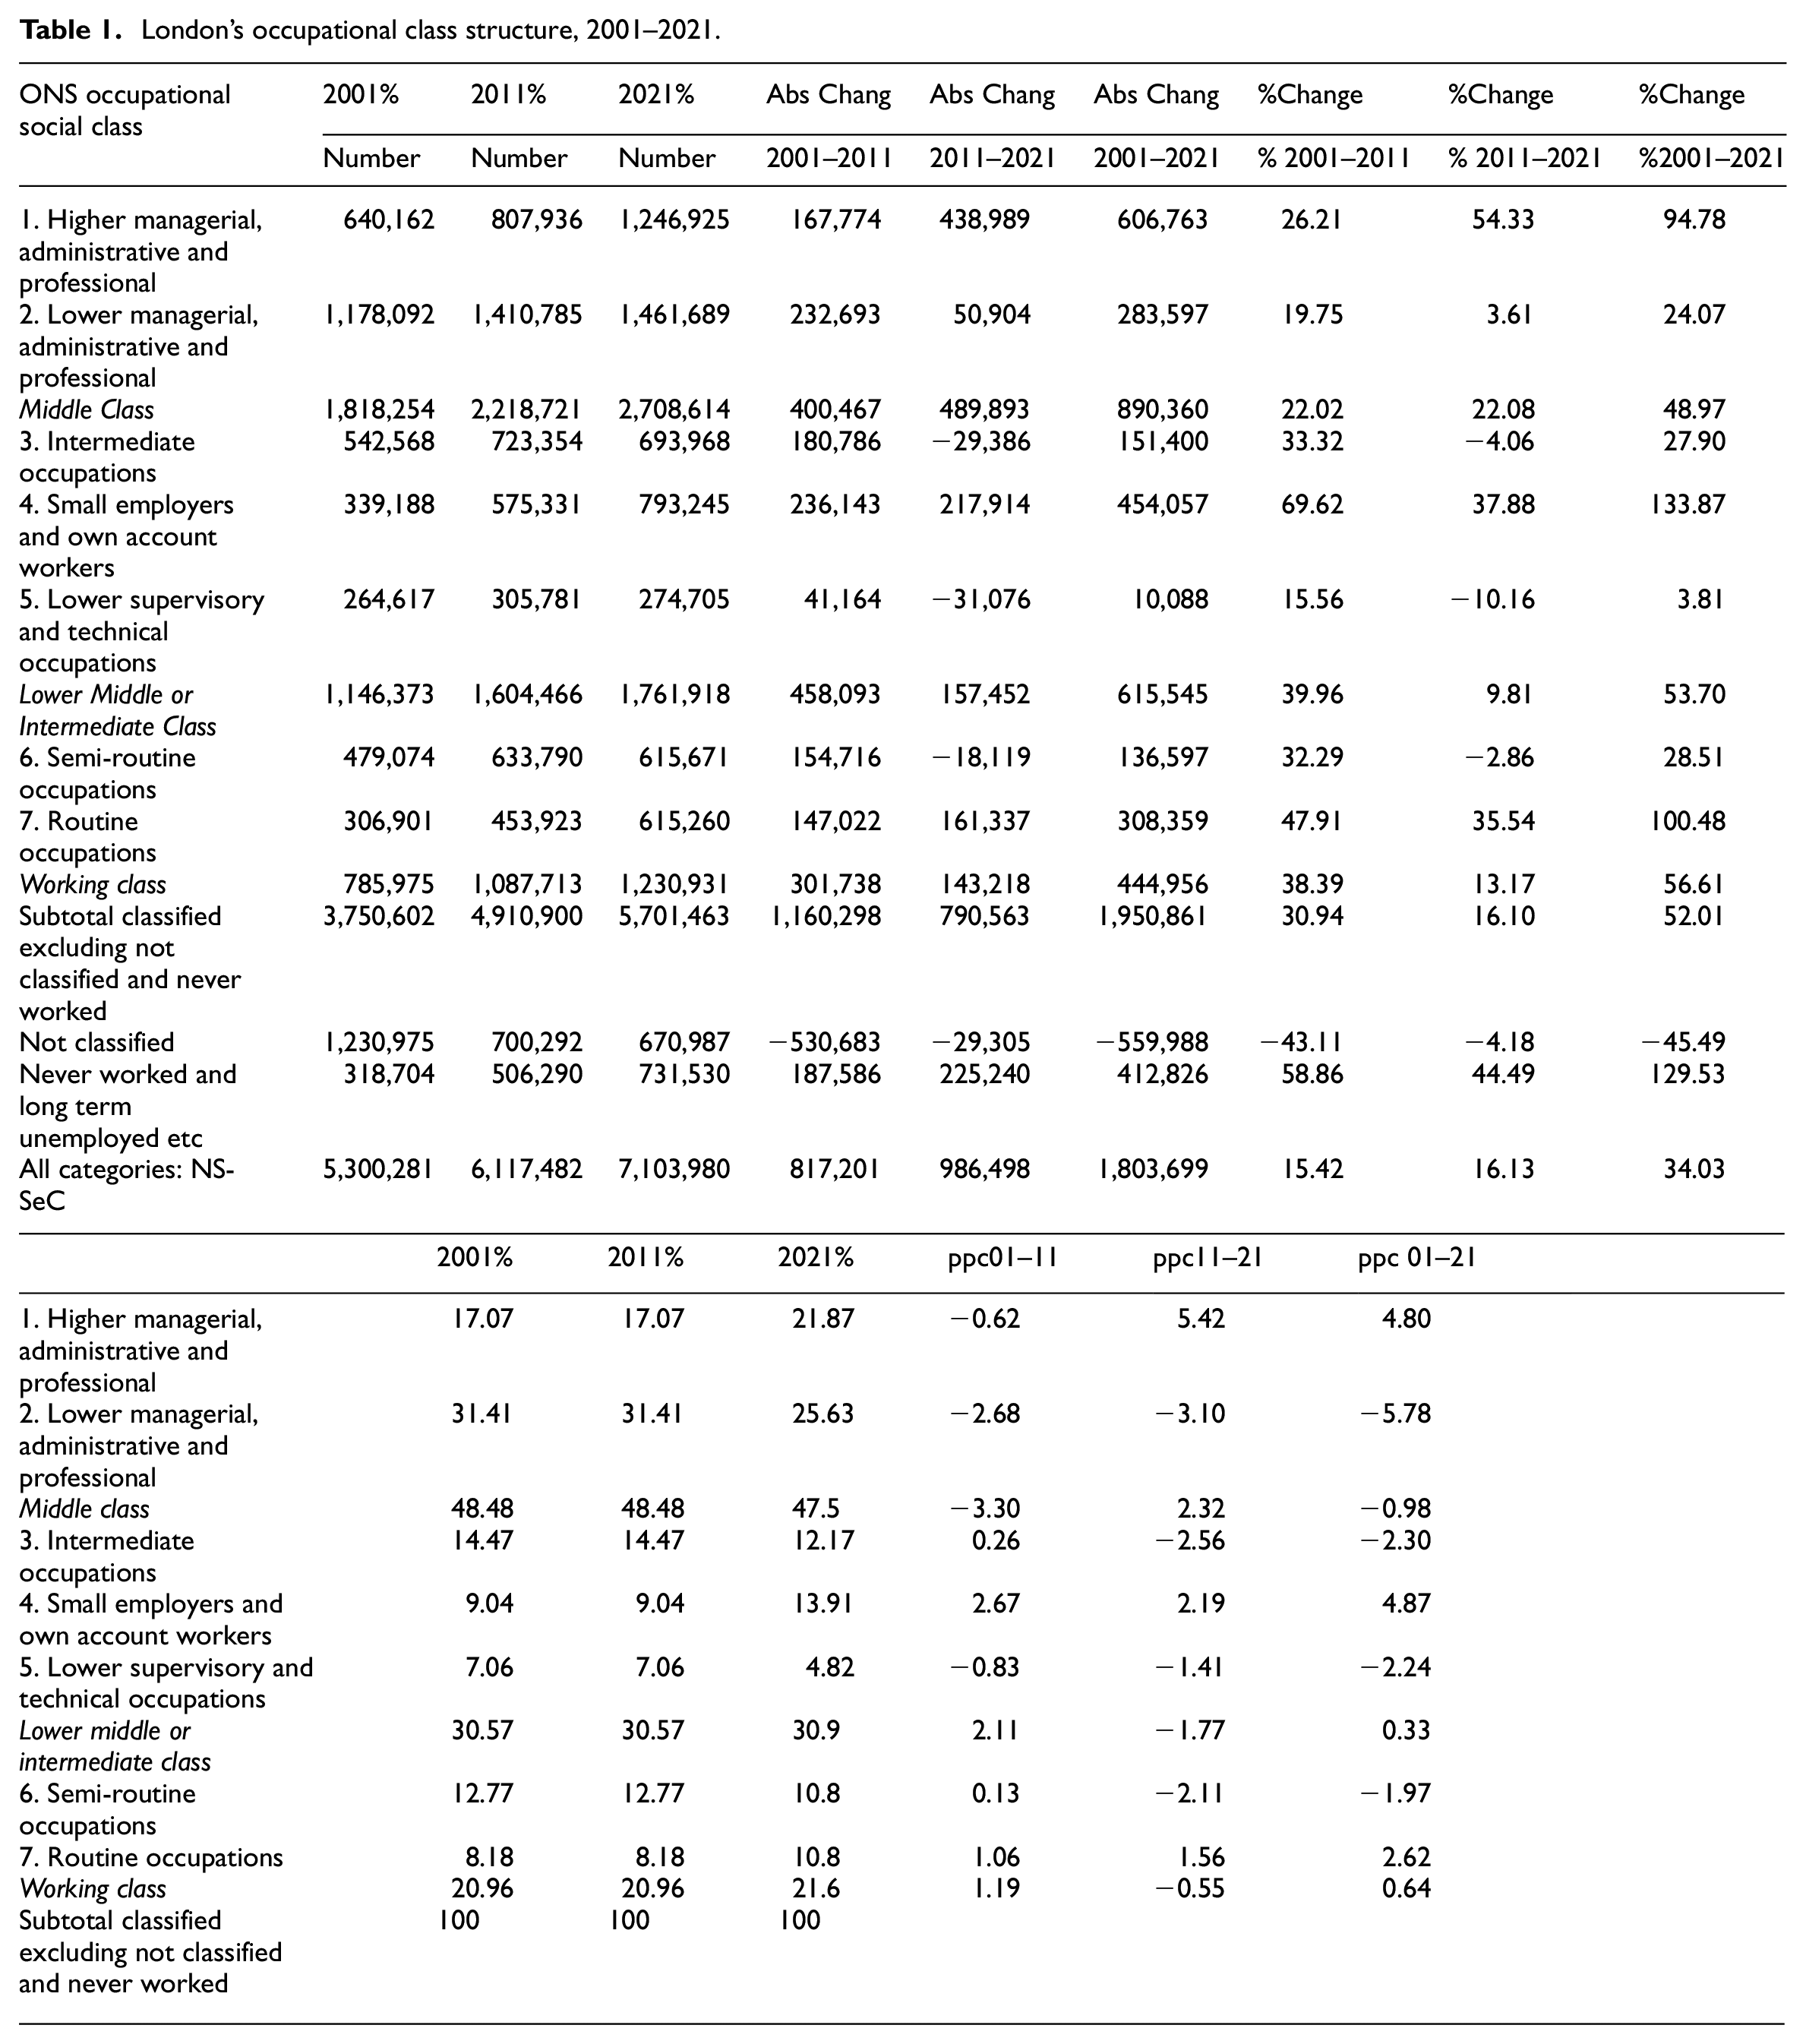
The changes over the last 20 years are very interesting, particularly when broken down into the two constituent periods. Looking first at the broad three-fold division: middle class, lower middle and working class, the first inter-censal decade 2001–2011 saw a 3 percentage point decline in the middle class (48.5–45.2%), with a 2 ppc growth of the lower middle class (30.6–32.7%), and a 1 ppc growth in the working class (21–22.1%). Hence Manley and Johnston’s (2014) conclusion that growth of the professional and managerial middle class had stalled in this period. However, the most recent inter-censal decade (2011–2021) presents a very different picture. In this period, the ‘middle classes’ grew by 2.3 ppc, the ‘lower middle’ class declined by 1.8 ppc and the ‘working class’ declined by 0.5 ppc. Taking both periods together, the middle class declined slightly (−1 pp), the lower middle class grew slightly (+0.3) and the working class also grew slightly (+0.6 pp) (Table 1).
But this threefold grouping is crude and it obscures important changes in both the upper managerial and professional class PMC, and in the self-employed and routine groups, all of which grew strongly. Looking at the seven ONS classes although the upper professional and managerial class (PMC) declined in the first decade, in the second it grew strongly, almost doubling in size (+95%) from 640,000 to 1.25 million from 2011 to 2021 and its share of the total grew from 16.5% to 21.9%, a gain of 5.4 ppc. But conversely, while the lower professional and managerial group grew by 20% in the first decade, it grew only 4% in the second and its percentage share fell from 31.4% to 25.6%: (−3.1 ppc) over the 2011–2021 decade. Within the lower middle class, the percentage of lower supervisory and technical occupations continued to fall while small employees and own-account workers continued to grow (by 2.7 and 2.2 ppc in the first and second decade) and by a remarkable 134% over the whole period. Finally, while the working class grew in absolute terms by 56%, it increased its share of the total only slightly from 21% to 21.6% over the two decades. More specifically, the semi-routine group shrank by 2 ppc while the lowest, routine, group doubled in size, from 307,000 to 615,000 (100%), and it increased its share by 2.6 ppc (8.2%–10.8%) (Table 1 and Figure 1). 1
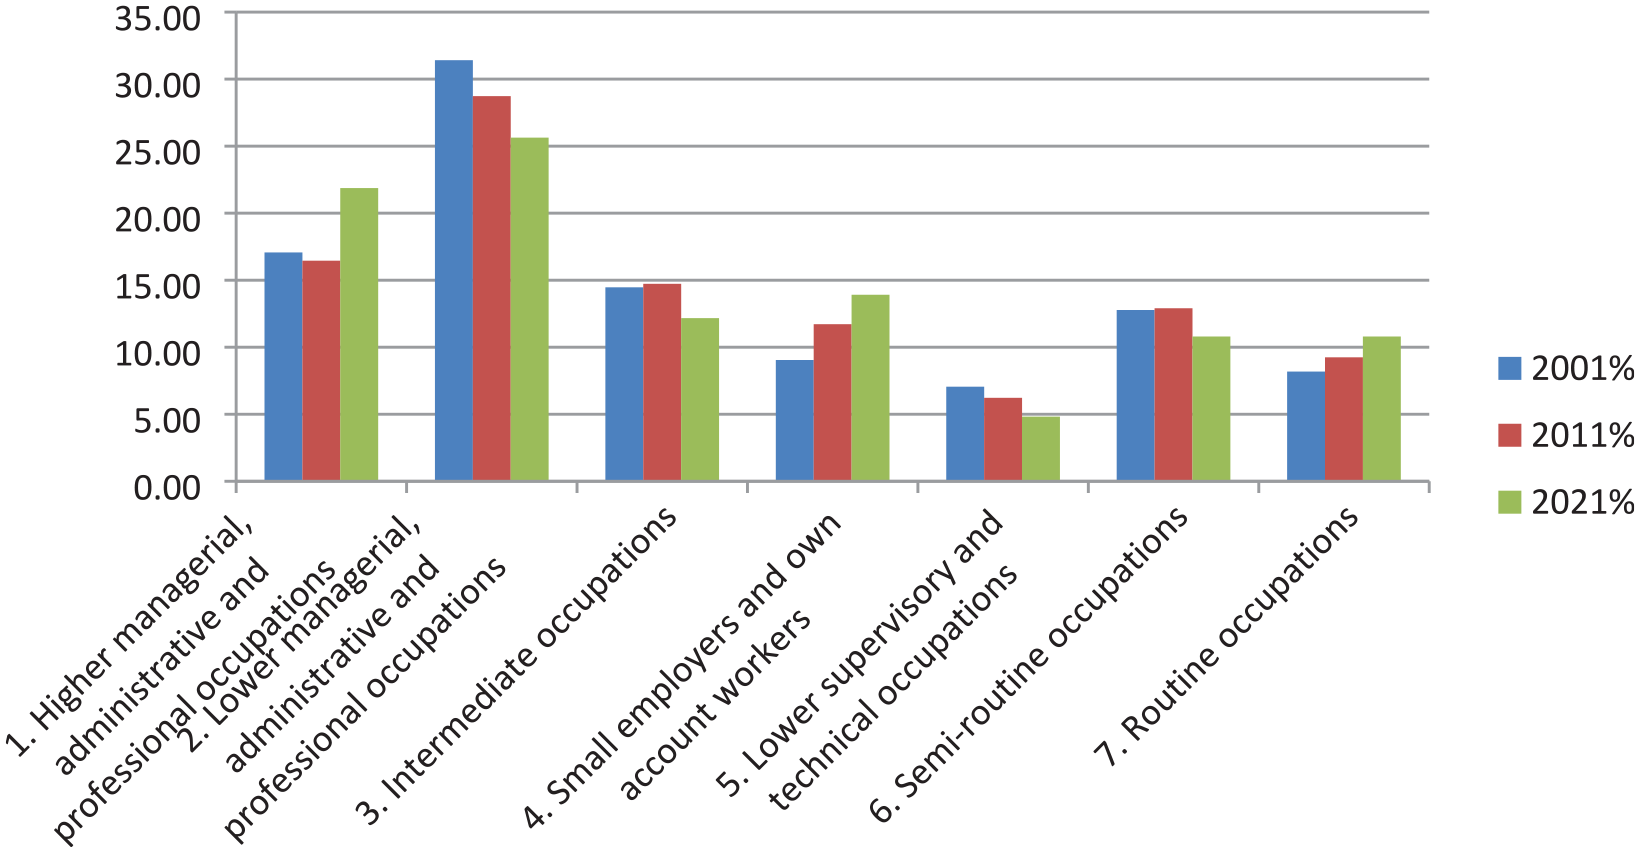
The changing occupational class structure of London, 2001–2011–2021.
Looking at the changes over the two decades together three things stand out. First, there has been substantial growth of the upper professional and managerial PMC (+606,700, +4.8ppc) at the top and growth of the routine group at the bottom (+308,400, 2.6 ppc). This is indicative of a degree of polarisation, although the professional and managerial group is twice as large as that of routine workers (21.9%:10.8%). Second, the shares of the lower professional group declined by −5.5% as did the share of both intermediate occupations and the lower supervisor groups which both declined by 2.3 ppc. Third, the share of small employers and self-employed rose by a remarkable 133%, +454,000 or almost 5 ppc (9–14%). As noted above this may partly reflect the growth of the gig economy and while this group includes professionals and skilled tradespersons, many self-employed workers such as Deliveroo riders may be on very low and precarious incomes. The picture is clearly complex, but the marked growth of this group may signal a change in the class structure. We may be seeing the casualisation of sections of the self-employed with the remarkable growth in the number of food and parcel delivery riders and drivers in London and other big cities.
So, to summarise, while all occupational social classes grew in absolute terms over the 20 year period, professionals and managers (+95%), small employers and self-employed (+133%), and routine workers (+100%), grew rapidly in percentage terms, while others, notably the lower supervisory and technical occupations grew minimally. The result was that all three rapidly growing groups increased their percentage share of the total (by 4.8, 4.9 and 2.6 ppc respectively). Thus, while London has seen substantial renewed growth of the upper professional and managerial groups it has also seen what can be termed ‘asymmetric polarisation’. This may signal an important change from the last 40 years of the 20th century where professionalisation was the dominant process. The upper middle classes are still growing in London (Hamnett, 2003a, 2003b) but so are routine workers and the self-employed.
The spatial dimensions of social class change
What of the spatial dimension of social class change in London? Historically, the social class structure of London was characterised by the strong representation of professional and managerial groups in central and west London, with more middle class boroughs including Kensington, Westminster, Camden, Wandsworth, Hammersmith and Richmond having the highest PMC concentrations and East London working class boroughs like Barking and Dagenham, Newham and Waltham Forest having the lowest concentrations (Wilmott and Young, 1973) with a broken ring of suburban middle class areas and the pattern continued into the early 1970s. But subsequently the gentrification of areas of inner London such as Camden, Islington, Hammersmith, Hackney, Southwark, Wandsworth and Tower Hamlets has led to a partial inversion of the social class structure with inner London becoming more strongly middle class than outer London (Butler et al., 2008; Hamnett, 2003a); and Cunningham and Savage (2017: 25) point to: ‘clear and localised patterns of intensification across the capital, an intensification characterised by a growing cleavage between inner and outer London’. They suggest that the upper professional and managerial class are at the forefront of the social and spatial restructuring of London, partly because of their higher incomes, greater purchasing power and the ability to buy property in the increasingly inflated housing market (see also Atkinson, 2020).
The evidence from the 2001, 2011 and 2021 Census of population is vital in clarifying the geography of social class change. The picture which emerges is one of gradual spatial inversion. Boroughs with the highest percentages of PMC in 2001 generally had the highest percentages of PMC in 2021. The reverse is also true. Boroughs with the lowest percentage of PMC in 2001 had the lowest in 2021. The Pearson correlation coefficient between the PMC borough percentage figures in 2001 and 2021 was 0.96 and the correlation coefficient 2 between the Routine Workers and Self-employed (RWSE) borough percentage figures in 2001 and 2021 was R = 0.84. At the top, the affluent central boroughs of Kensington and Westminster stand out with 33% PMC in 2021. They are followed by Wandsworth, Richmond, Camden and Islington each with 30–32%, Hammersmith and Tower Hamlets with 28% and Lambeth and Southwark with 26% PMC: all except Richmond are in inner London. The figure for Tower Hamlets is a product of the Dockland redevelopment with large numbers of expensive new apartment blocks and converted warehouses in what was, prior to 1990, one of the poorest areas of London. At the bottom end, there are a group of more working and lower middle class suburban boroughs, with PMC percentages in the mid-teens: Waltham Forest, Hillingdon and Hounslow (16–17%) and, at the bottom, all in East London, Newham and Havering with 14% each and Barking and Dagenham with 9%. But, although there has been a high level of stability over time, there have also been significant changes (Table 2 and Figures 2 and 3). I have opted for simple visual representation using maps and charts rather than segregation indices.
The changing distribution of professional and managerial and routine and self-employed workers by borough, 2001–2021.

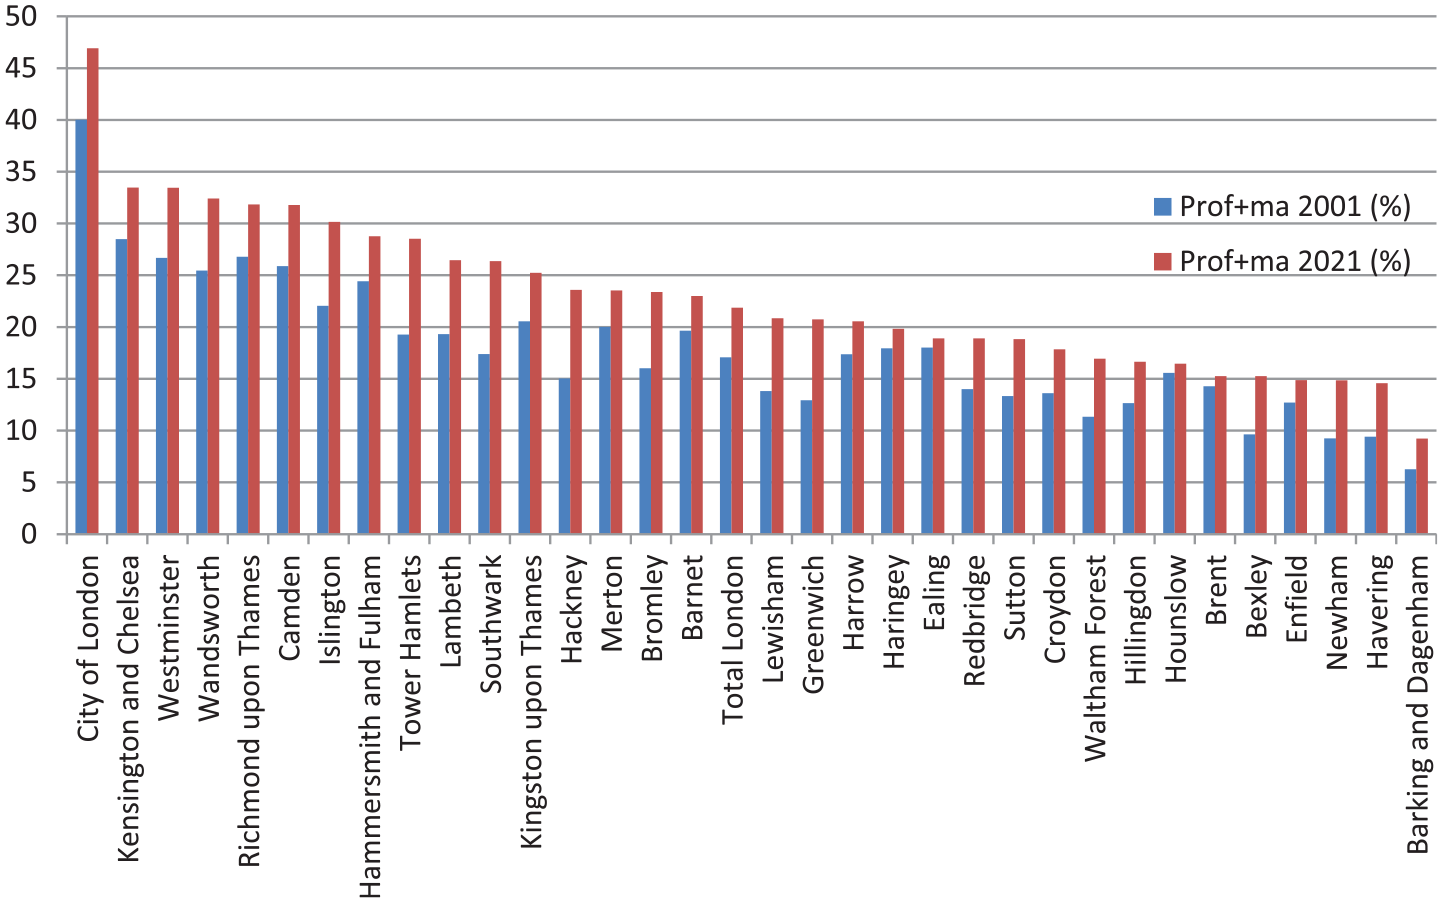
The percentage of upper professional and managers by borough, 2001 and 2021.
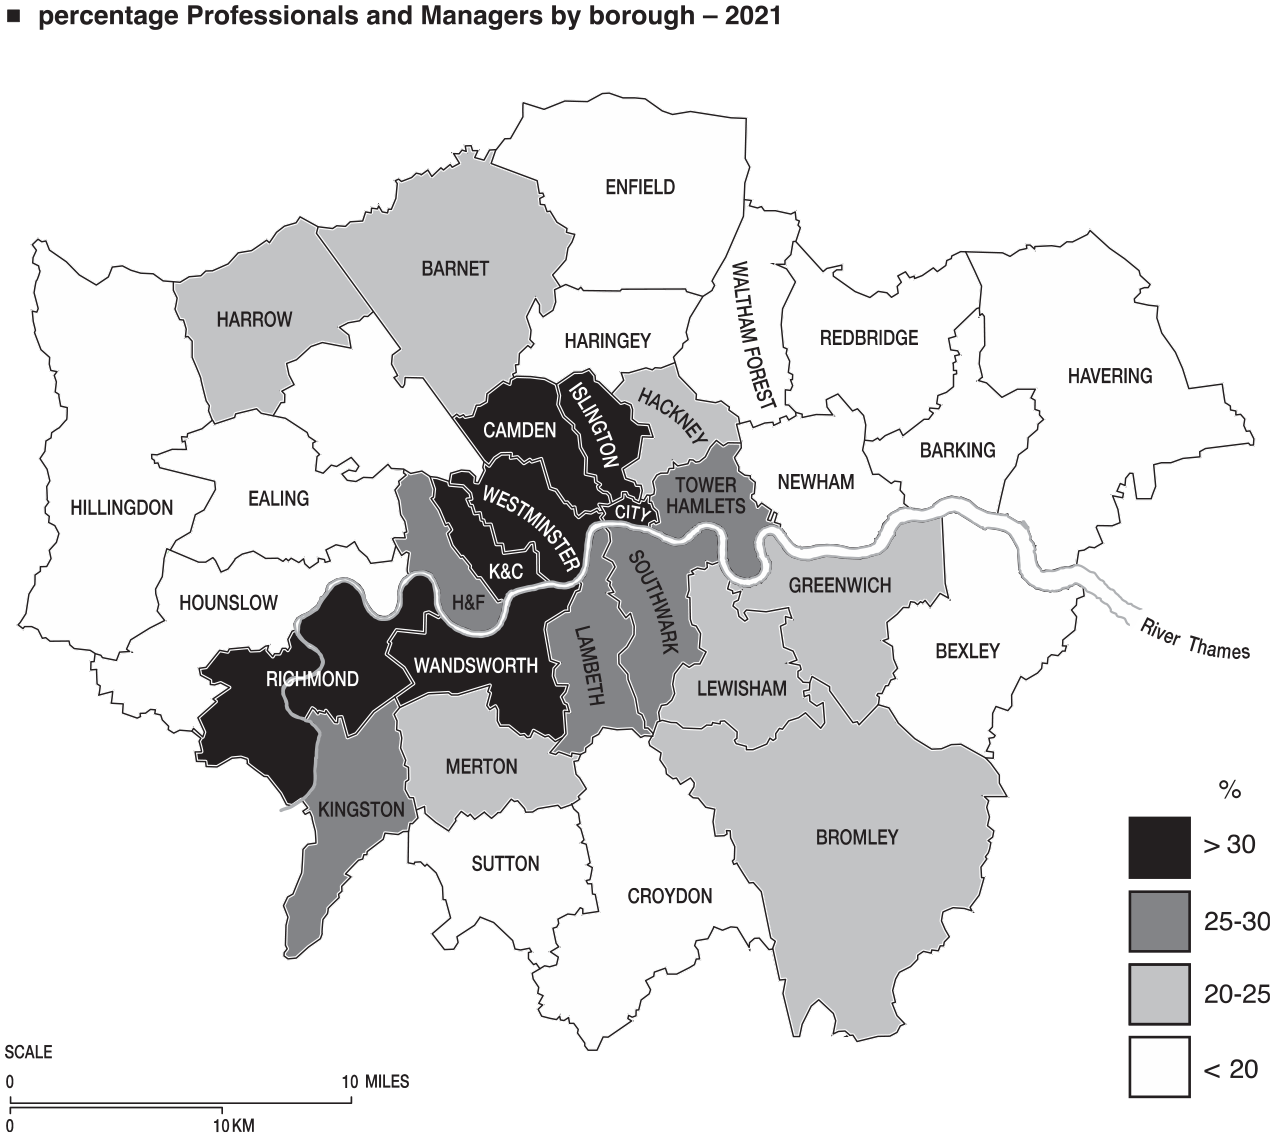
The percentage of higher professionals and managers by borough, 2021.
In general, boroughs with lower percentages of professionals and managers in 2001 have tended to see greater percentage increases and vice versa. The relationship is not perfect (Pearson correlation coefficient R = −0.53) but it seems that that the increase in professional and managerial workers has diffused outwards across London from the central and inner London boroughs which already have a high proportion of professional and managerial residents and generally much higher house prices. For most households, excluding the very wealthy and high-income ones, housing in central and inner London is often unaffordable and only moving to relatively cheaper, lower class suburban areas makes it possible to buy or rent. The proportion of upper professional and managerial workers in central areas is still growing but more slowly than in gentrified boroughs such as Islington, Hackney, Southwark and Tower Hamlets. The percentage point change figures for 2001–2021 for upper professionals and managers also provide a suggestive map of gentrification in London over the last 20 years, forming a broken ring round inner London: Tower Hamlets (+9.2), Southwark (+9 ppc), Hackney (+8.6), Islington (+8.1), Greenwich (+7.8), and Lambeth, Lewisham and Wandsworth all with over 7 ppc. The class geography of London appears to be slowly inverting as Butler et al. (2008) and Cunningham and Savage (2017) suggested (Figure 4).

Percentage point change in professionals and managers, by borough, 2001–2021.
But the PMC are only part of the story. The changes at the other end of the social class spectrum are equally interesting. It is useful to look at both routine workers and self-employed workers as both grew strongly over the period and have some similarities in distribution (R = 0.49). As noted above, the self-employed and small business owners are a mixed group, with some highly skilled and highly paid independent professionals (lawyers, IT specialists, independent consultants, media personalities etc.), a group of high skilled self-employed tradespersons such plumbers, electricians, and a larger number of less skilled and much lower paid casual workers such as van drivers).
The percentage of routine workers increased in both inter-censal decades and by 100% in London as a whole (from 8.2% to 10.8% of the total). It increased across all boroughs (with the exception of Tower Hamlets) with most of the largest increases in the poorer, suburban working class boroughs such as Brent, Newham, Hounslow and Enfield and the smallest increases in the more affluent central and inner boroughs of Camden, Kensington, Westminster, Hammersmith, Wandsworth and the south western boroughs of Merton and Richmond. The category of small employers and self-employed workers also showed significant (134%) growth over the two decades, rising from 9% to 14% of the economically active and employed, an increase of almost 5 ppc. Every borough showed growth in this group, ranging from 59% in affluent Kensington to 333% in working class Newham. In general, the poorer outer suburban boroughs such as Newham, Barking, Harrow, Waltham Forest, Brent, Haringey, Ealing and Hounslow have some of the highest levels and biggest percentage point increases of this group whereas the more affluent central and inner boroughs such as Camden, Hammersmith, Wandsworth and Tower Hamlets have the lowest. This points towards the gradual suburbanisation of both routine and self-employed workers, perhaps pushed outwards by the very high housing costs in inner London (Figure 5).
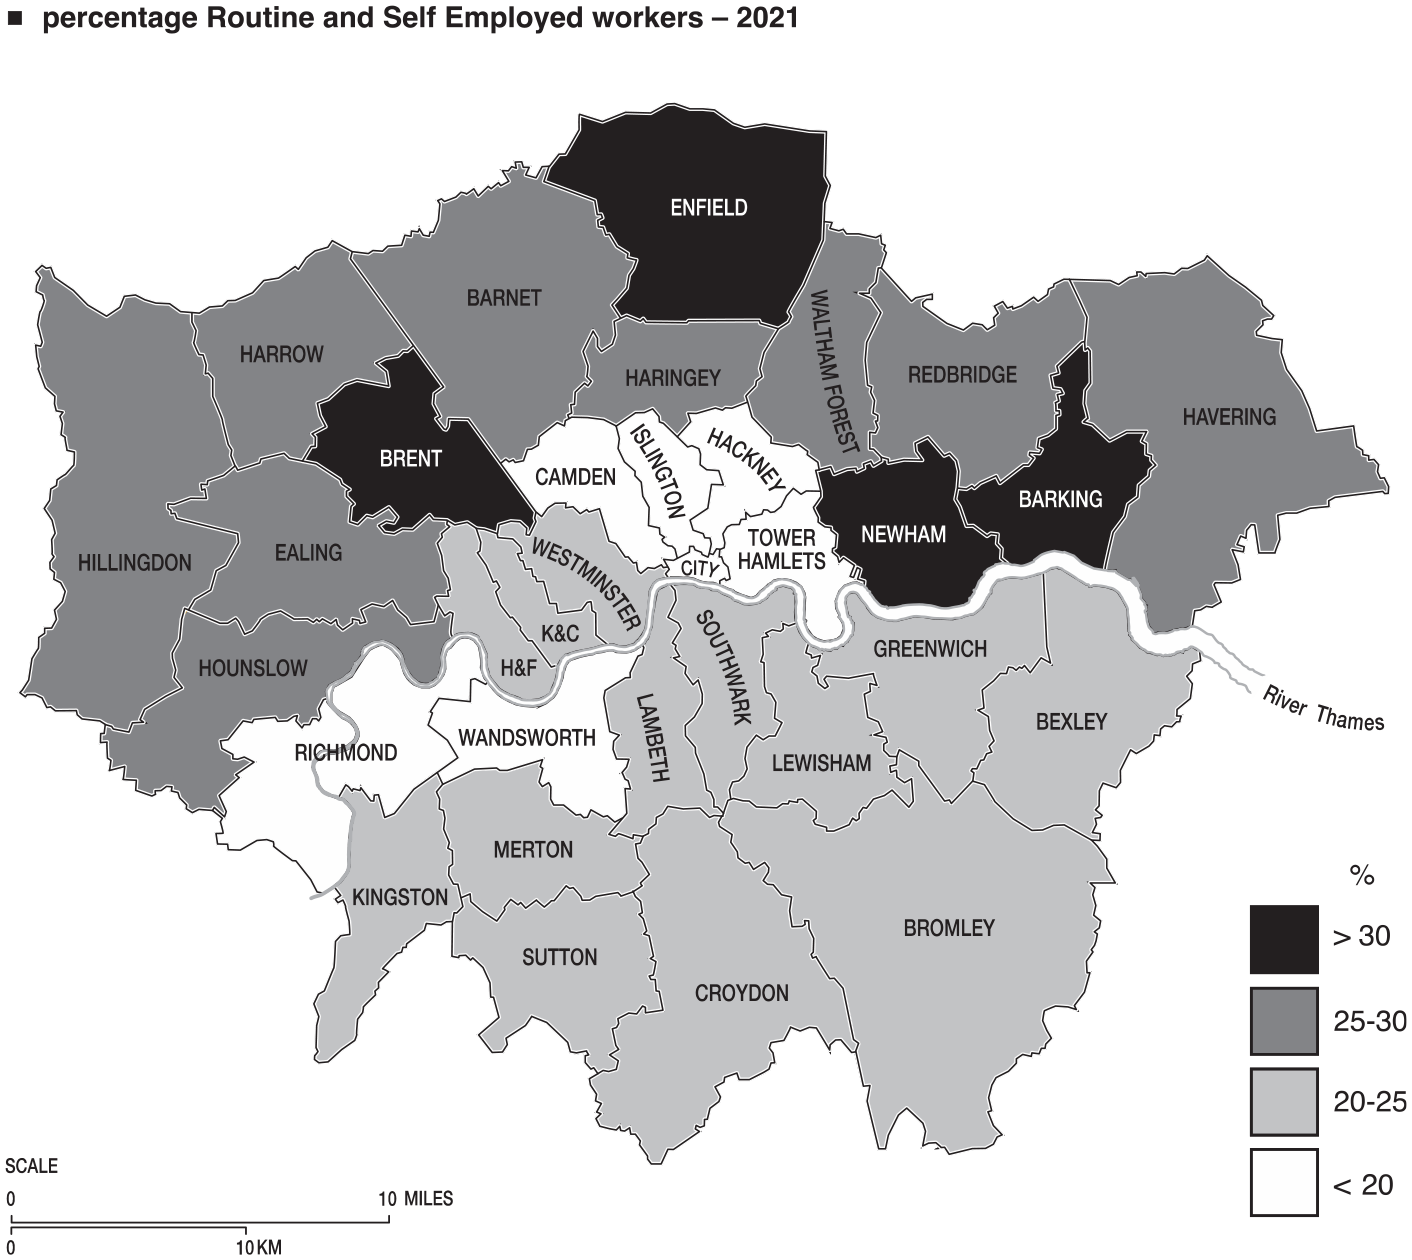
The percentage routine and self-employed workers, by borough, 2021.
The differences in class distribution are very marked. Figure 6 shows the percentage of professionals and managers by borough in 2021 versus the percentage of routine workers and small employers and self-employed (RWSE). The distributions are almost perfectly inverse with a Pearson correlation coefficient of R = −0.885: the more PMC, the less the RWSE and vice versa. At one extreme, the City of London has 47% PMC and 12% RWSE while at the other, Barking and Dagenham has 9.2% PMC and 34% RWSE. While London has become a far more middle class city over the last 50 years, it also has a significant, and growing, routine working class and self-employed population. The middle class are not the only class in town as Watt (2008) has noted, although they are increasingly important. There are two other significant points here. First, analysis of percentage point change shows the greater the PMC ppc, the less the RWSE ppc and vice versa (Figure 7) and a Pearson correlation of R = −0.85. At one extreme, gentrifying Tower Hamlets saw a + 9 ppc growth of PMC workers but growth of only 2 ppc for RWSE workers, while at the other, suburban Harrow, Barking, Enfield, Brent, Ealing and Hounslow saw a PMC growth of <3 ppc but a growth of RWSE workers of around 11–12 ppc (Figure 8). The divergence is similar for PMC versus routine ppc (R = −0.84). In this respect, the 20 year period has seen a sharp divergence in the experience of inner and outer London. Whereas inner London is continuing to gentrify, a process which began 60 years ago (Glass, 1963; Hamnett, 2003a), outer London is seeing bigger increases in the less skilled and the self-employed. The class geography of London appears to be slowly inverting.
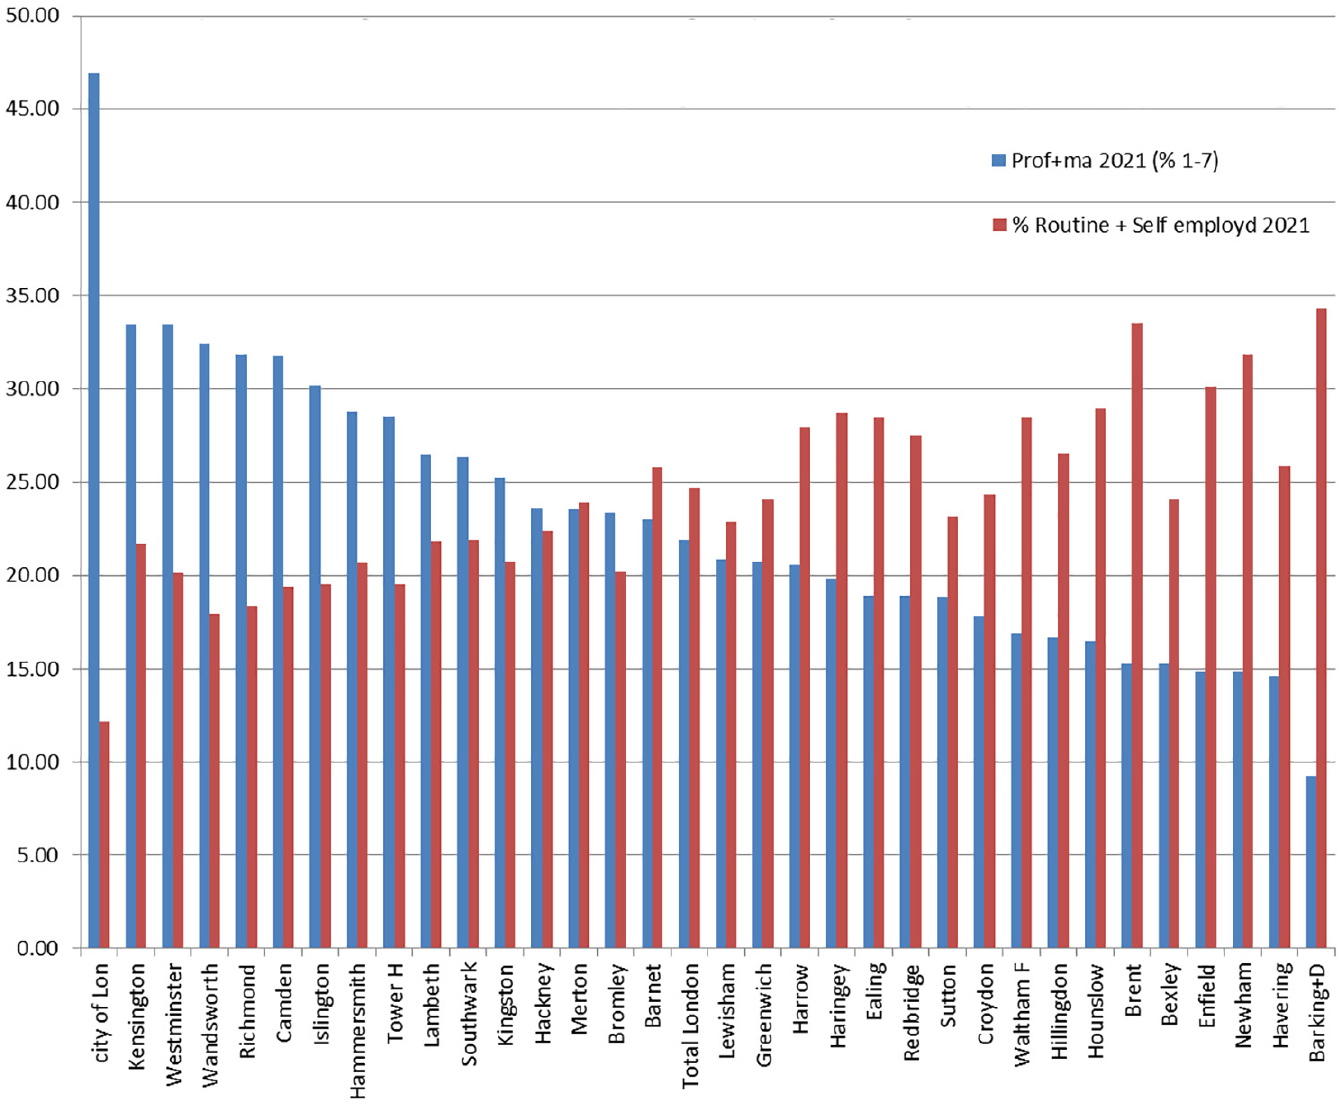
The percentage professionals and managers versus percentage of routine workers, small employers and own account workers, 2021.
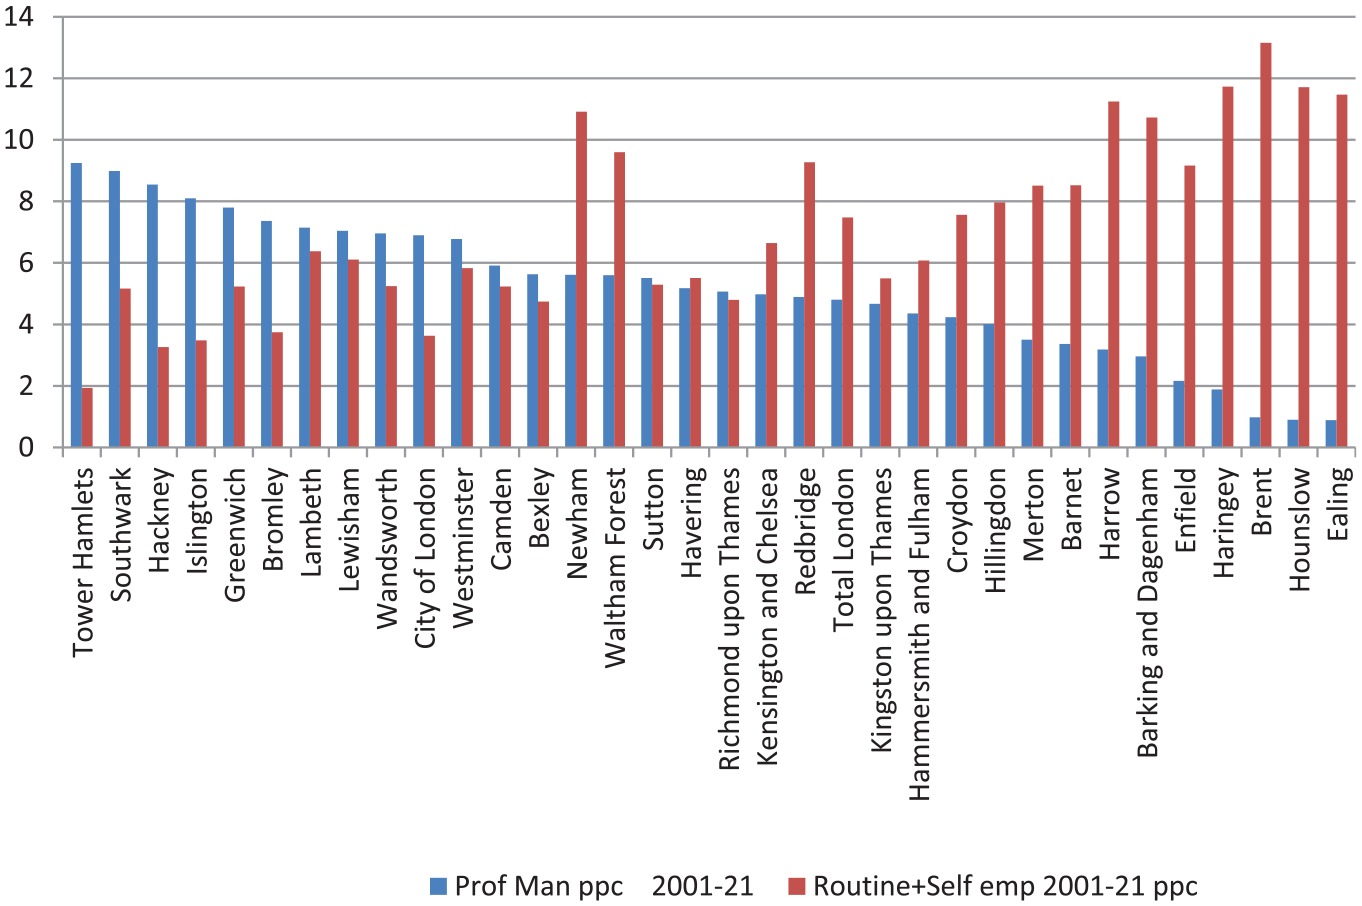
Percentage point change of professional and supper managerial workers versus ppc of routine and self-employed workers, by borough, 2001–2021.
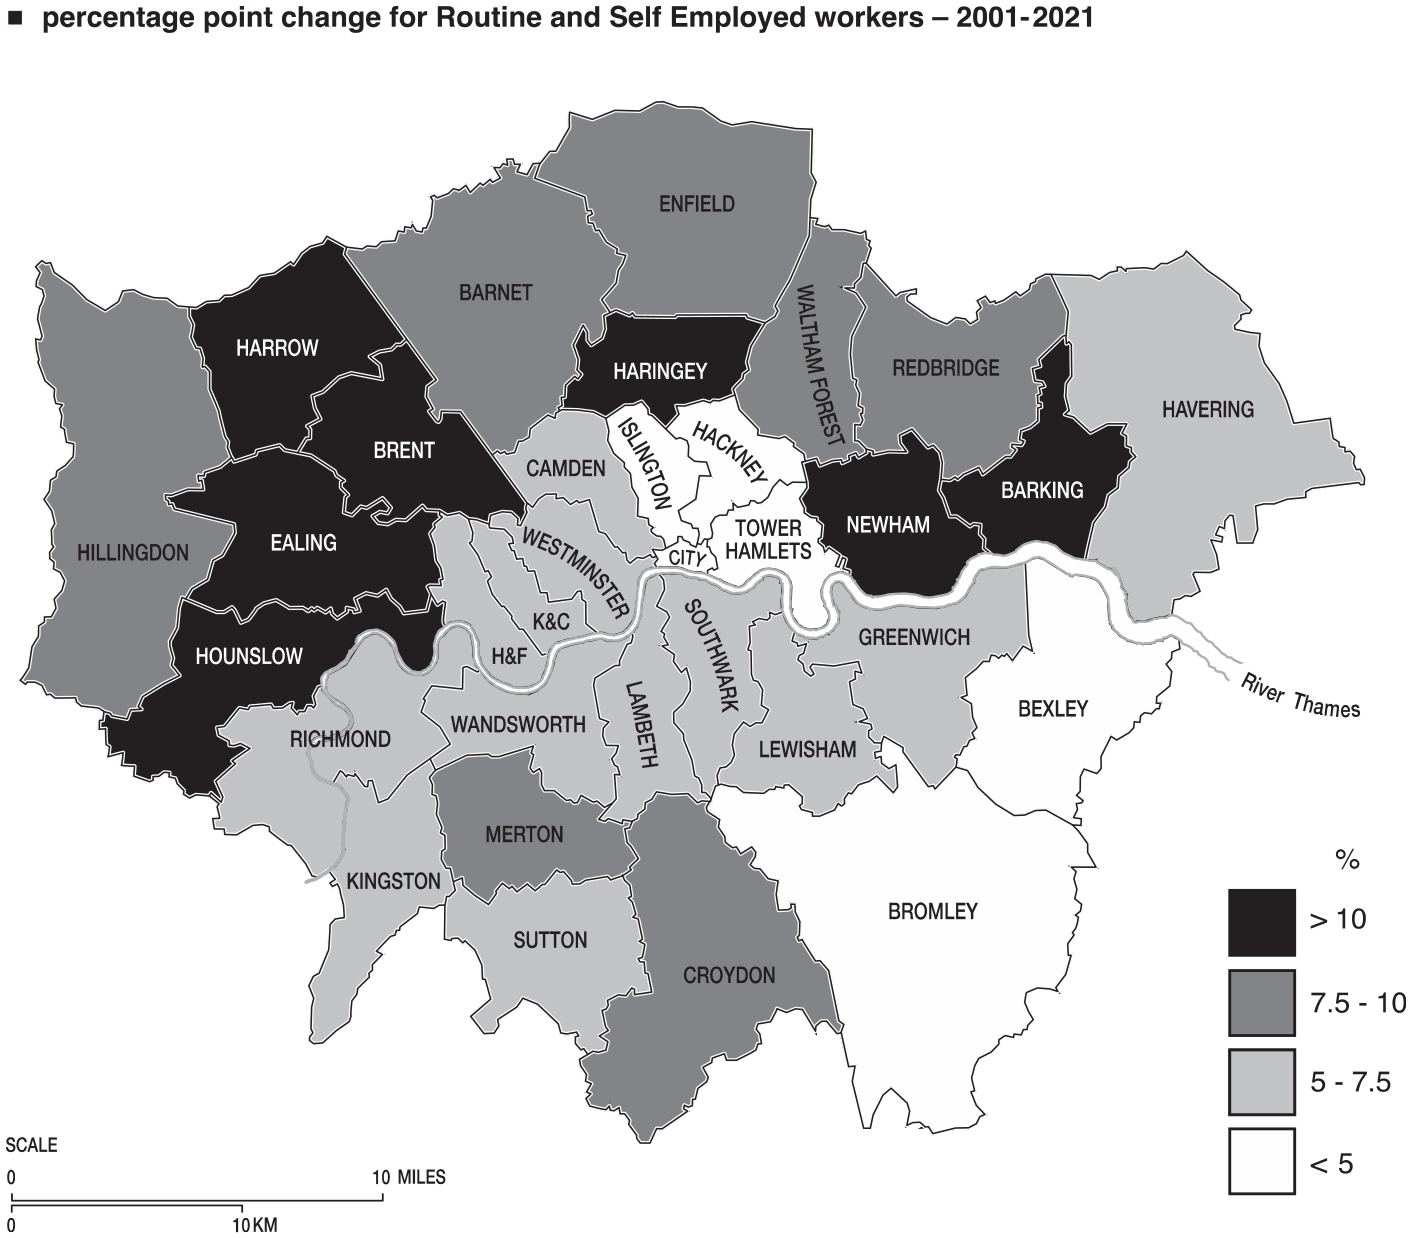
Percentage point change for routine and self-employed workers, 2001–2021.
Conclusions
Two questions were raised in the introduction. First, how has the occupational social class structure of London changed over the 20 year period, and second what has been the geography of these changes? Has the class geography of London remained stable, or has it changed and, if so, in what ways? Regarding the first question, there are three key points. First, although the professional and managerial class increased in size from 2001 to 2011 in absolute terms, it shrank slightly in percentage terms. But this trend was reversed in 2011–2021 when the upper PMC increased by over 50% in size. The upper PMC has thus continued its long term, 60-year, growth trend. Second, two other groups – the self-employed and routine workers – grew in both periods in both percentage and ppc terms. This suggests that because of the growth at the bottom it seems that the pattern of change is one of asymmetric polarisation rather than simply professionalisation. These findings mean the previous picture of long term professionalisation in London now needs to be modified to reflect increasing growth at the bottom end of routine and self-employed workers, more of whom may be working in the gig economy with minimal security of employment.
In geographical terms, the overall differentiation between boroughs in terms of the percentage of PMC and RSEW has remained broadly stable: the percentage PMC by borough in 2001 and 2021 had a correlation of R = 0.96 and the percentage RSEW by borough had a correlation of R = 0.84. The affluent middle class boroughs remain the same as do the poorer working class boroughs but there has been an increase in the percentage PMC across all boroughs, albeit a very uneven one with big increases of 8–9 ppc in the inner, gentrified, boroughs and smaller increases of 1–2 ppc in some of the poorer outer boroughs. Equally, although there were increases in the percentage of RSE workers across all boroughs, they ranged from 3 to 6 ppc in the more middle class boroughs to 8–13 ppc in the more working class boroughs. In this respect, the differences in class composition between boroughs, particularly between inner and outer London are increasing. This reinforces the conclusions of Butler et al. (2008) and Cunningham and Savage (2017) that London is seeing a gradual inversion of its spatial class structure allied to growing gentrification (Hamnett, 2003a, 2003b). As Cunningham and Savage (2017) note: ‘we now see the consolidation of elite centrality, with the less advantaged social classes increasingly moving to the outskirts’ (p. 43). It will be interesting to see whether these changes continue and to what extent London’s experience parallels or differs from other major cities such as New York, Amsterdam and Paris. It would also be useful to undertake more fine-grained spatial analysis of change over time if Census small area boundary changes permit.
Footnotes
Acknowledgements
I would like to acknowledge the valuable comments of the three anonymous referees.
Declaration of conflicting interests
The author declared no potential conflicts of interest with respect to the research, authorship, and/or publication of this article.
Funding
The author received no financial support for the research, authorship, and/or publication of this article.
