
Abstract
Youth-led Participatory Action Research (YPAR)—in which young people conduct research aimed at improving problems in their schools and communities—is increasing in public health, youth development, and education. We report on the development and psychometric testing of the YPAR Process Template (YPT)—to assess the quality of key YPAR processes in a systematic, flexible manner. Pairs of raters independently coded 40 live and videotaped observations. All scales achieved good to excellent interrater reliability with the exception of the power sharing over major decisions scale, which had interrater reliability in the acceptable range. This instrument can be useful for a range of settings practicing YPAR and similar youth empowerment programs. We further report findings generated by YPT assessments that demonstrate that power sharing was a robust predictor of observed youth engagement in the YPAR classes after controlling for the classes’ baseline level of engagement.
Introduction
There is a growing demand in the youth development, public health, and education fields for strategies that engage young people and create avenues for youth participation in improving schools, health programs, and other youth-serving organizations. Participatory research is increasingly being used as a model to facilitate and encourage youth participation in these improvements (Cargo, Grams, Ottoson, Ward, & Green, 2003; Mitra, 2004; Nieto, 1994; Shor, 1996). Youth-led participatory action research (YPAR) is a form of community-based participatory research (CBPR) that guides young people through an iterative process of collective research and reflection to understand the situations in which they find themselves, and use that knowledge to take action to improve those settings (Baum, MacDougall, & Smith, 2006).
Core elements of YPAR involve the training of young people to identify major concerns in their schools and communities, conduct research to understand the nature of the problems, and take leadership in influencing policies and decisions to enhance the conditions in which they live (London, 2001; Mitra, 2004). YPAR shares values (and some methods) with other youth organizing and empowerment approaches focused on increasing the power of young people and improving their lives, schools, and communities (Brown & Rodriguez, 2009; Cammarota & Fine, 2007; Freire, 1994; Ginwright, Noguera, & Cammarota, 2006; Kirshner, 2007; McIntyre, 2000). YPAR, however, is unique in its focus on systematic research—enacted by the young people—to inform their actions and advocacy in addition to their own life experiences.
Identification of Key Processes and Implementation Quality
Despite recent interest in YPAR as a promising intervention in multiple fields and a growth in published literature that documents the efforts, successes, and challenges of diverse projects (Foster-Fishman, Law, Lichty, & Aoun, 2010; Ginwright et al., 2006; McIntyre, 2000; Mitra, 2004; Ozer et al., 2008; Sánchez, 2009; Schensul, LoBianco, & Lombardo, 2004; Suleiman, A., Soleimanpour, S., & London, J. (2006), there has been little quantitative or mixed-methods evaluation of YPAR processes and outcomes thus far. One major obstacle to the evaluation of YPAR—whether for continuous improvement or more formal analysis of impact—is the lack of valid and reliable methods for the assessment of key processes. Systematic assessment of YPAR implementation process is particularly challenging because of the flexibility of the approach. By design, YPAR is not a “packaged” intervention but rather a process in which young people—with guidance from adult facilitators—make key decisions regarding the problem to be addressed, research methods, and action steps. The iterative processes of research and action inherent in YPAR are expected to unfold differently in diverse settings and may vary in relative emphases on research and action as youth researchers respond to opportunities and constraints in their schools and communities.
While recognizing the diversity of YPAR projects in terms of the specific paths of research and action taken, it is important to identify underlying key processes that would be expected to cut across diverse projects. Valid and reliable measures for assessing what is meant by a “good enough” implementation of YPAR can inform the continuous improvement of practice and the diffusion of more effective approaches. As YPAR gains popularity across fields, a common understanding of the change processes that lead to positive outcomes is necessary to move away from “black box” evaluations (Chen & Rossi, 1989; Karachi, Abbott, Catalano, Haggerty, & Fleming, 1999). Multi-method evaluation of YPAR can support explanations for youth-level outcomes and impact, and suggest pathways through which classroom level processes may help explain school or organization-wide impact.
Prior research and theory on the general processes and outcomes of psychological empowerment emphasize the promotion of socialpolitical understanding, shared decision making, relevant skill development, working together to solve problems, active engagement in the community, and the creation of mutual support systems as key processes (Cargo et al., 2003; Checkoway, Dobbie, & Richards-Schuster, 2003; Jennings, Parra-Medina, Hilfinger Messias, & McLoughlin, 2006; Schensul, Berg, & Sydlo, 2004; Zimmerman, 1995, 2000; Zimmerman, Israel, Schulz, & Checkoway, 1992) As outlined earlier, YPAR, like other forms of CBPR, reflects these empowering processes and is further characterized by the specific iterative process of integrated research and action. Based on these literatures and in our own extensive research with 44 semester-cohorts of YPAR projects in urban public schools, we proposed a set of seven YPAR processes to be operationalized to assess implementation quality (Ozer et al., 2010).
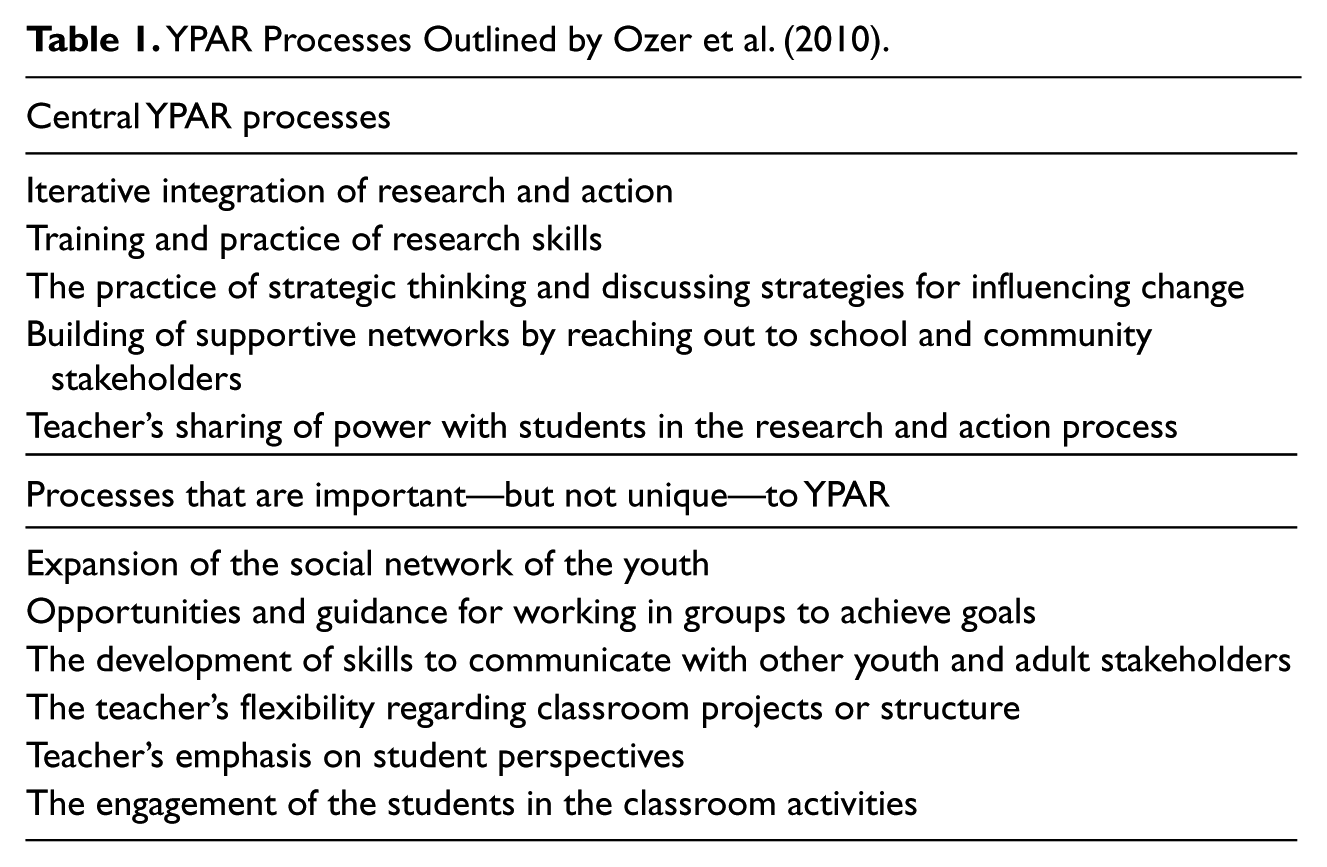
Core YPAR processes as shown in Table 1 thus include (a) iterative integration of research and action; (b) training and practice of research skills; (c) the practice of strategic thinking and discussing strategies for influencing change; (d) building of supportive networks by reaching out to school and community stakeholders; and (e) teacher’s sharing of power with students in the research and action process. Power sharing is a theoretically central dimension of YPAR. In principle, the youth-led approach entails the young people exerting power over key aspects of the research and action process (e.g., topic selection, research methods, data analysis, action steps) with adults in a support role. In practice, sharing power such that students experience a sense of ownership over YPAR projects can be hard to enact. Skillful scaffolding from adults is needed to promote young people’s sense of ownership while helping them manage challenges such as deadlines and conflicts (Larson, Walker, & Pearce, 2005; Mitra, 2004; Vygotsky, 1978). This balance of power may be particularly hard in hierarchically structured school settings in which teachers are held accountable for students’ learning, and students’ change efforts may confront politically charged problems and policies. Beyond the core dimensions, other processes that are inherent in a high-quality implementation of YPAR but are not unique to it include expansion of the social network of the youth; opportunities and guidance for working in groups to achieve goals; the development of skills to communicate with other youth and adult stakeholders; the teacher’s flexibility regarding classroom projects or structure; teacher’s emphasis on student perspectives; and the engagement of the students in the classroom activities (Ozer et al., 2010).
YPAR Processes Outlined by Ozer et al. (2010).
Study Goals
The first goal of this study was to operationalize YPAR processes via the development of a valid and reliable measurement tool—the YPAR Process Template (YPT)—to assess the quality of YPAR implementation. This measure is intended to be flexible enough to use in a range of school and out-of-school settings, and for subscales that are not focused on research training to be useful to practitioners and evaluators of youth empowerment and organizing projects. Here, we first report on the formative development and psychometric testing of the YPT observational measure (Phase 1). Second, guided by relevant theory, we investigated the relationship between enhanced student power and student engagement in the YPAR projects using a larger longitudinal data set from the same study (Phase 2). Consistent with findings from the educational psychology literature, we expected that young people who experienced greater control would demonstrate greater behavioral engagement in the YPAR activities (Deci & Ryan, 1985; Shernoff, Csikszentmihalyi, Schneider, & Shernoff, 2003; Skinner & Belmont, 1993).
Method
Participants
The present study was conducted in the context of a larger mixed-method intervention study investigating the impact of youth-led participatory research on students and their school settings. Consistent with the policy of the school district and the university institutional review board (IRB), the parents/guardians of these students provided their signed consent and the youth provided signed assent. Phase 1 of the present study, the development and psychometric testing of the YPT, was conducted in 14 semester-long classes in four urban public schools over two years. Participating schools were diverse in terms of size, ethnic diversity, and achievement level. School size ranged from approximately 200 to 2,000 students, with Asian American students comprising the majority at two of the four sites and Latino/Hispanic students comprising the majority at the other two sites. Schools ranged from 577 to 938 on the Academic Performance Index (API), a statewide school-level indicator of student performance (range = 200 to 1,000), and enrolled between 35% and 57% of students qualifying for free and reduced lunch, an indicator of poverty. Four teachers (two male, two female) participated across 14 semester-long cohorts; class sizes ranged from 3 to 17 students (mean = 10.7, SD = 4.8) aged 14 to 19 years (mean = 16.8, SD = 1). More than 60% of participants were female; the greatest proportion identified as Latino (38%), followed by Asian/Pacific Islander (29%), African American (21%), and Caucasian (5%). The variability in the class sizes is reflective of the policies at the schools allowing students to take elective courses, such as the YPAR class.
The problems addressed in the YPAR projects were decided by the students with facilitation from their teachers and ranged according to the school and cohort. Topics included the prevention of school drop out; smoothing the transition to ninth grade; stress related to family, academics, or peers; improving the school lunch; cyber-bullying; sexual health; safety and hygiene in the school bathrooms; improving teaching practices to engage diverse students; and improving interethnic friendships at the school. Each project lasted at least one semester. The curriculum used by the teachers represented an adapted version of existing YPAR curricula (London, 2001; Sydlo, 2000). While the teachers were provided with a manual tailored to their district and classes, they also engaged in monthly and as needed consultation with the study authors and biweekly consultation with a supervisor to target the needs of their specific project.
In the issue-selection phase, the teacher-facilitators led multiple class sessions to help students decide on a topic as a group, and to pick topics that were within the scope of feasible action. With training and guidance from their teachers and the university team, students engaged in a research phase to study and understand the problem using a range of survey, interview, observational, and multimedia approaches for data collection as determined by each group of student researchers. In the action phase, the teacher-facilitators helped students to identify specific and feasible actions that they could take within the time frame to address the problem, with the understanding that it was likely beyond the scope of the project to fully solve it.
Data collection for Phase 1 was conducted via a combination of live observations with pairs of raters and videotaping of classes for ratings in the research lab. All four teachers agreed to have their classes rated in the live coding sessions and three agreed to have their classes videotaped. Of the 40 observations included in this analysis, 23 were live class sessions lasting 50 to 90 min and 17 were video clips between 20 and 45 min in length that represented the substantive portions of the classroom activities for the day. For the reliability analysis, teachers were not given prior notice about when the team would videotape or conduct live ratings. Classrooms were chosen for coding based on availability of raters, with an effort to include raters available for multiple sites and class times. During reliability testing, raters scored seven additional video observations to rate the “power sharing over major decisions” scale, owing to challenges in establishing reliability for this scale that stemmed from the fact that there were YPAR class sessions wherein no major decisions about the class project were discussed. On these days, the raters recorded “N/A” for power sharing over major decisions. Thus, we had fewer codes to include in our reliability analysis for this scale. To address this, two new raters scored 7 videotaped sessions only for the power sharing over major decisions scale. This increased the number of valid observations to provide sufficient data for reliability testing.
Phase 2 of the present study was conducted using longitudinal data from a total of 22 semester-long classes (the 14 semester-cohorts from Phase 1 plus an additional eight cohorts). All Phase 2 data was collected during live observations. These additional data provided a larger sample of YPAR classrooms to test our hypotheses using quantitative analyses, beyond the classrooms involved in the YPT reliability analyses. The additional eight semester-cohorts included in Phase 2 were from the same schools and teachers as those included in Phase 1; the data from these additional semester-cohorts were not included in the reliability analyses because they were not double-coded by pairs of raters. Phase 2 participant characteristics were similar to Phase 1 (60% female; age range 14 to 19; mean = 16.6, SD = 1.1; 35% Latino, 29% Asian/Pacific Islander, 16% African American and 5% Caucasian).
Overview of YPT Scales and Scale Development
Our first goal was to develop and test the YPT; we sought to assess the seven types of processes outlined earlier that would theoretically be expected to occur in YPAR classes (Ozer et al., 2010). The research team outlined indicators to operationalize each category (Table 2) based on 2 years of formative research with teachers and students participating in YPAR projects regarding which processes they considered important for the effectiveness of the project and the growth of the participants. We also based our selection of processes on the existing literature on YPAR and psychological empowerment (Cargo et al., 2003; Checkoway et al., 2003; Jennings et al., 2006; Schensul, Berg et al., 2004; Zimmerman, 2000) and a review of other assessment measures for rating the quality of school and after-school settings (Pianta, Hamre, Haynes, Mintz, & La Paro, 2006; Smith & Hohmann, 2005).
Codes and Subcodes on the YPAR Process Template.

The measure development process was conducted over two years of systematic observations and weekly meetings of the research team to discuss subcode and ensure that processes could be coded reliably. The research team consisted of 10 graduate and undergraduate students who received approximately five hours of initial training in conducting observational ratings, followed by weekly supervision with the PI and BA-level project coordinator (coauthors). After extensive review of the YPT measure and guide, the training group coded videotaped classroom sessions and discussed any disagreements. If trained raters were not able to agree on a specific scale after several efforts to clarify the coding, the item was revised. The coauthors facilitated the trainings and discussions. Raters were eligible to code classroom sessions included in this analysis after achieving 80% agreement with other raters on five video sessions.
Frequency scales
The first section of the YPT consists of five frequency scales to quantitatively assess the interactions for specific YPAR processes (see Table 2). As described earlier, the study authors developed these scales based on the existing literature and formative research. Each scale includes a set of subcodes to operationalize the broad process category—rated from zero to two. The first scale assesses the “training and practice of research skills.” “Promoting strategic thinking” captures when students engage in critical analysis of social issues, making recommendations to solve problems, and interacting with adults in positions of power. Sub-codes for this scale include instances in which teachers scaffold strategic thinking and when students independently demonstrate these processes. “Group work” assesses the engagement and productivity of smaller groups of students within the class. “Opportunities for networking” highlights when students and teachers connect with youth or adults outside of the class to gain/share information or expertise. “Communication skills” captures the extent to which students develop these skills through presentations, exercises, and class discussions, and when the teacher or classmates provide constructive feedback to the student regarding communication.
Dimensional scales
We developed two-dimensional scales to assess youth–adult and youth–youth interactions in the YPAR projects. These dimensional scales reflect how power is shared in the classroom between the facilitating teacher and youth participants, with respect to (a) decisions about the YPAR project and (b) the structure and activities during class time. Examples of decisions about the YPAR project include choosing the problem that the students would study or selecting an action to solve the problem. All dimensional scales were rated from one to seven, with a “not applicable” option for the power sharing over major decisions scale. Our power-sharing items were based on the Youth Program Quality Assessment (YPQA) (Smith & Hohmann, 2005), a validated observational measure of after-school settings. The YPQA subscale item, “Staff share control of most activities with youth, providing guidance and facilitation while retaining overall responsibility,” was adapted in our power sharing over major decisions scale response range to “Low (1,2) = Students are provided limited or no opportunity to make major decisions regarding action research or other projects” to “High (6,7) = Teacher clearly provides opportunities for students to share power in making the major decisions regarding class projects. The teacher advises . . . decisions but gives final decision making power to the youth.”
Qualitative data collection
In addition to the quantitative scales, the YPT requires that raters provide a brief summary of the class and illustrative quotes to explain the ratings. This approach generated supplementary data regarding the content of the classes for a richer evidence base regarding the YPAR process and the overall “story” of the YPAR project.
Existing Class Climate Measures
Because the YPAR projects were being implemented in classroom settings, we also utilized existing validated measures of class climate as part of our overall assessment. The research team rated the study classrooms using three scales from the Classroom Assessment Scoring System (CLASS): regard for adolescent perspectives, positive climate, and student engagement (Pianta et al., 2006). Regard for adolescent perspectives captures the extent to which the teacher incorporates students’ social and developmental needs throughout the lesson by providing opportunities for decision making and sharing of ideas, connecting lessons to adolescent’s lives, and allowing meaningful opportunities to work with peers. Positive climate considers the overall emotional tone of the classroom, capturing the warmth of peer-to-peer interactions as well as interactions between the teacher and students. Finally, student engagement considers how actively engaged students are in the lesson and whether engagement was sustained throughout the class period. The CLASS demonstrates good interrater reliability and convergent validity with other commonly used class climate measures (Pianta et al., 2006). Prior to conducting observations, raters were trained using the CLASS scoring manuals and 12 videotaped class sessions with master coding guides. During training meetings, team members rated the CLASS videos and then compared their ratings to the master coding guide.
Qualitative Interview Data from Students and Teachers
As part of the overall study, the authors conducted extensive interviews with students and teachers that assessed some overlapping areas with the YPT dimensions and are analyzed in the present study as part of an initial assessment of the validity of the YPT. We conducted semistructured group interviews during class time with all YPAR students who were present (divided into groups of five to eight) at the end of each semester regarding the trajectory of their YPAR project, the decisions made and why, areas of learning, and changes to their relationships and networks due to participation. Due to the theoretical centrality of shared power in YPAR theory and practice, the process domain we most specifically targeted in the group interviews was the relative power of the students versus teachers for making decisions regarding the YPAR project. Each student was asked by the group facilitator to provide a number to represent the relative power of students to teachers in the YPAR class (e.g., 0 to 100) and asked to provide reasons to explain their ratings. We utilized these qualitative data to examine the correspondence between the YPT scale scores for power sharing; we focused on power sharing because of its theoretical importance and because we had responses from each participant for that dimension. First, we used the mean and SD of our YPT power-sharing scales to differentiate high, average, and low power-sharing classes; we then examined the text of the students’ responses regarding shared teacher–student power, identifying concordant and nonconcordant cases (Patton, 2002).
Phase 1: Psychometric Testing of YPT
Observation Protocol
Pairs of raters simultaneously rated live classroom sessions and were paired based on availability, with an attempt to match as many unique pairs of raters as possible (15 unique pairs in total). Three of the 10 raters participated in either video or live observation trainings while all other raters participated in both modes. Instructions for using the template, detailed descriptions of each subcode and examples of interactions appropriate for each code are listed in the YPT Guide. Raters were instructed to refer to the manual when recording observations to ensure consistency. Raters recorded field notes during the class period, ranging in length from 50 to 90 min. Although they had a copy of the YPT with them during the observation, raters recorded notes during the session and then used their observations to complete the YPT. All YPTs were completed within 24 hr of observing the class. For the videotaped sessions, a research team member recorded the class period during a single rater observation visit. The recorded class was then viewed and scored during a lab meeting. Frequently, more than two raters coded each video observation; in this case, two raters were randomly selected from the group for the reliability analysis. In all cases, the individuals coding the sessions were instructed not to discuss ratings until their forms were submitted.
Interrater reliability analysis
We calculated intraclass correlation coefficients (ICCs) to assess the interrater reliability of the seven YPT scales. ICCs summarize the degree to which differences in paired ratings result from differences between raters versus random variation in scores. Calculating intraclass correlations was the most appropriate method given the wide range of potential scores, the uneven distribution of ratings across this range of scores, and the use of an ordinal scale (Fleiss & Cohen, 1973; Jakobsson & Westergren, 2005). This method corrects for agreement between raters that may be due to chance (Cicchetti, 1994; Fleiss & Cohen, 1973). ICCs have been used to assess other frequently used classroom assessment scales, including the YPQA and the CLASS (Pianta et al., 2006; Smith & Hohmann, 2005). ICCs fall between zero and one and can be interpreted as the ratio of between rating variance to total variance. We used the criterion suggested by Fleiss (1981) that outlines the categories of agreement as follows: < 0.40 = poor; 0.40-0.74 = fair to good; 0.75-1.00 = excellent (Fleiss, 1981). These frequently cited guidelines are similar to others in the literature (Cicchetti & Rizley, 1981; Landis & Koch, 1977).
Phase 2: Power Sharing and Engagement Analysis
In Phase 2 of this study, we investigated the relationship between teacher–student power sharing during the YPAR projects and observed student engagement as measured on the YPT. We used multiple regression analyses in StataIC10 (College Station, TX, 2010) to test if the level of power sharing between the teacher and students predicted students’ behavioral engagement in the YPAR process. While our expectation was that teachers’ sharing of power might promote students’ behavioral engagement in YPAR, it is also reasonable to expect that the direction of the relationship could be reversed. That is, it is likely that teachers who are fortunate enough to be assigned a class with more engaged students would be able to share more power. To help rule out the possibility that any observed association between teacher–student power sharing and student engagement was driven only by students’ level of engagement at the outset, our strategy was to use students’ baseline engagement scores as a covariate in our analysis of the relationship between teachers’ power sharing and student engagement. We calculated baseline engagement by averaging the first two engagement scores given to each class during the semester; the other scores on student engagement were averaged to create the dependent variable. Because power sharing was operationalized in two ways in the YPT—power sharing over major decisions and over the daily structure of the classroom activities—we examined the relationship between power sharing and engagement along each of these dimensions in separate regression analyses. We initially included the number of students in the class and the teachers’ experience with the YPAR curriculum as covariates in the analyses, but these were excluded to maximize degrees of freedom as their effects were small and not statistically significant.
Results
Phase 1: YPT Psychometric Analyses
YPT reliability results
Table 3 shows the ICC scores and 95% confidence intervals for the seven scales on the YPT. Using the criteria suggested by Fleiss (1981), all seven scales on the template are in the good to excellent ICC range when using combined data from both live and videotaped classes. We further considered any patterns according to the observational method used (i.e., live vs. videotaped). We found that three subscales—training and practice of research skills, group work, and opportunities for networking—showed equivalent reliability for coding of live versus videotaped observation data. Three subscales—promoting strategic thinking, power sharing over major decisions, and power sharing over class structure—showed stronger interrater reliability for the video ratings. The communication skills subscale showed substantially lower interrater reliability when using videotaped observations only.
Characteristics of Ratings on the YPAR Process Template.

Note. N = 80 for all scales, except N = 112 for power sharing over major decisions.
Descriptive statistics
The means, standard deviations, and ranges for each of the seven original scales are presented in Table 3. Raters coded in each classroom observation an average of two examples of training and practice of research skills, three examples of promoting strategic thinking, three examples of working in groups, one of networking with others outside of the class and one example of students’ practicing good communication skills. On a scale of one to seven, raters gave an average score of 3.36 for power sharing regarding major decisions and an average score of 4.06 for power sharing regarding general class structure. For both scales, a score in the mid-range (3, 4, or 5) described a class where youth had opportunities to provide input and make decisions and benefited from structure provided by the teacher. Below, we share several examples of “mid-level” power sharing between teachers and students to describe this important dimension. In one class, the teacher created guiding questions to initiate a conversation about pressing issues in the school or community but allowed students to stray from the lesson plan when the discussion focused on a particular topic. In another, students decided to apply for a grant for their action project but had no experience developing this kind of application. The teacher coached students on the appropriate language for this kind of document, asked the students to respond to all the questions themselves, and then went through each one with the students to work through suggested revisions. In another class, the teacher required students with little experience presenting to adults to create a handout or slideshow to guide a presentation, but allowed the students to develop the materials themselves.
Correspondence of YPT Power Subscales and Student Reports of Shared Power
Our analysis of the correspondence between the YPT shared power subscale and students’ report of teachers’ sharing of power helps to provide initial evidence for the validity of the YPT ratings for this dimension central to theory and practice. Below we jointly consider YPT and student focus group data that exemplify patterns for low, average, and high sharing of power with students. One teacher scored low on power sharing over major decisions (3.5 and 4 out of a possible 7) for the two semesters she taught YPAR; student data reflect a consistent theme regarding their lack of shared power, for example, “this was supposed to be a more student-run class . . . she keeps trying to force us to think what she wants us to think,” and “the whole class feels that we should have more say in the class.” After this teacher left, a new teacher took over at the same site; this teacher’s YPT power-sharing scores increased over the course of several years (5.8 to 6.1 power sharing over major decisions; 4.2 to 5.6 power sharing over daily class activities). Student reports parallel the YPT power-sharing scores, starting with an average of 5.8 across the semester: “Student (S) 1: . . . I would put us at 75 . . . S2: Fifty. S3: I would put us at 50. S4: So he has 60 . . . S5: Fifty.” A subsequent semester with the same teacher demonstrated higher average power sharing (6.1 out of 7), also reflected in student comments: S1: I think it was 80. Our teacher had control over the class but he always let us decide with our peers what we’re going to be talking about, what we think is important . . . We have a lot of control over it and we decide the topic, but at the same time, he has somewhat control over us . . . S2: I think 90 because he plans it out but we take more control over it. S3: . . . I see him more as one of us—like a student. Maybe he’ll lead discussion; maybe he’ll bring up a topic and then we’ll discuss it and decide it.
Last, we consider YPT and student data from a project with an early power struggle over the topic that was resolved in ensuing semesters. Early in the project, power sharing over major decision scores were low-average (4.9) and several student focus group comments expressed limited power: “At first she was trying to like force some suggestions onto us about what we should do our topic on. And she kept bringing up issues that we would like say ‘no we’re not interested in that.” Student data from a later semester in which this same teacher was rated with high sharing of power over major decisions (6.6) on the YPT reflect more shared power, for example, “an 80 because (teacher) kind of leads us into the right direction of where to bring our project and what kinds of next steps but she never really tells us what to do,” and “I’d say 90. I feel like (the teacher) really just coordinated, but a lot of the decision power . . . was made by us.”
Phase 2: Power Sharing and Engagement
As outlined earlier, we examined the relationship between teacher-student power sharing and students’ behavioral engagement in terms of (a) power sharing over decisions in the YPAR project; and (b) power sharing over daily structure and activities in the classroom. Results of our first regression show that power sharing over major decisions explained 15% of additional variance in students’ behavioral engagement and was a significant predictor after controlling for baseline engagement (β = 0.41, t(19) = 2.18, p = 0.05). Our second regression indicated that power sharing over daily structure explained 27% of variance in engagement scores, after controlling for baseline engagement (β = 0.53, t(19) = 2.57, p < 0.01). Third, we examined a combined model that included both power-sharing scales. We found that power sharing over daily class structure and activities was a stronger predictor of behavioral engagement than power sharing over major decisions in the YPAR project; daily power sharing remained robust after controlling for power sharing over major decisions in the project and baseline engagement, explaining an additional 14% of the variance in student engagement (β = 0.44, t (18) = 2.18, p < 0.05).
Discussion
This study extends our ability to operationalize key YPAR processes and to systematically use these indicators to understand and assess the quality of YPAR implementation. As narratives about the value of participatory research and empowerment programs for youth continue to emerge, it is important to understand and assess the elements that constitute these programs. The YPT represents a reliable observational measure based in relevant theory and guided by extensive formative research in diverse classroom settings.
Development and Testing of YPT
There are previous documented efforts to assess the quality of YPAR program implementation in community-based and participatory action projects using qualitative methods. For example, qualitative coding of participant observations, focus groups, and key-informant interviews were used to assess program delivery efforts (Breckwich Vásquez et al., 2007; Catalani & Minkler, 2010; Nastasi et al., 2000). This study builds on prior efforts in several key ways. The YPT’s structure helps to target the collection of systematic quantitative and qualitative data for practitioners and evaluators to assess the quality of YPAR implementation. Data generated by the YPT can be aggregated over repeated sessions to summarize participants’ exposure to “active ingredients” during the course of the project. Because YPAR projects may unfold over the course of many months and include many steps, all of which contribute to the experience and potential impact of the program on participants, using the YPT to focus on key processes may reduce data overload that can occur with open-ended observational methods.
Here, we present psychometric evidence that multiple bachelor’s and undergraduate-level observers can achieve good to excellent interrater reliability on the YPT. We examined interrater reliability for our two methods of observation— live and videotaped—in combination and separately. We found that interrater reliability remained strong for both live and videotaped observations for the training and practice of research skills, group work, and opportunities for networking but that other subscales (promoting of strategic thinking, power sharing over major decisions, and power sharing over daily class structure) showed stronger interrater reliability for the video ratings. We suspect that the difference in reliability stemmed from the focused “gaze” of the videotaped sessions where only a portion of the classroom was being viewed at any given time. In contrast, two raters in a live classroom may have in fact observed different interactions happening simultaneously in different parts of the room. It is also possible that the “live” raters had more time elapse between their observations and their scoring of the YPT than those who completed their videotaped observations in the lab, although it was typical for the raters to complete the YPT immediately following the live classroom observation.
Shared Power and Behavioral Engagement
The second contribution of this study is the use of information from the YPT and other qualitative sources to assess the relationship between two key processes in youth development programs—sharing of power between adults and youth and youth engagement in the project. Considering longitudinal data from 22 YPAR cohorts, power sharing was found to be a robust predictor of observed youth engagement in the YPAR classes even after controlling for the classes’ baseline level of engagement. Power sharing in terms of daily structure and activities in the classroom was more powerfully associated with behavioral engagement than was power sharing over major decisions made in the YPAR project. Our finding that greater autonomy in the classroom (in this case, an YPAR classroom) is associated with higher behavioral engagement is consistent with the theoretical and empirical literature in human development and education reviewed earlier (Deci & Ryan, 1985; Shernoff et al., 2003; Skinner & Belmont, 1993).
The relative strength of the power over the daily structure of the classroom activities, as contrasted with the “bigger” decisions over the YPAR project, raises some interesting questions for further research on YPAR and community-based participatory research more generally. Does young people’s power over these “daily decisions” provide a meaningful level of power even in situations where they are constrained from exerting power over major decisions? Or are these daily decisions over the structure and activities in the classroom merely a form of “token empowerment” (Bess, Prilleltensky, Perkins, & Collins, 2009)? Our results suggest that it was informative to distinguish between these two forms of decision-making power, and that daily power in class was independently related to behavioral engagement over and above the effects of power over major decisions. While we make no claims that behavioral engagement as observed here represents an accurate assessment of higher-level dimensions such as “ownership” or psychological empowerment, we argue that behavioral engagement may be viewed as a necessary if not a sufficient step toward those higher-level experiences for young people.
Limitations and Next Steps
Further research with the YPT should be undertaken to build upon this study’s findings. The present study addresses the interrater reliability of the YPT and uses student focus group data to provide initial support for the validity of the YPT in assessing the key dimension of shared teacher-student power. It does not, however, provide specific evidence to support the predictive validity of the YPT measure; future research should examine the relationship between the implementation quality of the participatory research and outcomes for the student participants. Second, even more rigorous training and observation protocol could increase interrater reliability estimates (Raudenbush, Martinez, Bloom, Zhu, & Lin, 2008). Third, the process for assigning raters to specific classrooms was a limitation of this study. Ideally, all raters would have an equal chance of being assigned with any other corater, at any participating school and on any given day of the week. Our ability to randomly assign raters, however, was limited by availability. Teachers were reluctant to have a large number of different visitors rotate through the classroom and varied in their willingness to allow their class to be videotaped. We attempted to alleviate these constraints in several ways. To address randomness of rater assignment, we made an effort to select raters who would be available for a variety of sites and class times, created as many different live-observation pairings as possible, and videotaped all possible sessions so that raters could be randomized to code the taped sessions in the research office. We also separately analyzed the reliability of ratings on video versus live observations.
During the development and testing of the YPT, several considerations arose that serve as learning points for efforts to assess YPAR and similar approaches. First, YPAR is a dynamic and often-lengthy process; assessment of implementation quality requires repeated observations to assess the range of activities that participants experience. These observations should be long enough to assess the substance of the activities, rather than brief time samples that would be appropriate for capturing class climate dimensions such as emotional tone. Lengthier observations carry the potential disadvantages of observer fatigue. The YPT demonstrated acceptable reliability despite these complexities. Second, some higher-order processes were not directly observable in any single class session but were nonetheless integral to YPAR theory and as to how the program was experienced by youth. Most notably, classroom observations were not sufficient to assess the extent to which research and action were integrated over the course of the project. The assessment process for this higher-order integration dimension—beyond the scope of the present article—was conducted for each cohort utilizing observational data from the YPT in combination with interviews with students and adults.
The YPT measure developed here incorporates a range of YPAR components in an effort to respect the inherent variability across programs while assessing the key processes we expect to see in these programs. We do not assume that all processes listed on the template must be present at each session to have a high quality YPAR project; instead, this tool provides a guide for observers to focus observations and engage in more targeted data collection. Because all YPAR projects observed here took place in high school classrooms, subcodes may need to be expanded to incorporate program-specific needs when the YPT is applied to projects with other age groups or in non–school environments. Employing the YPT in a variety of settings will enable more systematic understanding of which processes are uniform across YPAR projects that achieve desired goals for participants and their change efforts. Along these lines, future research and evaluation efforts are needed to determine if adapted versions of the YPT can be useful for the observational assessment of participatory research among adults, and if the subscales not explicitly focused on research—promotion of strategic thinking, networking, group work, communication skills, and power sharing over decisions and daily structure— can contribute to the assessment of empowerment or organizing programs that do not emphasize research.
Footnotes
Acknowledgements
The authors express appreciation to Elizabeth Hubbard, Gary Cruz, Adee Horn, and Morgan Wallace for collaboration with the research; Thomas Cook, Meredith Minkler, and Lawrence Green for their consultation; Sami Newlan and Marieka Schotland for assistance in data collection; and Amanda Bailey, Monica Beas, Teresa Igaz, Eric Koo, Christina Law, Emma Lantos, Becky Lee, Diana Rios, Kathryn Steckler, and Jasmine Wang for their assistance in data collection.
Declaration of Conflicting Interests
The author(s) declared no potential conflicts of interest with respect to the research, authorship, and/or publication of this article.
Funding
The author(s) received following financial support for the research, authorship, and/or publication of this article: This research was supported by a William T. Grant Scholars’ Award to Emily J. Ozer.