




Abstract
Alcohol protective behavioral strategies (PBS) are commonly conceptualized with a three-factor model, as used in the Protective Behavioral Strategies Scale-20 (PBSS-20). However, inconsistencies exist between factors and drinking outcomes. The current study used factor analysis to test a two-factor structure directly via controlled consumption (Direct/CC) and indirectly via harm reduction (Indirect/HR) using the PBSS-20 among a combined sample of n = 4,883 drinkers. Both the two- and three-factor structures evince similar model fit. A two-factor model yielded more concise PBS measurement. Negative associations were observed with consumption (Direct/CC PBS) and problems (Indirect/HR). A condensed, eight-item, two-factor model accounted for less variance in alcohol consumption, however more variance in alcohol-related problems. A more consistent framework for understanding the impact of PBS on alcohol-related outcomes is provided.
Protective behavioral strategies (PBS) are specific strategies one can implement when drinking alcohol to potentially reduce negative alcohol-related consequences (Pearson, 2013). PBS for alcohol use have historically been conceptualized in three subtypes: 1) Serious Harm Reduction (SHR; e.g., knowing where your drink is at all times), 2) Stopping/Limiting Drinking (SLD; e.g., stopping drinking at a predetermined time), and 3) Manner of Drinking (MD; e.g., avoiding mixing different types of alcohol; (Martens et al., 2005). The most commonly used assessments of these PBS factors are the Protective Behavioral Strategies Survey (PBSS; Martens et al., 2005) and the expanded version, the PBSS-20 (Treloar et al., 2015).
Engagement in PBS impacts the amount of alcohol individuals consume. Multiple studies on college students have found higher PBS use was associated with lower alcohol consumption (Benton et al., 2004; Borden et al., 2011; Pearson, 2013). Similarly, a study conducted in Australia identified an overall negative association between alcohol consumption and PBS use (Jongenelis et al., 2016). One study on Latina female college students found, when engaging in PBS, individuals experienced lower likelihood of drunkenness, indicating decreased general alcohol use, directly, and high-risk drinking, indirectly (Perrotte et al., 2021).
Alcohol PBS are also broadly associated with lower alcohol-related problems. In a sample of over n = 5,000 college students, alcohol PBS use inversely linked to alcohol-related problems (Peterson, Kramer et al., 2021). Further, PBS use attenuate several associations between risk factors and alcohol-related problems (De Leon, Peterson et al., 2022; Peterson, Kramer et al., 2021). However, while consistent research exists to confirm the associations between PBS use, alcohol consumption, and problems, there is also evidence of mixed findings across the different PBS subtypes.
Previous findings have found all three of these strategies to be linked to both safer alcohol consumption and fewer alcohol-related problems (Martens et al., 2005), albeit to varying degrees (Martens et al., 2005; Martens et al., 2011; Pearson et al., 2013). However, the direction of these associations vary widely across studies. Regarding alcohol consumption at the cross-sectional level, MD and SLD have been associated with both lower alcohol consumption (Carey et al., 2022; Hoover et al., 2023; Looby et al., 2019; Perez et al., 2021), as well as higher alcohol consumption (Jordan et al., 2023; Leary et al., 2022). Other studies have shown that MD and SLD are not associated with consumption (Blanchard et al., 2019; Gonzalez et al., 2019). Serious Harm Reduction (SHR) generally has positive associations with consumption (Jordan et al., 2023; Peterson, Dvorak et al., 2021).
Regarding alcohol-related problems, MD and SLD have shown positive (Jordan et al., 2023; Leary et al., 2022), negative (De Leon, Dvorak et al., 2022; Richards et al., 2018), and null (Braitman et al., 2023; Pilatti et al., 2021) associations with alcohol-related problems. While SHR often evinces positive associations with consumption (Jordan et al., 2023; Peterson, Dvorak et al., 2021), SHR has also shown consistent negative associations with alcohol-related problems (De Leon, Dvorak et al., 2022; Richards et al., 2018). Nonetheless, the prevailing body of research indicates that individuals who engage in PBS broadly report lower alcohol consumption (Carey et al., 2022; Lemoine et al., 2020; Smallman et al., 2023) and fewer negative alcohol-related problems (Bolts et al., 2022; De Leon, Peterson et al., 2022; Grazioli et al., 2019; Treloar et al., 2015).
Challenges with Original PBS Factor Structure
As aforementioned, Protective Behavioral Strategies (PBS) for alcohol use have historically been conceptualized in three subtypes: 1) Serious Harm Reduction, 2) Stopping/Limiting Drinking, and 3) Manner of Drinking (Martens et al., 2005). However, as previously presented, there are inconsistencies within the literature regarding the associations between PBS factors and problematic alcohol use, to the extent that definitive conclusions cannot be drawn about said associations. For example, SHR is arguably the most clinically relevant PBS subtype (Treloar et al., 2015), however, while some studies associate SHR with safer drinking and fewer problems (Jordan et al., 2018; Treloar et al., 2015) others have noted the opposite, perhaps because SHR may be implemented as a reactionary strategy post-problematic drinking rather than a pre-emptive measure (Pearson, 2013).
Alternatively, the SLD factor has shown little relation to consumption or problems (e.g., only related to peak drinking in a single sitting; Martens et al., 2005), and changes in the SLD subscale scores do not predict a decrease in alcohol consumption or problems (Fernandez-Calderon et al., 2021; Martens et al., 2011). Additionally, MD is frequently found to be associated with alcohol consumption rather than problems (Martens et al., 2005; Pearson, 2013), likely because the items that commonly assess this factor relate to direct drinking behaviors. While a three-factor model of PBS may offer an appealing quantitative structure in factor analyses, these domains have struggled to consistently predict alcohol use or problems across samples. Perhaps the preponderance of prior research has clustered these behaviors inaccurately. Our prediction of use and problems from PBS may prove more consistent if we conceptualize PBS not by type of behavior, but rather by the form of implementation (e.g., direct [controlled consumption] vs. indirect [harm reduction] protective strategies).
Direct/Controlled Consumption and Indirect/Harm Reduction PBS Subtypes
A handful of prior studies have proposed a two-factor model of alcohol protective behaviors. The first studies to think about PBS as two factors referred to the factors as “direct” and “indirect” strategies (DeMartini et al., 2013). More recent studies have framed these factors as controlled consumption (direct) and harm reduction (indirect) strategies (Madson et al., 2013). Direct/Controlled Consumption (Direct/CC) PBS are drinking strategies that impact alcohol consumption and include specific quantifiable behaviors (e.g., alternating alcohol and non-alcohol drinks; DeMartini et al., 2013). Alternatively, Indirect/Harm Reduction (Indirect/HR) PBS may include behaviors that do not overtly affect consumption (e.g., having a designated driver; DeMartini et al., 2013) but may be more directly relevant to alcohol-related problems. Intervention research in young college students has found that interventions promoting both Direct/CC and Indirect/HR PBS strategies decrease drinks per week and reduce peak drinking (Leeman et al., 2016). In the first study to conceptualize Direct vs. Indirect PBS, DeMartini and colleagues (2013) tested and confirmed a two-factor structure of the Protective Strategies Questionnaire (Palmer et al., 2010). They found that in addition to direct strategies being related to alcohol consumption (but not problems); indirect strategies were related to alcohol problems, but not consumption (DeMartini et al., 2013). This could be due to respective motivations to alter drinking behavior and create a safer situation in which to consume alcohol (DeMartini et al., 2013). Thus, a two-factor structure may cleanly and consistently explain drinking behaviors motived by two different outcomes (e.g., consuming less alcohol and avoiding problems associated with consumption). Furthermore, the original three-factor structure from the PBSS (Martens et al., 2005) and PBSS-20 (Treloar et al., 2015) contains individual items on how individuals drink that may influence problems both directly and indirectly (e.g., avoiding shots).
Further research regarding how these factors relate to problematic alcohol use is needed. Additionally, given that the PBSS-20 is the most commonly used assessment of alcohol PBS (Peterson, Kramer et al., 2021), and PBS factors have been found to be related differentially (albeit inconsistently) to alcohol consumption and problems, it may be that a Direct/CC and Indirect/HR factor solution is preferential to the traditional three-factor solution. Re-evaluating the factor structure may help resolve prior inconsistencies.
Study Overview
The current study aimed to (1) re-evaluate the factor structure of the most common measure of PBS, the PBSS-20, (2) compare the revised factor structure to the 3-factor structure, and (3) examine the utility of a brief version of the 2-factor structure. To test these aims, data on college student drinkers from seven different studies were combined.
Method
Participants and Procedures
Seven combined datasets, all collected from a large Southeastern university, resulted in a sample of n = 4,883 drinkers (Agem = 20.24). Variables of interest included: gender, sex assigned at birth, age, race, alcohol consumption, alcohol use problems, and protective behavioral strategies. Individuals who completed the surveys and endorsed drinking alcohol were included. Additional detailed descriptive statistics and bivariate correlation data are provided in Table 1. All participants were treated in accordance with American Psychological Association ethical guidelines for research (Sales & Folkman, 2000).
Descriptive Statistics and Bivariate Correlations.

Note. AUDIT = Alcohol Use Disorders Identification Test; DDQ = Daily Drinking Questionnaire-Revised; B-YAACQ = Young Adult Alcohol Consequences Questionnaire-Brief version, PBSS-20 = Protective Behavioral Strategy Survey-20; SD = Standard Deviation.
*p ≤ .05
Measures
Demographics
Participants self-reported their sex assigned at birth, age, and race. These factors were controlled for in analyses.
Alcohol Consumption
Amount of alcohol consumed was assessed via items 1–3 on the Alcohol Use Disorders Identification Test (AUDIT; Saunders et al., 1993) and the Daily Drinking Questionnaire-Revised (DDQ-R; Collins et al., 1985). The AUDIT is a 10-item questionnaire, on which the first three items assess general patterns in alcohol consumption in terms of frequency (e.g., “How often do you have a drink containing alcohol?”) and quantity (e.g., “How many drinks containing alcohol do you have on a typical day when you are drinking?”). Items on the AUDIT are rated 0-4, with higher ratings on the first three items corresponding with greater consumption. These items showed good internal consistency across these samples (α = .77). The DDQ-R asks participants to reflect on their alcohol consumption during a typical week over the past three months and to indicate the number of drinks consumed daily each day, as well as the number of hours typically spent drinking per day. The total number of typical drinks per week was used in this study as a metric of amount of alcohol consumed. The first three items of the AUDIT and the DDQ-R were combined to form a latent variable for alcohol consumption.
Alcohol Problems
Alcohol problems were assessed by items 4–10 on the AUDIT and via the Young Adult Alcohol Consequences Questionnaire-Brief Version (B-YAACQ; Kahler et al., 2005). AUDIT items 4–10 regard alcohol-related problems in the past year (e.g., “How often during the last year have you had a feeling of guilt or remorse after drinking?”), rated based on a 0-4 scale. These items showed good internal consistency across samples (α = .74). The B-YAACQ is a 24-item assessment of alcohol problems in which items indicate potential problems of alcohol consumption (e.g., “I have passed out from drinking”), and individuals indicate whether they have experienced each consequence in the last three months (yes/no). Higher scores on the B-YAACQ indicate greater recent alcohol-related problems. B-YAACQ items also showed good internal consistency across these samples (α = .95). The B-YAACQ total score and the last seven items of the AUDIT were combined to form an alcohol problems latent variable.
Protective Behavioral Strategies
PBS were assessed using the Protective Behavioral Strategies Survey-20-item version (PBSS-20; Martens et al., 2005; Treloar et al., 2015). The PBSS-20 assesses the frequency in which individuals engage in strategies meant to lower the risk of alcohol problems (e.g., “How often do you use a designated driver?”) by rating them on a six-point scale (1 = never, 6 = always). The PBSS-20 showed good overall internal consistency (α = .93), as well as good internal consistency for the Direct/CC (α = .91) and Indirect/HR (α = .88). factor loadings.
Data Preparation and Analysis Overview
Seven datasets were combined to create a baseline dataset of N = 4,883 drinkers (Agem = 20.24). Variables included for each of the datasets were: gender, sex assigned at birth, age, race, AUDIT, AUDIT-C, DDQ-R, PBSS-20, and B-YAACQ. Missing data was rare, ranging from 0.43% to 5.09% across all measures, and was handled using full information maximum likelihood.
We first estimated the common three-factor model using a Confirmatory Factor Analysis (CFA). We then estimated a two-factor model in which HR is a single factor and Controlled Consumption (CC) is a higher order factor comprised of the MD and SLD PBS. Next, we estimate the same two-factor model, but without the higher order factor structure to allow for comparison. Then, we iteratively remove items with inter-item correlations and/or high cross-loadings to identify a parsimonious two factor structure. Finally, we compare the predictive utility of the four different models.
Results
Descriptive and Bivariate Statistics
The mean age of the aggregate sample of n = 4,883 participants was 20.24 (SD =4.13) years old and participants predominately identified their sex assigned at birth as female (64.04%, n = 3,127). In terms of race, the participants predominately identified as White (73.87%, n = 3,607), followed by Black (8.93%, n = 436), Asian (6.51%, n = 318), Native Hawaiian/ Pacific Islander (2.29%, n = 112), American Indian/Alaskan Native (0.31%, n = 15), multiple races (2.95%, n = 144), and other (3.40%, n = 166). A small percentage of participants did not respond (1.74%, n = 85). Additional descriptive statistics and bivariate correlations for the entire sample are provided in Table 1.
Factor Analysis
Figure 1 depicts the different confirmatory factor structures examined with the items for each factor structure. We first estimated a three-factor model of SLD, MD, and HR, χ2(167) = 7660.95, p < .001, CFI = .933, RMSEA = .096, SRMR = .046. Examination of modification indices (MI) indicated several highly correlated errors. Correlated errors with Modification Indices > 50 where iteratively freed (correlated errors are noted by superscripts in Figure 1). This resulted in significantly better model fit, χ2(153) = 4438.83, CFI = .962, RMSEA = .076, SRMR = .038, Δ Satorra-Bentler χ2(14) = 3027.64, p < .001 (see Figure 1 panel a). Then, we estimated the four-factor model, with Controlled Consumption (CC) as a higher-order factor comprised of the SLD and MD factors (see Figure 1 panel b, left model). This is mathematically equivalent to the prior model (i.e., identical fit), but allows for the testing of a nested two-factor model (note that the three-factor model is not technically nested within the two-factor model, so this step allows for the comparison of the mathematically equivalent nested model). We estimated the two-factor model with all SLD and MD items loading on the CC factor (see Figure 1 panel b, right model), χ2(155) = 4425.97, p < .001, CFI = .962, RMSEA = .075, SRMR = .039 and compared this to the model above with a higher order factor predicting MD and SLD (Figure 1 panel b, left model). The simpler two-factor model (Figure 1 panel b, right model) fit the data significantly better than the higher-order factor model (Figure 1 panel b, left model), Satorra-Bentler Δ χ2(2) = 102.77, p < .001.
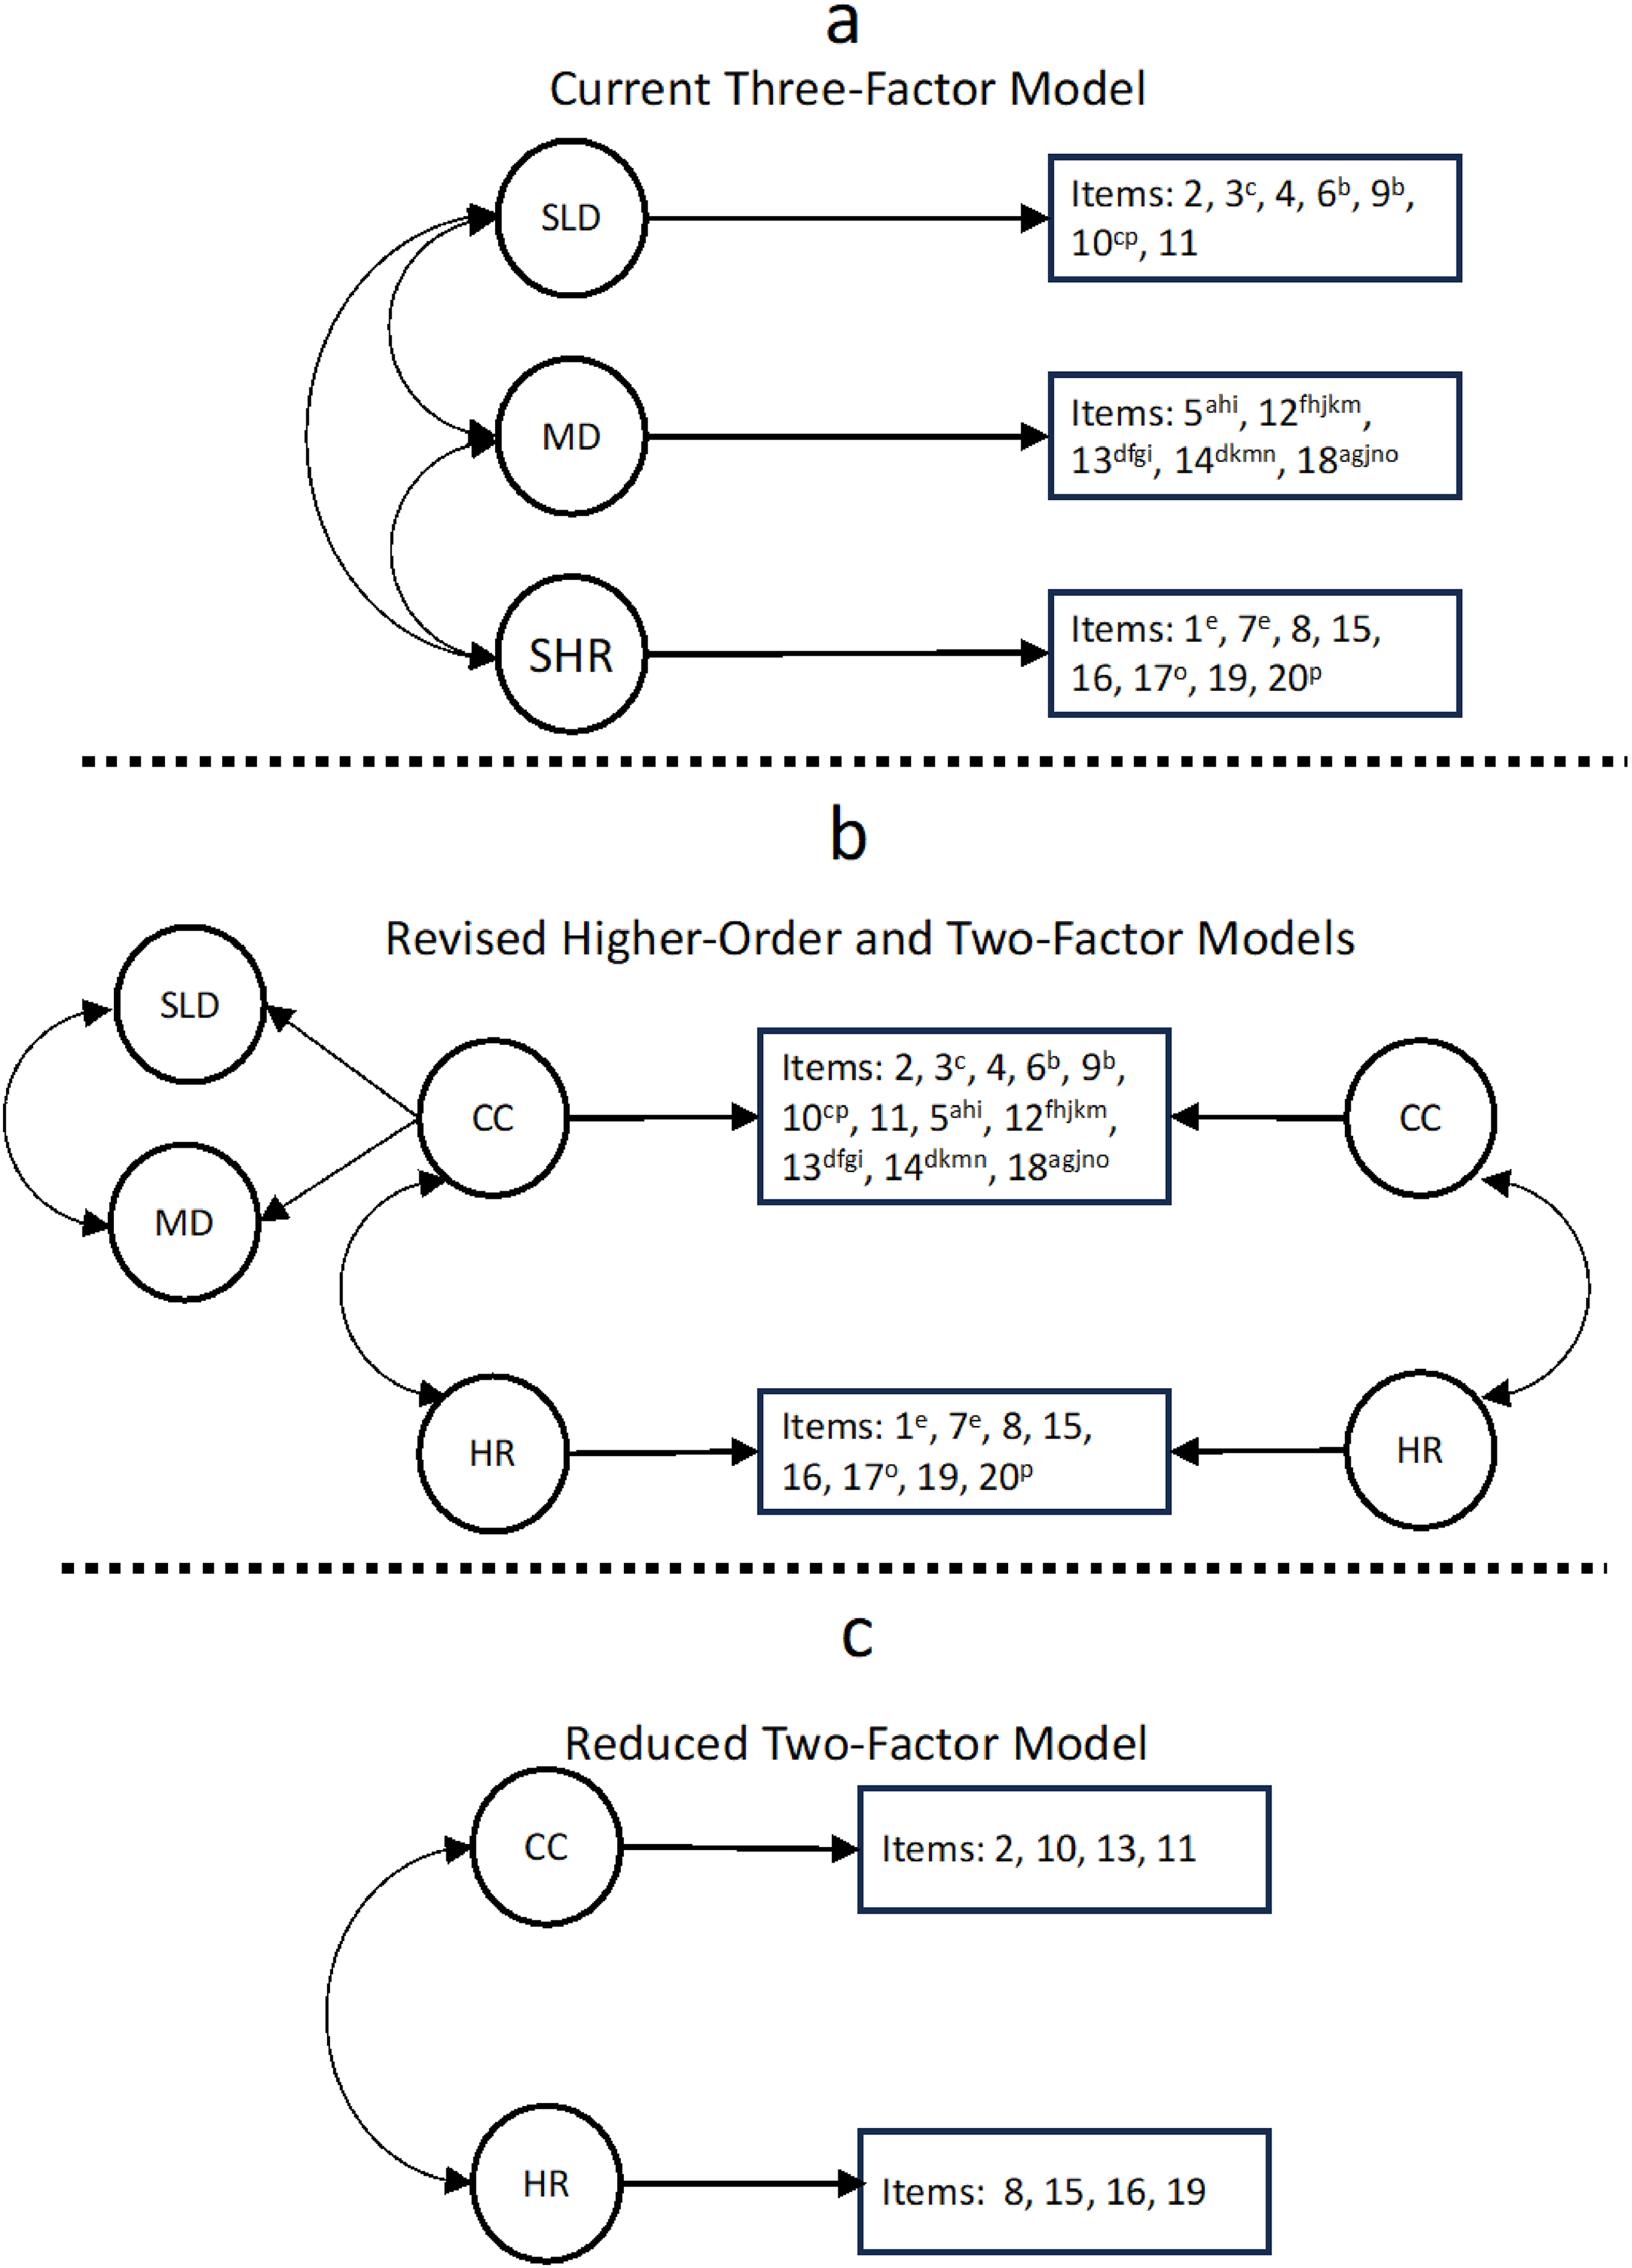
Different confirmatory factor structures examined and corresponding items.
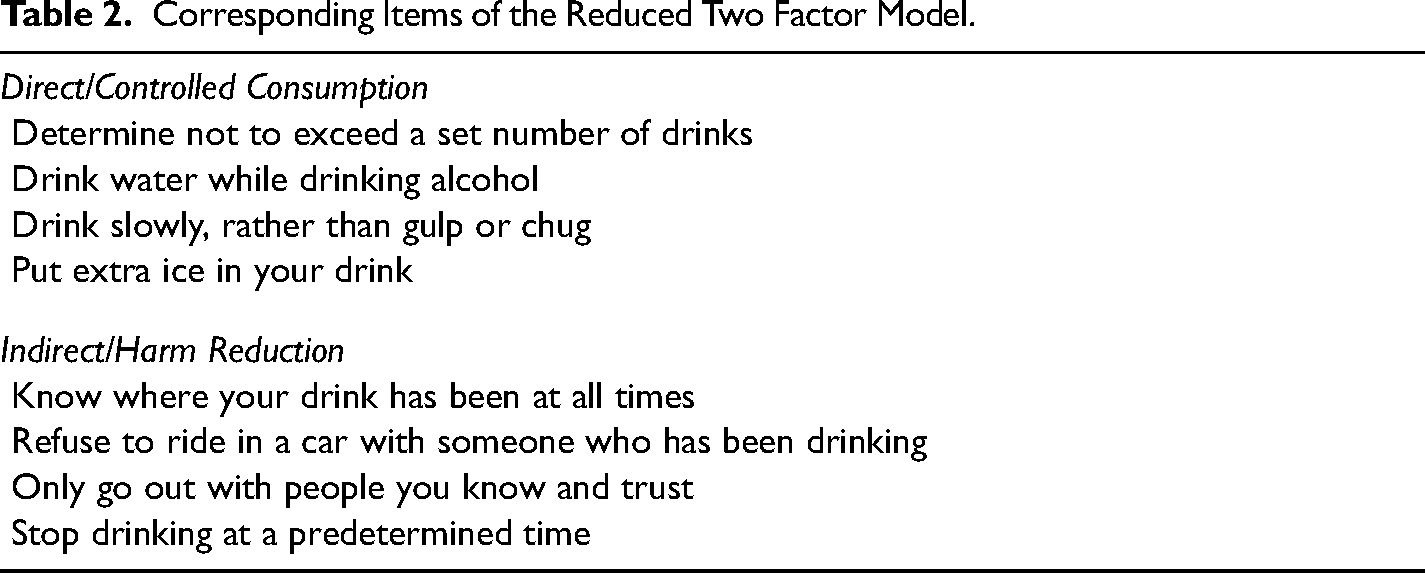
In the full-item two-factor model, there were several items with high inter-item correlations and/or cross-loadings across the two factors. To provide a reduced, parsimonious, measure we iteratively removed items with cross-loadings > .3 and intercorrelations > .4 (Yong & Pearce, 2013). This resulted in an eight-item measure with four items loading on Controlled Consumption and four items loading on Indirect/Harm Reduction (see Figure 1 panel c and Table 2). This measure showed reasonable fit to the data with no correlated errors, χ2(19) = 299.42, p < .001, CFI = .993, RMSEA = .055, SRMR = .017.
Corresponding Items of the Reduced Two Factor Model.
Predictive Utility of the 3 vs 2 Factor Models
To examine the predictive utility of the original three-factor model, the higher order two-factor model, the simple two-factor model, and the reduced two-factor model, we compared structural equation models of the different factor structures as predictors of alcohol use and alcohol-related problems (see Figure 2). Note, that these models are non-nested, and thus the fit statistics are not directly comparable; fit statistics for all models are in Table 3. The original three factor structure (see Figure 2, panel a) showed reasonable fit to the data (see Table 3). In this model, MD PBS was negatively associated with alcohol use, but not associated with alcohol-related problems. Consistent with prior literature, HR PBS was negatively associated with alcohol-related problems, but positively associated with alcohol use. Interestingly, SLD PBS was positively associated with both alcohol use and alcohol-related problems. This model accounted for 41% of the variance in alcohol-related problems and 32% of the variance in alcohol consumption.
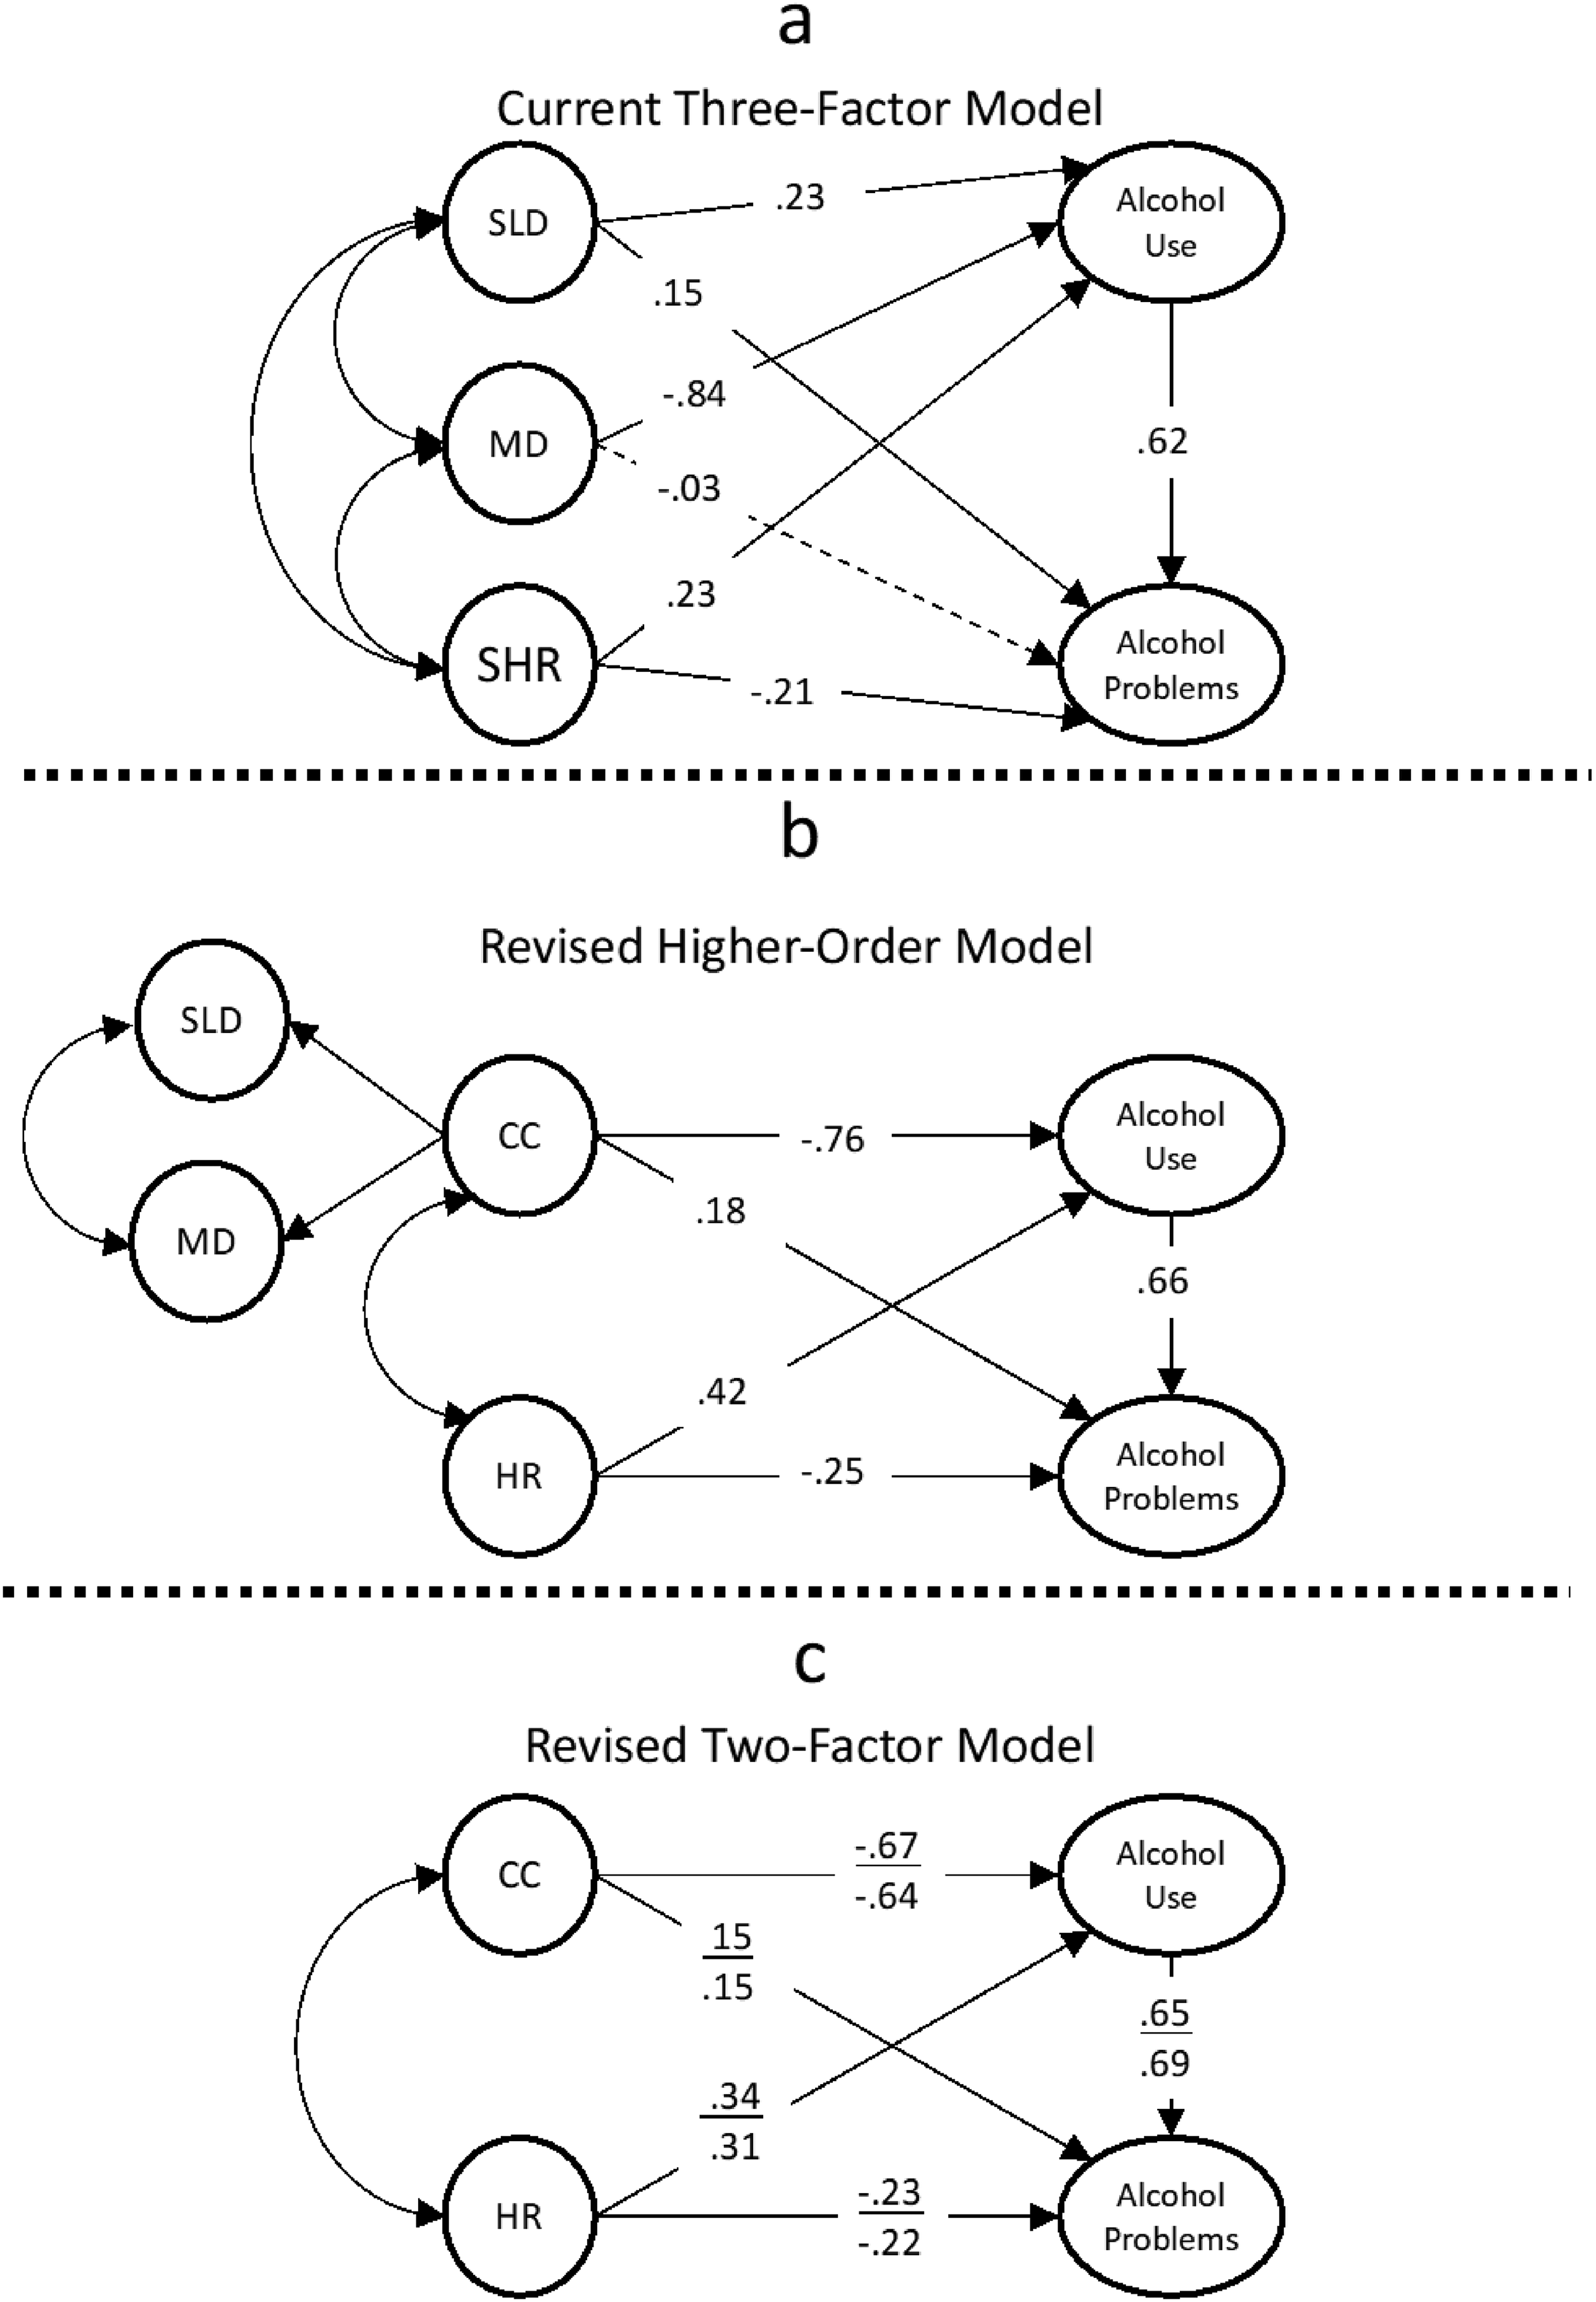
Predictive utility of the various factor structures.
Fit Statistics for Each Factor Structure Predicting Alcohol Use and Alcohol-Related Problems.

Next, we examined the higher-order factor structure (see Figure 1, panel b). This model also showed reasonable fit to the data (see Table 3). In this model, the higher-order factor, CC (controlled consumption), was negatively associated with alcohol use (consistent with hypothesis) and positively associated with alcohol-related problems. While this model accounted for similar variance in alcohol-related problems (41%) it accounted for less variance in alcohol use (28%). We then examined the simple two-factor structure without the higher-order factor (e.g., all SLD and MD PBS forming a single CC PBS latent variable). This model also showed reasonable fit to the data (see Table 3). The simple two-factor model accounted for similar variance in alcohol-related problems (41%) but again accounted for less variance in alcohol use (24%). Finally, we examined the reduced (eight-item) two-factor model. This model showed excellent fit to the data (see Table 3). The model accounted for 45% of the variance in alcohol-related problems and 22% of the variance in alcohol use.
Collinearity and Suppression in the 3-Factor Model
One concern in the above analyses, is that there appears to be suppression occurring in both the 2- and 3-factor models. A core tenet of Factor Analysis is that indicators are only related to each other due to an underlying latent construct. Formation of a factor from the observed indicators should result in no common variance among indicators once accounting for the common underlying theta driving item covariance (Gorsuch, 2015). However, the 3-factor model required 14 correlated errors in order to achieve adequate fit, which in itself suggests some measurement related issues. Further complicating this is that, in this model, all PBS factors had inverse bivariate correlations with both use (rs = −.14 to −.51, ps < .001) and problems (rs = −.21 to −.36, ps < .001). However, when modeled together, three paths completely flip signs, becoming positive and statistically significant in the opposite direction, one path becomes effectively 0 (non-significant), and only two paths remain theoretically consistent and statistically significant (MD to use and SHR to problems). These changes are all consistent with suppression effects and seem to indicate high levels of collinearity. High collinearity can occur when predictor variables are highly correlated and seem to be measuring the same underlying construct. In the measurement model, the correlations between the three factors ranged from rs = .63 to .83. We examined the Variance Inflation Factor (VIF) and Tolerance of each predictor. Rule of thumb cutoffs for VIF are ≥5 and Tolerance ≤ .20 (Thompson et al., 2017). In this model, the VIF and Tolerance exceeded these values for two of the predictors (MD: VIF = 7.33, Tolerance = 0.14; SLD: VIF = 6.72, Tolerance = .15; SHR: VIF = 2.77, Tolerance = 0.36). Thus, SLD and MD appear to be highly collinear in the model while also accounting for nearly 70% shared variance which likely produces unstable parameter estimates (Alston & Chalfant, 1991).
Collinearity and Suppression in the 2-Factor Model
Next, we examined the reduced 2-factor model with no correlated errors. This model also had a fairly robust correlation among the two factors (r = .64, p < .001), though the shared variance is only ∼41%. Consistent with the 3-factor model, there were negative bivariate correlations between each factor and both use (rs = −.09 [HR] and −.38 [CC], ps < .001) and problems (rs = −.14 [HR] and −.25 [CC], ps < .001). As with the 3-factor model, we see evidence of suppression, as the path from CC becomes positive and significant when predicting problems in a model that includes HR and CC (see Figure 2). Similarly, the path from HR to use becomes positive when CC is included in the model. Thus, across all PBS models, there is evidence of suppression. In the 2-factor model VIF was 3.86 and Tolerance was 0.26 for direct. VIF was 3.14 and Tolerance was 0.32 for indirect. Thus, there was less shared variance among factors, no correlated errors among indicators, and acceptable VIF and Tolerance for the 2-factor model relative to the 3-factor model. However, there remained a suppression effect. Suppression can indicate a number of potential issues, one of which is the possibility of moderation effects (Friedman & Wall, 2005; Pandey & Elliott, 2010). We turn to this, as a way to understand the positive associations between the two factors and alcohol outcomes.
Interaction Within the 2-Factor Model
We hypothesized that the collinearity between CC and HR may be a function of salutary effects (i.e., as one increases the positive association in the other decreases). Thus, we next examined the interaction between CC and HR. We assumed that CC is most important for consumption while HR is most important for problems. We specified a latent variable interaction between CC and HR in the prediction of both use and problems. This interaction significantly predicted use (β = −0.15, p < .001) and problems (β = −0.02, p = .044). We first examined the association between use and HR as CC increased. To do this, we calculated the point at which HR was no longer positively associated with use (see Figure 3, panel a). When CC was 0.19 SD above the mean, HR was no longer a significant predictor of use. Importantly, HR reverses signs and becomes protective when CC reaches a value of 1.22 SD above the mean. We then examined this for CC and problems. The salutary effect was less robust for problems (see Figure 3, panel b). As HR increased, there was a modest decrease in the positive association between CC and problems. At 1.85 SD above the mean on HR, CC no longer exerted a significant effect on problems. Finally, as might be expected, low levels of either variable resulted in attenuated protective effects and/or potentiated risk.
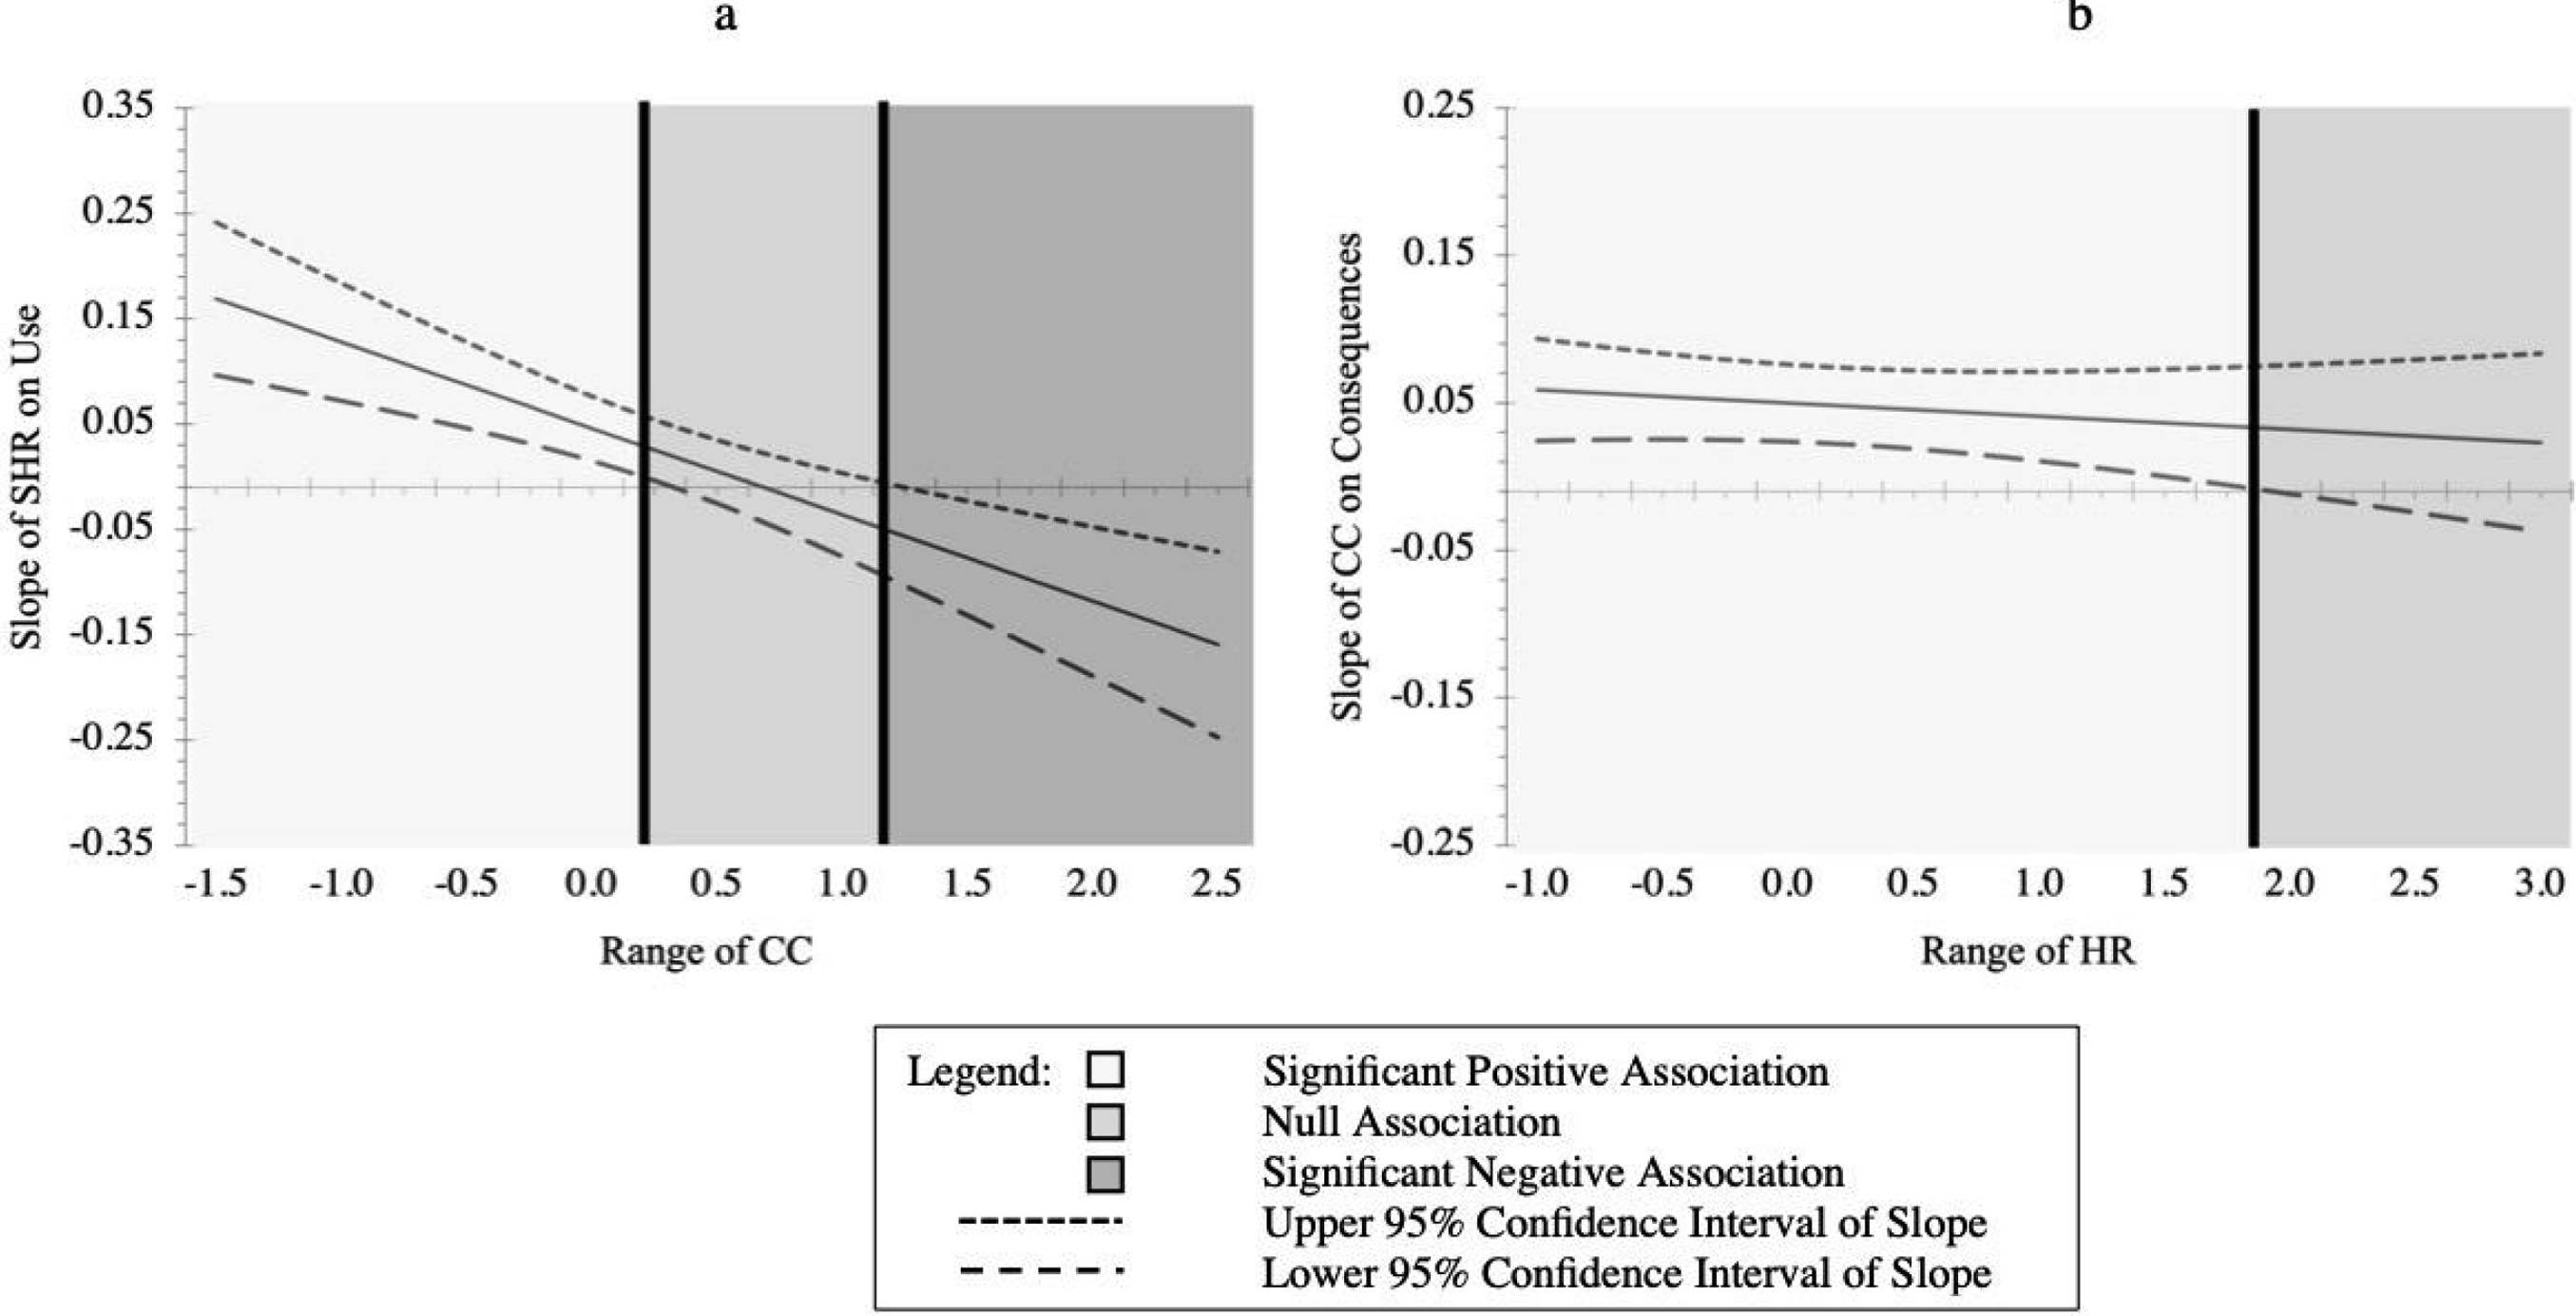
Regions of significance for HR predicting use (panel a) and CC predicting problems (panel b).
Discussion
The current study aimed to develop and compare a two-factor structure for alcohol PBS from the most commonly used measure of PBS, the PBSS-20, in an attempt to provide a more consistent predictive model of PBS based on the form of implementation (i.e., targeting consumption or problems) rather than the type of behavior they are engaging in. To do this, we compared three different models, and then developed a brief model with less item overlap. Based on a sample of n = 4,883 drinkers, the reduced (eight-item) two-factor model was the shortest assessment of alcohol protective behavioral strategies and accounts for more total variance in alcohol-related problems relative to the other three models. Conceptualizing PBS as Direct/Controlled Consumption and Indirect/Harm Reduction protective strategies offers a quick and easy way to analyze data when it comes to assessing protective behavioral strategies, with essentially no loss of information for the most clinically relevant outcome, alcohol problems.
While the original three-factor, the higher order two-factor, and the simple two-factor models accounted for more variance in alcohol consumption, this was by a small margin. Compared to the reduced (eight-item) two-factor model, the other models accounted for 12% more variance (original three-factor model), 6% (higher order two-factor structure), and 2% (simple two-factor model) in alcohol consumption. However, alcohol-problems are arguably a more clinically relevant outcome, and thus it may be more important to identify factors that can better explain variance in problems vs. consumption. While the eight-item two-factor model accounts for less variance in consumption, it may hold more clinical utility by virtue of the higher rate of variance accounted for in alcohol problems.
While protective behavioral strategies are broadly associated with less alcohol consumption and fewer alcohol-related problems (e.g., hangovers, assaults, legal problems; Bolts et al., 2022; Carey et al., 2022; De Leon, Peterson et al., 2022; Lemoine et al., 2020; Richards et al., 2018; Smallman et al., 2023), inconsistency in the outcomes across subscales remains an issue (Blanchard et al., 2018; Jordan et al., 2023; Looby et al., 2019). The current data provide a clearer picture. CC leads to less alcohol use but remains positively linked to alcohol-related problems; whereas HR leads to fewer alcohol-related problems but remains positively linked to use.
The most confusing finding using this new approach, is that CC continued to have a significant positive association with problems in the full model, despite a negative bivariate correlation with problems. Similarly, HR had a positive association with use in the full model, but a negative bivariate correlation with use. These two findings point to the possibility of suppression effects for both, due to overlapping variance in the PBS factors. We examined the ways in which these variables may overlap, and tested the salutary (i.e., positive interactive) effects they may have on each other for the primary outcome of interests. As HR increased, we found that the positive association between CC and problems was attenuated, though this effect was quite modest. Similarly, as CC increased, the positive association HR and use decreased. The latter was quite robust, reducing the association between HR and use to null when CC increased by 0.19 SD and became a protective effect when CC increased by 1.22 SD.
Utility and Implementation of the Reduced 2-Factor Model
It may seem “simplistic” to reduce a factor structure from three to two-factors. While there is valid argument for more complex measurement of constructs, there is also a 17-year gap from when research is produced to when it becomes implemented into clinical practice (Balas & Boren, 2000). Previous dissemination and implementation efforts have focused on creating measurement of complex constructs, such as Direct/Controlled Consumption and Indirect/Harm Reduction, more useful, compatible, acceptable and briefer for clinical practice (Stanick et al., 2017). The simple notion that CC is most important for consumption, and HR is most important for problems, is one that has the potential for a streamlined applicability within both clinical research and practice. In addition, the fact that an interaction effect exists between the two factors, CC and HR, helps to clarify the way in which these two protective factors may be interrelated to their respective alcohol outcomes.
Clinical Implications
The revised two-factor structure with a simplified 8-item measure offers two primary clinical implications. First, prior research has frequently shown that some PBS produce positive associations with alcohol outcomes. This leads clinicians to a difficult question. Specifically, “What if increasing use of PBS produces more problematic alcohol involvement?” The current study answers this question. Though there is a positive association between HR and use, this association decreases, and eventually becomes protective as individuals use more CC strategies (which are also associated with increasingly less consumption). Similarly, there is a positive association between CC and problems, but this too is attenuated as HR strategies increase. Thus, movement in both types of PBS produces net gains in the target outcomes for each PBS (i.e., between CC and use and between HR and problems) in addition to risk reduction on the non-target outcomes (i.e., between CC and problems and between HR and use). Additionally, individuals who consume more alcohol have greater need and more frequent opportunities to implement protective behavioral strategies.
Second, this way of interpreting alcohol protective behavioral strategies through Direct/CC and Indirect/HR behaviors/strategies provides an improved structure with potential clinical utility. This framework offers a succinct way of providing tailored interventions to individuals who struggle with either alcohol consumption (i.e., determine not to exceed a set number of drinks, drink water while drinking alcohol, drink slowly, rather than gulp or chug, and put extra ice in your drink), alcohol-related problems (i.e., know where your drink has been at all times, refuse to ride in a car with someone who has been drinking, only go out with people you know and trust, and stop drinking at a predetermined time), or both. By introducing these strategies in the therapy session, individuals will be provided with behavioral targets that can aid in potential decreases of use and negative alcohol-related problems. Finally, the use of eight strategies simplifies the repertoire of behaviors a clinician may try to instill in patients.
Limitations
Limitations exist within the current study. First, the data is cross-sectional which precludes causal associations among the outcomes. While this study was comprised of seven large datasets, each was collected at the same university, thus the sample of participants included was predominantly white, from a large southeastern university in the United States. Therefore, these findings should be generalized with caution. Similarly, the nature of data procurement utilized (i.e., self-report surveys at a single timepoint) is subject to both self-report and memory (i.e., retrospective recall) biases. Suggestions for future research in this area include the ability to analyze associations longitudinally, or via ecological momentary assessment, to better understand the temporal associations of alcohol PBS.
Conclusion
Overall, this study offers an innovative and intuitive way to interpret and target alcohol PBS, by using a two-factor model with items from the Protective Behavioral Strategies Scale-20 (PBSS-20) survey (Treloar et al., 2015). A comparison of four different factor structures resulted in an expedient, eight-item, method of assessing PBS use, with essentially no loss of information for the most clinically relevant outcome. This reduced (eight-item) two-factor model is the shortest assessment of alcohol PBS, yet accounts for more of the total variance in alcohol-related problems compared to other factor structures assessed in this large cumulative sample. By using this new model that encompasses Direct/Controlled Consumption and Indirect/Harm Reduction protective strategies, there is an opportunity to both analyze data more efficiently, as well as tailor interventions to fit unique patient presentations.
Footnotes
Author Contributions
All authors contributed significantly to the manuscript and have read and approved the final manuscript.
Declaration of Conflicting Interests
The authors declared no potential conflicts of interest with respect to the research, authorship, and/or publication of this article.
Funding
The authors disclosed receipt of the following financial support for the research, authorship, and/or publication of this article: This work was supported by the National Institute on Alcohol Abuse and Alcoholism, (grant number 1 R15 AA026420-01).
