
Abstract
Charging airline fees has recently been a controversial issue in terms of price fairness. Nonetheless, few researchers have studied price fairness in the tourism literature. This study aimed to examine the antecedents and consequences of tourists’ perceived price fairness of ancillary revenues. From an attributional perspective, a conceptual model was expected to complement shortcomings of the traditional dual entitlement principle. Data were collected from U.S. domestic airline passengers through an online survey (n = 524) and analyzed using structural equation modeling (SEM). Results suggest that price comparison and cognitive attribution influence price fairness, which, in turn, leads to emotional response and behavioral intentions. Results provide potentially important directions for the development of a theoretical framework of price fairness in a tourism context. It is further expected that the findings of this study provide managerial guidance for the utilization of marketing strategy for airline management.
Introduction
Despite being an important indicator influencing consumer decision-making and buying behavior, price fairness has just recently become one of the emerging agendas in pricing literature (Bolton, Warlop, and Alba 2003). Few studies on price fairness from a consumer perspective have been found in the tourism literature as well, while many tourism and hospitality studies have paid attention to pricing strategies from a managerial perspective (e.g., Chung 2000; Buckley 2007). Given the fact that tourism is one of the most price-nontransparent industries (Maxwell 2008; Kimes and Wirtz 2003a), it would seem that price fairness perception should be examined in relation to tourism (Perdue 2002).
Recently, new pricing schemes in the airline industry have been controversial. Ancillary fees or à la carte pricing, refer to charges for services that passengers used to be given for free. Airlines’ revenues from ancillary fees in 2008 were almost $10.25 billion, which was a 346% increase from 2006 in the United States, making ancillary fees one of the fastest-growing industry norms. Because of the decreasing number of domestic passengers (e.g., 679,185,450 in 2007 to 618,067,255 in 2009), airlines have used alternative pricing mechanisms (i.e., checked bag fees and on-board service fees add-on), and subsequently, the total ancillary fee revenues accounted for 6.9% of their total operating revenue for the major U.S. airlines in the quarter of 2009, which was only 4.1% a year earlier (U.S. Bureau of Transportation Statistics 2010). More recently, one airline announced new fees for even one carry-on bag, which led to mixed reactions from the major airlines (from supportive to skeptical). They argued that they chose to pass on the cost of some services (e.g., baggage handling) to only those passengers who were using the services, rather than spread it over the entire customer base (CNN 2010).
It is fairly understandable that price increases or extra fees would evoke negative psychological and/or behavioral reactions. However, in spite of this common wisdom, airlines have continued to charge extra fees. Some industry experts have claimed that there have been no severe hostile responses to the extra fees charged (Sorensen 2010). They have also pointed out that airfares or extra fees have not been on the major lists of passengers’ complaints, as passengers have been more concerned about flight delays/cancellations and baggage issues.
Justification for this study is thus twofold. First, despite its importance for consumer welfare, only a few price fairness studies have been conducted in the tourism literature (e.g., Kimes and Wirtz 2003a, 2003b). Pricing strategies (e.g., revenue management) in the tourism industry have raised fairness issues, and more recently, new pricing schemes in the airline industry have been controversial in terms of price fairness. Nonetheless, few tourism researchers have studied price fairness from a consumer perspective. Second, a traditional principle of price fairness (i.e., dual entitlement) has been criticized in the literature for its limitations (Vaidyanathan and Aggarwal 2003; Maxwell 2008), and some alternative or supplementary theoretical bases (e.g., attribution theory) have been suggested (Xia, Monroe, and Cox 2004). However, these alternatives have seldom been applied in the pricing literature. Thus, an understanding of the cognitive processes associated with price fairness has potentially far-reaching implications for tourist behavior research and theory.
The main purpose of this study is to examine the antecedents and consequences of consumers’ perceived price fairness of ancillary fees from an attributional perspective. That is, this research aims to determine a model that predicts the cognitive attributions influencing tourists’ price fairness and the effects of these perceptions on behavioral intentions. The conceptual model of this study is expected to complement shortcomings of the traditional dual entitlement principle (Kahneman, Knetsch, and Thaler 1986b). Although some researchers have attempted to develop conceptual frameworks for price fairness (Xia, Monroe, and Cox 2004; Diller 2008) and have reported empirical results (Campbell 1999; Kahneman, Knetsch, and Thaler 1986b; Vaidyanathan and Aggarwal 2003), the current study is different from prior research in some aspects; examining price fairness from an attribution perspective, investigating the dimensionality of causal attribution, and empirically testing a conceptual model of price fairness.
Literature Review
Price Fairness
Price fairness perception has been defined as “a consumer’s assessment and associated emotions of whether the difference (or lack of difference) between a seller’s price and the price of a comparative other party is reasonable, acceptable, or justifiable” (Xia, Monroe, and Cox 2004, p. 3). In other words, it is a price evaluation based on the comparison of the actual price to the reference price, including previously paid price, competitors’ price, and/or other consumers’ price.
Traditionally, dual entitlement has been used as a fundamental principle for explaining how people perceive price fairness (Kahneman, Knetsch, and Thaler 1986b; Kalapurakal, Dickson, and Urbany 1991; Kahneman, Knetsch, and Thaler 1986a; Campbell 1999). Kahneman, Knetsch, and Thaler (1986b) postulated that a dual entitlement (DE) principle exists; that is, a consumer is entitled to a reasonable price based on reference transaction, and a company is also entitled to a reasonable profit based on reference profit. According to this principle, a company is not allowed to increase profits if it violates the entitlement of a consumer, whereas, it is acceptable for a company to protect profits if the reference profits are threatened. Thus, Kahneman, Knetsch, and Thaler (1986a, 1986b) argued that while people tend to accept price increases when costs increase, they would not accept price increases if costs have not increased.
Despite widespread usage of the DE principle in the pricing literature, Vaidyanathan and Aggarwal (2003) suggested that although a DE theory argues that cost-justified price increases should be perceived as fair, this is not necessarily the case in real life. In other words, even if price increases are cost-justified, individuals could perceive unfairness depending on how they understand the causes of the price changes. For example, when the locus of causality is internal to the company, price increases can be perceived as less fair. Likewise, when price increases are believed to be under the control of the company, the increases can be perceived as less fair (Vaidyanathan and Aggarwal 2003). Maxwell (2008) also demonstrated that customers no longer agree that increased costs of suppliers are uncontrollable but, instead, they believe that cost control is a producer’s responsibility in the current economic environment.
Some researchers (e.g., Choi and Mattila 2004; Oh 2003) have recently begun to examine price fairness perceptions in the hospitality and tourism literature, following the argument that pricing practices such as revenue management are more likely to raise fairness issues (Maxwell 2008; Perdue 2002; Kimes and Wirtz 2003b). For instance, Kimes and her colleagues have applied the concept in a variety of tourism contexts including hotels, cruise lines, and golf courses. In the context of revenue management in the golf industry, Kimes and Wirtz (2003b) found that golfers can feel mixed price fairness perceptions toward the differential pricing, that is, they perceive some practices (e.g., time-of-day pricing, two-for-one coupon program, tee time interval pricing, and reservation/no-show fee) as fair, whereas they feel varying price levels and time-of-booking pricing as unfair. It has also been found that hotel guests’ fairness perceptions are significantly associated with variable pricing (Choi and Mattila 2004).
Attributional Approach to Price Fairness
It has been argued that perceptions of justice/fairness are fundamentally based on attribution of cause and responsibility (Cohen 1982). McCarville, Reiling, and White (1996) suggested that attribution theory is applicable for understanding individuals’ unfairness perceptions about entrance fees for a public recreation service. They further argued that Weiner’s (1980) attribution theory best fits settings where fees are not expected at all or where justifications for new fees are not made explicit. This is because users tend to find reasons for the new fees, and if they are not given any justification, it can lead to negative emotional responses and unfavorable behaviors. More recently, Xia, Monroe, and Cox (2004) and Maxwell (2008) argued that attribution theory should be considered as a theoretical foundation in the price fairness literature.
Weiner (1980) proposed the Cognitive attribution–Emotion–Action Model (CEAM). This model explains that individuals’ cognitive attributions influence their behavior through emotional responses. More specifically, when people encounter certain kinds of events, they infer the cause(s) of the event, and then, depending on how the causes are attributed, they have different kinds of emotional responses that lead to how they act toward the events (Weiner 1980). He argued that observed actions are attributed on the basis of three dimensions: locus of causality, controllability, and temporal stability. Locus of causality pertains to whether the cause of an action is internal or external to the actor. Vaidyanathan and Aggarwal (2003) stated that “the locus is determined based on who is responsible for a given action” (p. 454). Controllability refers to what extent the cause is subject to personal influence. Specifically, if an action was unavoidable, it is more likely to be perceived as uncontrollable. Controllability is therefore determined by examining “if the actor could have done otherwise” (Vaidyanathan and Aggarwal 2003, p. 454). Finally, stability is related to whether the cause is perceived as a temporary or permanent phenomenon.
Based on Weiner’s conceptualization, the following hypotheses were proposed:
Hypothesis 1: Locus of causality, controllability, and temporal stability are explained by cognitive attribution.
Hypothesis 1a: Locus of causality will be positively associated with price fairness.
Hypothesis 1b: Controllability will be positively associated with price fairness.
Hypothesis 1c: Temporal stability will be positively associated with price fairness.
That is, if one believes that a company charges new fees because of internal factors controllable by the company and the new fees would be stable over time, the new price will be perceived as unfair. In this study, these three concepts (locus of causality, controllability, and temporal stability) are measured as continuous variables using bipolar scales, not as dichotomous variables. This was done to determine the directionality and strength of the relationships between the exogenous variables and an endogenous variable.
In addition, there are mixed findings about the fairness perception in relation to cognitive attribution and emotional response. While some researchers have proposed that price (un)fairness results in negative emotions (Xia, Monroe, and Cox 2004; Oliver and Swan 1989), some have argued that emotional response influences price (un)fairness (Campbell 2007). Accordingly, two main competing models were proposed to test the related hypothesis.
The first model, Cognitive Attribution–Emotional Response–Price Fairness (model 1), was proposed. Campbell (2007) used a dual process of affective and cognitive (inferred motive) modes in order to identify significant antecedents of perceived price (un)fairness. She subsequently demonstrated that emotional response (affect) is one of the critical antecedents of price (un)fairness perceptions along with cognitive attribution (i.e., inferred motives). The direct path from attribution to emotions has also been empirically tested by some researchers (e.g., Folkes, Koletsky, and Graham 1987; Reisenzein 1986).
In the second model, price (un)fairness was hypothesized to influence emotional response: Cognitive Attribution–Price Fairness–Emotional Response (model 2). Xia, Monroe, and Cox (2004) conceptually suggested that price (un)fairness leads to negative emotional response. They stated that discrete emotions, which are correlated with dissatisfaction (Folkes, Koletsky, and Graham 1987), vary in intensity and type, depending on the type of fairness. For instance, while an advantage inequality is related to feelings of uneasiness or guilt, a disadvantaged inequality may lead to disappointment, anger, or outrage (Austin, McGinn, and Susmilch 1980). The main difference in the two competing models is the location of emotions in relation to cognitive attribution and fairness perception. Thus, the comparison of the two models could be helpful in articulating the relationships between cognitive attribution, emotions, and price fairness. As the current study results were anticipated to be consistent with previous empirical findings, the following hypothesis was proposed.
Hypothesis 2: Model 1 will have better model fit than model 2.
Price Comparison and Price Fairness
Research suggests that individuals make moral judgments (i.e., perceived fairness) by making comparisons (Adams 1965). McCarville, Reiling, and White (1996) argued that reference price influences perceived price fairness. That is, individuals tend to expect a certain price on the basis of past payment experience (internal reference price) or advertising (external reference price), and they are more likely to accept a given price if it is consistent with previous prices. Thus, people are not willing to tolerate a price if it violates the existing pricing structure (e.g., charging first-time fees for public leisure services that were previously provided for free). Subsequently, the hypotheses about the relationship between price comparisons and fairness perception were supported in their study, which means that people who notice a large difference between reference price and a given price tend to perceive unfairness (McCarville, Reiling, and White 1996).
Accordingly, it was argued that a price comparison paradigm plays an important role in perceptions of price fairness. Xia, Monroe, and Cox (2004) also clarified price fairness by proposing that “all price evaluations, including fairness assessments, are comparative” (p. 1). The following hypothesis was therefore proposed:
Hypothesis 3: The larger the difference between reference price and a given price, the more one will be likely to perceive the price as unfair.
Behavioral Intentions
Folkes, Koletsky, and Graham (1987) found that the reason(s) a passenger attributes a flight delay to (e.g., due to bad weather or due to poor management) determines the passenger’s willingness to purchase the flight again. Campbell (1999) found when individuals infer negative motives for a price increase, they are more likely to perceive the price increase to be unfair. Martin-Consuegra, Molina, and Esteban (2007) argued that the more fair passengers felt airfares were, the more likely they would be loyal to the airlines. Martin, Ponder, and Lueg (2009) also found that justified reasons for price increases could actually increase loyalty.
In addition, perceived price fairness has been considered as an important antecedent of willingness to pay (WTP) (Schröder and Mieg 2008; Ajzen, Rosenthal, and Brown 2000; Mitchell and Carson 1989). McCarville, Reiling, and White (1996) argued that perceptions of unfairness of user fees can evoke hostility and displacement for public recreation services. Ajzen, Rosenthal, and Brown (2000) also found that the perceived fairness of requested payments to public goods or services is positively related to WTP. More recently, Schröder and Mieg (2008) argued that perceived fairness significantly predicts WTP. That is, when individuals are asked what amount of money they would be willing to pay for a public good, their response may depend on their perception of justice or fairness (i.e., should I pay for it, or should someone else pay for it more than what I ought to pay?) (Chung, Kyle, Petrick, and Absher, 2011).
With reference to the relationship between price fairness and unfavorable behavioral intentions, Xia, Monroe, and Cox (2004) proposed that perceived price (un)fairness can lead to actions including the following: no action, self-protection, and revenge. When buyers feel perceived inequality of prices, they cannot act, or act to protect themselves financially and/or psychologically. Moreover, they could seek revenge by trying to get back at the company(s) (Bougie, Pieters, and Zeelenberg 2003). Therefore, Xia, Monroe, and Cox (2004) conceptualized that depending on the extent one feels price unfairness and the degree of the negative emotions, two types of unfavorable behavioral intentions (i.e., self-protection and revenge) could be observed. They argued that consumers complain, spread negative word of mouth, and switch to other competitors in order to protect themselves financially and/or psychologically. They termed this self-protection behavior.
However, just complaining or switching to competitors may not be sufficient to mitigate consumers’ dissatisfaction or perceived inequity (Xia, Monroe, and Cox 2004). Especially, when a consumer feels a distinct emotion (e.g., anger and outrage) rather than general feelings (e.g., positive or negative sentiment), he or she is more likely to seek revenge for a company’s wrongdoing (Bougie, Pieters, and Zeelenberg 2003). This revenge behavior includes spreading negative word of mouth, taking legal actions, and reporting problems to the media and/or regulatory agencies (Xia, Monroe, and Cox 2004). Negative word of mouth for revenge is different than for self-protection in terms of its purpose: while people with dissatisfaction tend to spread negative words to comfort themselves psychologically, they purposely give their social network negative word of mouth to damage the company when they experience severe emotions such as anger or fury (Xia, Monroe, and Cox 2004).
The following hypotheses were thus proposed:
Hypothesis 4: Price fairness perception influences behavioral intentions.
Hypothesis 4a: Price fairness perception positively influences behavioral loyalty.
Hypothesis 4b: Price fairness perception positively influences willingness to pay more.
Hypothesis 4c: Price fairness perception negatively influences complaining behavior.
Hypothesis 4d: Price fairness perception negatively influences revenge behavior.
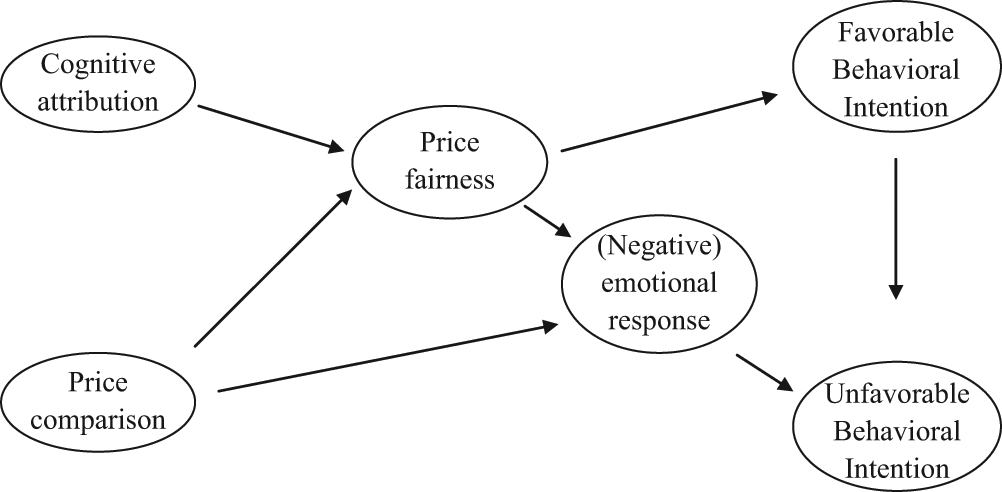
Consequently, the following model was proposed (Figure 1). Price fairness was applied to the attribution model (cognitive attribution–emotional responses–behavioral intentions) in a behavioral price context.
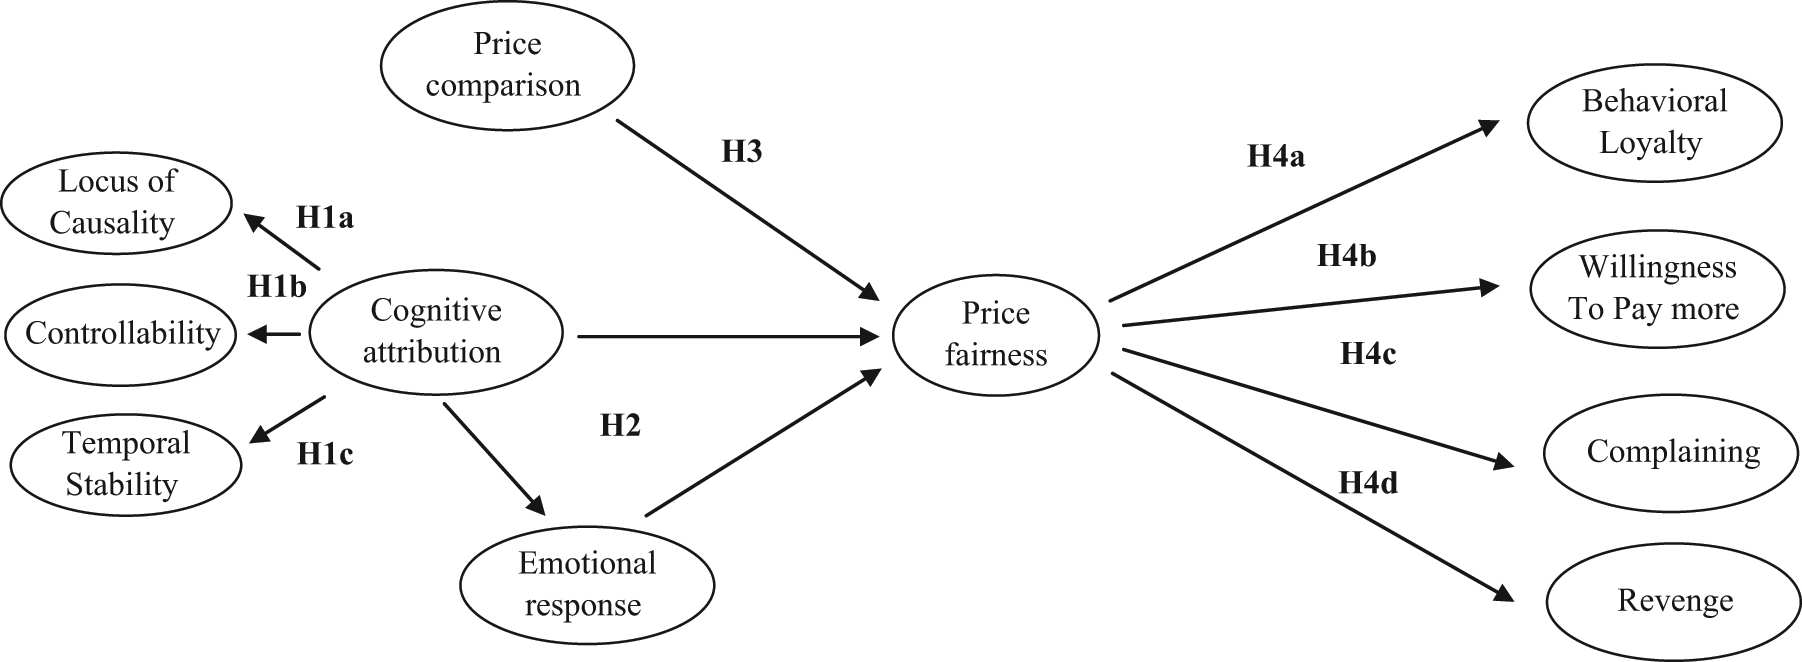
The hypothesized model
Method
The target population for the current study was leisure tourists who had taken domestic flights in the United States. Because it was not possible to obtain a passenger list, a panel list provided by an online survey institution was used as an alternative sampling frame. Specifically, a survey instrument was e-mailed to panelists who voluntarily registered to participate in online surveys. Although several researchers have expressed concerns about the potential for sampling bias (Dillman, Smyth, and Christian 2009), recent empirical studies have revealed only minor differences between the results of online panel surveys and conventional survey methods (e.g., telephone and face-to-face). In addition, online panels have some advantages, including speed, costs, large sampling size, and selective samples by sociodemographic attributes (Hung and Law 2011). Technical mechanisms in this method can also prevent respondents from giving missing values. The economic benefits and convenience therefore make this method increasingly common for marketing research (Dillman, Smyth, and Christian 2009; Duffy, Smith, Terhanian, and Bremer, 2005).
In particular, this study made efforts to address coverage error issues: to fill the gaps between online panels and the general population. The invitations to the survey (20,700 e-mail invitations) were sent to mirror the U.S. Census population parameters of age, gender, and household income (MarketTools 2010). Thus, arguably, the outbound invitations were weighted toward the U.S. Census population in terms of age, gender, and household income. In addition to these three profiles, only respondents who were qualified for this study (i.e., had experiences on domestic leisure flights in the past 12 months) were invited to participate in the survey. After the survey instrument was updated from the pilot survey (n = 107) (e.g., modified items for causal attribution, rephrased wording to fit the context of flights trip), the main survey was conducted from April 15 to April 22, 2010.
The measurement items for each variable were adapted from previous research, and were somewhat modified to best fit the study context. Regarding price comparison, four items were drawn from previous studies (Xia, Monroe, and Cox 2004; Bolton, Warlop, and Alba 2003). The items for cognitive attribution were adapted from the attribution theory literature: the Causal Dimension Scale (CDS I and II; Russell 1982; McAuley, Duncan, and Russell 1992) and the Attributional Style Questionnaire (ASQ; Peterson et al. 1982). Emotional response was measured with multiple items that have been frequently used in related contexts (Folkes, Koletsky, and Graham 1987), and price fairness with valid and reliable scales from the marketing and tourism literatures (Petrick 2002; Martin, Ponder, and Lueg 2009). Some items were also adapted to measure behavioral intentions (Grewal, Monroe, and Krishnan 1998; Lee, Petrick, and Crompton 2007; Herrmann et al. 2007; Campbell 1999).
In line with the SEM (structural equation modeling) sequential data analysis (Diamantopoulos and Siguaw 2000), the hypothesized model was tested in order to achieve four specific objectives of the study: (1) to determine which dimensions of attribution are best at predicting price fairness, (2) to examine the role of emotional response in relation to price fairness, (3) to examine the role of price comparison as a predictor of price fairness, and (4) to determine which dimensions of price fairness are best at predicting behavioral intentions.
Results
Descriptive Findings
Among a total of 1,358 responses, those who had not taken any domestic flights in the past 12 months for leisure travel and those who failed to complete the survey were excluded from data analysis. Subsequently, 524 valid responses were used in this study. The sample was slightly dominated by female respondents (58.0%). The average age of the respondents was 47.8. More than one-third of the respondents (36%) were 55 and older, while only 26% of the respondents were aged 18-34. In addition, almost one-third of respondents (29.4%) fell into the annual household income category of $100,000 and more, while only 7.1% earned less than $25,000 annually. The median household income was $50,000 to $74,999. It was also found that while a majority of respondents (57.1%) currently have some college or had a college degree, only 11.3% completed high school or less. In terms of ethnicity, the vast majority of respondents (83.0%) were Caucasian. The weighted sample invitation process showed that the respondents have a little bit higher level of household income than the general online panel, whereas at a glance, there are no significant differences in gender and age between the two groups.
Normality
Since SEM with maximum likelihood (ML) estimation assumes multivariate normality and continuously measured variables, it was necessary to examine whether or not the data set was normal. West, Finch, and Curran (1995) argued that nonnormality in SEM may yield an inflation of the χ2 value, underestimation of fit indices (e.g., Tucker-Lewis index [TLI], comparative fit index [CFI]), and underestimation of standard errors. Byrne (2009) also demonstrated that ML estimation using nonnormal data leads to larger chi-square values, lower CFIs, higher root mean square error of approximation (RMSEA), and lower standard errors than robust ML estimation using Satorra-Bentler adjusted chi-square value. In this study, two multivariate normality tests (Mahalanobis distances and Mardia’s statistic) showed that some multivariate outliers existed in the data set (Tabachnick and Fidell 2007; Pallant 2005; Mardia 1970).
This study therefore used the bootstrapping to deal with multivariate nonnormal data, which is arguably the most often used method for overcoming nonnormal data in SEM. Bootstrapping is a statistical resampling method by which the original sample is considered to represent the population (Kline 2005; Byrne 2009). Thus, it allows a researcher to measure parameter estimates with a greater degree of accuracy, particularly, for moderately large samples indicating multivariate nonnormality (Byrne 2009; West, Finch, and Curran 1995).
Testing Dimensionality of Attribution
A preliminary data analysis and the pilot study warned that there may be some problems in the dimension of temporal stability (i.e., Cronbach’s alpha = .459). The composite reliability of the temporal stability also turned out to be very poor (.02). Therefore, temporal stability was not included in this study. In addition, a reduction of cognitive attribution dimensions could be accepted because (1) there are inconsistent conceptualizations and empirical findings about the dimensionality of cognitive attribution (e.g., one, two, and three dimensions) (Bitner 1990; Campbell 1999; Vaidyanathan and Aggarwal 2003; Weiner 1980) and (2) this study is exploratory in applying attribution theory in a price fairness setting.
Accordingly, alternative models were proposed. The first proposed model (model ATT-1) was a two first-order model with two dimensions locus of causality and controllability. This model represented a good fit to the data, χ2(df) = 31.018(8), p < .001; RMSEA = .074; CFI = .990; nonnormed fit index (NNFI) = .981. The other model (model ATT-2)was one first-order model with all six items related to causality and controllability. A review of the modification indices in confirmatory factor analysis (CFA) suggested that one of the items regarding controllability (con3) should be excluded because of insignificant factor loadings, and that some error terms (i.e., err4 ↔ er5 and err 1↔ err3) should be correlated. In the end, the final version of the second modification model also represented a good fit to the data, χ2(df) = 13.526(3), p = .004; RMSEA = .082; CFI = .994; NNFI = .982.
However, the first model (ATT-1) may raise a discriminant validity issue because of the high level of correlation (.749) between the locus of causality and controllability. The CFA in AMOS also confirmed high correlation between the two dimensions (.844). Furthermore, exploratory factor analysis (EFA) using oblique rotation methods demonstrated that cognitive attribution had only one dimension collapsing causality and controllability (Kaiser-Meyer-Olkin [KMO] measure = .878; Bartlett’s test = 2225.668, p < .001). As reviewed earlier, some researchers have proposed one dimension of cognitive attribution (positive vs. negative inferred motive) and have found some empirical evidence supporting this (e.g., Campbell 2007). The model ATT-2 (i.e., one dimension of cognitive attribution) was therefore chosen for data analysis in this study. In summary, hypothesis 1 was not supported, and inevitably the subhypotheses (hypotheses 1a, 1b, and 1c) could not be tested.
Measurement Model
To test the following hypotheses regarding the antecedents and consequences of price fairness, a two-step approach to SEM was used to examine the full proposed model in this study (Anderson and Gerbing 1988); that is, a measurement model encompassing all latent variables was first tested, and then the structural model was analyzed. In this study, 8 latent variables and 32 observed variables were included in the initial measurement model. The subsequent goodness of model fit suggested that the model should be respecified according to the modification indices (Byrne 2009; Kline 2005).
However, before modification indices were examined, the results of the preliminary analyses led to a further examination of the relationships between REV (Revenge) and COM (Complaining) variables. Some factor loadings for the REV and COM variables were below .50, suggesting possible correlations between the measurement errors of COM and REV. Also, a relatively high (.758) correlation was found between REV and COM.
EFA using principal axis factoring method with an oblique rotation showed that COM included five items (rev5, rev4, com2, com3, and com1), and REV included three items (rev3, rev2, and rev1). Although Cronbach’s alpha indicated acceptable levels of reliability for the two latent variables (COM = .863 and REV = .781, respectively), an item of com1 indicated a lower level of factor loading (.43) than a criterion (≥.50). Thus, the exclusion of com1 and movement of two items (rev4 and rev5) from REV to COM were recommended. The relocation of the two items was also justified by examination of the scales. The rev 4, “I will report (reported) the airfares and/or extra fees from my most recent trip to the media,” and rev5, “I will report (reported) the airfares and/or extra fees from my most recent trip to legal and regulatory agencies,” items were related to complaining about the unfair experiences to external agencies or the media. Although Xia, Monroe, and Cox (2004) argued that reports to the media or legal agencies belong to revenge behavior for the purpose of damaging sellers, it could be argued that this reporting behavior is perceived as more closely related to complaining behavior than deliberate revenge behavior.
In addition to the removal of the item and relocation of the two items, measurement errors (i.e., err33 ↔ err34, err20 ↔ err21, and err23 ↔ err24) were allowed to be correlated. These measurement error covariances might result from systematic measurement error in item responses, which derive from characteristics specific either to the items or to the respondents (e.g., two or more questions, although worded differently, essentially ask the same question in a questionnaire) (Aish and Joreskog 1990). Consequently, good model fit indices of the modified measurement model were obtained, χ2(df) = 976.217(429), p < .001; RMSEA = .049; TLI (NNFI) = .951; CFI = .957.
Reliability and Validity
Composite reliability indicated that all factors had acceptable reliability levels (≥.60) except the cognitive attribution (.45) (Table 1). However, although the composite reliability of this variable was marginally low, the Cronbach’s alpha for this was .917. The item–total correlations and interitem correlations also ranged within .75 and .83. Thus, it was argued that this variable moderately showed internal consistency.
Reliability and Factor Loadings of Measurement Model
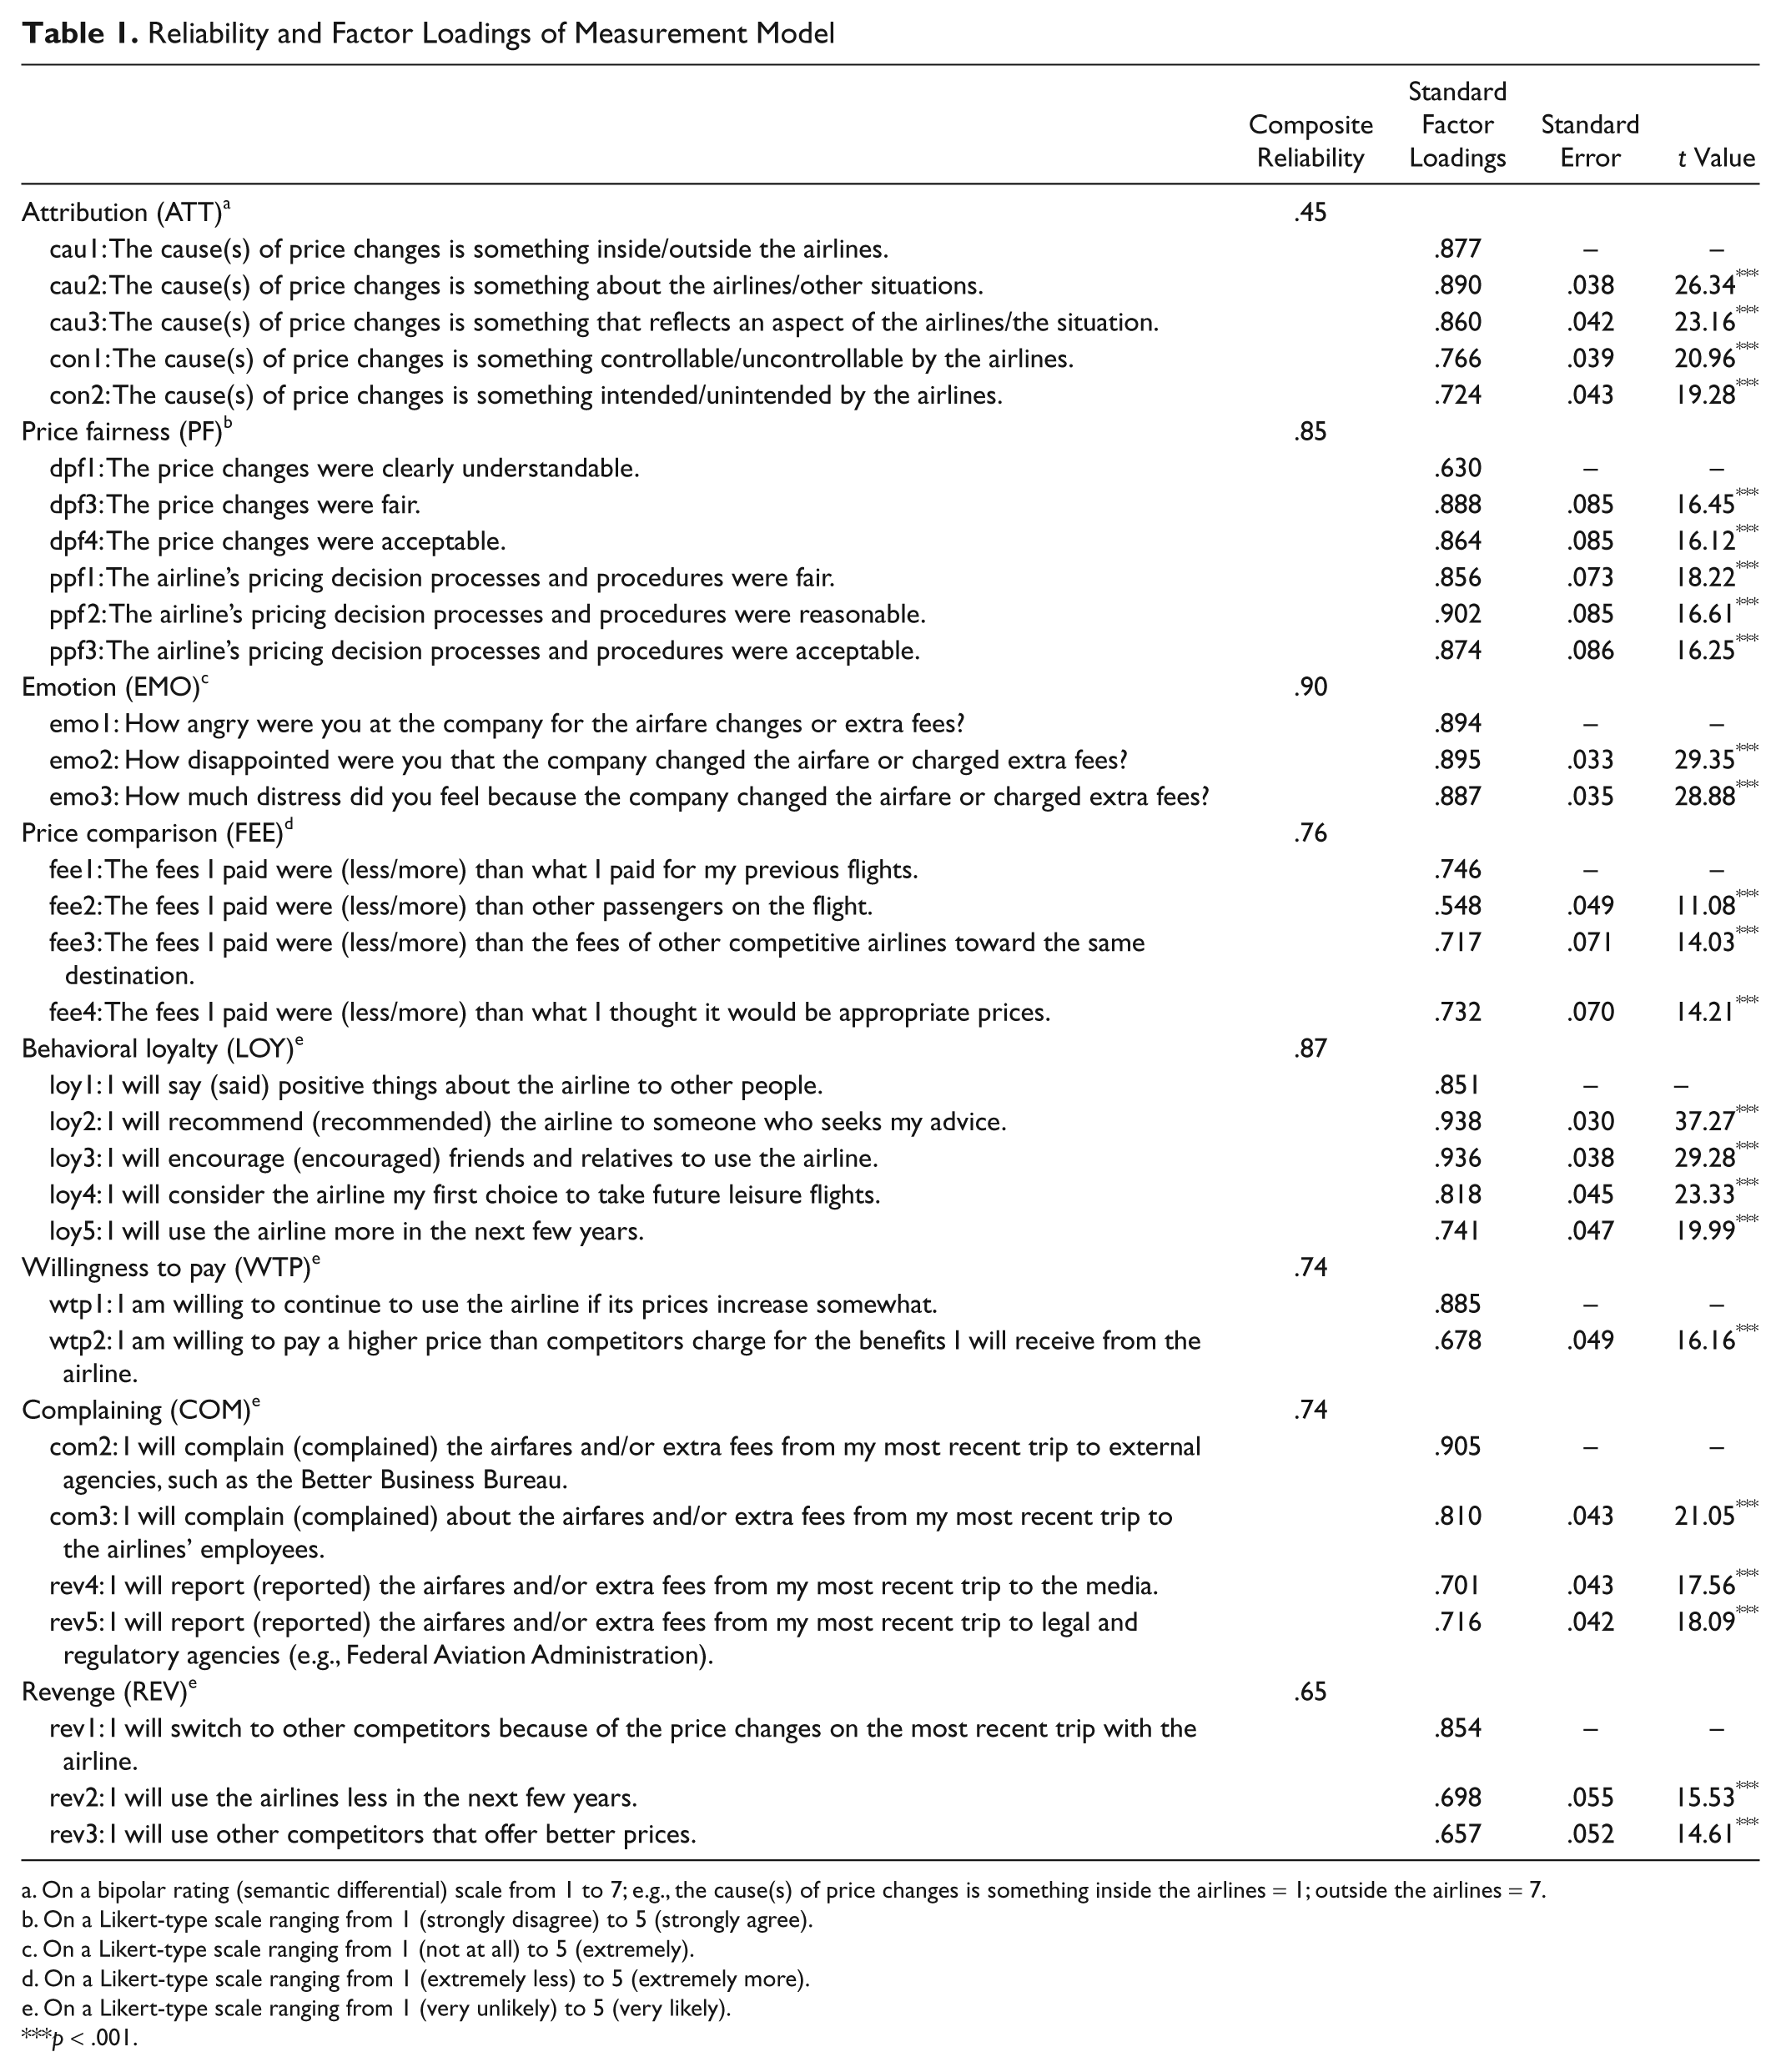
On a bipolar rating (semantic differential) scale from 1 to 7; e.g., the cause(s) of price changes is something inside the airlines = 1; outside the airlines = 7.
On a Likert-type scale ranging from 1 (strongly disagree) to 5 (strongly agree).
On a Likert-type scale ranging from 1 (not at all) to 5 (extremely).
On a Likert-type scale ranging from 1 (extremely less) to 5 (extremely more).
On a Likert-type scale ranging from 1 (very unlikely) to 5 (very likely).
p < .001.
In addition to reliability, convergent and discriminant validity were assessed. It shows that all average variances extracted (AVEs) are greater than .45, suggesting that the model has convergent validity (Table 2).
Validity of Measurement Model
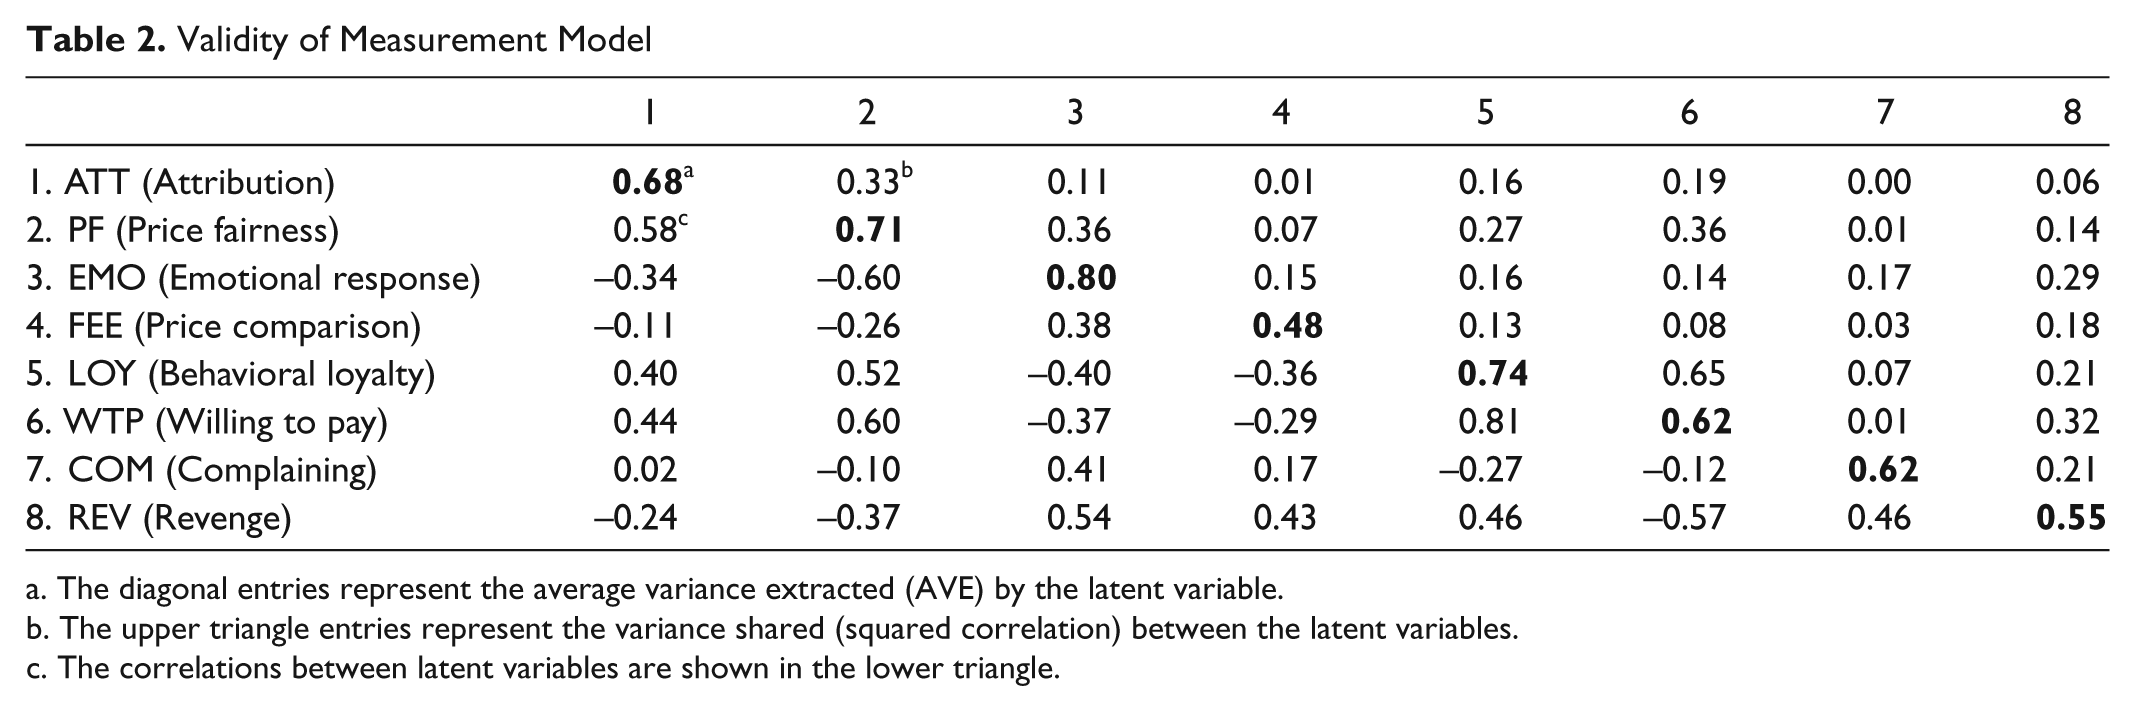
The diagonal entries represent the average variance extracted (AVE) by the latent variable.
The upper triangle entries represent the variance shared (squared correlation) between the latent variables.
The correlations between latent variables are shown in the lower triangle.
To ensure discriminant validity, the correlations between variables were compared to the squared correlations between the two variables (Hatcher 1994). All AVEs in this model were greater than the corresponding squared correlations except the variable of WTP. AVE of WTP (.62) is slightly lower than the squared correlation between WTP and LOY (.65). The high correlation between WTP and LOY (.81) is understandable as the two constructs seem conceptually similar, though the literature consistently has suggested they are unique constructs (Zeithaml, Berry, and Parasuraman 1996; Baker and Crompton 2000; Lee, Petrick, and Crompton 2007). Other than this almost expected violation, discriminant validity was satisfactory in this model.
Structural Model
Two structural models were specified as the nature of hypothesis 2 was to compare two models. A review of model fit indices demonstrated that although the two models were within the recommended range of acceptability, model 2 represented a better fit to the data: χ2(df) = 1424.917(445), p < .001; RMSEA = .065; TLI (NNFI) = .915; CFI = .924. Since model 2 presented better model fit indices, hypothesis 2 was not supported.
Accordingly, model 2 was used for testing the subsequent hypotheses. As the sequential process of modification shows in Table 3, three paths showing relationships between a pair of latent variables in the initial model were excluded: from EMO to WTP; from PF to REV; and from PF to COM. The paths showed statistically insignificant (p > .05) regression coefficients: β = –.005 (p = .931), β = –.099 (p = .084), and β = –.089 (p = .059), respectively.
Modification of Structural Model 2 (C-PF-E Model)
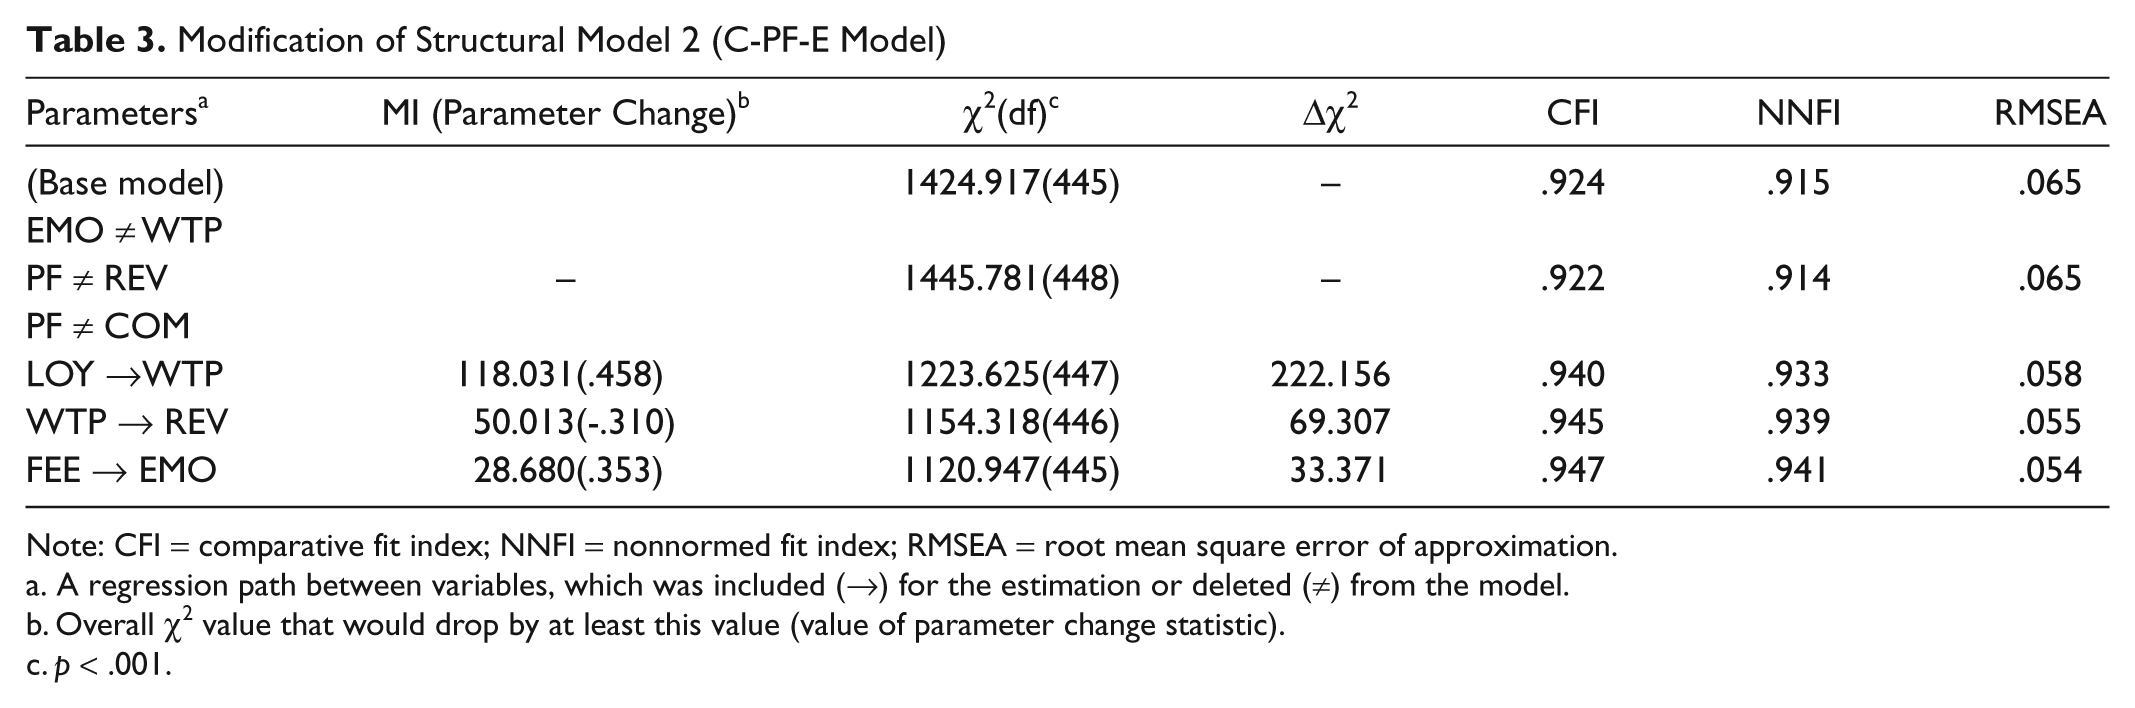
Note: CFI = comparative fit index; NNFI = nonnormed fit index; RMSEA = root mean square error of approximation.
A regression path between variables, which was included (→) for the estimation or deleted (≠) from the model.
Overall χ2 value that would drop by at least this value (value of parameter change statistic).
p < .001.
Although the paths were specified based on the theoretical reasoning, the deletion of the paths was still justifiable because the variables were indirectly connected to the corresponding variables through mediators. That is, emotional response influenced willingness to pay more through behavioral loyalty, price fairness influenced revenge behavior and complaining through emotional response. These results suggest full mediating relationships between each pair of variables.
In the end, a revised model 2 was specified to represent a good fit to the data: CFI = .95; NNFI = .94; RMSEA = .05. Note that the chi-square (χ2 = 1120.947, df = 445) was not considered a critical indicator of a model fit as it tends to be very sensitive to large samples (Kline 2005; Hair et al. 2006). The path coefficients were all statistically significant (Table 4). Price comparison negatively influenced price fairness (β = –.204, p < .001), and price fairness positively influenced behavioral loyalty and willingness to pay more (β = .431, p < .001; β = .225, p < .001, respectively). These results supported hypotheses 3, 4a, and 4b.
Structural Paths of Structural Model 2
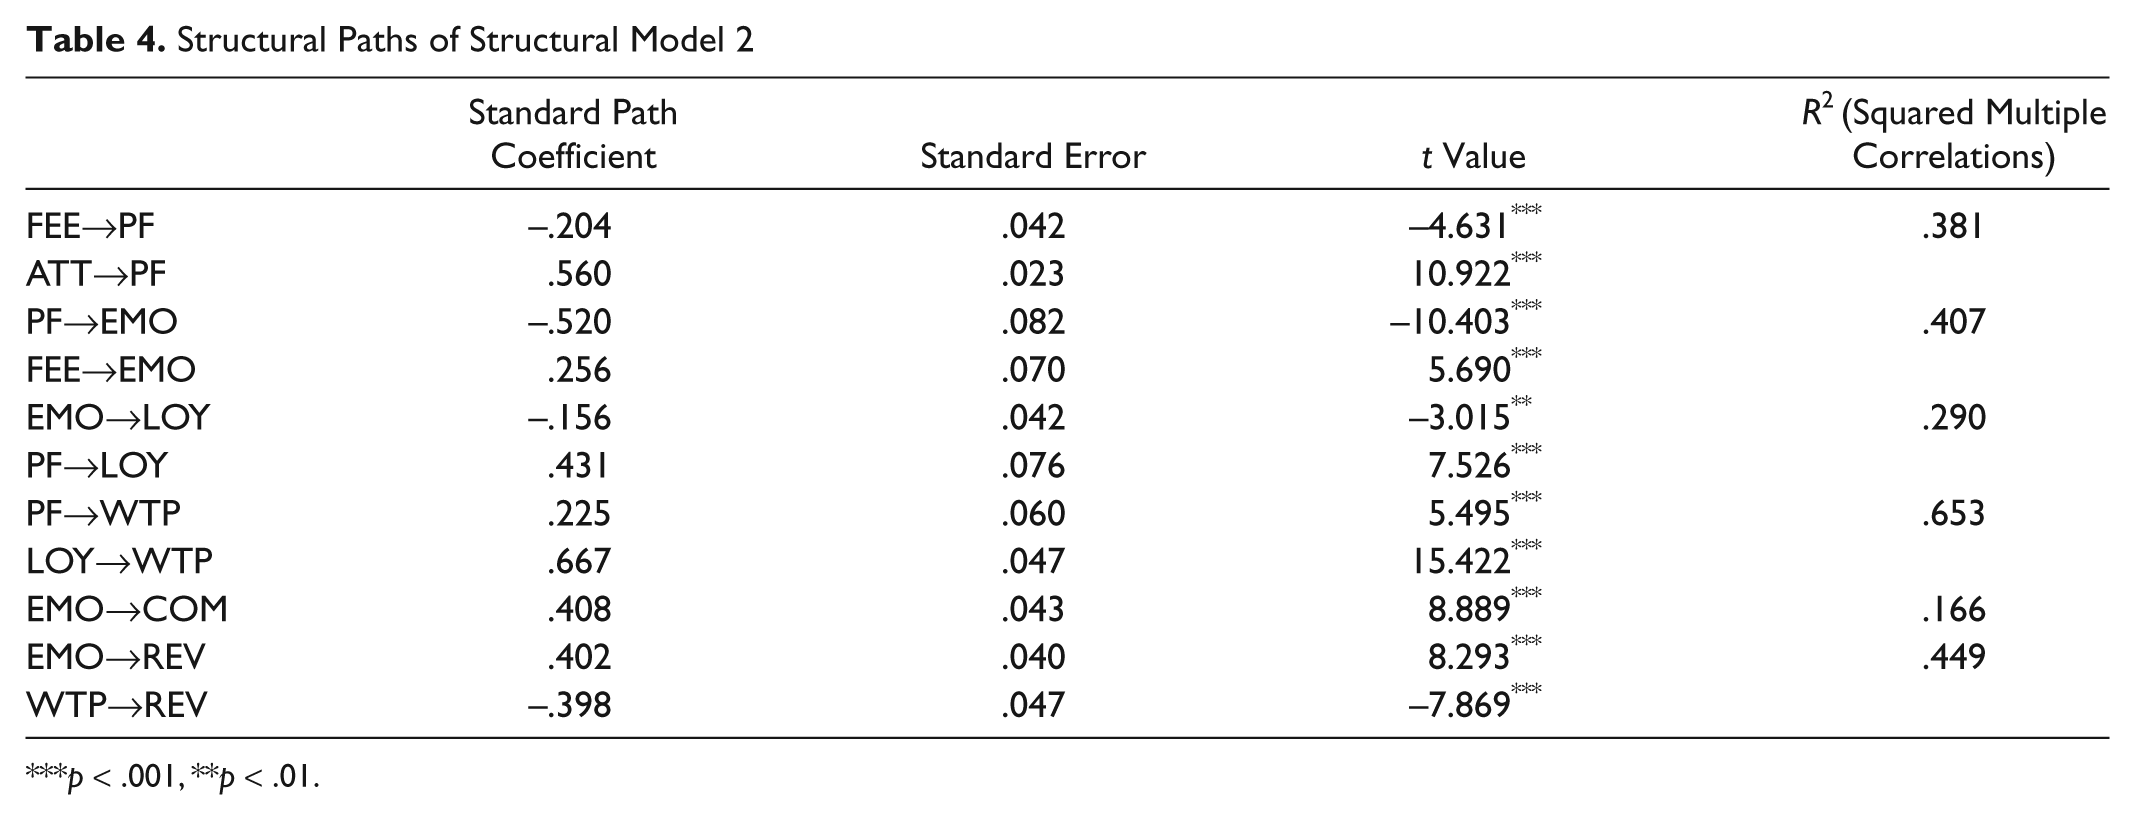
p < .001, **p < .01.
On the other hand, there was no evidence supporting hypotheses 4c and 4d because the direct paths between price fairness and complaining/revenge behavior were deleted because of being statistically insignificant. Thus, hypotheses 4c and 4d were not supported. Alternatively, an examination of the relationships via a mediator (emotional response) demonstrated that there was negative relationship between price fairness and the two dependent variables. Price fairness was found to negatively influence emotional response (β = –.520, p < .001), which in turn positively influenced revenge behavior (β = .402, p < .001) and complaining behavior (β = .408, p < .001), respectively. While the hypotheses cannot be supported, it is acknowledged that the variables are related, but not directly.
Discussion and Conclusions
This study sought to gain an understanding of the relationships between antecedents and consequences of tourists’ perceived price fairness. Overall, the proposed model fit the data well from a global perspective; nevertheless, some hypotheses were not supported and a revised model was proposed. The hypothesis testing demonstrated that while price comparison negatively influenced price fairness, cognitive attribution positively influenced price fairness. If individuals evaluated the price (e.g., extra fees) to be much higher than expected, they perceived the price to be unfair. Also, it was found that passengers perceived airlines’ extra fees to be unacceptable and unjustifiable and were more likely to be angry and feel distress when they thought the fees were higher than appropriate prices. However, if people inferred that price changes were caused by something uncontrollable and situational factors, they were more likely to judge the price increase fair than unfair. In other words, fairness or unfairness judgments rely on buyers’ subjective perceptions based on cognitive reasoning.
Price fairness was further found to influence behavioral intentions. People who felt that the fees were fair were more likely to spread positive word of mouth and recommend the airline to their social networks. In addition, they were willing to continue to use the airline if their prices somewhat increased. Conversely, if individuals perceived the extra fees as unfair, they were more likely to complain about the fees to the airlines and/or external agencies and switch to other competitors. More importantly, unfairness perceptions were found to evoke negative emotional responses (i.e., angry, disappointed, distress), which resulted in revenge and/or complaining behavior.
Yet some hypotheses were not supported. Cognitive attribution was found to be a unidimensional concept encompassing locus of causality and controllability, indicating that Weiner’s attribution dimensions were not appropriate in the current study. Partial dimensions of attribution have been found in the literature. For instance, Campbell (1999) used the concept of inferred motives to examine causal attributions in a price fairness context. Based on the literature on fairness and attribution theory, consumers’ inferences about the firm’s motive for the price change and inferred relative profit were identified as factors influencing perceptions of price fairness (Campbell 1999). Vaidyanathan and Aggarwal (2003) also argued that temporal stability needed to be excluded because it is methodologically not plausible. Bitner (1990) adopted only causality and stability to examine the effect of attribution on service satisfaction, and Folkes, Koletsky, and Graham (1987) operationalized two dimensions of controllability and stability when examining the relationship between attribution, repurchase, and complaining behavior.
In addition, the dimensionality of attribution has frequently raised concerns in the literature (McAuley, Duncan, and Russell 1992). For instance, the low internal consistency of controllability and its possibility to correlate highly with locus of causality have been reported (Russell, McAuley, and Tarico 1987). Tsiros, Mittal, and Ross (2004) also suggested that both locus of causality and controllability be incorporated as a construct of responsibility. They further argued that the two dimensions measure the same concept (Tsiros, Mittal, and Ross 2004). Some evidence of implausibility of two separate attribution dimensions (i.e., causality and controllability are highly correlated to each other; r = .94) were also found in previous research (Folkes 1984).
Furthermore, the inclusion of the temporal stability items also impaired the model fit indices. Some respondents in the pilot study also raised issues regarding wording in some items of cognitive attribution. Overall, this finding could contribute to a better conceptualization in terms of parsimony because a higher-order model, which was initially proposed, may yield difficulty in interpretation because it is too abstract from a measurement perspective (Hair et al. 2006).
In addition, emotional responses to price changes were found to be influenced by price fairness perceptions. Several previous studies have found that unfairness or injustice tends to evoke negative emotions (Weiss, Suckow, and Cropanzano 1999; Schoefer and Ennew 2005). Xia, Monroe, and Cox (2004) also proposed a conceptual model of price fairness, in which price fairness perception results in negative emotional response, which in turn leads to behavioral intentions. More recently, Rio-Lanza, Vazquez-Casielles, and Diaz-Martin (2009) revealed that perceived justice has a negative relationship with negative emotions, that is, if one perceives injustice about the service provided, he or she feels more negative emotions with the service. Despite that they only confirmed a significant relationship between procedural justice and negative emotions (yet, nonsignificant relationships with distributive and interactional justice), their results support the significant relationship between justice and negative emotional response found in the current study (Rio-Lanza, Vazquez-Casielles, and Diaz-Martin 2009). In this study, the mediating role of (negative) emotional response in relation to price fairness and unfavorable behavioral intentions was also confirmed using Baron and Kenny’s mediation analysis (Baron and Kenny 1986).
Theoretical and Practical Implications
One of the major theoretical implications from this study is the development of a price fairness model using attribution theory (Figure 2). The empirical results of this study also supported some propositions in previous conceptual papers. For instance, Xia, Monroe, and Cox (2004) offered some propositions in relation to price fairness: price comparison has an effect on price unfairness judgments; price unfairness is associated with negative emotions; and when buyers perceive a price as less fair, they are more likely to cope with the negative emotion by seeking revenge.
The price fairness model
More importantly, it is expected that this study introduced price fairness research into the tourism literature. Tourists’ price perceptions have been usually studied in terms of a perceived price - perceived quality - perceived value framework (e.g., Petrick 2004). Indeed, the framework has been successfully applied in the literature to understand how price perceptions influence satisfaction and behavioral intentions. The study of price fairness is believed to be a way to elaborate on the concept of perceived price because fairness has consistently been found to be related to perceived price. An examination of price fairness is particularly important in a travel and tourism context since a variety of pricing practices (e.g., yield management, dynamic pricing, and ancillary revenues) have increasingly raised fairness issues (Perdue 2002). The fairness judgment in a pricing context can be a driver of emotions and/or satisfaction, which can also influence future behavioral intentions and purchase decisions (Oliver and Swan 1989). Thus, this research is believed to build on the theoretical discourse in the tourism pricing literature.
Results also offer insight into practical implications for airline management in terms of marketing communications and customer relationships. Results showed that depending on how passengers understand the reasons for price increases or new prices, they may or may not feel the extra fees as fair. Thus, airline management needs to consider remedies as to how they can persuade passengers. For example, giving the right justification (e.g., this price change is uncontrollable) to customers in a timely manner can be considered as one tool for successful marketing communications. This is also supported by previous research that has demonstrated that reasons or justifications for an act could cause the outcome to be perceived as more fair than when justification is not offered (Bies and Shapiro 1988; Greenberg 1990).
Recently, many airlines in America and Europe have begun charging extra fees for services that used to be free. They have introduced new fees for other reasons. For instance, some airlines have insisted that charges for carry-on bags would ultimately benefit customers because passengers might want to bring fewer bags to avoid the fees, which could speed up check-in (CNN 2010). Some airlines have stated that fewer bags and services due to the extra fees help cut handling costs, which are ultimately used to cut airfares (Economist 2006). However, it appears that although those justifications could be very persuasive to some segments, they might not be to others (e.g., business travelers may be supportive for that, while leisure travelers with some carry-on bags and checked-in bags would likely not be). Accordingly, a marketing strategy in line with the price fairness model of this study could be considered (e.g., having passengers attribute the extra charges to some external uncontrollable reasons such as falling traffic and surges in fuel costs).
Results also suggest that airline management should understand how passengers form their cognitive attributions in an extra fees context. This study found that cognitive attribution is a unidimensional concept encompassing locus of causality and controllability. This means that a complicated explanation for the causes of the fees reflecting all three dimensions (as the traditional attribution theory has suggested) may not be efficient. Instead, this study suggests that airline management needs to give justification of extra fees by focusing only on who is responsible for the fees. For example, a message like this one could be considered: “We have done our best efforts to protect against price increases, but, inevitably, we have to start charging checked-bag fees because of the oil price increase. The heavier we are, the more we need fuel.” This concise message may sound more clear and comprehensible, and could be an efficient way to deliver marketing communications.
Finally, this study suggests that it is important to cope with consumers who already feel price unfairness because unfairness judgments tend to evoke negative emotions that can consequently lead to unfavorable behavioral intentions. For airline management, several ways of handling angry passengers can be proposed in order to protect against potential negative behaviors. This proactive consumer relationship management is required rather than reactive consumer relationship management because it can anticipate concerns before they become serious problems. More specifically, front-line employees need to be empowered to handle angry customers immediately and fairly because passengers or prospective passengers are most likely to show the front-line staff their negative reactions. Thus, giving justifiable explanations to passengers in a timely manner could be effective, and alternative ways to resolve these concerns could be an efficient way of dealing with angry customers. For example, a loyalty program or credit card membership (e.g., frequently flyer membership) could be introduced to the customers in order to have the extra fees waived. US Airways actually promotes this strategy: passengers who complain about the extra fees could be encouraged to register for airline frequent-flyer membership to get the benefits they deserve.
In addition, this study showed that angry passengers are more likely to report their negative experiences to external agencies and media as well as the airlines. Thus, it is suggested that airline management consistently monitor external agencies and media (e.g., websites and reviews). For example, management can set up an online reputation management department to regularly check out any negative feedback and complaints on the Internet.
In spite of its many advantages, data collection using online panels is not flawless. One of the frequently cited issues is that online panels are a voluntarily registered group of people instead of randomly selected individuals (Dillman, Smyth, and Christian 2009). Therefore, it is almost impossible to calculate the probability of being selected from a statistical perspective. In addition, the low response rate inherent in online panel studies is certainly a limitation.
Nonetheless, this study recruited online panelists because of several benefits (Hung and Law 2011). For instance, the sample could be drawn from more general population across the country than an intercept on-site survey at an airport. In addition, it is most likely understandable to argue that there are some differences in price fairness between diverse cultural contexts. For instance, it has been found that in some cultures, people are more likely to blame others for failures, but in other cultures, they tend to blame other external factors (e.g., fate or luck) for failures (Maxwell 2008; Kelley 1973). Therefore, it is suggested that the revised model in this study be applied to other cultures (i.e., Europe or Asia).
Footnotes
Declaration of Conflicting Interests
The authors declared no potential conflicts of interest with respect to the research, authorship, and/or publication of this article.
Funding
The authors disclosed receipt of the following financial support for the research, authorship, and/or publication of this article: This work was supported by the Holland America Line-Westours Graduate Research Grant.