



Abstract
Limited research has focused on the impacts of weather on tourist arrivals and participation in activities. This research uses Westland, New Zealand, as a case study to analyze the impact of weather on intra-annual seasonality and inter-annual variation in visitor nights. Further, a scenic flight operation and a visitor center in the township of Franz Josef serve as case studies to quantify the impact of weather parameters on the number of flights and visitation. The results show that seasonality in Westland is largely driven by temperature; however, variability in visitor nights across years does not seem to be influenced by weather conditions. Both the scenic flight operation and visitation to the visitor center are measurably impacted on by daily weather. This research provides information for destination managers in Westland on weather-related impacts on tourism, and potential changes in the future under the scenario of warming temperatures and increasing precipitation.
Introduction
An increasing body of literature explores the linkages between climate and tourism. Both climate and weather are of interest to tourism for many reasons. Foremost, climate drives global and national tourist flows, both as a result of tourists’ preferences for a particular climate that suits their holiday activities (e.g., Crouch 2010) and in response to climatic conditions in tourists’ home countries (Lise and Tol 2002; Palutikof, Agnew, and Hoar 2004; Perch-Nielsen, Amelung, and Knutti 2010; Hamilton, Maddison, and Tol 2005). Weather, as the short-term manifestation of climate, in the country of origin affects outbound and domestic tourism differently. Higher temperatures in Great Britain, for example, affect British outbound tourism negatively in the following year, while leading to a higher propensity to holiday domestically in the same year (Rossello-Nadal, Riera-Font, and Cardenas. 2011). A better long-term climate at home was also found to lead to more domestic travel while reducing the probability of international departures (Eugenio-Martin and Campos-Soria 2009).
A better understanding of how climate drives tourism might also help to address seasonality (Gómez Martín 2005; Amelung, Nicholls, and Viner 2007). Many destinations experience substantial fluctuations in annual arrivals, causing infrastructural constraints during peak times and revenue shortfalls in the low-season (Butler 2001). Seasonality has been attributed to both climatic and institutional factors (e.g., school holidays), and Hadwen et al. (2011) modeled the relative importance of each for visitation to a range of National Parks in Australia. They found that protected areas in climates with pronounced annual variations are overwhelmingly influenced by climatic factors, whereas those in more stable climates (e.g., sub tropics) are also influenced by institutional factors.
Temperature is often used as one key variable to model tourist visitation (e.g., Hamilton and Tol 2007; Serquet and Rebetez 2011). This was confirmed in a study that modeled quarterly arrivals to Australia, although the impact of temperature could not be generalized across markets. Differences in the importance of temperature were found to differ between Northern and Southern Hemisphere markets (Kulendran and Dwyer 2011). A number of climate variables in addition to temperature have been used to predict tourist flows, including precipitation, relative humidity, wind speed, and cloudiness. Often, these have been bundled into a Tourism Climate Index (TCI) that aggregates climate information into a single number that reflects the human comfort of a particular location (for a second generation index, see de Freitas, Scott, and McBoyle 2008). The TCI has mainly been used to understand how future changes in climatic conditions as a result of global climate change might affect the relative attractiveness and tourist arrivals at destinations (Amelung, Nicholls, and Viner 2007; Hein, Metzger, and Moreno 2009).
Research has also been undertaken on the impact of weather on tourist activities, recognizing that weather is a significant factor in relation to operations (e.g., trip cancellations, Tervo 2008), tourist satisfaction (Coghlan and Prideaux 2009; Becken and Wilson 2012), and tourist safety (Bentley and Page 2008). Many tourist activities are highly weather dependent, for example, the popular tourist activities of golf (Nicholls, Holecek, and Noh 2008) and skiing (Hamilton, Brown, and Keim 2007). The rounds of golf played at four golf courses in Canada, for example, were found to be influenced by both temperature and precipitation. A regression model based on daily data was developed to then predict the impacts of future climate change. It was found that climate change has the potential to extend the golf season by 10-51 days depending on the course’s location (Scott and Jones 2007). Similarly, daily ski lift ticket sales at two Michigan (USA) ski resorts were statistically related to minimum and maximum temperature, snow depth, and wind chill (Shih, Nicholls, and Holecek 2009). More broadly, the participation in leisure depends on aspects of the weather, including heat, cold, and humidity, with greater participation rates in summer compared with winter (McGinn et al. 2007).
New Zealand is a suitable context in which to study the relationship between weather and tourism. Its geography strongly influences local weather patterns and climatic destination attributes. Temperature, sunshine hours, rain, and the overall changeability of the weather are frequently discussed in the New Zealand media (Wilson and Becken 2011). The role of tourism forecasts, for example for rain, and their perceived negative impact on visitation is an ongoing concern for many tourist destinations in New Zealand (ibid). Meyer and Dewar (1999) investigated the effect of rainfall on visitor numbers at the Franz Josef visitor center on New Zealand’s West Coast. They found that higher rainfall for any day resulted in an increased number of visitors at the visitor center. However, while the effect was significant, other factors, including annual seasonality, dominated the model, with rainfall accounting only for a very small proportion of variation. No other climate variables were included in Meyer and Dewar’s model.
Building on this earlier study and recognizing the importance of weather for tourism in New Zealand and elsewhere, this current research seeks to quantify these effects at the destination and activity levels. The West Coast of New Zealand, and more specifically the southern district, Westland, serves as the context for the analyses presented here. Three research questions are being asked and explored via four separate regression models. First, is seasonality of visitation in Westland associated with intra-annual variations in core weather parameters? Second, can monthly variations in Westland’s visitation be explained by monthly variations in the weather? Third, can daily variations in weather explain variations in tourist participation (scenic flights) and visitation (visitor center)?
Understanding the relationship between weather and tourism, especially the relative importance of specific weather parameters, has high relevance for tourism operators and other decision makers. Many operational decisions, such as staffing or maintenance of equipment, are influenced by the weather, and a more strategic use of weather-tourism “intelligence” is likely to increase effectiveness and efficiency of such decisions. Second, this research aims to generate some lessons learned for future analyses of how tourism is affected by the weather, for example in relation to data requirements. Finally, while not the focus of this particular research, understanding how weather and tourism interact under the present climate will be extremely useful for preparing tourism operators and destinations to adapt to more systemic changes in the climate due to global climate change.
Climate and Tourism in Westland, New Zealand
The West Coast of the South Island has a temperate climate characterized by high rainfall. Climate data for the Hokitika climate station show that the average (1971-2000) annual rainfall is 2,875 mm (176 wet days), at an average temperature of 11.7°C. The annual sunshine hours amount to 1860, which is comparatively low in the New Zealand context where many places count well over 2,000 sunshine hours per year (NIWA 2011). New Zealand’s climate is characterized by natural fluctuations in the prevailing westerly winds with implications for precipitation and local wind (Mullan et al. 2010). Many of these fluctuations are short-lived, but other changes are associated with large-scale patterns over the Southern Hemisphere or Pacific Ocean (including the El Niño-Southern Oscillation and the Interdecadal Pacific Oscillation).
The Westland district council (Figure 1) attracted about 674,200 visitor nights in 2010 (Tourism Strategy Group 2011). The balance between international and domestic tourism is not known at the district level, but personal conversation with local experts (e.g., information center manager in Hokitika, T. Adler, September 21, 2011) suggests that tourism in Westland is driven largely by international visitors, especially in the summer months. The seasonality in Westland is more pronounced than for New Zealand as a whole, although it follows a similar pattern. The summer months of January, February, and December, that is, the summer months in one year, represent 39% of guest nights in the Westland district for the calendar year of 2010. When considering international tourism (no data are available for domestic tourism) for the whole of New Zealand, the proportion of these three summer months compared with the rest of the year is typically 34%-35% (Tourism Strategy Group 2011). Seasonality is a key concern identified in the New Zealand Tourism Strategy, demanding strategic approaches to enhance visitation in the shoulder season (Ministry of Tourism, Tourism Industry Association, and Tourism New Zealand 2007).

Map of Westland District Council (also showing Hokitika) area, including the tourist location of Franz Josef Glacier
Franz Josef Glacier is a major tourist center of Westland. It is situated at the border of Tai Poutini National Park, a protected area famous for its unique glaciers and temperate podocarpaceae rainforest. Franz Josef Glacier township has about 300-400 inhabitants and offers a range of tourist accommodation and activities, including guided tours onto the glacier and scenic flights. It is also the headquarters of the Department of Conservation (DoC) Franz Josef conservancy, including the Westland Tai Poutini National Park Visitor Centre. While there are no detailed visitor data for Franz Josef Glacier, it is believed that in summer it reaches “the size of Hokitika” at about 3,000 to 4,000 people (personal conversation, Westland District Council, V. Goel, September 21, 2011). Franz Josef Glacier and the slightly smaller neighboring Fox Glacier are the main attractions of Westland with up to 600,000 tourists visiting one or both of the glacier valleys (personal conversation, DoC, W. Costello, September 21, 2011). Comparing the estimated visitor numbers to the glacier valleys with the total number of visitor nights, it becomes clear that, at least statistically, most tourists staying in Westland are visiting the glaciers. A focus of this research on Franz Josef Glacier and its local weather is therefore justified.
Method
Overall Approach
Two types of time series were prepared for analyses of how weather parameters might affect tourist visitation and participation (Table 1).
Overview of Data Used for the Destination Analysis of Westland and Activity Analyses in Franz Josef Glacier
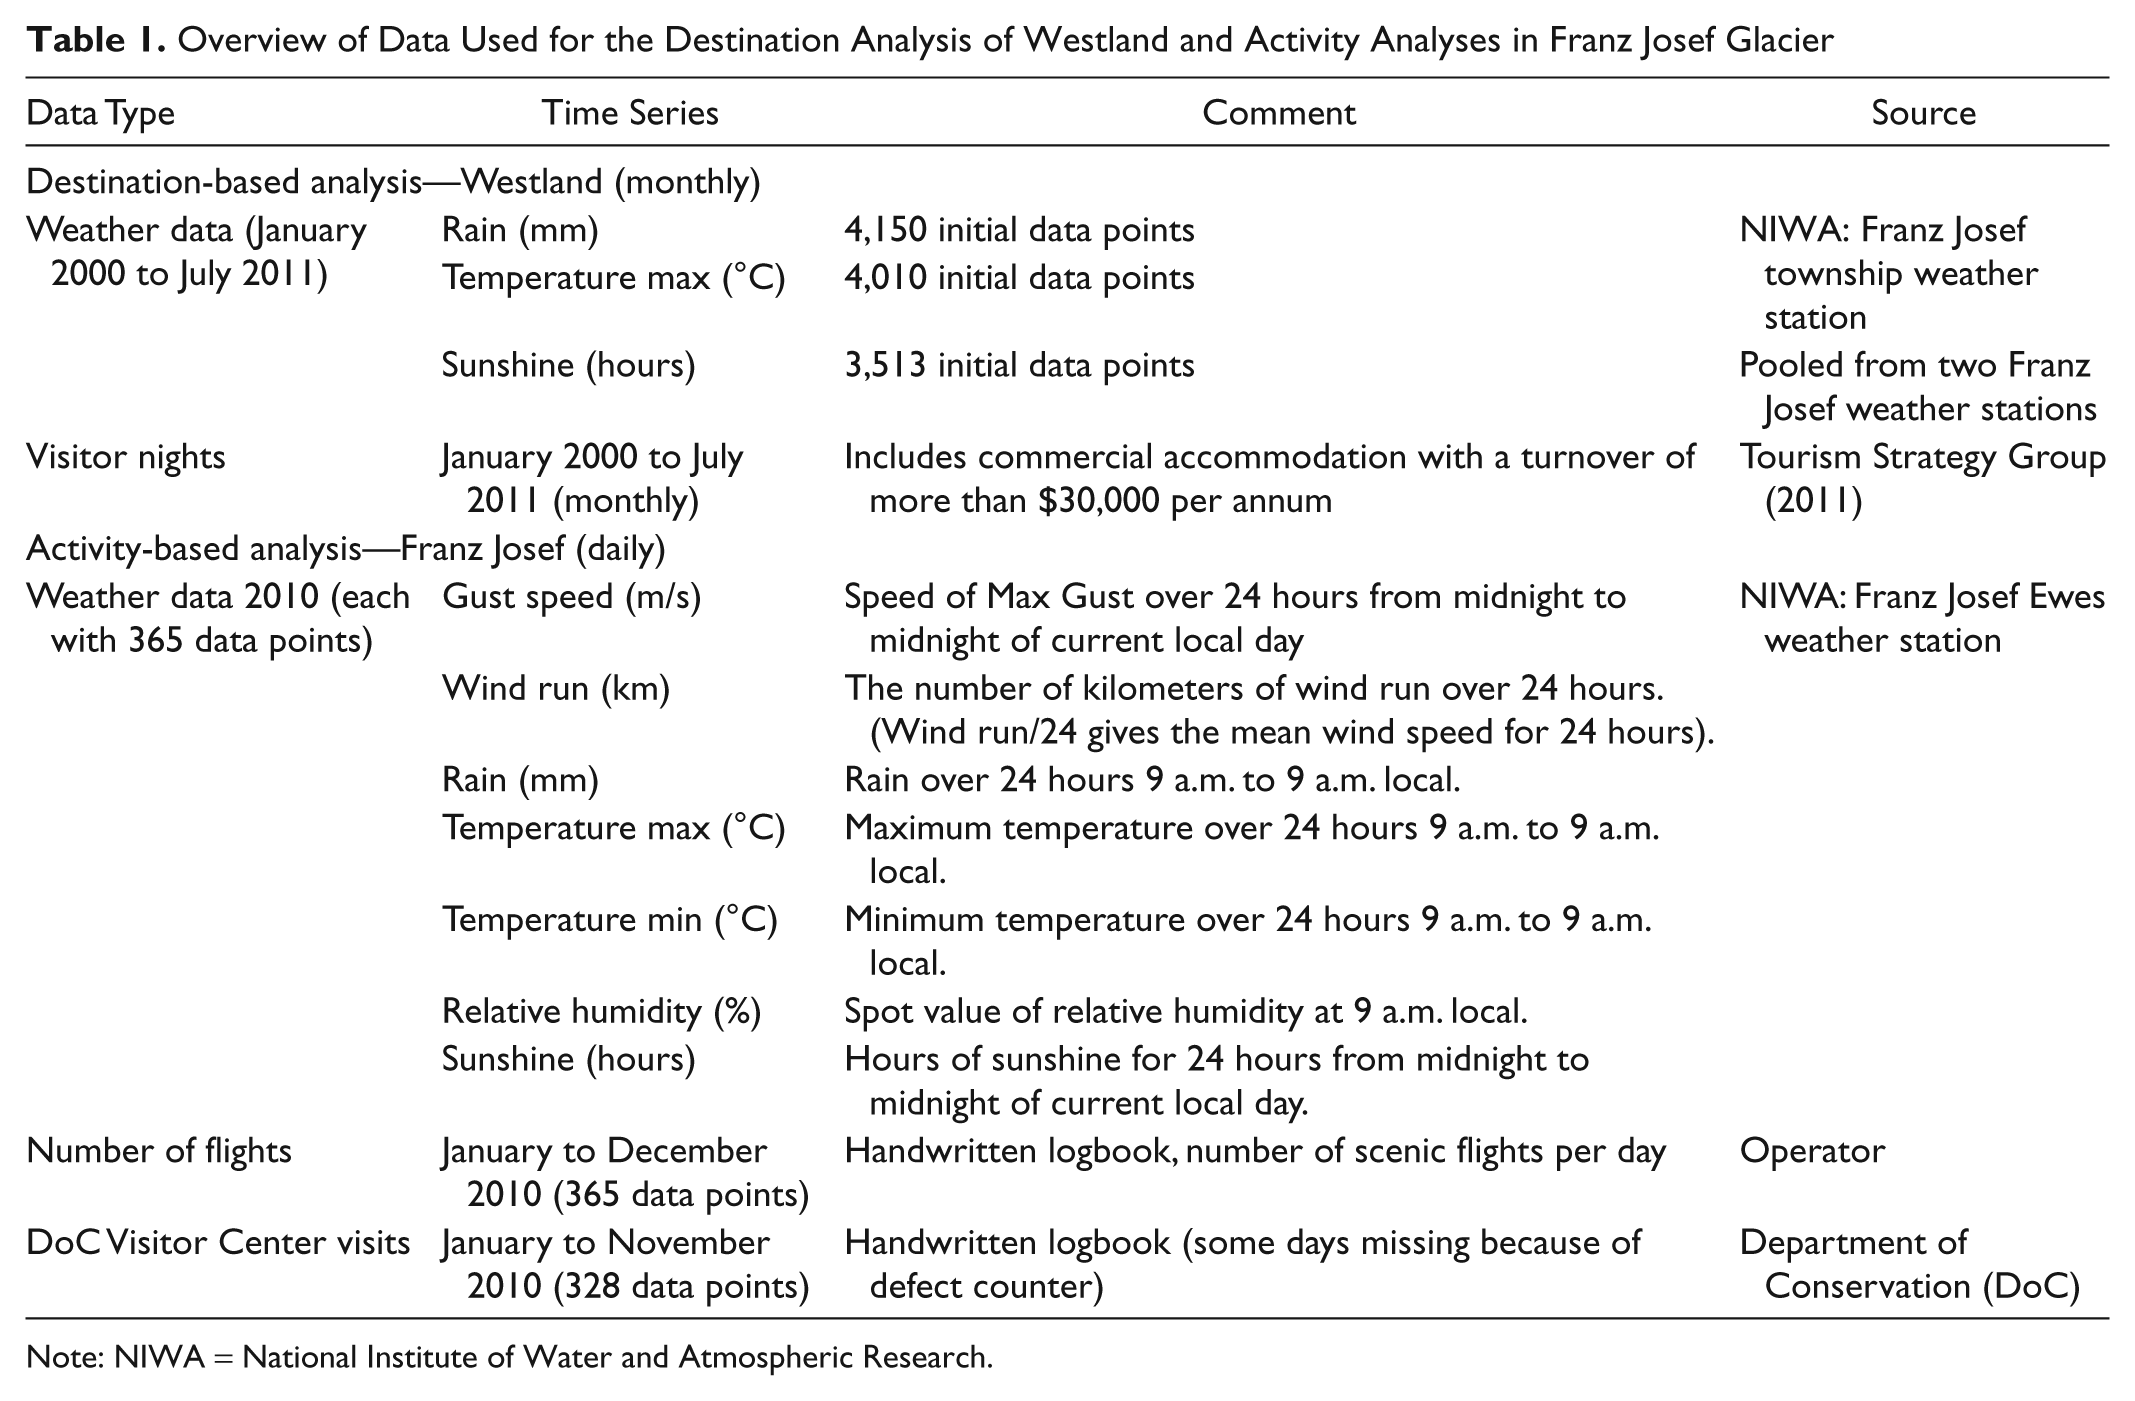
Note: NIWA = National Institute of Water and Atmospheric Research.
Destination-based analysis: Based on a data set of monthly weather and visitor nights in commercial accommodation in Westland over the last decade (resulting in two regression models);
Activity-based analysis: Based on daily weather data in 2010, number of scenic glacier flights and visitor center door counts in Franz Josef Glacier (resulting in two regression models).
As suggested by Amelung et al. (2007), regression analysis is appropriate to investigate the impact of climate variables (and changes thereof) on visitation. This technique has already been used in similar research by Smith (1990), Lise and Tol (2002), Hadwen et al. (2011), and Scott and Jones (2007). Thus, a number of multiple regression models (ordinary least square, enter method) were developed in SPSS 17.0 with tourist visitation and participation as the dependent variables and weather factors as independent variables. Different modifications, including a logarithmic transformation of tourist data (e.g., Lise and Tol 2002), were tested, but no improvements to the basic model were evident. Assumptions of independent errors were tested with the Durbin Watson test to detect potential of autocorrelation, which relates to an effect where values are not independent from each other over time, which could be relevant for weather. Potential correlations among independent variables were checked for, and normal distributions of errors were assessed through residual plots (Field 2009; Norusis 2008).
Analysis at a larger spatial and temporal scale (i.e., the Westland district and monthly weather over a decade) requires weather variables that can be meaningfully aggregated, for example temperature, whereas those that are likely to vary substantially over time and space, such as wind, are better left for micro-level analyses (Eugenio-Martin and Campos-Soria 2009). Temperature and rain are the variables that are most commonly used for aggregate analyses (e.g., Hadwen et al. 2011). The destination analysis of Westland’s visitor nights therefore uses maximum temperature, and rain, and also includes sunshine hours as a potentially important predictor. The data stem from two weather stations in Franz Josef Glacier (see below), which was used as a surrogate for weather in Westland. This was considered defensible given the importance of Franz Josef Glacier as the major visitor destination within Westland and the conceivable assumption that visiting tourists would largely be interested in the weather conditions at this particular place. While there are other weather stations in Westland, it would be extremely challenging (and arbitrary) to decide which ones to include in the analysis and how to weight them according to tourists’ likely dispersal in the region. In contrast to the destination analysis, the activity-based analysis in Franz Josef Glacier uses daily data of seven variables for the year 2010 from the Ewes weather station (Table 1).
Analysis of Visitor Nights and Weather for Westland
Two regression models were built to understand the effect of weather on seasonality and monthly variations on visitation measured through visitor nights in Westland. The weather data (the independent variables) stem from two weather stations (Township and Ewes, 4 kilometers apart) in Franz Josef Glacier. The destination analysis is mostly based on daily weather data from the Township weather station, because Franz Josef Ewes did not start recording until 2003 and it was preferred to have a longer time series covering a full decade. Weather data from the Township station run from 2000 (January) to 2011 (July), although there are some gaps in the data: Temperature max is missing in January 2000. The month of December 2000 is missing for all variables. Rain and Temperature max have not been recorded in the Novembers of 2000 and 2005. Sunshine has only been recorded in 2000 (January to October) and 2001 (until 16th of September). From then on, sunshine was recorded at the Ewes station, starting from the 1st of June 2003 to the 31st of July 2011. Since sunshine is unlikely to vary within 4 kilometers, these Ewes data were pooled with the earlier Township sunshine data. There are minor gaps in the sunshine data for individual days when equipment was defunct. To correspond with monthly tourist visitation data for Westland, monthly averages were calculated for Rain (mm), Temperature max (C), and Sunshine (hours) across all years. This generated 135 data points (i.e., number of months derived from 4150 daily observations, see Table 1) for Rain, 133 for Temperature max, and 118 for Sunshine. Thus, the monthly average for the three weather parameters and visitor nights per month (“Visitor Nights”) were used in this analysis of intra-annual seasonality. In addition, potential effects associated with the different years (2000 to 2011) were controlled for with dummy variables.
The assessment of inter-annual variability in destination visitation required two further steps to prepare the daily weather data, because the focus of this analysis was to understand if “better or worse-than-normal” months would result in greater or lesser visitation (i.e., relative rather than absolute effects were of interest). First, the difference from the decadal monthly average was computed for each day as a new variable. For example, rain on the 1st and 2nd of January 2000 was 2.7 and 34.7 mm, respectively. The long-term average of 17.3 mm of daily January rain was then subtracted from these daily observations, indicating a drier-than-normal day on the 1st and a wetter-than-normal day on the 2nd of January. Secondly, the mean deviation from the long-term average was computed as a new variable for each month. In the case of January 2000, the average deviation was −0.106 mm per day; that is, this month was a little bit drier than the rainfall in a “typical” January in this decade. The same procedure was applied to Temperature max and Sunshine hours. The resulting variables are called “Rain Deviation,” “Temperature max Deviation,” “Sunshine Deviation,” wherein deviation stands for “deviation from decadal average.”
The monthly visitor nights for Westland followed a growth trend with a maximum in February 2008 (101,143 visitor nights) and a subsequent decline until 2011. This underlying trend could produce unnecessary noise and override effects of better or worse-than-normal weather. A quadratic trend was found to describe the curve best. To take into account the fact that summer months are typically busier than winter months (and also because of different variances for each month), the curves were fitted for each month. The models performed well for each month with R2s ranging from 0.779 to 0.941. The January data and curve are shown in Figure 2 to illustrate the approach. The month-specific residuals (i.e., busier-than-normal or less busy-than-normal in a given month) were then used as the new dependent variable (“Visitor Nights Residuals”) in the regression analysis with the “deviation from decadal average” weather variables as independent variables.

Monthly visitor nights for the months of January 2000 to 2011 (i.e., 12 of 128 data months on the x-axis) and quadratic curve fitted to compute residuals from the long-term trend
Analysis of Tourist Activity and Weather for Franz Josef Glacier
Two separate regression models were built to explore the effect of weather on the number of scenic flights and the visitation to a visitor center. The 2010 weather data for these two activity-based analyses all stem from the National Institute of Water and Atmospheric Research (NIWA) weather station at Franz Josef Ewes. This station provided seven relevant weather variables (Table 1). The data for the number of scenic flights per day were taken from the log book provided by an operator. The exact number of people on each flight was not recorded, but Flights is a good proxy for tourist participation. Visitor Center data were provided by DoC. Both sets of tourist participation and visitation data required further preparation to account for the seasonal variation in visitor numbers. A model with the original data simply showed that the summer months with generally warmer weather and higher visitation in Westland resulted in greater activity participation. However, it is the day-to-day variations of weather that are of interest here. Figure 3 shows the visitor center door counts for 2010 and a fitted quadratic curve (R2 = 0.758) that allows analysis of residuals reflecting day-to-day variation. Three data points of door counts greater than 2,000 in early January related to the “kiwi release program” (a conservation initiative in which kiwis were released into the wild) and were excluded. Residuals from this new trend line were computed (“Visits Residuals”). A quadratic curve was also fitted to the number of flights, and the variable of “Flights Residuals” was created for further analysis. Possible effects associated with the different months were controlled for with the use of dummy variables.

Door counts (variable: “Visits”) for 2010 (excluding December) and fitted quadratic trend for data (excluding three outliers over 2000) to calculate “Visits Residuals” for each day
Results
Destination-Based Analysis
Seasonality
Visitor nights in Westland’s commercial accommodation are highly seasonal, with a clear peak in January–February and a low in June–July (Figure 4). The pattern of intra-annual variability is very closely matched by variations in temperature, and to a lesser extent by sunshine hours. Rainfall is observed throughout the year with a slightly drier winter compared with summer.

Visitor Nights in Westland (primary axis) and average monthly Temperature max (°C) and Sunshine (hours) (secondary axis) in 2000-2011
The relationship between the weather variables and monthly visitor nights has been quantified by means of a regression analysis (exclude cases listwise to concentrate on those months where all weather variables contribute to the model). The resulting model explains 83.3% of the variation in visitor nights over the last decade (F = 38.389, df = 13, 100, p < 0.001). Temperature is the key driver of seasonality in Westland followed by rain and sunshine hours, explaining most of the variance (see part correlation in Table 2). In essence, the results confirm that the warmer summer is associated with more visitor nights, whereas colder winter months attract less tourism. For every degree Celsius warmer, there are 8,121 more visitor nights. Rainfall and sunshine are not significant predictors. The Durban Watson statistic (1.669), the correlation matrix and the residual plots all indicate no major issues with the underlying assumptions.
Regression Coefficients in Order of Influence for the Dependent Variable Visitor Nights in Westland

Note: R2 = 0.833, F = 38.389, p < 0.001.
Inter-annual Variability: Does Weather Influence Visitor Nights?
The Franz Josef Glacier weather data used in this analysis highlight the pronounced variability of the climate in Westland. As can be seen in Figure 5 for Rain Deviation and Sunshine Deviation, the weather observed each month differs widely from the decadal average. The driest month in the 2000-2011 decade saw a daily average of only 2.5 mm of rain (November 2007), compared with the wettest month in December 2010 (37.6 mm of daily rain). Temperature max Deviation ranged from −3.72°C and 3.12°C. June 2011 followed by December 2005 and January 2008 were the relatively warmest months, whereas January 2011 was by far the coldest month.

Deviation from the decadal average: Rain Deviation from 2000 to 2011
Considering such high inter-annual variability, it is possible that there is a measurable effect on visitation to Westland, reflecting a particularly “good” or “bad” month. A multiple regression model (exclude listwise) with Visitor Nights Residuals as the dependent variable and Rain Deviation, Temperature max Deviation, and Sunshine deviation, however, did not produce significant results for the weather variables (Table 3). The significance of the overall model (R2 = 22.6%) was increased by the explanatory power of some of the dummy variables. For example, the year 2006 appeared to systematically produce lower-than-expected visitor nights.
Regression Coefficients in Order of Influence for the Dependent Variable Visitor Nights Residuals in Westland
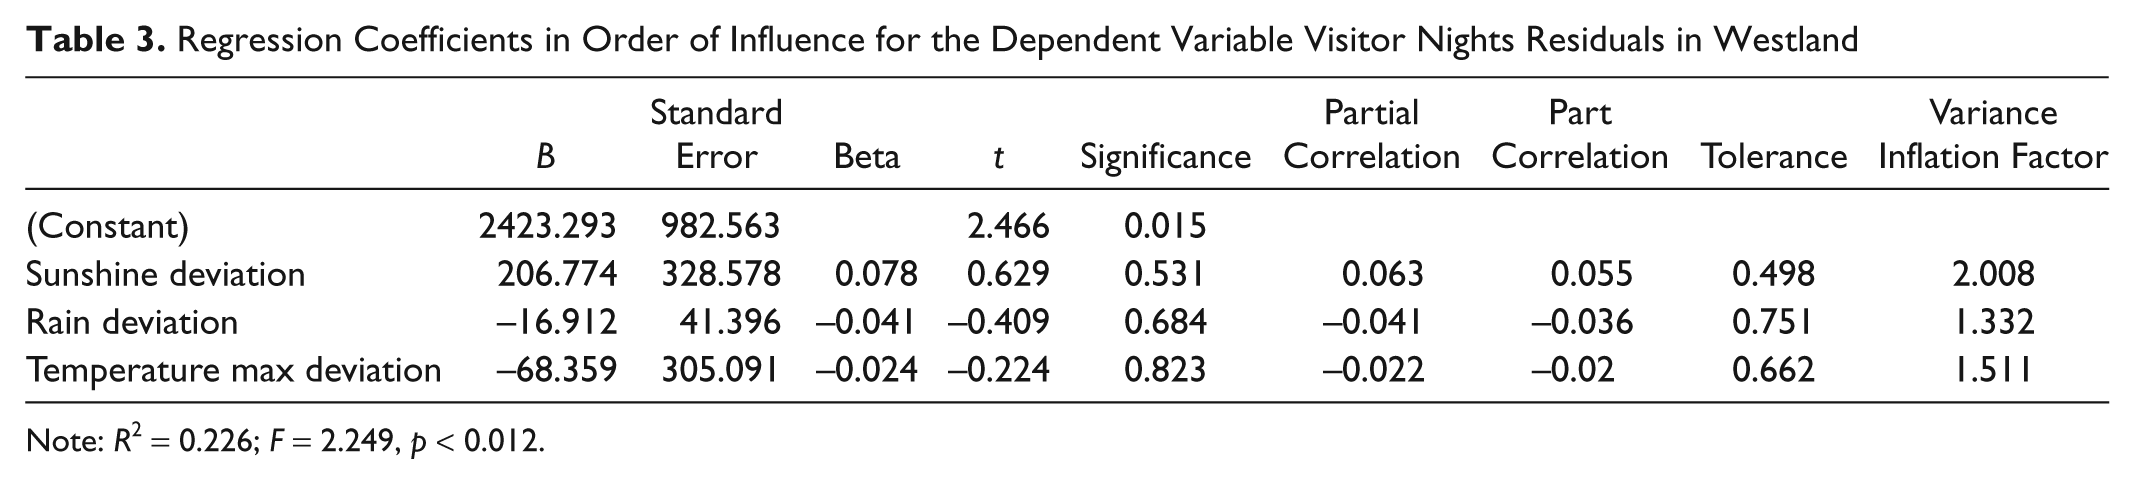
Note: R2 = 0.226; F = 2.249, p < 0.012.
Activity-Based Analyses
Two aspects of the weather-tourism relationships were investigated: First, the participation in scenic flights, and second the visitation to the DoC Visitor Center. An ANOVA was applied to test if the weather observed in 2010 differed from the decadal average, but no such difference could be found.
Scenic flights
The flight data showed that scenic flights were undertaken on 175 days of the year. Of these, 83 days had one flight, 36 days saw two flights, and 31 days recorded three flights. More than three flights per day were rare. All seven weather variables described in the methods were entered as independent variables into a regression model in an attempt to explain the number of flights recorded by the operator. Three variables were found to contribute significantly to a model with an R2 of 0.370 (F = 11.3, df = 18, 346, p < 0.001). The most influential variables were Temperature min and max (Table 4), followed by sunshine hours and to a lesser extent rain (yet not significant at the 5% level). This is not surprising as demand for scenic flights would typically be associated with “good” weather, although the lack of significance for wind-related variables is surprising. Temperature min is possibly significant, because colder temperatures during night time (in the relevant 24-hour interval) may relate to clear nights in high pressure weather patterns. A “high” will then also more likely provide weather conditions amenable for scenic flights. The Durban Watson statistic was 1.875, indicating no issues with relationships between residuals. Collinearity is not of major concern either with low Variation Inflation Factors and acceptable tolerance levels (Table 4).
Regression Coefficients in Order of Influence for the Dependent Variable Flights Residuals
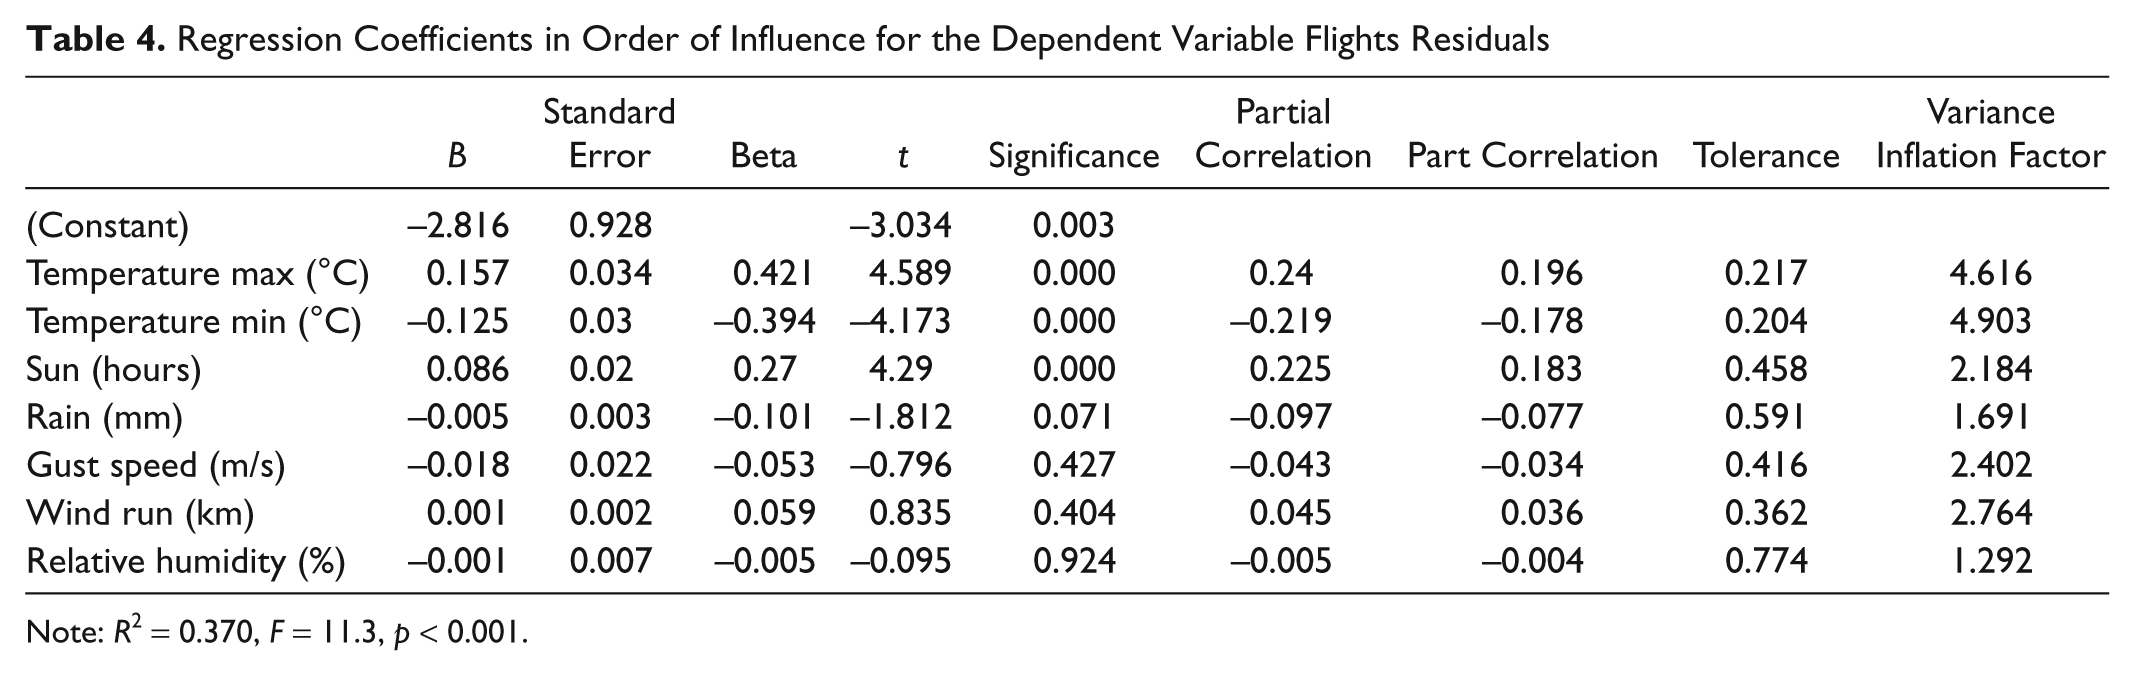
Note: R2 = 0.370, F = 11.3, p < 0.001.
Department of conservation visitor center
The DoC Visitor Center is a major part of the tourism infrastructure in Franz Josef Glacier. It serves as an information center for DoC as well as a so-called i-Site (tourist information) booking office, and provides the latest information on the weather and access to the glaciers for tourists. It is also an attraction in its own right with a small museum and interpretation panels on the area. As such it is highly visited by both international and domestic tourists. In 2010, the visitor center received about 108,000 visitors (note that DoC staff entering or leaving the building are counted as well), with an average of 329 per day.
A regression model with three significant weather variables was found to explain 40.6% of the variation in Visits Residuals (F = 12.345, df = 17, 307, p < 0.001). Wind, both measured through the speed of wind gusts and wind run, were the most important weather factors, followed by relative humidity (Table 5). The gustier and the more humid, the more people visit the visitor center, possibly because other activities are unavailable. Wind affects visits negatively in that higher overall winds (rather than gustiness) are associated with fewer tourists at the center. This result is not fully conclusive and deserves further attention. Interestingly, the amount of rain (as found by Meyer and Dewar 1999) was not found to be a significant predictor for visitation to the visitor center, although the direction of the relationship (the more rain the more visitors) is in line with earlier research. The model shown in Table 5 has a Durban Watson statistic of 1.193, indicating some positive correlation between adjacent residuals, which deserve further attention in future models (Field 2009). This is not unexpected as tourists often stay for more than one day and if weather patterns persist, behavior may deviate in a similar pattern for a number of days in a row.
Regression Coefficients in Order of Influence for the Dependent Variable Visits Residuals
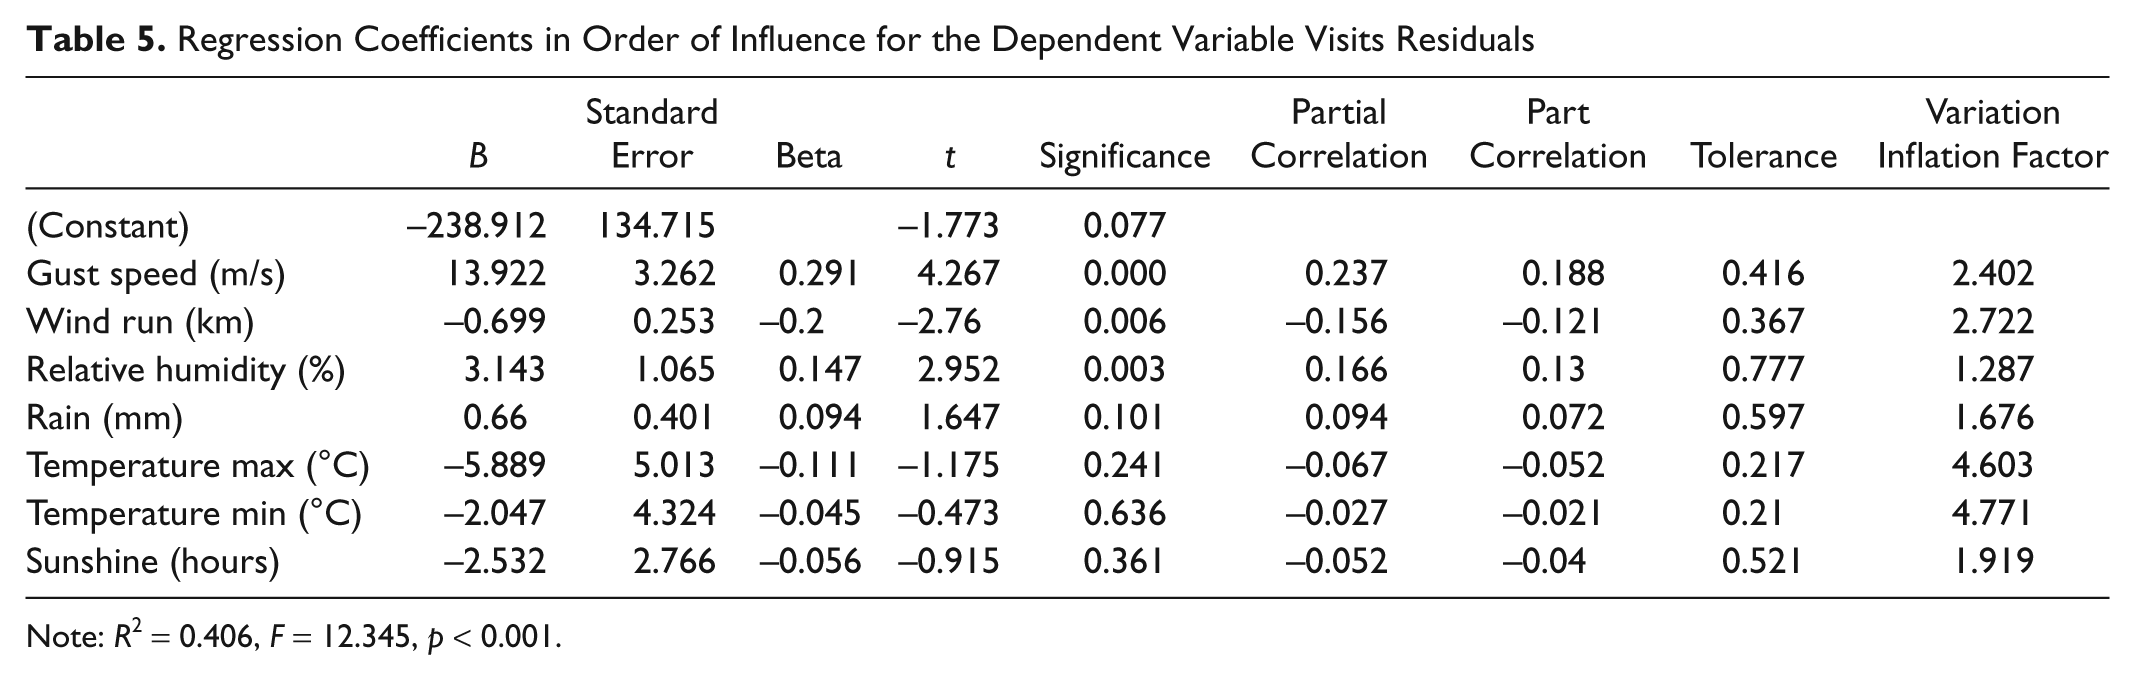
Note: R2 = 0.406, F = 12.345, p < 0.001.
Discussion
This paper presented a number of regression models that were developed to better understand how weather affects tourism in Westland and at Franz Josef Glacier, on the West Coast of New Zealand’s South Island. A destination-based analysis, using monthly data, clearly showed an association between temperature and visitor nights. Interestingly, the much talked about rain on the West Coast (Wilson and Becken 2011) did not contribute significantly in explaining intra-annual variability of tourism. Thus, seasonality is clearly driven by temperature. While tourism in Westland seems to be related to seasonal weather, it was surprising that there was no significant relationship between inter-annual monthly variability and visitor nights. Based on findings elsewhere it was conceivable that a particularly wet or a particularly warm month might be reflected in less-than-normal, or greater-than-normal activity (similar to an analogue approach, as illustrated by Dawson, Scott, and McBoyle 2009). In Great Britain, for example, Agnew and Palutikof (2001) found that during a hot summer, more people took day trips and also more weekend breaks, indicating that travelers are sensitive to short-term weather patterns in their travel decisions. Serquet and Rebetez’s (2011) study also found evidence that tourists responded on a short-term basis to hotter days by choosing to spend time at higher altitudes when it is hot in the cities. However, no evidence of such behavior was found in Westland. It appears that tourists in Westland execute their travel plans irrespective of weather. Often bookings have been made and itineraries have been pre-planned, and visitors from overseas in particular have invested a lot of time and energy to visit the places they deemed attractive (Dewar 2005). International tourists may also not be fully aware of local climate conditions and weather forecasts (Wilson 2011), and their travel itineraries depend on a multitude of factors such as length of stay, travel party, previous experience, and transport mode (Becken and Schiff 2011). The data did not allow for segmentation into international and domestic visitors, but it is possible that a weather impact on monthly visitation is discernible for the domestic market.
Another explanation for the lack of a relationship between monthly weather variation and visitor nights is that the aggregate approach of using monthly data is too coarse. While the monthly variability is clearly substantial (Figure 5), there is also a considerable daily variation, leaving sufficient room for flexibility to visit earlier or later, but still within the same month. Spatial variability may also play a role. The climate data used in this analysis were from the Franz Josef Glacier weather station and therefore only reflected the local climate of one (albeit the major) tourist location in Westland. Rainfall may cause the greatest problem in our generalization because of its high spatial variation on the West Coast (Wilson and Becken 2011), whereas temperature and sunshine are less problematic. The integration of climate data across several locations might be a solution, or separate analyses could be undertaken for individual locations, for example, Hokitika, Franz Josef, and Fox Glacier. For the latter alternative, the lack of tourism data presents a challenge.
The activity-based analysis showed that a more localized analysis yields useful results. The dependency of scenic flights on the daily weather became very obvious, with 37% of the variation in flights being explained by three climate variables, Temperature max and min and Sunshine. Interestingly, neither rain nor wind-related variables contributed at a significant level. The importance of sunshine, however, is not surprising, considering that scenic flights are typically demanded in weather conditions that allow for scenic views of the glaciers and satisfactory photographic conditions. When considering the viability of the scenic flight operation as a business, it is important to note that flights (one or more) were only recorded for 48% of days available in 2010. With the weather being a key factor in the number of flights that the business can offer (i.e., for safety consideration) and that are demanded by tourists on these favorable days, the business has limited control over its revenue stream. It also means that any changes in weather conditions, due to natural climate variability (e.g., cyclical patterns such as the El Nino Southern Oscillation) or climate change, should be of great interest to the operator.
The analysis of the impact of weather on visitation at the DoC visitor center highlighted the importance of quite different weather variables compared with the scenic flight operation. The significant predictors were gust speed, relative humidity, and wind run. Surprisingly, neither temperature nor rain appeared to be significant predictors of visitation, despite a common perception of visitor center staff and the earlier findings by Meyer and Dewar (1999) that rainy days are busier (personal communication, Rachel Ardern, Visitor Center Manager). The limited importance of these obvious weather variables for visitor center door counts is probably explained by the fact that tourists go to the visitor center for many reasons, including generic information, weather updates, and bookings. All of these could be relevant on both good and bad weather days. It is possible that hourly data, as used by both Yu et al. (2009) and Coombes, Jones, and Sutherland (2009), might produce more significant results. Also, the effect of time lags might play a role. Meyer and Dewar (1999), for example, found that rain two days earlier impacts on visitation to the DoC center, rather than rain on the day. Different variations of this finding (e.g., amount of rain over the last 48 hours) were tested in this research, but no significant findings were obtained. The limited role that rainfall plays in any of the regression models in this study is noteworthy, especially since Scott, Gössling, and de Freitas (2008) found that the absence of rain was the most important climatic element for tourism in New Zealand.
The two analyses of tourist activities and the differential effect of the seven weather variables highlight the importance of taking an activity-based approach to climate research in tourism (Tervo 2008). Detailed understanding of how sensitive a particular activity is and how demand for that activity might be influenced by weather is useful for business management (e.g., staffing), longer-term planning (e.g., new products), and risk management, especially against the background of likely climatic changes in the longer term. Suggested measures to address weather and climate include (1) weather-based design, (2) contingency planning, (3) marketing, and (4) personal adaptation (e.g., rain gear) (Dewar 2005). Proactively “selling the problem,” for example, the “wild weather,” has been proposed as an approach to turning a potential disadvantage into a competitive edge (Dewar 2005). The use of insurance and weather derivatives is another avenue probably not fully exploited by tourism businesses. Derivatives, other than insurances, are designed for low risk-high probability events (Pollard et al. 2008) and could therefore fit the situation of unfavorable weather at tourist locations quite well.
This research focused on the relationships between weather and tourism. Future research on climate change and its impacts on tourism in Westland could build on the regression models presented here. The warmer climate predicted under climate change scenarios (Ministry for the Environment 2008) may benefit tourism in Westland. While not modeled in this paper, insights from similar studies in other countries are useful. For the Rocky Mountain National Park (USA), Richardson and Loomis (2004) modeled monthly visitation data and four climate variables for the park’s peak and shoulder seasons to analyze the relationship between climate and tourism and to make predictions about future visitation. They found that a 13.6% increase in visitation was estimated for the Canadian Climate Center baseline scenario, with temperature being a main driver. Similarly, Scott, Jones, and Konopek (2007) estimated that climate change (in particular warmer temperatures) would increase annual visitation to Waterton Lakes National Park (Canada) by between 6% and 10% in the 2020s and between 10% and 36% in the 2050s.
When thinking longer term about climate and weather from a destination marketing perspective, it would also be advisable to consider any indirect impacts of climate change on tourism. Most notably, it is likely that the core attractions of the Westland destination, the glaciers, are vulnerable to climate change with repercussions on destination attractiveness, access, and safety. The extent to which tourism in Westland depends on these glaciers would need to be determined as well as the type of experiences tourists seek from the glacier. As shown in research elsewhere, indirect environmental effects resulting from climate variability and change are significant for tourism. For example, Coghlan and Prideaux (2009) found that poor weather (and more thereof in the future) affects tourists’ enjoyment of the Barrier Reef because of an increase in sea sickness, more turbid water, and less vibrant reef colors. Similarly, Coombes, Jones, and Sutherland (2009) established that both weather variations and changing beach conditions will affect beach visitation under four different climate change scenarios. Successful adaptation to climate change requires a good understanding of both direct and indirect changes to tourist destinations as well as feasibility and viability of different adaptation options.
Conclusion
This research used multiple regression analysis to investigate potential relationships between the weather and tourism activity. More specifically, a destination-based analysis of Westland, New Zealand, quantified how intra-annual variability in visitor nights, that is, seasonality, relates to natural fluctuations in temperature, sunshine hours and rain. However, no link could be found between weather and visitation in terms of monthly variability, despite significant variations, especially in rainfall. Future analysis with finer temporal and spatial resolution would be beneficial to further explore this relationship. The influence of three weather variables on the number of scenic flights was established, with both maximum and minimum temperatures being successful predictors, alongside sunshine hours. Finally, the demand for a visitor center, measured through door counts, was also found to be weather dependent, albeit to a lesser extent. The weather variables found to explain visitor center visitation differed from those influencing scenic flights, demonstrating the usefulness of an activity-based approach to research weather, climate variability, and climate change. Results can be used to manage and plan for the weather and also to generate more knowledge of the impacts of climate change on tourism in Westland. Here, the combination of direct climatic effects and indirect changes (e.g., retreating glacier) may be used to predict future changes in tourism activity.
Footnotes
Acknowledgements
I thank two independent reviewers for the helpful comments that improved the clarity of the manuscript substantially. I also thank Dr. P. Wicker, Griffith University, for her feedback on the statistical modeling.
Declaration of Conflicting Interests
The author declared no potential conflicts of interest with respect to the research, authorship, and/or publication of this article.
Funding
The author received no financial support for the research, authorship, and/or publication of this article.