
Abstract
Tourist satisfaction analysis provides important information that contributes to design public and private policies in tourist services and destinations. However, the responses to tourist satisfaction scales can lead to biased results when comparing tourists from different nationalities and backgrounds, since they might use different internal scale interpretations to assess their satisfaction level in a survey. In this article, the anchoring vignette methodology is used to test and correct for scale response bias in tourist satisfaction surveys. The results of the empirical application find out that scale response is not homogeneous across tourists from different nationalities and that the correction for scale differences can lead to an evaluation of tourist satisfaction that more accurately informs and facilitates improvements in policy decisions at tourist destinations and operators.
Introduction
The measurement of tourist satisfaction is a key component of the toolkit usually employed to guide private and public tourist destinations policies (Kirwin 1992; Oliver 1996; Spinelli and Canavos 2000). Destination management decisions regarding public spaces (i.e., beach environment, transportation, accessibility, etc.), or private decisions in hospitality services design (i.e., restaurant, room facilities, availability of leisure activities), are commonly and increasingly relied on tourist self-reported surveys measuring satisfaction. The regular questionnaires employed, using Likert-type scales, asks tourists their level of satisfaction about the destination or a particular aspect of the experience at a resort.
However, the interpretation of these measures of tourist satisfaction can be misleading because the potential incomparability that usually emerges when different people who even understand and feel the same internal satisfaction respond to a given neutral question in different ways. For instance, a very common finding in these studies is that regardless the dimension of the experience considered, a nontrivial portion of respondents always reports extreme positive values to all the items while another relevant portion always reports average or extremely negative values. This issue is known as response-style effect (Calantone and Sawyer 1978; Dolnicar and Grün 2007, 2009; Dolnicar 2007) or scale perception bias (Araña and León 2012a; Leon, Araña, and de Leon 2013a, 2013b). This problem becomes more relevant in the case of international tourism, since the same resources—for example, beaches, landscape, accommodation, and infrastructure—can be shared by tourists from different nationalities, cultures, and interests.
Making self-reported measures of tourist satisfaction more comparable requires new tools for both collecting and analyzing survey data (Campo-Martínez and Garau-Vadell 2010; Taplin 2011; León, Araña, and Melián 2003). There is a need of a new scale in order to facilitate a measure that allows for a valid and reliable assessment of satisfaction in different contexts (Martin and O’Neill 2010; McMullan and O’Neill 2010). In this article, we explore whether the response style or scale perception bias can be dealt with by utilizing the technique of anchoring vignettes (King et al. 2004). The anchoring vignettes technique can be seen as a new component of survey instruments that can be used in conjunction with the extended statistical models to position self-reported responses on a common cross-cultural and interpersonally comparable scale in tourism satisfaction studies.
The use of this methodology allows researchers (1) to test for scale response bias in the responses to tourist satisfaction questions across individuals and (2) to correct for differences in scale perception across tourists enhancing the validity and reliability of the tourist satisfaction studies in international destinations. The data come from an ad hoc survey to 1857 tourists visiting the Canary Islands in the summer of 2010. The results show that tourists from different countries do answer in different ways when responding to the satisfaction surveys. That is, respondents from different countries do utilize different response styles and scales when evaluating the satisfaction received from the overall visit to the destination and the enjoyment of its attributes.
Literature Review
Response Bias and Response-Style Effects
Response bias can be defined as “a systematic tendency to respond to a range of questionnaire items on some basis other than the specific item content (i.e., what the items were designed to measure)” (Paulhus 1991). From an empirical perspective, the existence of a response bias is not a relevant issue except for when individuals display this behavior consistently across time and situations. In these cases, this effect is called response style (Jackson and Messick 1958; Wiggins 1973; Paulhus 1991) or scale perception bias (Araña and León 2012a; Leon, Araña, and de Leon 2013a, 2013b) and may seriously mislead results and management policies based on the analysis of the raw data sets.
The main implication of the existence of response styles behavior in the survey is that the raw analysis of the responses may confound an individual’s response style (i.e., the way the scale is interpreted) with the content variable (i.e., the way the product/service is perceived). This effect spuriously increases standard deviations and distorts correlations among the variables under study (Dolnicar and Grün 2009). For instance, respondents favoring high, low, or average scores while responding to satisfaction questions may involve systematic biases, leading to higher but false correlations. In general, it can be said that response-style effects lead to biased results in any econometric analyses based on correlations.
The most common types of response style effects are the extreme response style (ERS) (when respondents mostly use the extremes of the scales as strongly agree or strongly disagree); the acquiescence response style (ARS) (when respondents use the positive range of the scale and avoiding negative ones); the midpoint responding (MPR) (when respondents try to avoid the extremes and responses are concentrated in the middle of the scale); and the socially desirable response style (SRS) (when respondents tend to answer trying to make themselves look good in terms of prevailing cultural norms). 1
Response Styles and Tourism Satisfaction
Although individuals may differ in their response styles, the most critical issue for tourism satisfaction studies comes from the extensive evidence in the social psychology and marketing literature showing that groups of respondents coming from different cultures display different response styles (Chun, Campbell, and Yoo 1974; Hui and Triandis 1989, among others). In a nice review of the literature on satisfaction survey practices, Dolnicar, Grün, and Le (2008) concluded that respondents from different cultural backgrounds tend to use survey answer formats in different ways.
Nevertheless, the existence of response styles (or scale perception bias) can explain the paradoxical findings that have been reported in the analyses of tourist satisfaction that compare satisfaction levels across groups of tourists with different cultural backgrounds or nationalities (Brislin 1970; Chen, Lee, and Stevenson 1995; Danaher and Arweiler 1996; Greenfield 1997; Heine, Takata, and Lehman 2000; Millán and Esteban 2004). The differences between tourists in their responses to satisfaction levels can also be explained as resulting from their identification with different reference groups (Hyman 1942; Latane and Darley 1970) that can result in different reported satisfaction levels, even when there is no real difference in satisfaction perception. This difference can be induced by different approximations to report experiences and facts (Festinger 1954; Latane and Darley 1970; Baldwin and Holmes 1987).
As Petrick and Backman (2002) highlight, “The dominant conceptual model in the satisfaction literature is the disconfirmation of expectations paradigm, in which satisfaction is a function of an initial standard or reference point and some discrepancy from the initial reference point. According to his model, feelings of satisfaction arise when consumers compare their perceptions of a product’s performance to their expectations.” An additional problem is that tourism attributes are ambiguous in their character (Petrick and Backman 2002; Neal and Gursoy 2008). Most studies on customer satisfaction take a general standpoint and do not consider segment-specific differences in attribute importance and previous references such as personal or cultural variables (Matzler et al. 2008).
Ryan and Cessford (2003) claim for changing questionnaire constructions in order to get a simple harmonized questionnaire format that could be useful for a tourist information system. The main implication of incomparability of measurement scales of tourist satisfaction research is that self-reported measures might mislead management in the absence of proper adjustments for differences in scale perception (Volkmann 1951; Biernat, Manis, and Nelson 1991). In addition, standard factor analysis (FA), principal components analysis (PCA), and correlations between satisfaction and other variables such as image, loyalty, and behavioral intentions (Yu and Goulden 2006), as applied to satisfaction responses widely employed in the tourist literature, may be misleading if the responses are not previously corrected for differences in scale perception across tourists (Dolnicar 2004; Andriotis, Agiomirgianakis, and Mihiotis 2008; Leask 2010).
Tourists from different countries place different levels of importance to the attributes of the tourist service. These differences result in variations of the level of satisfaction and they must be analyzed (Žabkar, Brenčič, and Dmitrović 2010). Cultural differences in tourists’ profiles have been reported to influence their perception and evaluation of the attributes and activities posed by destinations (Pizam and Sussman 1995; Dimanche 1994; Berry and Ladkin 1997; Winsted 1997; Busby and Klug 2001; Tasci and Knutson 2004; Hudson, Wang, and Gil 2011), as well as the image perceived and formed as a consequence of the tourist experience (Moore, Cushman, and Simmons 1995; Waitt 1996; Sirgy 1982; Moreno and Ritchie 2009). Different cultures are expected to have different levels of expectations and perceptions references in terms of service perception (Tasci and Boylu 2010). Cultural differences have also been found to be an important factor in the formation of self-image across tourists, and in the role that the congruity between self-image and destination image plays in the process of choosing a particular destination (Chon 1992; Sirgy and Su 2000; Litvin and Goh 2002; Kastenholz 2004).
Differences in Response Styles and Differences in Perceived Satisfaction
Tourist satisfaction research faces the challenge of distinguishing between differences in tourist self-ratings that are due to actual satisfaction differences, and those differences that are due to varying cultural norms in interpreting and reporting the satisfaction scale. That is, the difficulty stems from the possibility that tourists apply different internal standards of response category when answering questions about their satisfaction using Likert-type scales, with the various aspects of their tourist experience. This can happen even when their current satisfaction is identical. The methodology applied in this study allows for a distinction between actual satisfaction (internal evaluation) and differences in reported satisfaction (externally reported through the survey), “de-biasing” the original satisfaction scale and producing a final satisfaction report that allows comparisons between different tourists.
Tourist researchers generally put effort when dealing with multicultural differences in tourist responses by improving survey questions (Fornell et al. 1996; Breiter and Woods 1997; Tribe and Snaith 1998). Some ways of implementing this are by designing careful question wording in the implementation of pilot surveys and focus groups, translating and back-translating questionnaires, cognitive debriefing, and other techniques utilized to improve survey questions (King and Wand 2007). However, in spite of these methodological efforts, tourists may still interpret response scales of satisfaction in different ways such that they end up limiting useful comparability results between groups of tourists. For instance, different expectations of destination satisfaction can lead to differences in the levels at which tourists change from using one response category to the next, that is, differences in response category cut points.
As an empirical example of this issue, we find that most satisfaction surveys implemented in the Canary Islands show that tourist from Spain and Germany report similar satisfaction levels. However, these values are poorly correlated with some key management variables that are supposed to be explained by satisfaction, that is, destination loyalty (higher level of repeating visits to the destination), propensity to recommend the destination to families and relatives, expenditure in the destination (after correcting for other covariates like income, age, employment, etc.). In other words, while reported satisfaction levels are statistically very similar, German tourists present higher levels of destination loyalty, expenditure, and propensity to recommend the destination than Spanish tourists. One possible explanation to these inconsistencies come from the fact that these responses may be directly incomparable, because individuals have different response category cut points. Not identifying these differences would result in incorrect managing decisions. Managers and policymakers would need comparable harmonized results between nationalities to proceed.
Several methodologies have been proposed in order to account for potential response styles in surveys. For instance, some authors have proposed to correct for potential response-style bias by using individual-specific statistics like standard deviations (Chun, Campbell, and Yoo 1974), or the proportion of extreme responses. Often data are corrected by using country-specific measures in addition to individual measures (Dolnicar, Grün, and Le 2008). When correction methods are used, researchers can compare the results of the analysis using both the original and the corrected data sets (Dolnicar and Grün 2009). Any significant difference between results can be attributed to response-style effects and is likely to bias the results. 2
However, the validity of these measures crucially depends on several implicit assumptions such that the items are uncorrelated, present similar extreme response proportions, and that the mean responses should be close to the midpoint of the scale (Greenleaf 1992). These assumptions are often hard to meet by customer surveys in general, and tourism satisfaction surveys in particular. In this article, we explore a complementary methodology based on the use of anchoring vignettes.
Anchoring Vignettes
The technique of anchoring vignettes should be seen as a complementary approach rather than as a substitute of conventional qualitative survey design techniques aimed at carefully understanding tourist interpretation of questions, wording, and survey scenario. Vignettes in tourist satisfaction questionnaires describe hypothetical tourists who have different levels of expectations about the destination and variously interpret the different response categories. By asking about their own self-assessment of satisfaction and an assessment of the neutral satisfaction that the respondent would expect for the tourist described in the vignette, researchers can correct for differences in scale response across respondents to the tourist satisfaction questions.
Vignettes facilitate to identify the tendency to evaluate situations by nationalities (e.g., propensity to give low or high scores) and incorporate this knowledge to correct the traditional satisfaction Likert-type scales’ results. For instance, in the example comparing Germans’ and Spaniards’ satisfaction levels introduced above, the Results section will show that Spanish tourists systematically rate vignettes higher than Germans, which provides a natural explanation for the observed inconsistencies between reported satisfaction levels and behavior and intention variables. Moreover, by combining the information obtained from the self-reported and vignettes satisfaction questions in a statistically efficient way, the resulting satisfaction scale can provide more accurate predictions (higher correlation levels) of key management variables such as destination loyalty and expenditure in the destination.
The methodology of anchoring vignettes has been successfully applied to interpersonal, intercultural, and between-countries comparisons in many applications in the social and political sciences (see King et al. 2004; Kapteyn, Smith, and Van Soest 2007; Leon, Araña, and de Leon 2013a, 2013b), including assessments of health status, state effectiveness, HIV risk, school community strength, work disability, and perception of corruption. 3
Methods
Anchoring vignettes is a technique that allows researchers to compare responses across individuals that use different response scales. In surveys about the satisfaction levels received from the provision of tourist services and experiences, tourists are asked different questions aimed to elicit subjective assessments on the satisfaction that would be obtained by hypothetical individuals described in a set of proposed vignettes. This technique is especially advisable for the tourism industry, where the tourist experience and image are key topics, and where the frequency of use of the service is sporadic (Millán and Esteban 2004). However, anchoring is a reference applied in just a few occasions in the tourism academic analyses ( Pizam 1999; Tynon and Chavez 2006).
In the case of tourism satisfaction research, tourists are usually asked in a survey the self-assessment question of “How would you rate the level of satisfaction that you have experienced during your holidays?” The tourist is usually asked to answer in a scale from 1 to 5, where 1 stands for “not satisfied at all” and 5 “very satisfied.” The problem, as it has been described before, is that different individuals could answer differently to the same level of satisfaction, based on different cultural backgrounds and its influence in reporting this satisfaction. The implication is that the assessment scale of self-satisfaction is used differently by individuals, although they might be interpreted in the same way, that is, tourists use different scales of satisfaction. This means that the answers are not homogeneous since tourists subjectively evaluate the same levels of objective satisfaction in different ways, that is, using different cut-off points. Thus, responses cannot be compared across tourists because they use different scales in their answers, and researchers might encounter response scale bias.
To deal with this problem, the technique of anchoring vignettes uses a set of vignette questions together with the self-assessment questions in the same survey questionnaire. The responses to the set of vignettes and the self-assessment questions allow researchers to correct for difference in response scales in what is called “differential item functioning” (DIF), which directly deals with the scale response bias. A vignette question describes a tourist experience personified by a hypothetical tourist, to which the tourist is asked to assess using the same scale that is used to evaluate the self-assessment satisfaction question. By posing tourists with a set of vignettes describing situations involving different levels of tourist satisfaction, it is possible to obtain information on the subjective scale that tourists are using when evaluating their own self-assessment of satisfaction with some aspect of their tourist experience or with their global trip experience.
For instance, one of the vignettes in our questionnaire of tourist satisfaction describes a situation as follows: Peter spent 10 days in the Canary Islands for a vacation very similar to yours. The weather was excellent during all his visit except for 2 rainy days.
The tourist was then asked to put himself in the place of Peter and to answer the following question in the same scale that used for the self-assessment of satisfaction (i.e., from 1 to 5): If you are asked what would be the level of satisfaction of Peter in this situation, what would be your answer?
The responses to alternative vignette questions (i.e., 2, 4, 6 rainy days during their stay) allow us to recalibrate the responses to the self-assessment of satisfaction. The necessary assumptions are (1) response consistency (i.e., that tourists utilize the same scale response for the self-assessment questions than for the vignette questions) and (2) vignette equivalence (i.e., that the levels of satisfaction represented by the vignettes are interpreted in the same way by all tourists). Thus, the scale response to the vignettes from one tourist or group of tourists can be used as a reference of cut-offs to rescale the distribution of the assessments of the other tourists across the sample. 4
Figure 1 illustrates the rescaling procedure that follows from the benchmark responses given by the answers to the vignette questions on hypothetical satisfaction levels. Considering only three vignettes, Figure 1 shows that German and Spanish tourists have the same levels of self-assessment satisfaction with their overall tourist experience (Self1 in the Spanish scale and Self2 in the German scale). However, Spanish tourists rate satisfaction from vignettes A, B, and C using a larger extent of the scale than German tourists. If one uses the responses to the vignettes by Spanish tourists to rescale responses to the German tourists, the result would be that the level of self-assessment satisfaction turns out higher for Germans than for Spanish tourists. Thus, even though both tourists report the same level of self-assessed satisfaction, in practice the use of different response scales leads to dissimilar levels of satisfaction once both responses are calibrated under a common scale.
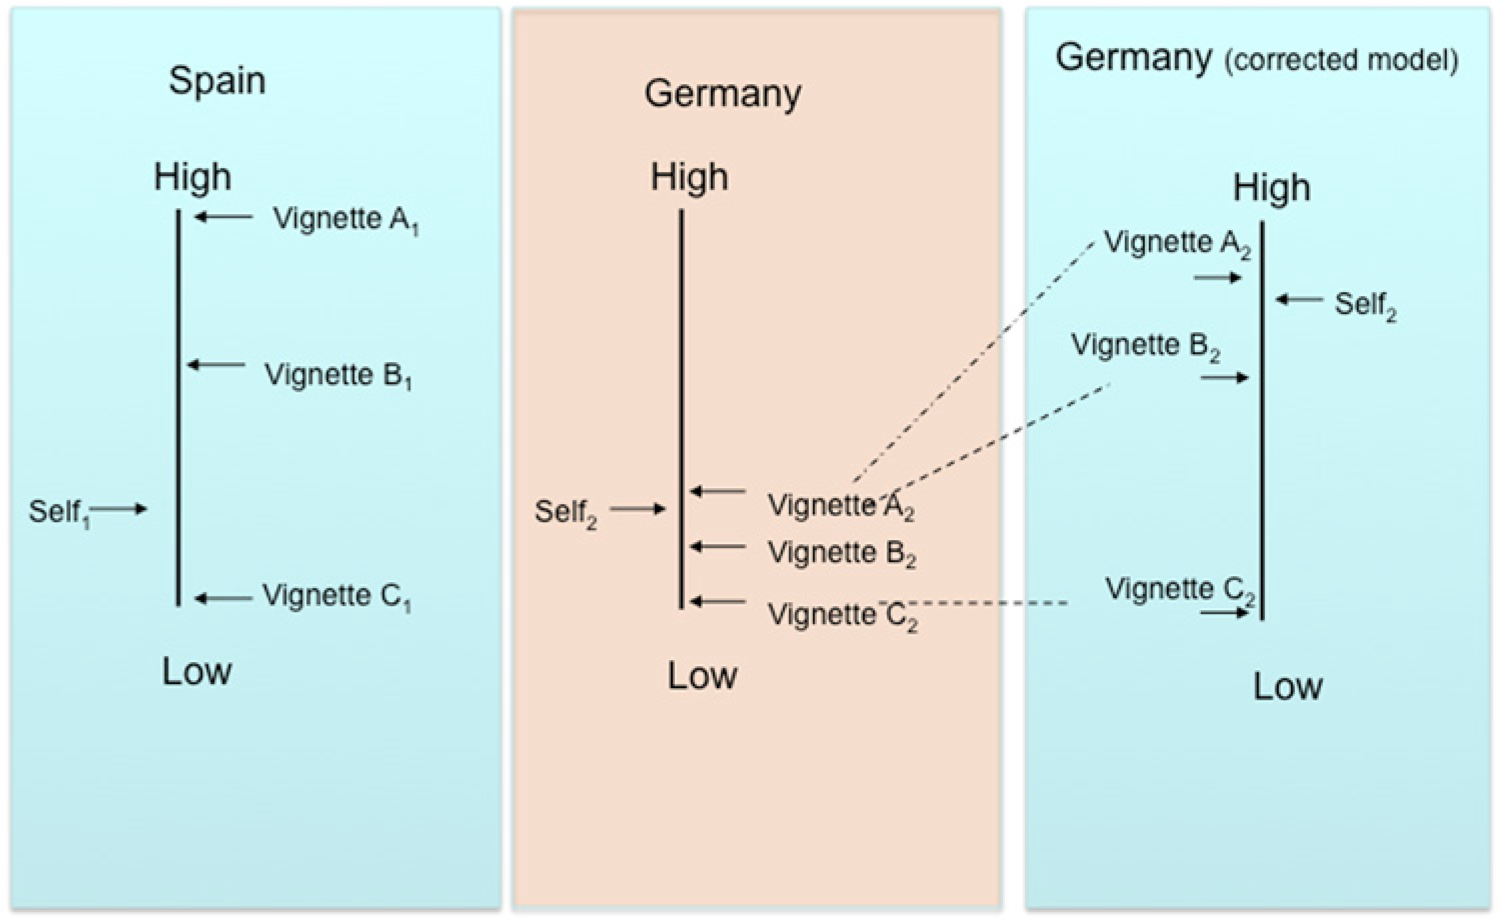
Vignette adjustments across countries.
Data
Data Collection
The data were obtained from a sample of tourists visiting the Canary Islands in the summer of 2010. The survey was aimed at measuring tourist satisfaction with the destination as well as their satisfaction about other aspects of their tourist experience. The definition of the questions included in the questionnaire was tested in two focus groups before the launch of the pretest study and the collection of the final sample. The focus groups were conducted with small groups of six tourists visiting the Canary Islands, randomly taken from the population of tourists in three of the main languages of the source countries: English, German, and Spanish. In addition, two pretest studies of 50 tourists allowed us to check for the proper functioning of the survey questionnaire according to the research objectives and to introduce small changes in the final design. Based on this extensive qualitative work, the vignettes were reshaped in order to satisfy the response consistency and vignette equivalence conditions.
The final sample was taken randomly from tourists from the population of tourists visiting the Canary Islands (Spain). In total, 1587 tourists were interviewed in person, in the airport when returning home, by professional interviewers previously trained in the specifics of the survey. The questionnaires were conducted in English, German, French, Spanish, Dutch, Italian, Swedish, Norwegian, and Danish.
The Questionnaire
The questionnaire started by asking the subjects about their opinion about a number of characteristics of the tourist destination and the services that they had received during their stay. Then, tourists were asked about their overall destination satisfaction. After this question of self-assessment, it followed questions referring to the vignettes for the satisfaction level that would be obtained by hypothetical tourists described in the vignettes.
Following these questions, the tourist was also asked about the level of satisfaction on seven dimensions of the tourist destination experience. For each dimension of tourist satisfaction, three additional vignette questions were posed to the tourist depicting hypothetical situations of tourist experience with respect to each domain. The dimensions and levels of the vignettes questions were as follows: (1) weather (2, 4, or 6 days of rain), (2) accommodation services (5 stars, 4 stars, 3 stars, or below accommodation rates); (3) beach congestion (4, 25, or 100 m2 per person); (4) leisure activities (high, average, or low availability of attractive leisure activities and theme parks); (5) landscape (higher, current, lower levels of preservation of natural landscapes); (6) infrastructure (high = less than 10 minutes on average to access interesting places, average = between 10 and 30 minutes, or low = more than 30 minutes); and (7) interaction with residents (high, low, or no interactions with residents).
These dimensions are commonly used to assess tourist destination perceptions (Echtner and Ritchie 1993). Specific wordings and visual aids for each nationality were employed after implementing three focus groups with representative groups of tourists, which helped to test and iteratively redefine the vignettes. Vignette names and order of presentation was randomized to avoid artificial demand effects.
Data Analysis
The data of the self-assessment of overall tourist satisfaction for the correction of the scale response bias using anchoring vignettes are based on a simultaneous equation approach that jointly models the self-assessment question and the responses to the vignette questions. The hierarchical ordered probit (HOPIT) model (see appendix), which is a generalization of the ordinal probit model, was used in this research (Murray et al. 2003; Rice, Robone, and Smith 2010). In this model, the cut-offs of the response scale utilized by the tourists are defined by categorical variables to be modeled as a function of covariates.
Results
Tourist Satisfaction by Nationality
Table 1 presents the results of the mean value responses by nationalities to the self-assessments of the seven dimensions of tourist satisfaction investigated in this study as well as for the overall satisfaction with the tourist visit. These are summary statistics for the questions on satisfaction without correcting for scale perception differences. It can be seen that there is some variability across source countries in terms of the overall satisfaction. The tourists with lowest satisfaction from their holidays were those from Germany while those with highest satisfaction were those from Spain, followed by UK tourists and tourists from Nordic countries (Finland, Sweden, Norway, and Denmark). All satisfaction levels were also near or above 4 in the Likert-type scale ranging from 1 to 5.
Mean Satisfaction Levels by Source Country (Likert Scale, 1-5).
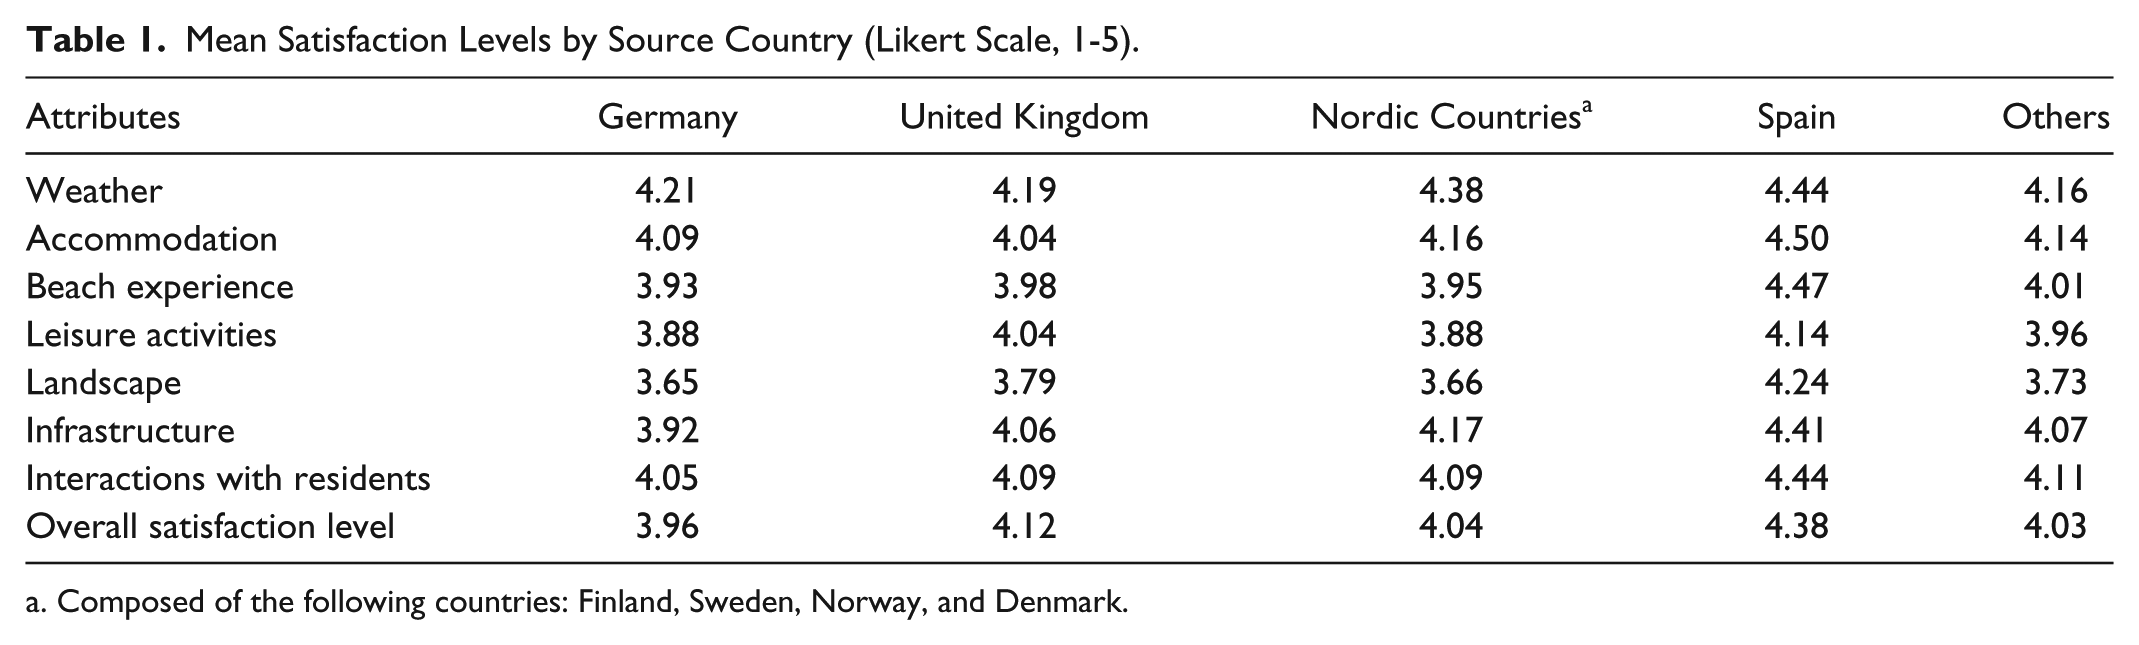
Composed of the following countries: Finland, Sweden, Norway, and Denmark.
The disclosure of the overall satisfaction level into the various components of the tourist destination experience also presents some variations across tourists from different source countries. Tourists from Spain experience highest satisfaction for all attributes evaluated, while tourists from Germany experience lowest satisfaction for all attributes but for the weather and the accommodation services. The weather is in general the most valued attribute by all source countries while landscape is the least valued attribute for tourists from Germany, the UK, the Nordic countries, and others. For tourists from Spain, the least valued attribute is the amount and diversity of leisure activities.
Therefore, it is clear that there might be some significant differences in the way that tourists assess their satisfaction from the various attributes and characteristics of the tourist destination that are also reflected in the overall satisfaction derived from their holidays. The question raised in this study is to what extent tourists from different groups or nationalities might be using different scales when assessing their satisfaction from the destination and from the various attributes of the tourist destination.
Testing Response Style Using Vignettes
There is a need to get more information about the differences in measuring satisfaction evaluation by tourists from different source countries. Table 2 presents the results of the mean assessments of the satisfaction levels that tourists expect from the subjects described in the vignettes for the various aspects of the tourist destination. Each tourist was posed with three alternative vignettes for each dimension of the holiday destination that are expected to reflect extreme points of low and high satisfaction according to a tourist’s judgment.
Average Satisfaction for Vignettes Sets by Country (This Allow Us to Test Potential Scale Perception Bias).
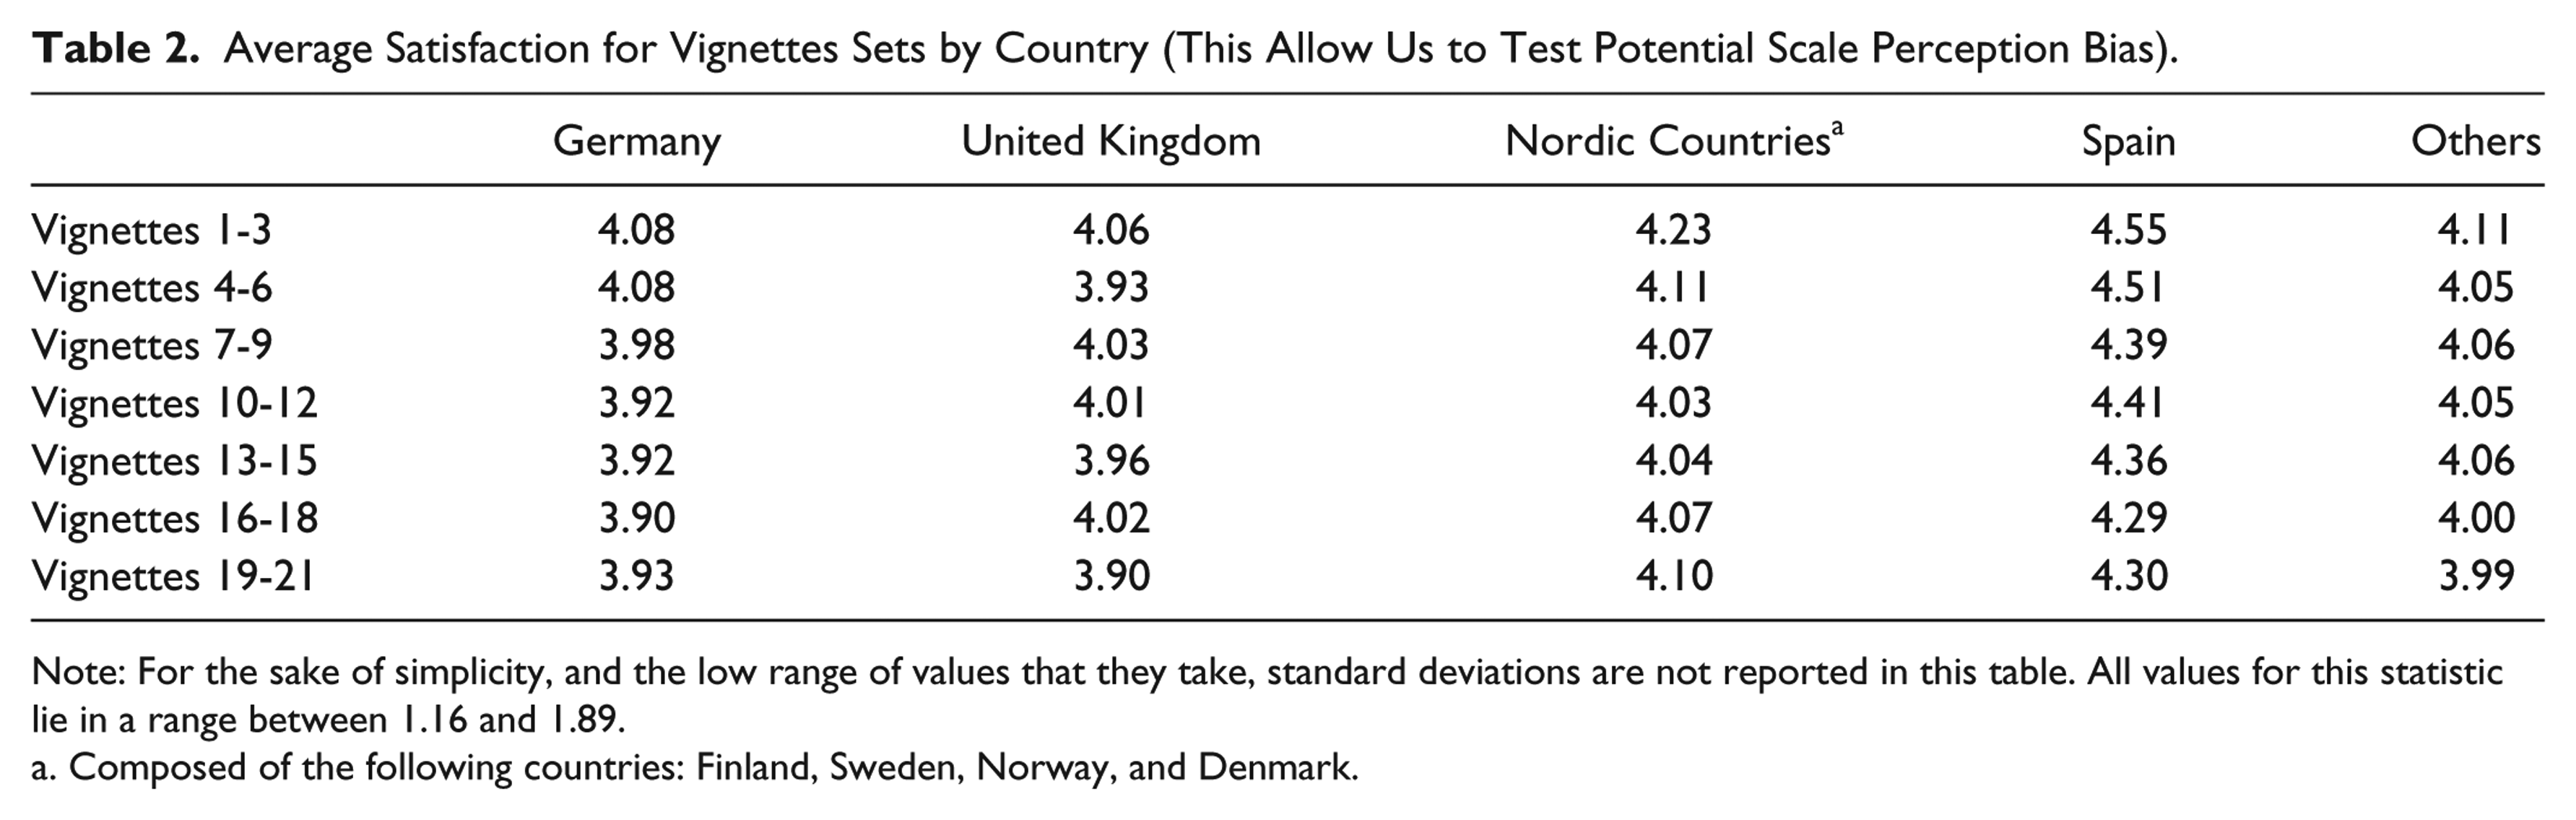
Note: For the sake of simplicity, and the low range of values that they take, standard deviations are not reported in this table. All values for this statistic lie in a range between 1.16 and 1.89.
Composed of the following countries: Finland, Sweden, Norway, and Denmark.
As can be seen in Table 2, tourists produced coherent rankings of the vignettes for each of the dimensions, since the mean value for the vignettes representing the subject with lower satisfaction was always lower than the mean value for the vignettes representing the subject with the higher satisfaction. Vignette equivalence requires that tourists’ responses be consistent with the ordering represented by the vignettes (Rice, Robone, and Smith 2010). The results seem to indicate that tourists consistently understood the scale represented by the vignettes. That is, tourists understood that there were different levels of satisfaction described by the vignettes, since the mean values of the satisfaction levels for the vignettes in each domain are ordered according to levels described by the vignettes. However, since the mean values of the vignette assessments are different between source countries, it implies that there might be differences in the response scales utilized by tourists.
Properties of the Vignettes
In order to ascertain the validity of the assumption of vignette equivalence, there is an evaluation of the percentage of respondents that gave an ordering of the vignettes consistent with the global ordering for each domain of the tourist destination attributes that are assessed in terms of satisfaction. These statistics are calculated by pooling all vignette responses across source country tourists and considering the average categorical response for each domain of the destination attributes.
Table 3 presents the results of the percentages of consistent orderings by destination attributes and tourists’ source country. The percentages are all greater than 70%, meaning that the large majority of tourists ordered the vignettes in the right order. For each attribute, there was some variation in the percentage of consistent orderings across source countries. The maximum rate was 93% for the attribute of interaction with residents for the UK tourists. The “other countries” group shows the smaller percentage of consistent orderings, but is all higher than the 70% benchmark. Thus, these results give support to the assumption of vignette equivalence. Figure 2 discloses this information in the proportion of rank inconsistencies by country. It can be seen that the proportion of respondents with 1 or more inconsistencies is quite small for all the countries.
Percentage of Consistent Ordering by Vignettes and Countries.
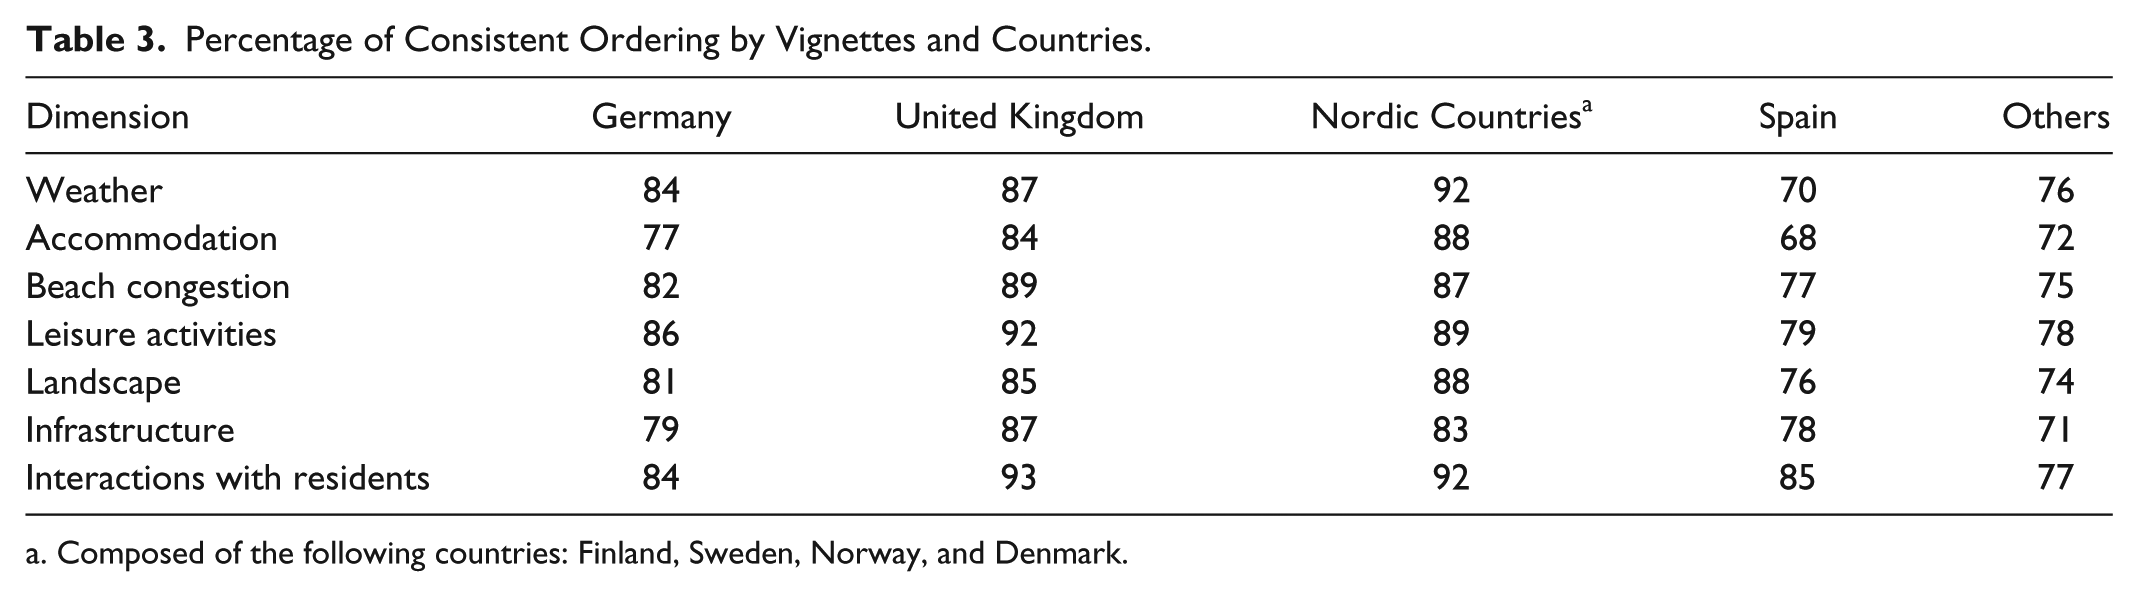
Composed of the following countries: Finland, Sweden, Norway, and Denmark.
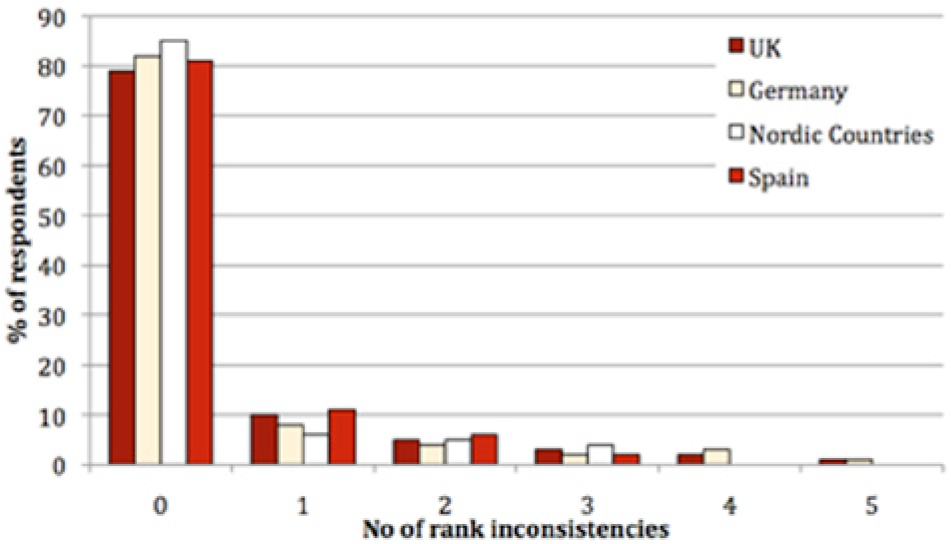
Distribution of respondents by number of rank inconsistencies in vignette ratings across countries.
In addition, the vignette equivalence assumption can be also evaluated by considering the Spearman Rank Order Correlation Coefficient (SROCC) between the vignettes rankings of each respondent and the global ordering. This allows us to evaluate if an ordering is consistent with the global ordering of vignettes. Table 4 presents summary descriptive statistics for SROCC for each of the source countries considered in this study. Rice, Robone, and Smith (2010) pointed out that measurement errors might occur if there is a large number of different SROCCs in each attribute, and if there is a small number occurring with large frequency.
Spearman Test: Consistency of Vignette Orderings and Average Rank Correlation Coefficients by Country.
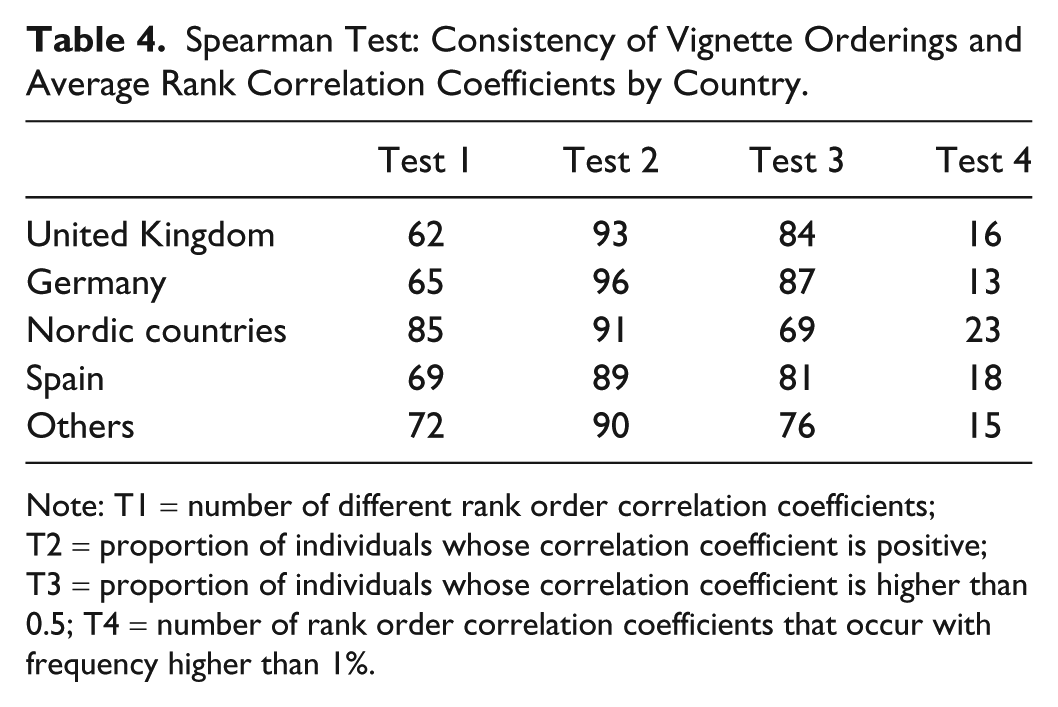
Note: T1 = number of different rank order correlation coefficients; T2 = proportion of individuals whose correlation coefficient is positive; T3 = proportion of individuals whose correlation coefficient is higher than 0.5; T4 = number of rank order correlation coefficients that occur with frequency higher than 1%.
As can be seen in Table 4, the number of SROCCs occurring with a frequency of more than 1% (T4) is less than 23 for the tourists of all source countries. The proportion of tourists with positive correlation coefficient (T2) is also higher than 89% for all source countries, with German tourists showing the largest proportion (96%). The proportion of tourists with correlation coefficient above 0.5 (T3) shows the lowest value for the tourists of the Nordic countries, at 69%. In addition, the number of different SROCC (T1) is also small for the size of the sample considered.
Correcting for Response-Style Effects: The HOPIT Model
The DIF hypothesis in measuring tourists’ satisfaction across source countries can be assessed by considering a hierarchical ordered probit model. This model has two equations: (1) a responsiveness equation that models self-assessment answers of satisfaction as a function of tourists’ covariates and (2) a set of reporting behavior equations that model each of the thresholds derived from the Likert scale, or cut-offs, as a function of covariates.
This general model can be compared with a restricted version that does not account for DIF, and that follows by setting the parameters for the covariates that explain the thresholds or cut-offs to zero. The comparison between the HOPIT model and the restricted model allows us to determine whether the cut-off equations are valid in explaining the self-assessment of tourists’ satisfaction. If the restricted model is rejected, we can ascertain that there is DIF across the tourists’ source countries, or that tourists have interpreted the scale response of satisfaction differently.
The model has been estimated utilizing socioeconomic variables that were significant in explaining the responses to the corruption assessment questions. Table 5 presents the description of the relevant explanatory variables while Table 6 presents the results of the estimated hierarchical ordered probit model (last two columns) and the restricted model. The first two columns show the results of the restricted model that does not account for DIF, that is, the model that sets the parameters explaining the threshold equations to zero.
Description of the Explanatory Variables in the HOPIT Model.
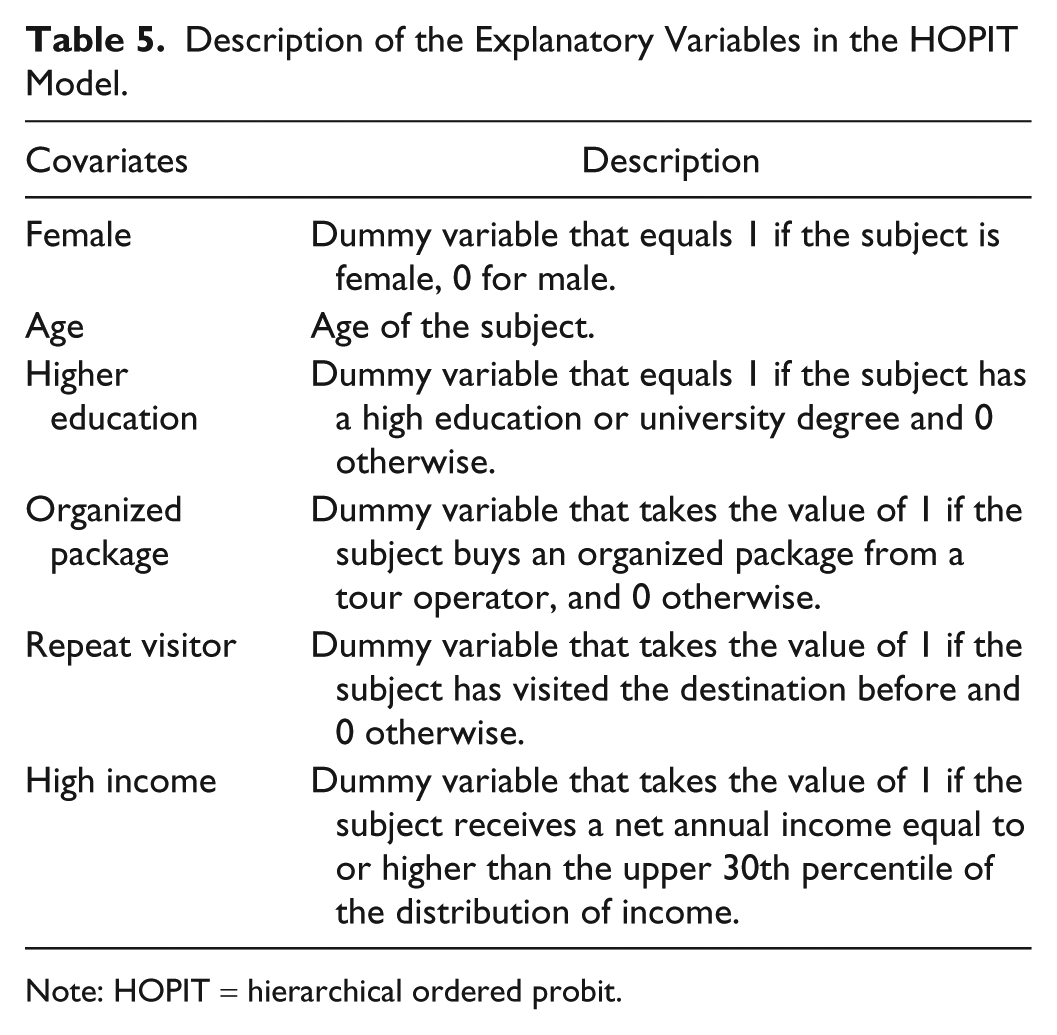
Note: HOPIT = hierarchical ordered probit.
Estimation Results of the HOPIT Model.
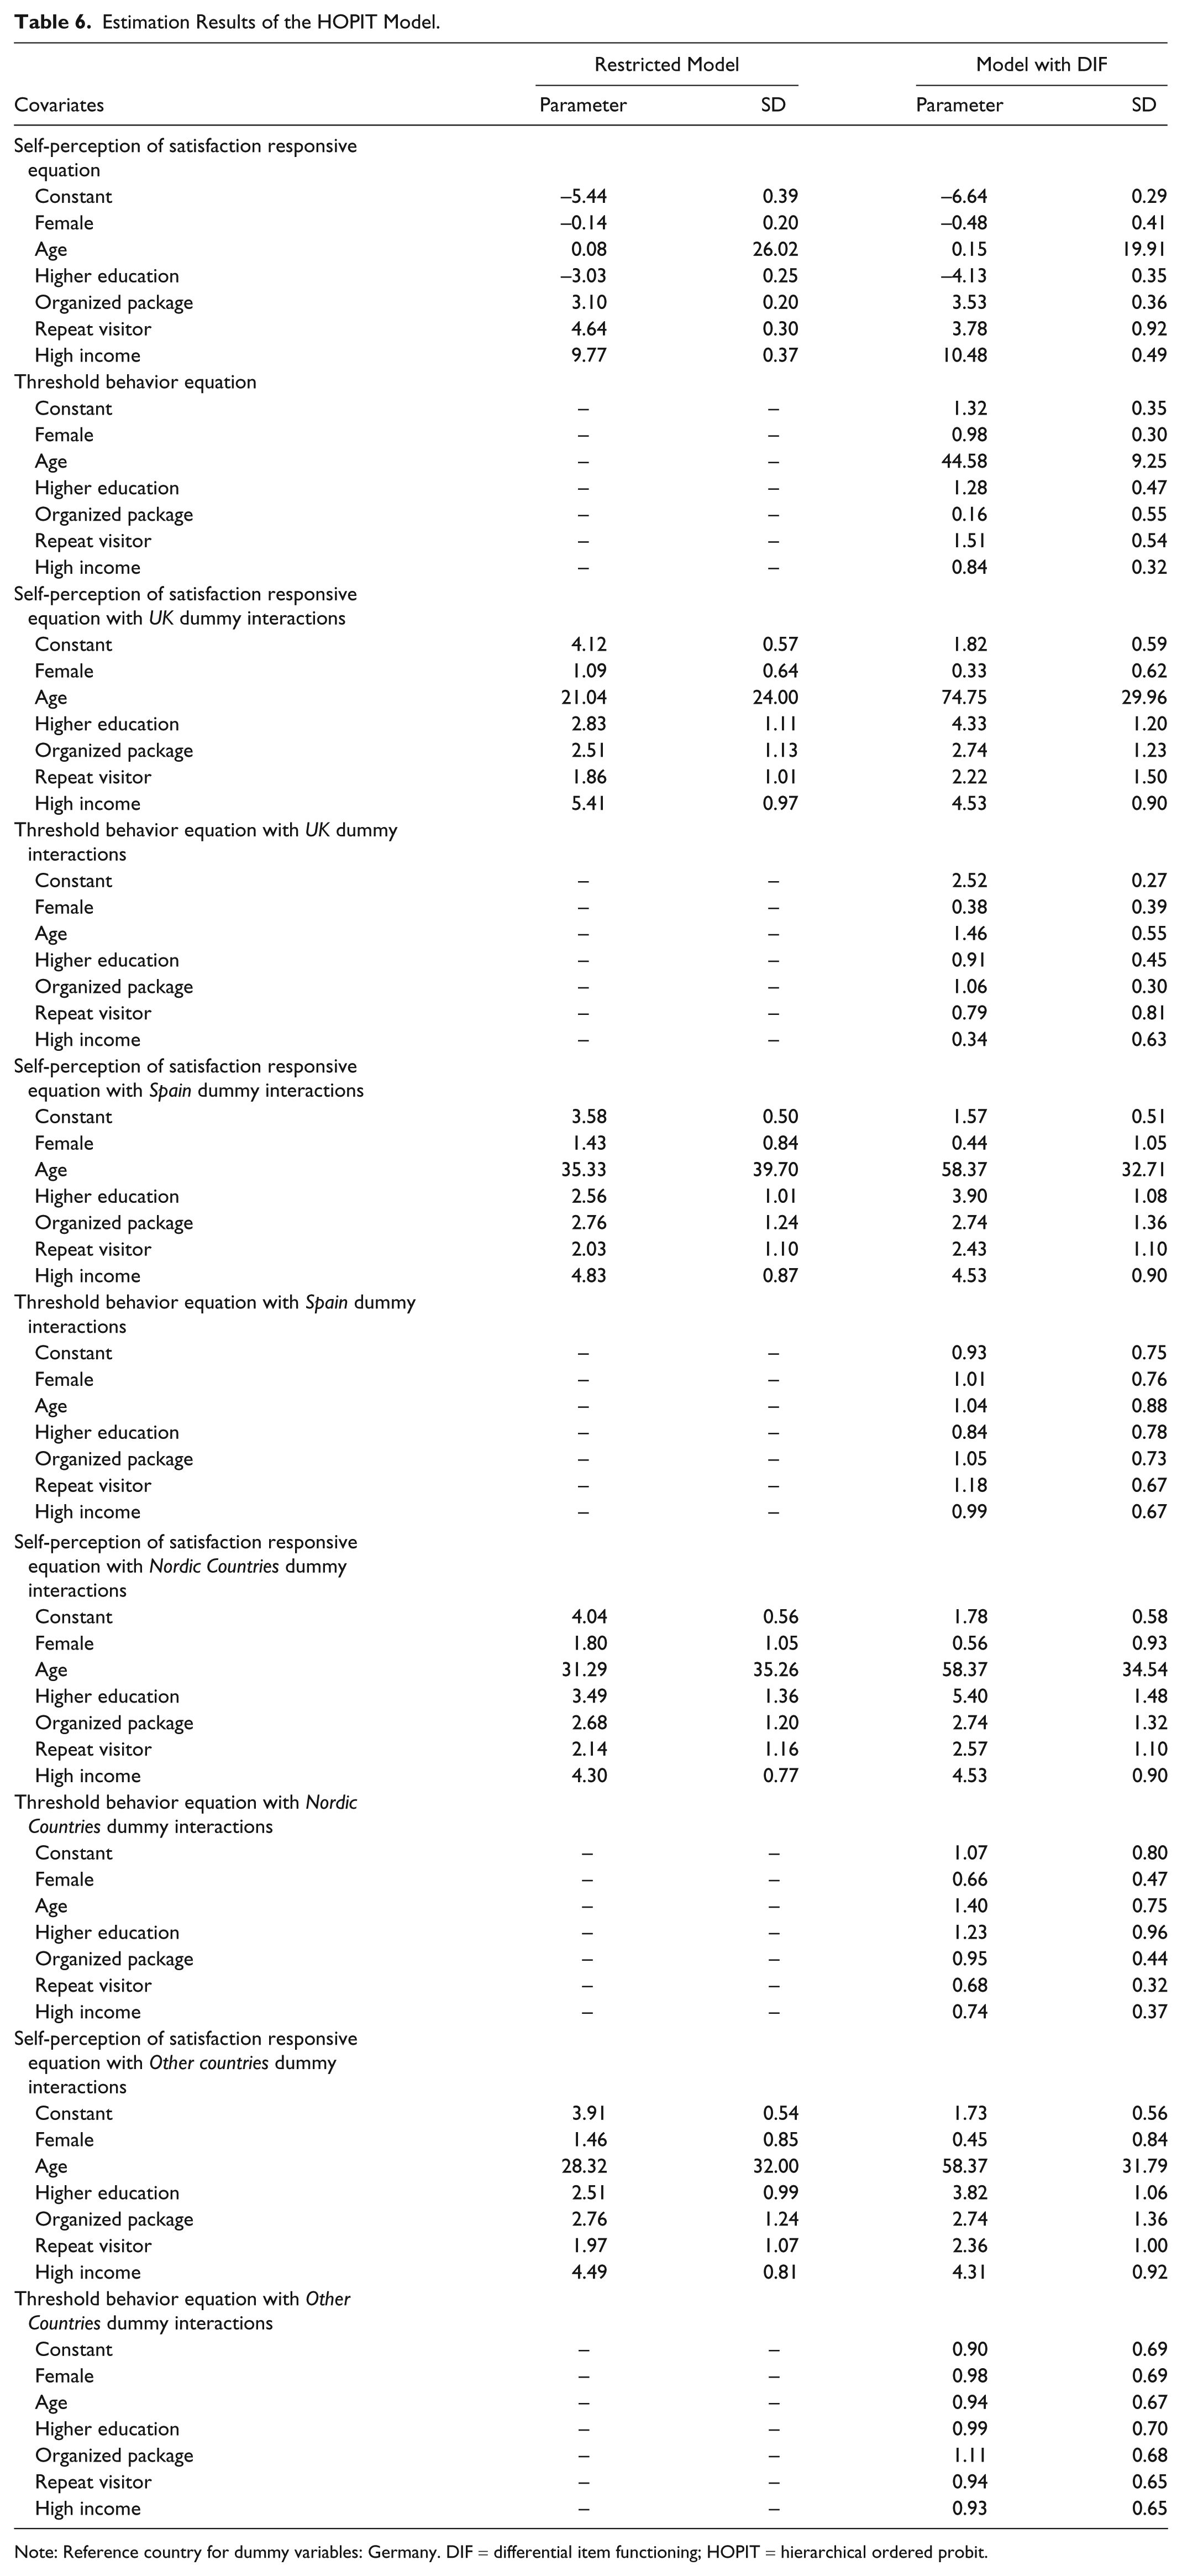
Note: Reference country for dummy variables: Germany. DIF = differential item functioning; HOPIT = hierarchical ordered probit.
Germany has been taken as the baseline while appropriate interacting dummies for the explanatory variables have been incorporated for the United Kingdom, the Nordic countries, Spain, and the group of “other countries.” If these interacting dummies are significant then there are differences in the self-assessment of tourist satisfaction across source countries, as the results in Table 1 indicated.
The results of the restricted model (model without DIF) show that tourist satisfaction is larger for tourists who travel under organized package tours, are repeat visitors, and belong to a high income level. In addition, those tourists with a high education level show a lower level of satisfaction with their holidays, since the estimated parameter for this variable is negative for tourists from Germany. According to the restricted model results, the level of satisfaction is not significantly affected by the gender and the age of the tourist.
The interacting dummies for the other source countries reveal that socioeconomic variables have a larger effect for tourists coming from the United Kingdom, the Nordic countries, Spain, and the rest of countries, since the parameters are positive and significant but for the dummy for higher education, that changes in sign. That is, for non-German tourists the characteristic of higher education has a lesser negative impact on satisfaction than for German tourists. On the other hand, the gender effect is significant only for tourists from Spain and is not significant in the other responsive equations.
The last two columns in Table 6 show the results of the estimation of the unrestricted hierarchical ordered probit model in which vignette thresholds are modeled as a function of covariates. The threshold equations are presented only for the first threshold, since there were no significant differences in the results for the equations of the rest of thresholds. Considering the responsiveness equations, the impacts of socioeconomic variables are larger in the model with DIF than in the model without DIF, for all the source countries. In addition, the age of the tourist becomes significant for tourists from the United Kingdom and Spain at the 0.05 levels; that is, those tourists with higher age show a larger satisfaction level with their vacation. Thus, the model without DIF underestimates the impact of socioeconomic characteristics on tourist satisfaction across source countries. In addition, a likelihood ratio test strongly rejected the model without DIF in favor of the model that allowed for difference response scale according the responses to the vignettes of tourist satisfaction.
Considering threshold behavioral equations, the results in Table 6 show that there are a number of variables that are significant in explaining the differences in response scale across tourists from different countries. For German tourists (baseline in the model), the first threshold of tourist satisfaction is higher for subjects with higher age and higher education and who repeat the visit, since these are the variables that turned out to be significant in the baseline threshold equation. For the other source countries, estimation of the country dummy interactions for the threshold equations show that tourists from the United Kingdom with higher age, higher education, and who travel in organized packages presented a larger value of the first threshold than tourists from Germany. This is also the case for tourists from the Nordic countries that have higher age, travel in organized packages, repeat visit, and have higher income. The dummy interaction effects for tourists from Spain and from the “other countries” are not significant, revealing that there are no significant response scale effects for these tourists.
Thus, the estimation of the interacting dummy variables for the threshold equations reveal that there significant response scale effects across tourists from the United Kingdom and the Nordic countries with respect to the other nationalities considered in this study. That is, the response scale of tourist satisfaction is not utilized in the same way by all tourists who have been asked to assess their satisfaction with the tourist vacation, with tourists from the United Kingdom and the Nordic countries showing a higher threshold than tourists from the other nationalities. These results indicate that there might be response scale bias if the self-assessments of tourist satisfaction evaluations if the reported tourists’ responses are not corrected for DIF.
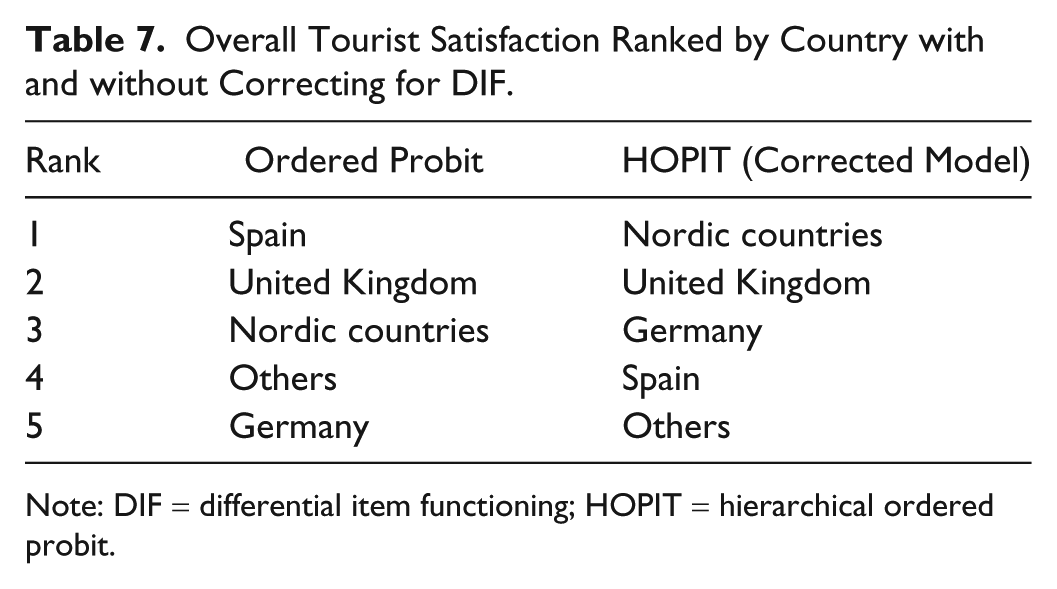
The correction for DIF can be accomplished by using the nonrestricted HOPIT model estimation results, with allows us to calculate the simulated levels of tourist satisfaction considering the differences in the thresholds used by tourists from different source countries. Table 7 presents the results of the simulated means of the levels of satisfaction for both, the model that correct for DIF and the restricted model that does not allow for DIF (ordered probit model).
Overall Tourist Satisfaction Ranked by Country with and without Correcting for DIF.
Note: DIF = differential item functioning; HOPIT = hierarchical ordered probit.
It can be seen that the model without DIF ranks the level of satisfaction of tourists from the source countries in a similar way as the ranks obtained from the sample mean statistics of the responses to the questions of satisfaction (Table 1). That is, tourists from Spain present the highest satisfaction levels from the vacation followed by tourists from the United Kingdom, the Nordic countries, “other countries,” and Germany. However, once the scale response is corrected for DIF, the simulated results of the mean satisfaction levels leads to a change in the ranking of the different countries. The corrected DIF results that follow from the simulated HOPIT model show that the tourists from the Nordic countries present the largest satisfaction levels followed by tourists from the United Kingdom, Germany, Spain, and the group of “other countries.”
Hence, once the response scales utilized by tourists from different countries in their self-assessments of their satisfaction levels are harmonized utilizing the simulated threshold equations of model, there are important differences in the relative comparisons of the satisfaction levels across source countries. If tourists from Germany performed as the lowest satisfaction levels with the raw data, once their responses are corrected by DIF, their satisfaction levels become third in the rank of tourist satisfaction across source countries. Similarly, for the Nordic countries, since they use a larger threshold for the responses to their satisfaction levels, once corrected by DIF they pass from the third position in the rank to the first position.
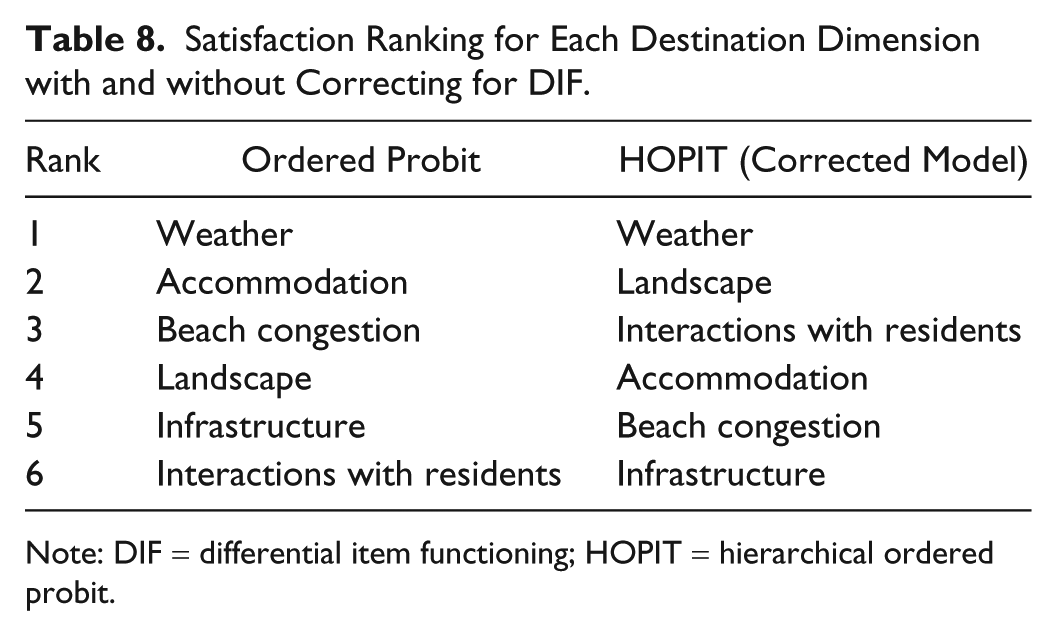
The simulated HOPIT model can be also utilized to derive the DIF-corrected levels of satisfaction derived from the six dimensions of destination attributes considered in this study. Table 8 presents the results of ranks of satisfaction for the dimensions of the destination for both the ordered probit model (restricted) and the HOPIT model applied to the responses of the dimensions of tourist satisfaction and the corresponding vignettes. For the restricted model, the estimation results are similar to those obtained with the raw data on mean satisfaction, showing that the dimension with highest rank in satisfaction is the weather, followed by the accommodation services, the beach experience, the landscape, the infrastructure, and the interactions with residents.
Satisfaction Ranking for Each Destination Dimension with and without Correcting for DIF.
Note: DIF = differential item functioning; HOPIT = hierarchical ordered probit.
Once the assessments of the dimensions of tourist satisfaction are corrected for DIF using the HOPIT model, the ranks of the dimensions changed substantially but for the weather dimension, as can be seen in Table 8. That is, the weather continues to stand as the attribute providing the highest satisfaction to tourists, but this is followed by the landscape, the interaction with residents, the accommodation services, the beach experience, and the infrastructure. Thus, the correction for DIF leads to different relative satisfaction levels provided by the dimensions of the destination, with a better performance of the landscape and the interaction with residents that pass from the lowest levels in the ranking to occupy the second and third position. The accommodation service was placed second in the ranking of the raw data but passed to occupy the fourth place in the rank once correction for DIF was carried out.
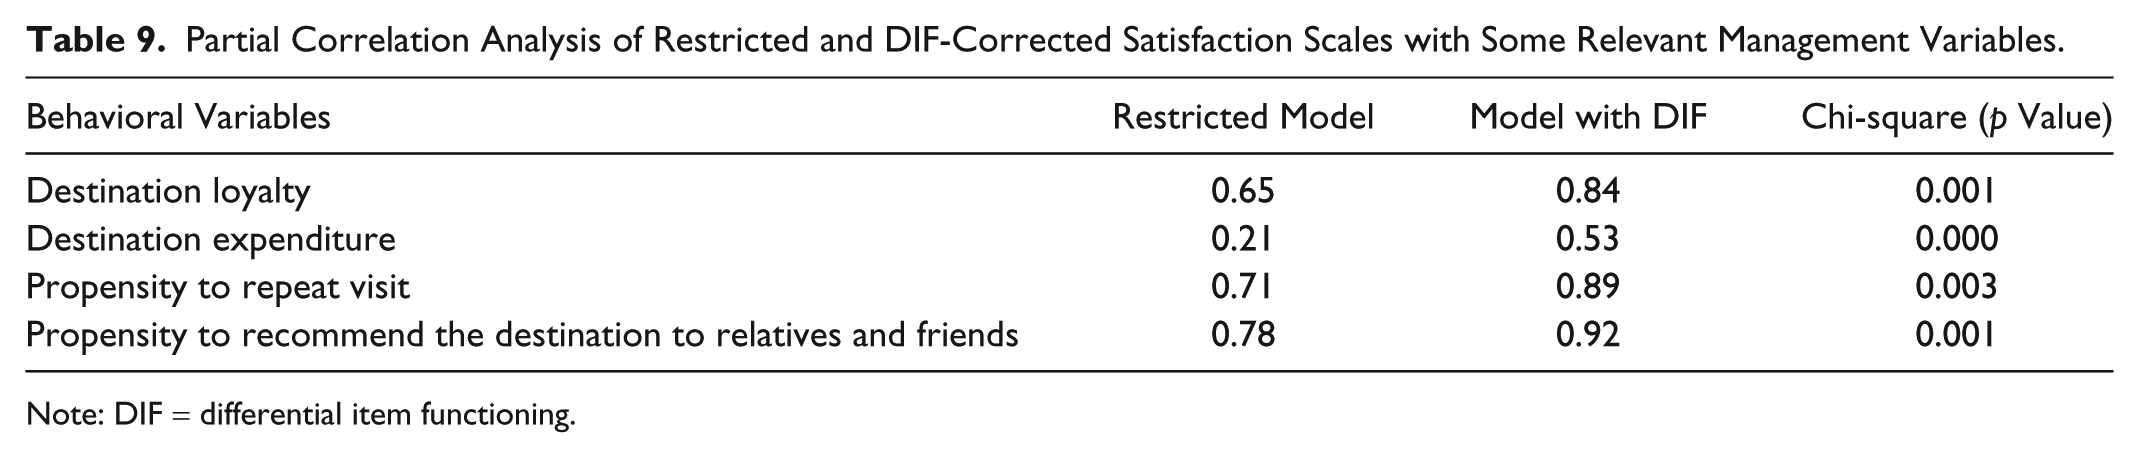
Although the construction of a detailed robust analysis of management variables like “Tourist Loyalty” or “Expenditure at the Destination” are beyond the purpose of this study, a partial correlation analysis was implemented in order to explore the properties of the standard and the DIF-corrected satisfaction scales to explain key management behavioral variables.
Table 9 shows the results of these analyses. As can be seen, the chi-squared test rejected the hypothesis that conventional and DIF-corrected satisfaction scales provide the same ability to predict destination loyalty, expenditure in the destination, propensity to repeat visit, and propensity to recommend the destination to relatives and friends. More concisely, DIF-corrected satisfaction scale presents a correlation of 0.84 with destination loyalty versus 0.65 level of correlation with the standard satisfaction scale. Similar results are found for the rest of the variables. For the case of expenditure in the destination, the proportion raises from 0.21 (for the conventional scale) to 0.53 of the DIF-corrected scale. For the propensity to repeat the visit and propensity to recommend the destination, correlations rise from 0.71 to 0.89 and from 0.78 to 0.92, respectively. Thus, it seems that the use of the DIF-corrected scale is promising and it provides statistically significant improvements in the predictive ability of the elicited scale.
Partial Correlation Analysis of Restricted and DIF-Corrected Satisfaction Scales with Some Relevant Management Variables.
Note: DIF = differential item functioning.
Conclusion
Tourists receive satisfaction from their destination experience and from the consumption of tourist services offered by the attributes of tourist destinations. The information elicited from tourist satisfaction questions are commonly utilized for ex-ante design and ex-post assessment of tourist policies in a variety of contexts aimed at improving the level of satisfaction of different segments of tourists.
However, the interpretation of tourist satisfaction questions and scales can be different for individuals endowing different cultures and social backgrounds. The implication is that tourists can use different internal interpretation scales when answering satisfaction questions, leading to noncomparable satisfaction results across tourists. This leads to biased results in the assessments of tourists’ satisfaction, since the actual levels of satisfaction that tourists have from the tourist experience or attributes do not correspond to the ones elicited through the satisfaction questions.
The technique of anchoring vignettes allows researchers to deal with the potential fact that tourists utilize different internal interpretation scales in their responses to satisfaction questions. By questioning tourists about the satisfaction levels that would be obtained in hypothetical neutral situations described in vignettes, researchers can harmonize the different scales used by tourists, leading to comparable responses of the self-satisfaction questions. In the empirical application of this study, tourists were posed with questions referring to vignettes that described various levels of satisfaction for the tourist destination experience and a set of tourist destination attributes. The results provide support to the underlying assumption that tourists rank the vignettes levels of satisfaction in a manner that is consistent with the global ordering of the sample of tourists, and therefore there is equivalence of the scale used to assess the vignettes with the scale used to assess the self-assessment of satisfaction. This evidence indicates that tourists understood the underlying level of each neutral vignette in the same way, irrespective of their age, sex, education, and other characteristics.
The correction for DIF in the scale response used by tourists to the satisfaction questions is accomplished by simulating an estimated HOPIT model. The HOPIT model can be seen as a generalization of the ordered probit model in which the thresholds can be modeled as functions of individual characteristics. Therefore, HOPIT allows for threshold or cut-off heterogeneity across respondents (i.e., to consider different response styles) and to identify the determinants of the use of alternative response styles (i.e., cultural effects). The significance of the parameters explaining the threshold regressions reveals that tourists from the United Kingdom and the Nordic countries used different personal interpretation scales in their responses to the satisfaction questions than tourists from other nationalities. That is, these tourists showed a higher standard in the use of the assessment scales when answering their satisfaction questions, leading to lower values in the response data that were not corrected for the scale effect. The implication is that the relative satisfaction levels between the different nationalities changed as a result of the harmonization of the scales across tourists from different nationalities. Whereas German tourists ranked in the lowest level of satisfaction in the model without DIF correction (raw data), their satisfaction level moved to the third position when the scale was corrected for DIF. Thus, the correction of difference in scale response leads to substantially different implications about the relative satisfaction by different groups of tourists based on cultural and background differences.
The difference in the scales utilized by tourists when answering satisfaction questions might also have an impact on the relative assessment of destination attributes. Our evidence shows that when raw data are analyzed, tourists rank some attributes in different ways than when the data are corrected for DIF, that is, the response scale is harmonized by standardizing perceptions of satisfaction and adjusting self-assessment measures to account for variations in internal interpretation of cultural differences. Thus, the utilization of the anchoring vignettes methodology could provide more accurate assessments of the relative satisfaction of tourists from different segments and nationalities. Results highlight the importance of understanding the scale equivalence across languages and cultures.
There are some limitations in this research, because of understanding individuals from one nationality as sharing a similar culture, and some cultural differences among these tourists could be missed. Therefore, there is a need for further research that explores the implications that potential scale response bias might have in tourism studies that are concerned with market segmentation, quality assessments, marketing, and policy evaluation. Future research could try to differentiate between emotional and cognitive bias, expectation versus perception bias, and the impact on importance versus performance evaluation. Finally, applying this methodology to different segmentation criteria could help to improve its accuracy.
The main practical implications of this research are for policy makers and managers from tourist companies. This methodology, as a supplement survey, can be used from time to time to complement and correct the results obtained from traditional satisfaction surveys. Managers and politicians will be able to identify real differences in satisfaction (both general and applied to specific attributes) among tourists from different nationalities. By using a HOPIT model, this research shows that the scale perception bias can be successfully corrected by using the responses to the vignettes for a small portion of the sample. Thus, results will facilitate prioritizing investments and improving predictions of tourist’s future behavior (repetition, spending, etc.) that is affected by satisfaction. Further research is needed in order to identify the impact of response styles on several key issues related to touristic demand such as forecasting and market segmentation.
Footnotes
Appendix
Acknowledgements
We would like to acknowledge the support of projects BEC2000-0435, VEM2004-08558, and SEJ2005-09276 of the Spanish Ministry of Education. We also thank Sergio Moreno (Institute of Tourism and Sustainable Development [TiDES]), Larry Dwyer (University of New South Wales), and Brent Ritchie (University of Calgary) for providing remarks on earlier drafts that improved the paper and helped to shape the piece. Useful comments and discussion with the associate editor and three reviewers, Jordan Louviere, Joffre Swait, and Sara Dolnicar, and attendants to the seminars of Instituto TiDES at the Universidad de Las Palmas de Gran Canaria (ULPGC) and at CenSoc at University of Technology, Sydney (UTS) and helped to improve the piece. Only the authors are responsible for the opinions expressed and potential errors in the content.
Declaration of Conflicting Interests
The author(s) declared no potential conflicts of interest with respect to the research, authorship, and/or publication of this article.
Funding
The author(s) disclosed receipt of the following financial support for the research, authorship, and/or publication of this article: Financial support by the project ECO2009-12629 of the Spanish Ministry of Education and project 200801000381 of the Agencia Canaria de Investigación (ACIISI).