
Abstract
Looking at the current political turmoil across the globe, this study aims to analyze the effects of interaction between political instability and terrorism on tourism development using panel data from 139 countries for the period 1999–2009. The study measures the extent to which a country’s political conflicts and terrorism can negatively impact its tourism industry. The results reveal that the effect of political instability on tourism is far more severe than the effects of one-off terrorist attacks. Surprisingly, the findings suggest that terrorist attacks increase tourism demand for those low- to moderate-political-risk countries. However, countries that experience high levels of political risk witness significant reductions in their tourism businesses. In addition, political volatility and terrorism together can cause serious damage to the tourism industry.
Introduction
Tourism is an important sector that generates sources of tax revenue and alleviates poverty, especially in developing countries. However, this industry can easily deteriorate owing to any political and social unrest. For example, conflicts in the Middle East and North Africa in 2011 and the rise of terrorism have put a negative pressure on the international tourism industry. The monthly Saudi Tourism Outlook report has predicted that political unrest is likely to affect the potential of tourism growth in the Middle East countries, and tourism development in the region has now been postponed for indefinitely (MAS 2011). Therefore, when countries experience constant social unrests and terrorist-related attacks, would such negative events have long-term deteriorating impacts on tourism development? If so, to what extent these countries’ tourism industry would be affected? Which incidence has more negative effects on tourism: political instability–related incidence or terrorism-related incidence? Furthermore, recent studies by Uriely, Maoz, and Reichel (2009) and Korstanje and Clayton (2012) claimed that some destinations have extraordinary resilience to terrorist-attack events and the recovery period of tourism from these events tends to be short. Therefore, in this research, we compare the individual as well as combined effects of political instability and terrorist attacks; in particular, we examine the impact of terrorist attacks (political risk) at the different levels of political risk (terrorism). Page, Song, and Wu (2012) suggested that it is an innovative approach to separate the effects of multiple crises on tourism demand. Hence, in our current paper, we follow their approach by examining the individual impacts of political instability and terrorism on tourism demand.
To answer the questions above, this article analyses the impact of political instability and terrorism on tourism demand using the moderation effect (interaction effect) technique—widely used in economics literature to determine the joint effect of political instability and terrorism on this industry—using cross-sectional data over a hundred countries for the period 1999–2009. Moderation effects measure the combined effects of independent variables on a dependent variable. Rather focusing on the effects of a single independent variable, the analysis can combine effects of two or more independent variables (Aiken and West 1991; Halcoussis 2005). When a moderation effect is present, the impact of one variable depends on the level of another variable. While most empirical studies confirm that political instability and terrorism alone do reduce tourism demand, there is no cross-country study that captures the joint effects of these variables. Moreover, it is of interest to determine how political instability and terrorism can jointly affect the tourism industry. Investigation of the moderation effect is vital because different countries have various levels of political risk and terrorist threats. Hence, the main objective of this paper is to develop a tourism demand model that can capture the impacts of interaction between these two variables on tourism businesses. The model can then generate more accurate estimations of tourism demand for the purposes of forecasting and planning effective crisis recovery strategies.
The tourism literature has mainly focused on descriptive analysis of how political instability could affect the tourism industry (Leung, Lam, and Wong 1996; Loannides and Apostolopoulos 1999). The authors have used figures and diagrams of declining visitor numbers and tourism revenue to support their claims about the consequences of political unrest in tourism-generating countries. In addition, some empirical studies on this topic have used survey and time-series data in country-specific study (Das and Dirienzo 2010; Hoti, McAleer, and Shareef 2005; Prideaux, Laws, and Faulkner 2003), but rarely have adopted panel data. Panel data analysis is capable of generating reliable estimates, but this method has not been vastly explored in tourism research. This study differs from earlier literature for two reasons: first, we explicitly quantify the joint effects of political instability and terrorism on tourism; second, we estimate partial interaction effects to compare the individual effects of political instability and terrorism. The next section outlines a brief literature review followed by data description; empirical strategy and results from the country-level analysis are presented next; and the conclusions are presented in the final section.
Political Instability, Terrorism, and Tourism: A Brief Literature Review
Political instability can lead to social unrest, riots, and wars (Sonmez 1998), and they can cause significant negative impacts on tourism. For example, Thailand is well known worldwide for its tourist destinations, but the country has suffered two major political turmoils. First was the insurgence of the “Red” and “Yellow” shirts. One of the country’s worst incidents occurred on April 10, 2010, when the country experienced violent public demonstrations by the “Red” shirt supporters. Twenty-four people were killed and more than 800 were injured (Horn 2010). As a consequence, Thailand’s tourism was adversely affected and the industry lost more than $300 million in 2010 (Tarrant 2010). Second was the ethnic tension between Thai Muslims and militants in Southern Thailand, where terrorist bombing incidents were carried out by Islamic extremists. This resulted in foreign governments warning their citizens against traveling to the region. At the time of this writing on April 15, 2012, the Department of Foreign Affairs and Trade in Australia has advised Australian citizens not to travel to parts of Southern Thailand, such as Yala, Pattani, Narathiwat, and Songkhla, because there have been several cases of multiple explosions across these regions. Similarly, in the Middle East and the North African countries, riots were widespread across the region in 2011, which dampened these destinations’ tourism image.
Likewise, military coups can have severe negative effects on tourism development. Teye (1988) argued that during a political struggle in a country, the government focuses on controlling the violence and suspends long-term plans for developing tourism facilities. Moreover, the adverse effects on tourism demand are due to the fact that military coups result in closing borders and even tourists often receive maltreatment during a hostile military coup. Fletcher and Morakabati’s (2008) study on Fiji found that unfavorable political events have far more severe impacts on tourism activity than a low-to-medium and one-off terrorist attack. The aftermath of the 2000 Fiji coup was that total tourism receipts fell by 35% and hotel occupancy levels declined by 15%–20%; and the industry took more than three years to recover to the pre-coup level (Fletcher and Morakabati 2008). Nevertheless, the speed of recovery period depends on whether the government has effective crisis management strategies to restore tourism businesses to its full potential (Narayan 2005).
Political instability can be associated with terrorism, and both political instability and terrorism impact tourism severely (Sonmez 1998). For example, the conflicts between Israelis and Palestinians began back in the 1800s when Jewish settlers conquered the Palestinian state by driving away Palestinian Arabs from their homelands. Throughout the past two centuries, the region witnessed various wars and crises as Palestinian inhabitants demanded the end of Israeli occupation and established an independent Palestinian state (Thomas 2009). During 2001 and 2005, the Israeli–Palestinian war became worse after Ariel Sharon became the prime minister in February 2001. He rejected all peace agreements aimed at Israeli withdrawal from Arab lands and used military force to destroy Palestinian-occupied territories (Thomas 2009). During these periods, the number of terrorist attacks and civilians killed increased. For example, between 2002 and 2003, on average more than 4000 terrorist attacks were carried out against the Israelis and a total of 664 Israeli soldiers and civilians were killed (Israel Ministry of Foreign Affairs 2004). The occupation by Israel in Palestinian cities had various negative effects on the tourism sector: for instance, halted hotel constructions, destruction of Palestinian tourism enterprises, high rents and taxes on restaurants, and visitors from Islamic and Arab countries being forbidden (Suleiman and Mohamed 2011).
Sonmez (1998) argued that the duration of terrorist incidents tend to be short and they occur suddenly; however, the media coverage of terrorist attacks can be intense especially when tourists are among the fatalities of the attacks. The author warned that persistent terrorism will jeopardize a country’s reputation as a safe tourist destination, particularly when the public has long-lasting memories of terrorist attacks in the country. Sonmez and Graefe (1998) observed that the trend of terrorist events declined since 1980s, but their lethality has surged remarkably. For instance, the well-known terrorist attacks in the United States in 2001 killed approximately 3,000 people. Since then, the U.S. airlines suffered from reduction in profits from $7.9 billion in 2000 to $4.4 billion in 2001 (Blunk, Clark, and McGibany 2006), because of the consequence of potential visitors’ fear to travel during the period. In fact, Sonmez (1998) highlighted that such tourist behavior is related to the “generalization effect,” whereby perceptions of terrorist threats in one country tend to make tourists presume entire regions to be risky. Drakos and Kutan (2003) conducted an empirical investigation regarding the effects of terrorism on tourist arrivals to Greece, Israel, and Turkey, and their findings supported Sonmez’s argument. Drakos and Kutan revealed three findings: (1) terrorism can cause a significant decline in tourist arrivals to these countries; (2) the intensity of casualties and geographical location of terrorist incidents can have significant own and spill-over effects on the affected countries; and (3) substitutability between Greece and Turkey as tourism destinations is evident when one of the countries experiences a terrorist-related incident.
Despite the negative impacts of terrorism on tourism, certain countries seem to have a short-term deterioration in tourist numbers. For example, at the time of 9/11 terrorist attacks, the total air arrivals to Jamaica fell by 41%; however, a year later, visitor arrivals improved by 30% (Pratt 2003). Moreover, potential tourists may return to prior terrorism-affected regions once the risk from terrorism has receded (Sonmez, Apostolopoulos, and Tarlow 1999). To comprehend this tourist behavior, several researchers have conducted studies regarding tourists’ risk perceptions of traveling to terrorism-prone destinations using qualitative methods. For example, Uriely, Maoz, and Reichel (2007) interviewed Israeli tourists about their perceived risk of visiting Sinai in Egypt, a destination that had multiple terror attacks in 2004. Surprisingly, while Israeli tourists were concerned with the terrorist incidents in Sinai, the authors discovered that these tourists perceived terrorism in the destination as less threatening. Uriely, Maoz, and Reichel further argued that Israeli visitors practice “outward-oriented rationalizations”; that is, as long as the tourists are better informed about political events in the regions and understand the reasons of terrorist activities, they are less threatened by the effects of terrorist acts. Furthermore, the relationships between Israeli guests and Egyptian hosts are resilient in nature because of tourism-related interests, and both parties tend to be polite and tolerant despite the past history of conflicts and terrorism between Israeli and Egypt (Uriely, Maoz, and Reichel 2009).
In general, politically unstable countries often encounter incidents of public violence, terrorism, civil wars, and military coups. In fact, such incidents can cause difficulties in the tourism planning process, especially dealing with a negative public image and unpredictable tourism demand (Issa and Altinay 2006). Nevertheless, based on the literature, it is suggested that social unrest relating to wars and coups cause more prolonged damages to tourism than terrorism. Particularly for countries that are associated with political or religious rebel groups, potential tourists may not perceive one-off terrorist acts as long-term threats.
Modeling Tourism Demand Using Political Instability, Terrorism and Control Variables
Measures of Political Instability and Terrorism
In economics literature, the measure of political instability relates to political unrest and the propensity of an imminent government change (Alesina et al., 1996; Alesina and Perotti 1996; Barro 1991). Barro employed several proxies such as the numbers of assassinations, violent revolutions, and military coups to measure the effects of political instability on economic growth. He found that these proxies have significant negative impacts on the growth rate of real GDP per capita across 98 countries. Furthermore, religious and ethnic tensions aggravate social turmoil when the religion and culture of an ethnic-minority community are being challenged by government authorities. For example, Thailand’s southern province, which is dominated by a Muslim-minority population, experienced periods of conflicts and they are ethnic-based domestic conflicts (Croissant 2007). In addition, Alesina and Perotti (1996) argued that high levels of social and political upheavals, including a high frequency of coups and episodes of violence on politicians, expect high government turnover. Based on the literature above, it can be concluded that political instability generally includes political violence, military coups, lack of government stability, religious and ethnic tensions, and wars or conflicts (internal or external).
In tourism literature, empirical researchers such as Feridun (2011) and Neumayer (2004) used the number of terrorist incidents as a proxy to measure the effects of terrorism on tourism demand. Although terrorism-related violence can cause a significant decline in tourists’ intention to visit those affected destinations (Arana and Leon 2008), several studies revealed that terrorism-prone destinations seem to be resilient even after the occurrence of terrorist attacks (Korstanje and Clayton 2012). Furthermore, Larsen, Brun, and Ogaard (2009) found that potential tourists tend to have more worries about terrorism than actual travelers do. This indicates that perception of terrorism risk prior to travel may play an important role in influencing tourism demand. Hence, rather than using the number of past terrorist events as a proxy of terrorism, perceptions of terrorism risk would be a better measure.
Terrorist acts can be driven by the expression of political or religious injustice in a country (Pizam 1999). Empirically, Neumayer (2004) discovered that substantial increases in both terrorist and violent events can reduce global international tourists by 27% in the long run. Nevertheless, several new findings revealed that impacts of political instability on various destinations act at multiple levels (Seddighi, Theocharous, and Nuttall 2002) and the effects of terrorism incidents on tourism demand vary across countries (Llorca-Vivero 2008). In other words, these studies may suggest that countries which are politically stable but faced a small number of terrorist events (i.e.g., the United States and Spain) could have lesser impacts of terrorism on their tourism industry than those countries that are politically unstable and prone to terrorist activities (i.e., Pakistan and Afghanistan). Given this scenario, perhaps it would be interesting to create a moderator variable to measure the effects of political instability (terrorism) on tourism demand at different levels of terrorism risk (political risk).
Control Variables
Apart from the political and terrorism indicators above, the study employs several control variables in the process of modeling tourism demand. In this research, economic variables such as income and relative prices are considered. Income determines tourists’ affordability to visit a destination (Yap 2010), while relative prices are the comparative costs of goods and services in an origin country and a destination (Lim 2006). To exclude the effects of inflation, the relative price ratio is adjusted by the consumer price index and such inflation-adjusted relative price can be termed as a real exchange rate (Yap 2010). Other economics variables such as travel costs and nominal exchange rates are not considered in our research. Notwithstanding the importance of travel and transportation costs, these variables are excluded because of unavailability of reliable data. 1 In fact, many past researchers encountered the same issue (Li, Song, and Witt 2005; Lim 2006; Neumayer 2004; Witt and Witt 1995). Moreover, the study omits the nominal exchange rate variable because, according to Witt and Witt (1995), it does not represent tourists’ living costs and it is counterbalanced by a relatively high inflation in the destination even though the destination offers favorable currency exchange.
The study includes the initial real exchange rate, which is based on the value of the real exchange rate in 1999, the starting year of this research. 2 The main motivation of proposing this variable is to distinguish between countries that have high and low domestic inflation-adjusted currency values. Furthermore, this variable is used to determine whether a developed country with high currency value could affect the competitiveness of the country’s tourism industry. It is assumed that a country with high domestic currency values could negatively impact the demand for international travel to the country. In fact, a country with a high-value domestic currency means the travel cost in that country would also be high. When deciding on a travel destination, most tourists may choose countries that have a lower value of domestic currency, and thus more value for their money, than those countries with high currency. In addition, the change in real exchange rate is included as a control variable to capture the effect of appreciation or depreciation of currency on tourism demand.
The current research includes destination attractiveness as the variable for tourism supply. It is a control variable that depicts the uniqueness of each destination. Li, Song, and Witt (2005) argued that it is important to examine the impact of tourism supply in a tourism demand model so that a more robust analysis of demand elasticity can be generated. A destination may have certain attractiveness power that not only can derive tourists’ utility of being at the destination for a certain period of time, but it can influence tourists’ overall travel experience (Formica and Uysal 2006). Formica and Uysal noted that “the very existence of tourism depends on the availability and perceived importance of resources at the destination” (p. 419). As destination attractiveness is subject to travelers’ perception of satisfaction (Mayo and Jarvis 1981, p. 68), a more appropriate measure of this variable would be the amount of tourism revenue generated from a destination’s popular sites to represent tourists’ willingness to pay for the travel. Another good indicator for tourism attractiveness is whether a destination offers heritage tourism. Heritage tourism promotes places of national inheritance and heritage interest. According to Southall and Robinson (2011), nearly 60% of visitors from 20 countries consider history and culture as their choice of destination.
Tourism Demand Model and Data Description
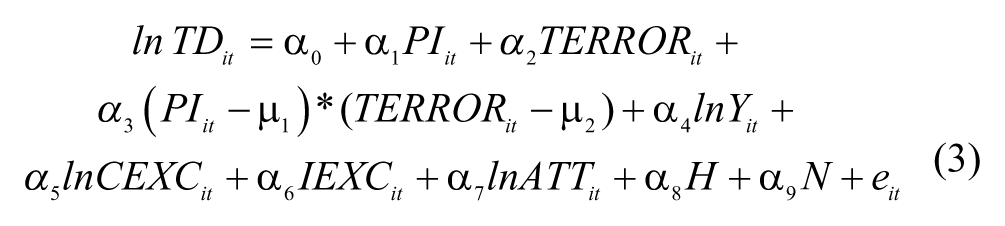
In this section, we structure a new tourism demand model as follows:

where
The coefficient a3 captures the interaction effect of political instability and terrorism, which is the main focus of this study. The marginal impacts of political instability and terrorism on tourism demand are estimated as follows:
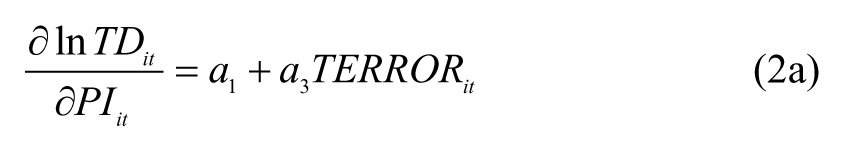
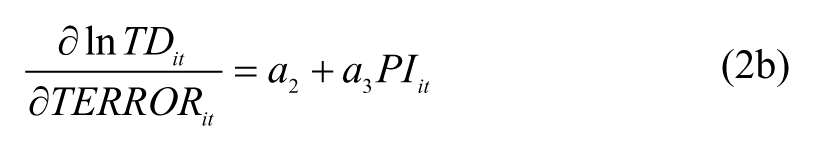
If a3 < 0, then equation (2a) implies that a one unit increase in the political instability index yields a greater reduction in percentage change of tourism demand with a higher level of terrorism. Likewise, if a3 < 0, then a one unit increase in terrorism in equation (2b) generates a greater diminution in the percentage change of tourism demand with a higher level of political instability.
For this research, we adopt a log-linear model because (1) it can generate variable marginal effects and constant elasticities; (2) it imposes non-negative restrictions upon variables; and (3) it allows the random errors in the equations to be normally distributed (Lim 2006). Based on equation (1), the main hypothesis explains that when countries encounter political unrest, the demand for international travel to the affected countries is expected to decline.
We examine the impact of political instability on tourism demand by employing a panel data analysis for 139 countries over the period 1999-2009. The panel data models are advantageous because they provide more information, more variability, less collinearity amongst the variables, more degrees of freedom and more efficiency (Baltagi 2008).
The dependent variable in this study is tourism demand, and two types of tourism demand data are used: international tourist arrivals (in thousands) and tourism revenue (in million U.S. dollars) in each country i. These data are extracted from Euromonitor International. The advantage of using these two indicators in this study is that we can observe to what extent political instability can affect international visitor numbers and revenue earned from the international and domestic tourism industries. To ensure the model estimations are unbiased and reliable, we employ income and real exchange rates indicators as the control variables. According to the tourism literature, these variables are found to be important leading economic indicators to determine the demand for international tourism (Lim 2006). A destination’s tourist attractions may play an important role in influencing tourism demand. Description, organization, and experience of tourist attractions create images and memories for visitors to remember (Lew 1987). There will be two benefits. First, these unique memories would encourage the visitors to repeat their travel to the same destination. Second, tourists would spread their words and stories to their friends and families, which may potentially create more visitors to the tourist attractions. Therefore, given its importance, this variable is included in the tourism demand modeling process.
Real GDP per capita is used as a proxy for income (Lim 2006) and it is calculated based on the purchasing power parity (PPP)–converted GDP per capita in a country relative to the USA. The measure of PPP for the variable is based on the data from Heston, Summers, and Aten (2011) or Penn World data set using the GEKS-Fisher multilateral index, named after the studies conducted by Elteto and Koves (1964) and Szulc (1964). These data were chosen for the present study because the GEKS indexes do not understate PPPs in poor countries and it is highly recommended for analyses of world income distribution and poverty (Deaton and Heston 2010). This study employs real GDP per capita in each country to represent the minimum income level that tourists could afford to visit the country. Furthermore, governments in high-income countries can afford to invest funds to build up and maintain infrastructures for the tourism industry, which in turn attracts more tourists. Hence, it is expected that a high income increases demand for tourism.
The real exchange rate variable measures national currency units per US dollar that are adjusted by purchasing power parity (PPP) over GDP and it is obtained from Penn World. It is a proxy for tourism prices which reflects the relative prices between origin and foreign countries (Lim 2006). The variable is transformed into first difference data to obtain changes in real exchange rates, in order to ensure that the variable becomes stationary. When a destination’s currency depreciates, the national currency units per U.S. dollar will rise. Since the travel cost in the destination will be cheaper, this encourages more international travelers to visit the destination. Hence, a positive sign is expected for the real exchange rate coefficient. In contrast, a low initial exchange rate (in 1999 value in terms of PPP in U.S. dollar) of the destination country positively affects tourism demand due to the cheaper value of the currency. Both initial real exchange rate (IEXC) and changes in real exchange rate (CEXC) are included in the model to capture the effect of lower value as well as depreciation of the currency. Because IEXC is constant over time, we expect there is very less or no correlation between the two exchange rate variables. 3
In addition, we incorporate three control variables to distinguish the uniqueness of each destination. First is the tourist attraction variable that covers tourism revenues to visitors’ sites and permanent attractions such as art galleries, casinos, circuses, historical buildings/sites, museums, national parks, theatres, theme/amusement parks, and zoos/aquariums. The variable can be obtained from the Euromonitor database. We assumed that a country with significant numbers of tourist attractions will invite more visitors to the country. Second is the dummy variable for historical heritage that is developed to capture the uniqueness of those countries that possess world historical heritage and buildings approved by UNESCO’s World Heritage List. World heritage in a country encourages specialization in tourism (Arezki, Cherif, and Piotrowski 2009) and, hence, increases demand for travel to the destination. Third is the dummy variable for natural heritage that focuses on the countries that have natural wonders approved by UNESCO’s World Heritage List. Similar to the dummy variable for historical heritage, countries that are surrounded by natural wonders promote nature tourism as part of their business strategy to increase tourism revenue.
The main focus of the study is political instability and we employ political risk variable as a proxy for political instability and it is obtained from the International Country Risk Guide (ICRG) prepared by Political Risk Services (PRS), the well-known and widely used data set in economics literature. The ICRG index is available from 1984 and it allows for cross-country comparison and has a wide range of usage starting from Knack and Keefer (1995), Braun and Di tella (2004), Dreher and Siemens (2005), Dal Bό and Rossi (2007), and Swaleheen (2011), all using the ICRG index. Following Alesina et al. (1996), Alesina and Perotti (1996), and Barro (1991), the composite political instability (PI) index is constructed by averaging internal conflicts (IC), government stability (GS), religion in politics (RP), external conflicts (EC), ethics tension (ET), and military in politics (MP). 4 The detailed definition and methodology of each of these components can be obtained from the ICRG. 5 Each component is assigned a risk point for every country based on the political information collected by the PRS. The accumulated points for the composite PI index is 60. According to the ICRG index, a low score of PI for a country indicates that the country is highly politically unstable. For consistency and ease of explanation, we have rescaled the index and it ranges from 1 to 10. 6 A higher value indicates a high political instability. The minimum score is 1 (highly stable country), while the maximum score is 10 (high political risk). The more the political volatility in a country, the lower the country’s tourism demand. The expected sign of the political risk coefficient is negative.
Similarly, we have considered the terrorism variable from the PRS Group. It considers terrorism as a part of internal conflict. However, for the purpose of our study, we examine this variable separately. It measures the perceptions of terrorist attack incidents in a country and whether these attacks relate to the country’s political violence. The maximum score is 10 (highest terrorist activities in a country) and the minimum score is 1 (lowest incidence of terrorism in a country). It is assumed that as the terrorism indicator increases, the number of tourists will fall as they may be afraid of traveling to the affected regions.
Moderator-Effects Regression Analysis
In this section, we use the partial effect of PI and TERROR to estimate the impact on tourism activity and predict that internal political instability has far more severe impacts on the level of tourism than one-off terrorist attacks. Following Saha et al. (2009), we examine the moderation effect of political instability and terrorism to measure whether political instability surrounded by a high level of terrorism can make the situation worse. In other words, this study estimates the levels of political instability and terrorism that will affect tourism demand negatively. In order to interpret the impact of interaction effects of political instability and terrorism on tourism demand, the partial effects are estimated based on the models as:
where
A panel of least squares, fixed effects, and random effects models are used to estimate all the regressions. For the model, we control for period fixed effects to avoid omitting time-invariant variables. Assuming the simplified one-way panel regression is written as follows:

where
In order to avoid too many unobservable effects in the regression, equation (4) is transformed by averaging all variables in the equation and subtracting it, as follows:
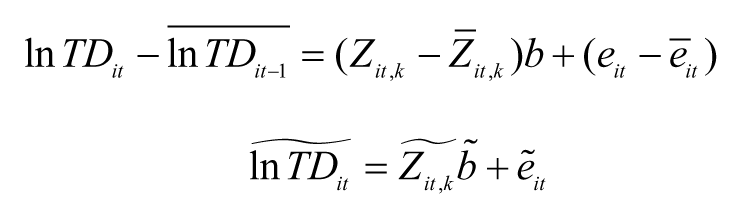
where
According to Baltagi (2008), all estimators in the fixed effect model (i.e.,
Lastly, this research adopts random effect model, where the regression error term will be
Empirical Results
This section analyses the empirical results of the impact of the interaction between political instability and terrorism on tourism demand. The first part of the analysis focuses on the relationship between political instability and terrorism with control variables using fixed effects (FE), random effects (RE) and ordinary least squares (OLS). The second part analyses the partial interaction effects of political instability and terrorism on tourism demand utilizing panel fixed effects.
The Kernel fit of the scatter plots shown in Figure 1 represents the relationship between political instability and terrorism with tourist arrivals (TA) and tourism revenue (TR). 7 The upper panel measures log of tourist arrival (LTA) in the Y-axis and political instability (PI), and terrorism (TERROR) in the X-axes, whereas the bottom panel measures log of tourism revenue (LTR) in the Y-axis with political instability and terrorism variables in the X-axes. The Kernel fit lines for political instability and terrorism are downward sloping, indicating that political instability and terrorism are negatively correlated with tourist arrivals and tourism revenue, and the relationship is much stronger for tourist arrivals. That is, high political instability and terrorism cause reduction in tourism demand. Moreover, it can be seen that political instability is negatively related with TA and TR throughout, whereas the positive relation with TA and TR is possible in case of terrorism as the Kernel fit lines for terrorism show some upturn. In other words, the act of terrorism may increase tourism demand because of the inquisitiveness among the people. Therefore, to examine the impact of political instability and terrorism on tourism demand more rigorously, an interaction term (which measures the effects of political instability and terrorism on tourist arrivals or tourism revenue) is included. The interaction effects on tourism are examined using various estimation methods. The focus of the study is the interaction term, that is, PI*TERROR which is based on equation (1).
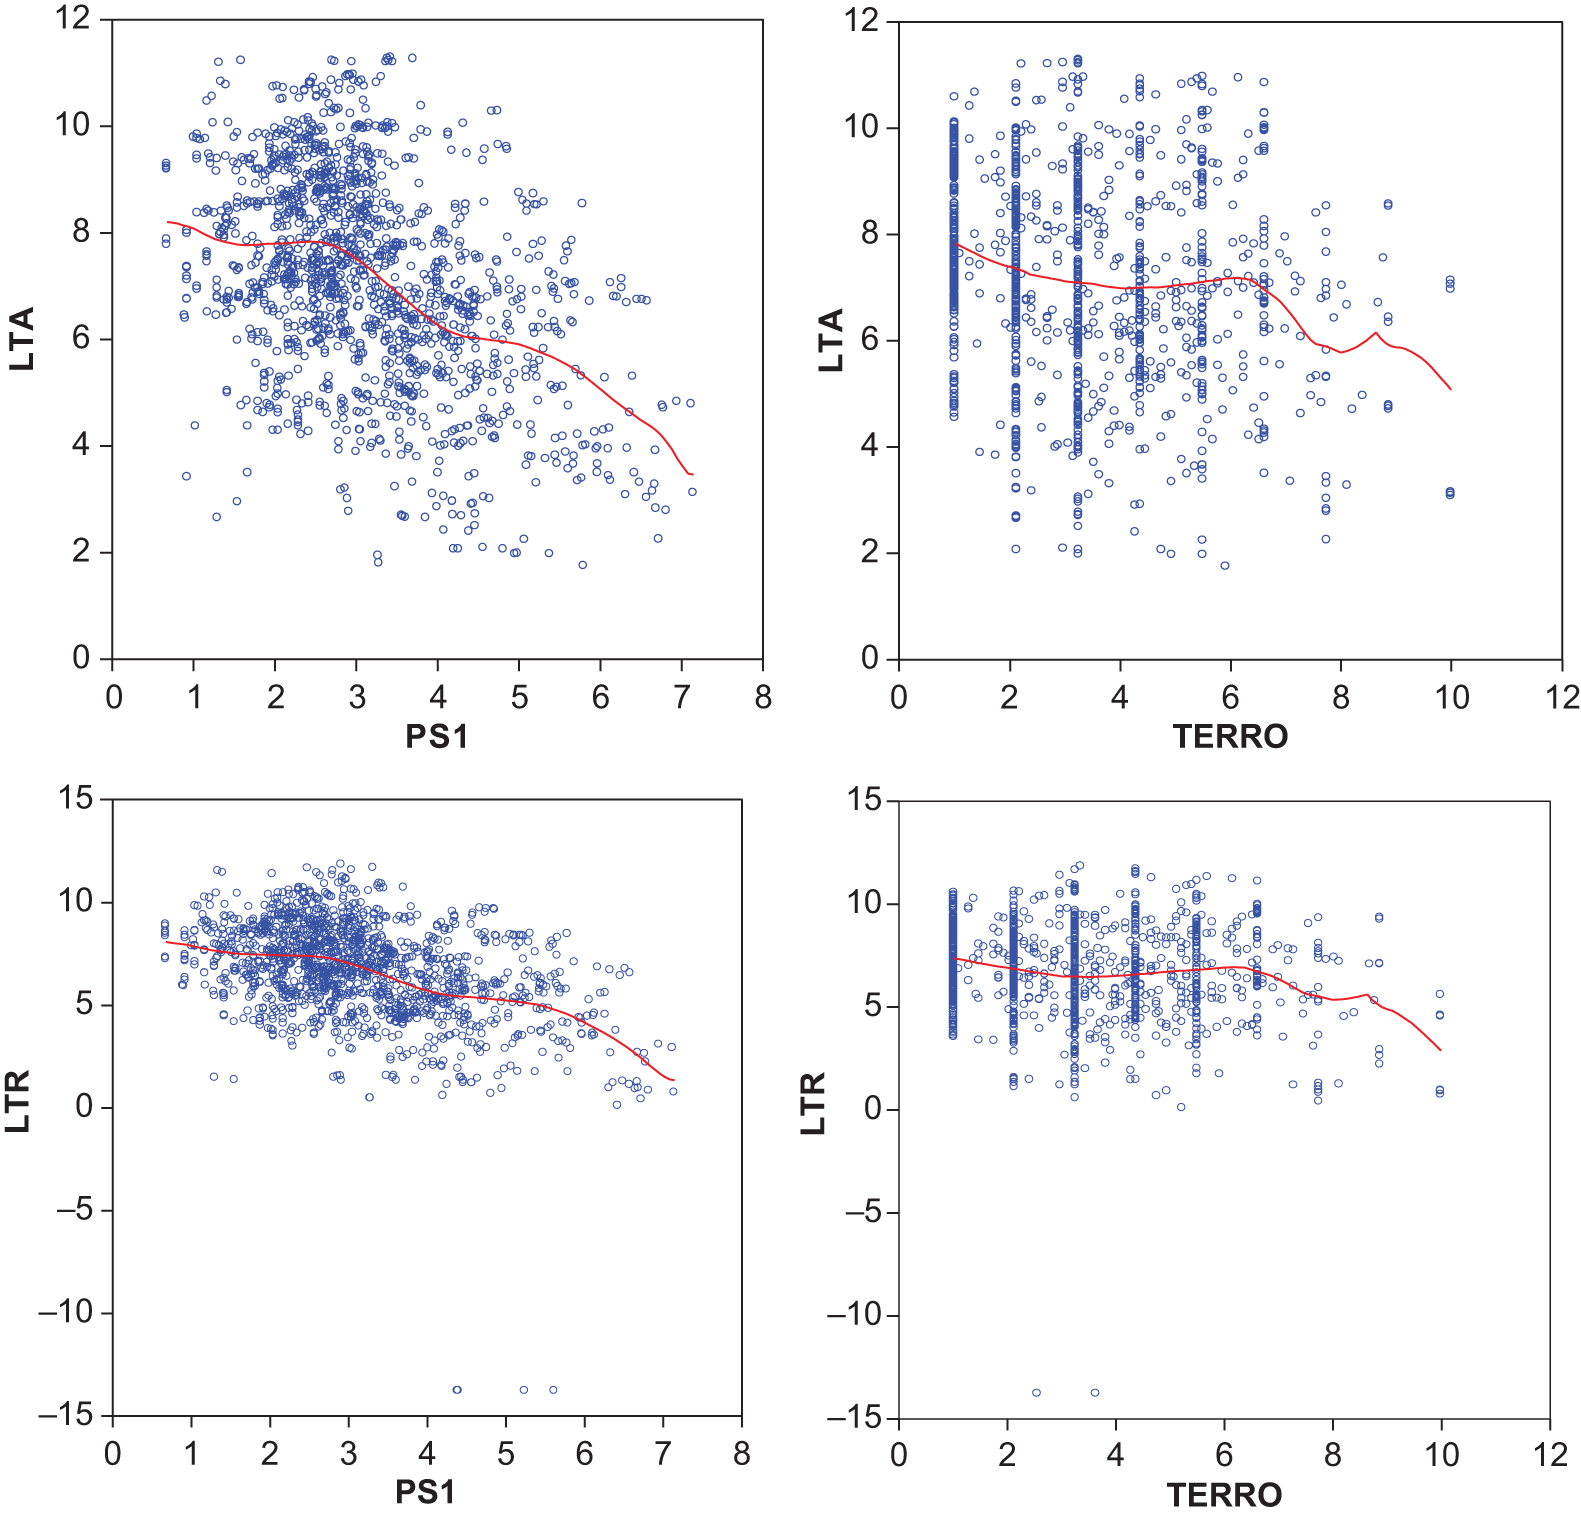
The relationship between political instability and terrorism with tourist arrivals and tourism revenue.
The fixed effects (FE) results for TA and TR are reported, respectively, in Tables 1 and 2. The coefficient for political instability is negative as expected indicating that a high PI reduces the number of tourist arrivals in a country (Table 1). On the other hand, the terrorism coefficient is positive, suggesting that terrorism not necessarily reduces international tourist arrivals in a country. Furthermore, it may increase the number of tourists. However, the coefficient of the interaction term between political instability and terrorism is negative and significant, illustrating that political instability and terrorism together have significant damaging effects on tourist arrivals in a country. Based on equation (2a), the interaction effect of political instability on tourist arrivals at the mean score of terrorism of 3.36 is −0.029 + (–0.067) * 3.36 = −0.254, which is highly significant. It suggests that a one unit increase in political instability reduces TA by 25.41%. 8 The results show that political instability decreases the number of tourist arrivals at any value of terrorism, even at low levels of terrorist threat, but the negative effect is much stronger at a high risk of terrorism. On the other hand, the interaction effect of terrorism on tourist arrivals at the mean political instability score of 3.33 is 0.262 + (–0.067) * 3.33 = −0.039. In other words, a one unit increase in terrorism index reduces TA by 3.9%. However, terrorism does not reduce the tourist number when there is low political risk. The results indicate that the interaction effect of political instability has a stronger effect than terrorism at the average value of both these indices. In other words, political instability reduces tourist arrivals at any level of terrorism, while terrorism has a mixed effect, that is, terrorism increases and decreases the number of tourists in a country at low and high political risk levels, respectively. In fact, even if a country has lesser than average terrorist threat, high political instability attracts less international tourists. However, if a country has less political risk, terrorism-related events do not cause a decline in tourist arrivals possibly because of speedy recovery from such events and reduction in tourists’ perception of terrorist risks. According to Pizam and Smith (2000) who examined the effects and severity of terrorism on tourism demand using 70 major incidents in 28 countries between 1985 and 1998, 79% of the past terrorist events triggered a significant decrease in tourism demand and the effects lasted from one to six months, but 50% of these cases recovered within three months or less. Furthermore, according to Uriely, Maoz, and Reichel (2007), tourists tend to adopt an inward-oriented rationalizations strategy where they reduce their perceived risk of the terrorist-affected countries by emphasizing the availability of security and safety measures in these countries, or an outward-oriented rationalization where the tourists stress that terrorist events could occur anywhere. Looking at the raw data on tourist arrival in United States reveals that the numbers of tourist decreased between 2001 and 2003 after the 9/11 terrorist incident; however the number has been increasing since 2004 at an annual average of 4% (Euromonitor 2011). The results of the political instability and terrorism are interpreted in detail in the partial effect estimation subsection.
Interaction Effects Estimations of Political Instability and Terrorism on Tourist Arrival Data.
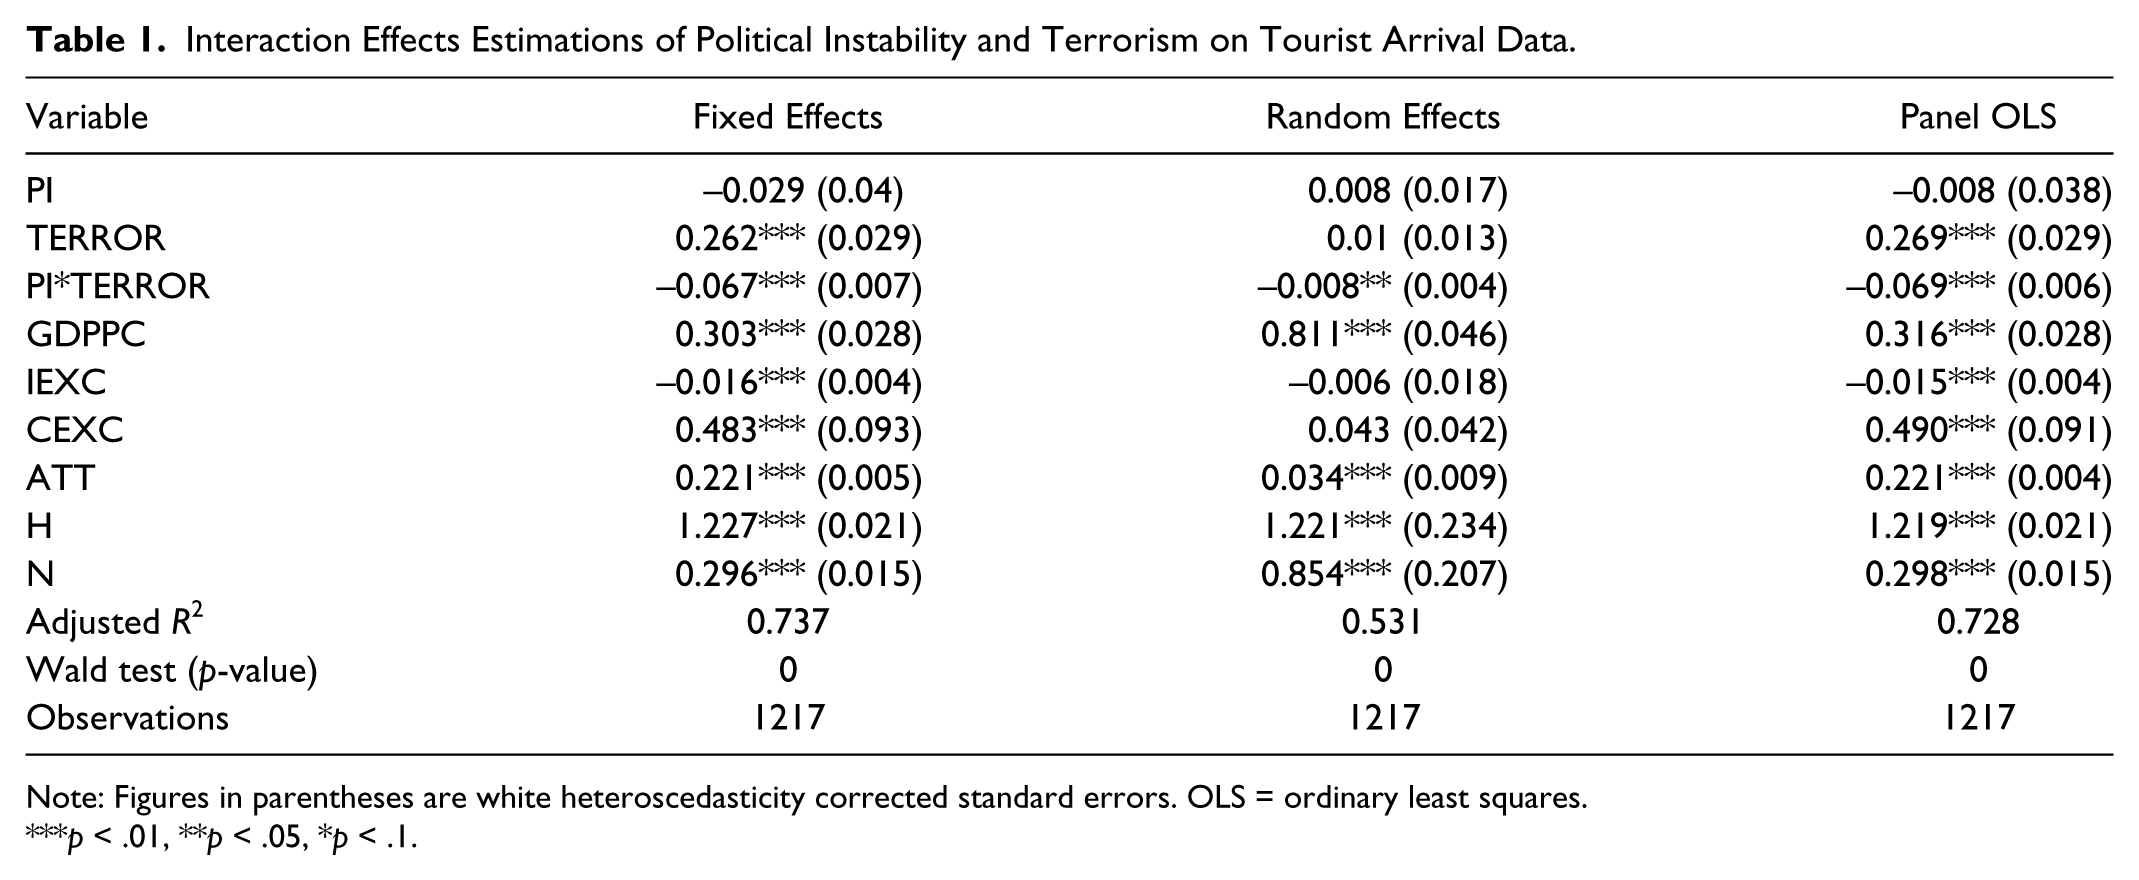
Note: Figures in parentheses are white heteroscedasticity corrected standard errors. OLS = ordinary least squares.
p < .01, **p < .05, *p < .1.
Interaction Effects Estimations of Political Instability and Terrorism on Tourism Revenue Data.
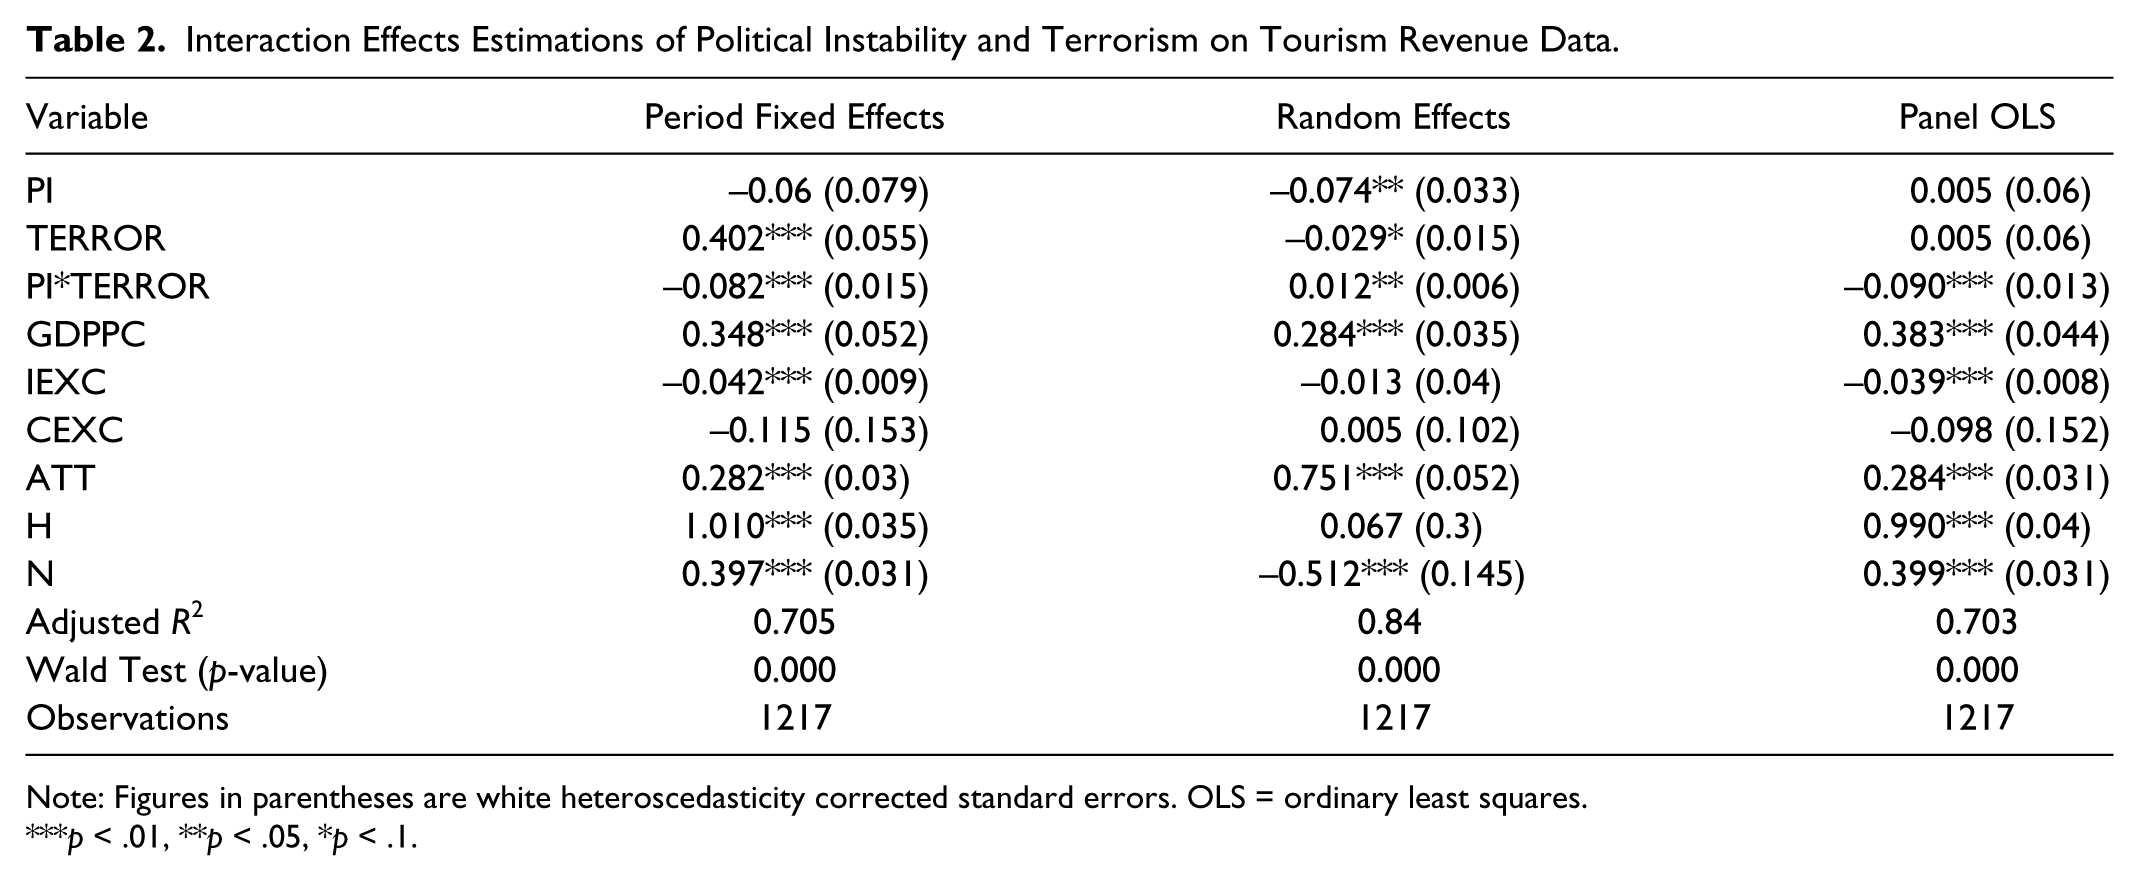
Note: Figures in parentheses are white heteroscedasticity corrected standard errors. OLS = ordinary least squares.
p < .01, **p < .05, *p < .1.
The control variables show the expected signs. Real GDP per capita and depreciation of currency increases tourists’ arrivals as the coefficients of GDPPC and CEXC are positive. 9 The low currency of a country attracts more tourists. Likewise, more tourist attractions and historical and natural heritage promote tourism industry as these coefficients are positive and highly significant.
Next step estimates the interaction effects using random effects and least squares estimation techniques. The results remain the same with few exceptions. Overall, political instability and terrorism with interaction terms and control variables explain 53% to 74% of the variation in tourist arrivals. Table 2 reports the interaction effect results when tourism revenue is the dependent variable. The coefficients retain the similar signs and significance level for political instability and terrorism in terms of tourism revenue. However, the magnitudes of the coefficients are greater for TR. Random effect and OLS results are consistent with FE results. The next subsection examines partial effects of political instability at each level of terrorism starting from 1 to 10 based on equation (3). The results are reported in Table 3.
Partial Effects of Political Instability and Terrorism on Tourism Demand Using Panel Data Regression.
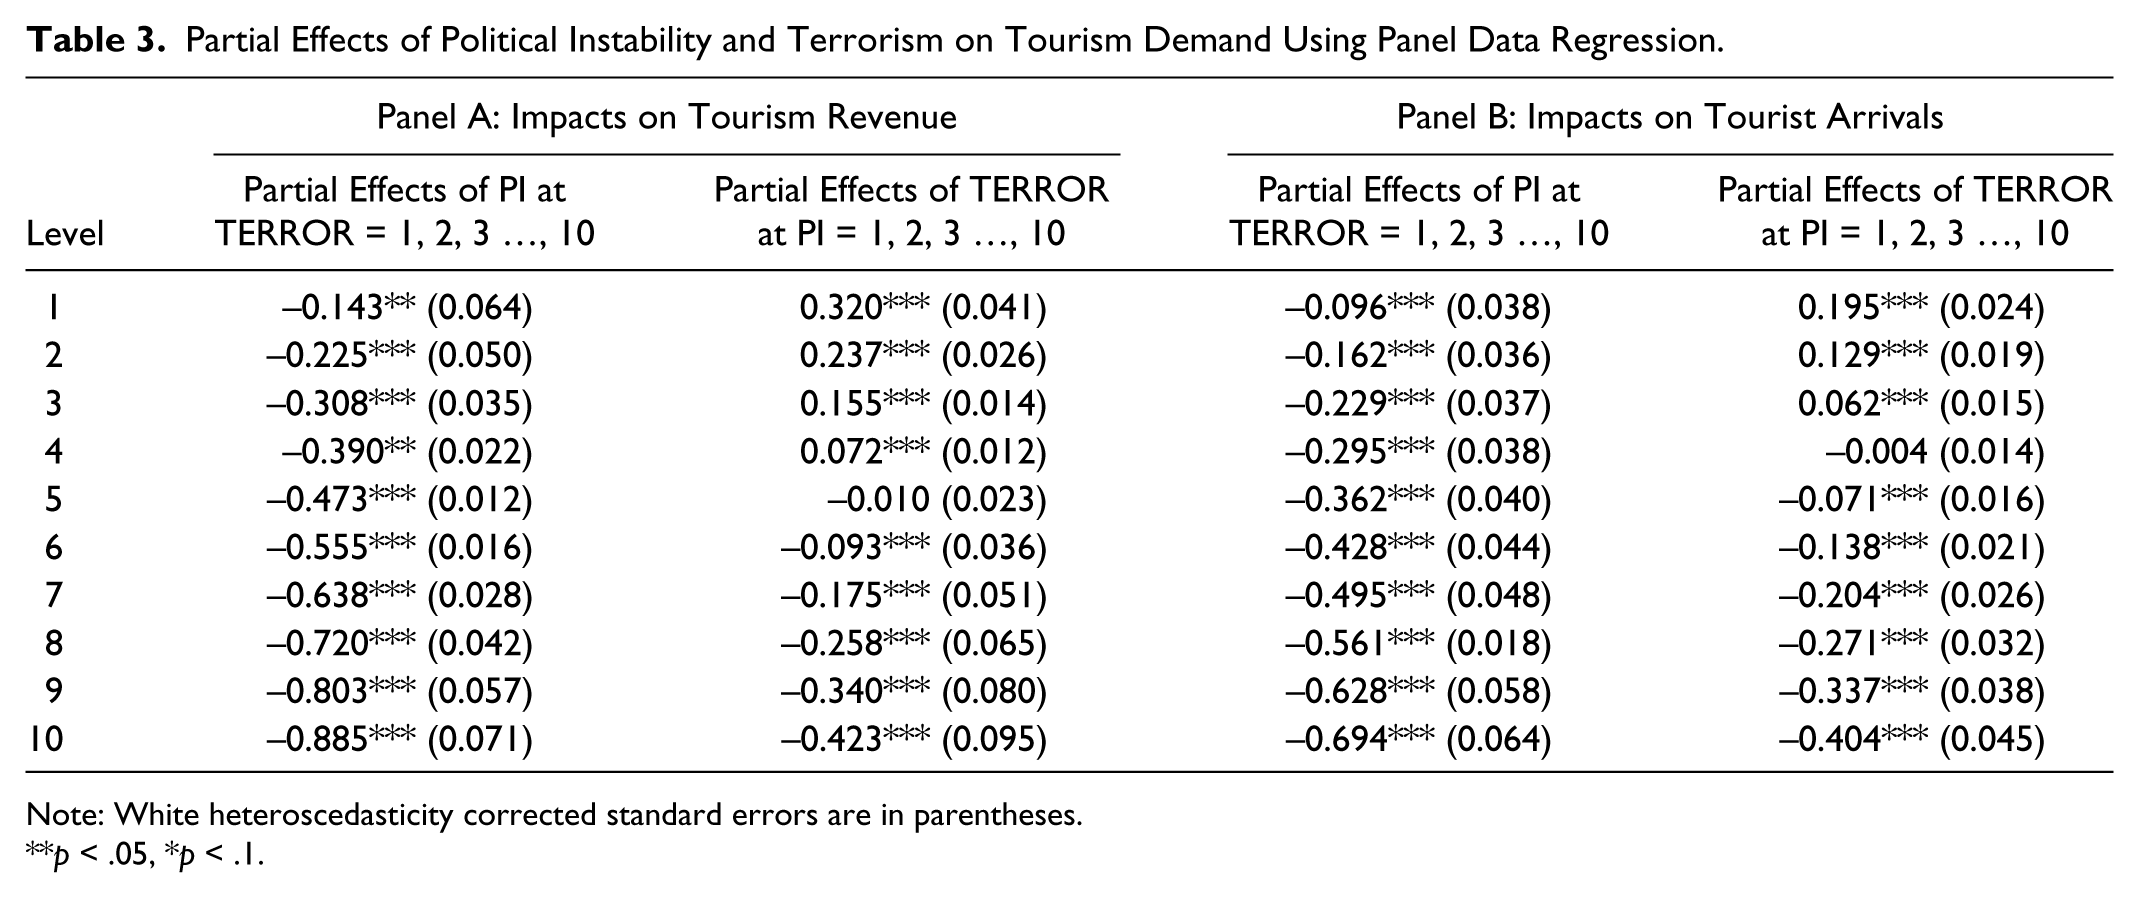
Note: White heteroscedasticity corrected standard errors are in parentheses.
p < .05, *p < .1.
Partial Interaction Effects of Political Instability and Terrorism on Tourism Demand
This subsection estimates the interaction effects of political instability and terrorism on tourist arrivals or tourism revenue based on equation (3). The results reported in Table 3 are the partial effect of political instability on tourism revenue at different levels of terrorism, that is, from 1 to10 using the fixed effect model. 10 The interaction effect of political instability at various levels of terrorism on tourism revenue suggests that political instability significantly reduces tourism revenue at each level of terrorism. However, the effect becomes much stronger as the terrorism level increases. In other words, an increase in political instability along with high level of terrorist threat damages tourism industry severely.
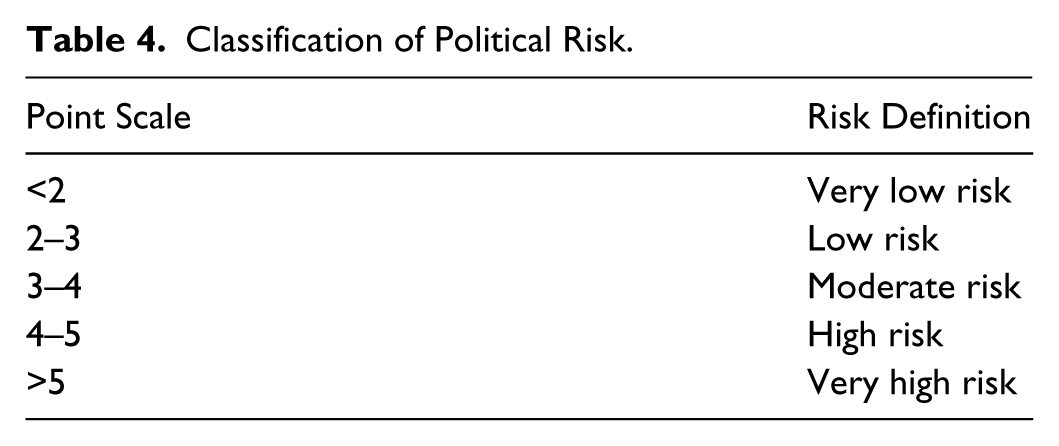
On the other hand, the partial effect of terrorism shows some opposite effect at a very low and a very high risk level of political instability. In fact, terrorism increases tourism revenue at the very low to moderate level of PI and after a threshold level (between 4 and 5) it reduces tourism revenue substantially. The threshold point is where tourism revenue starts decreasing due to the high level of political instability between 4 and 5. This suggests that both political instability and terrorism inversely affect tourism revenue at a higher risk level. However, when a country is politically stable terrorist attack does not have much negative impact on tourism revenue. The result is consistent with the ICRG classification of political risk, that is, if points are less than 50% of the total, that component can be considered as very high risk. Following ICRG classification, a value greater than 5 indicates a very high risk in our scale (Table 4). This is to note here that the PI and TERROR indexes are rescaled and a higher value indicates a high risk. Thus, the results suggest that terrorism reduces tourism revenue at a high to very high risk level of PI. In contrast, PI significantly reduces tourism revenue at each level of terrorism, that is, from very low risk to very high risk level. The magnitude of the PI coefficient at a very high terrorism level is far greater than the magnitude of the PI coefficient at a very low level of terrorism.
Classification of Political Risk.
The results remain similar when TA is used as the dependent variable. The effect of political instability on tourist arrivals at different levels of terrorism shows very similar results at very high and very low risk levels like tourism revenue. However, the magnitude of the coefficients for PI and TERROR are smaller than that of tourism revenue. As we mentioned earlier that tourist arrival represents only foreign tourists but the tourism revenue consists of both domestic and international tourists. Both the results show that the effects of terrorism on tourism are less severe compared to political instability effects. This finding is consistent with Fletcher and Morakabati’s (2008) study.
Conclusion
In this article, we examined the performance of the tourism industry in terms of tourist arrivals and tourism revenue due to the political instability and terrorism for 139 countries for the period 1999–2009, by using panel data estimation techniques. The results show that political instability has an adverse effect on tourism at any level of terrorist threat suggesting that, ceteris paribus, political instability (terrorism) has a negative effect on tourism, and the magnitude of the effect is considerable. This effect is robust after using several indicators, specifications and estimation techniques. The results for control variables are also consistent with the theory; that is, a higher real GDP per capita, tourist attraction, and historical and natural heritage increase number of tourists and the revenue from tourism. On the other hand, a low level of initial exchange rate and increase in exchange rate in terms of the U.S. dollar (depreciation of other countries’ exchange rate) encourages more tourist arrivals to a country.
The partial interaction effects of political instability and terrorism provide interesting insights to identify the impact of tourism at various levels of political risk. In comparison, political instability has a negative impact on tourism at the higher risk level of terrorism. However, the impact of terrorism provides some opposite results at a low and high level of political instability. Terrorism increases tourism at a very low to moderate level of political instability, but after a threshold level, it substantially lowers the value of tourist arrivals and tourism revenue. The impact of political instability shows greater volatility in terms of tourism demand and the effect is at maximum with a fear of more risky terrorist attacks. If a country is in high political turmoil, then a high risk of terrorist threat damages the tourism industry very badly. The policy implication of this study suggests that the countries that rely heavily on the tourism industry should maintain their political stability to reap the benefit of the tourism demand. In conclusion, tourism demand models should include political risk variables in order to obtain more accurate forecasts of tourist numbers and revenue in the presence of political instability and terrorism. It is worth noting that establishing the relationship between tourism demand and political instability and terrorism is essential concerning the importance that policy makers are attributing toward the growth of this sector. Furthermore, policy makers should consider the impacts of political instability while planning and forecasting effective crisis recovery strategies for the development of tourism industry.
Footnotes
Appendix
Descriptive Statistics
| TA | TR | PI | TERR | CEXC | GDPPC | ATT | |
|---|---|---|---|---|---|---|---|
| Mean | 5768 | 4953 | 3.33 | 3.36 | 0.050 | 14125.8 | 1042 |
| Median | 1404 | 1063.3 | 3.08 | 3.25 | 0.017 | 7940.75 | 51.9 |
| Standard Deviation | 11105 | 12188 | 1.12 | 1.94 | 0.193 | 16243.2 | 6964 |
| Panel unit root test (Null hypothesis: panel series is non-stationary) | |||||||
| LLC t-statistics a | −7.335 | −9.126 | −67 | −1437 | −8.33 | −4.79 | −8.59 |
| Prob (LLC) | 0 | 0 | 0 | 0 | 0 | 0 | 0 |
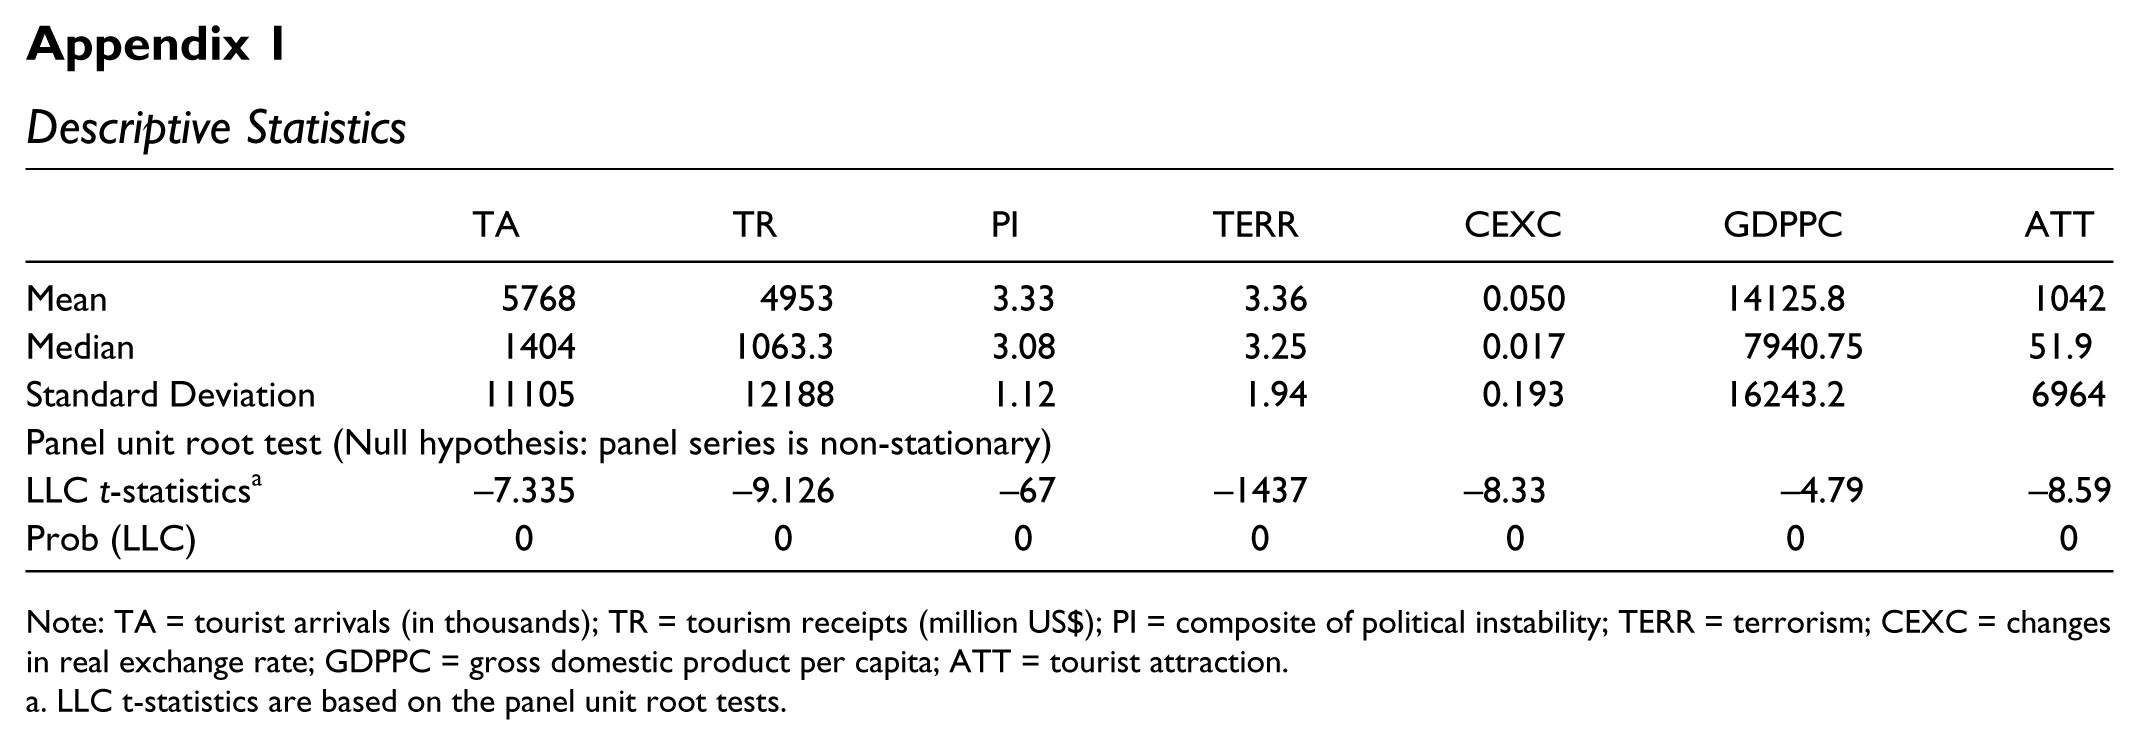
Note: TA = tourist arrivals (in thousands); TR = tourism receipts (million US$); PI = composite of political instability; TERR = terrorism; CEXC = changes in real exchange rate; GDPPC = gross domestic product per capita; ATT = tourist attraction.
LLC t-statistics are based on the panel unit root tests.
Acknowledgements
The authors would like to thank all participants and anonymous referees for their critical comments and suggestions. The financial support for the research from the Faculty of Business and Law, Edith Cowan University is acknowledged. The authors would like to thank Lungowe Andala for her research assistance in this project.
Authors’ Note
The preliminary version of this paper titled “The Impact of Political Instability and Corruption on Tourism Development: A Cross-country Panel Estimate” was presented at the 2011 World Research Summit in Tourism and Hospitality in Hong Kong, Curtin University, Edith Cowan University, and the University of Western Australia.
Declaration of Conflicting Interests
The author(s) declared no potential conflicts of interest with respect to the research, authorship, and/or publication of this article.
Funding
The author(s) disclosed receipt of the following financial support for the research, authorship, and/or publication of this article: The financial support for the research from the Faculty of Business and Law, Edith Cowan University is acknowledged.