
Abstract
Online group buying has become increasingly prevalent, and people frequently shop on group buying (GB) sites. This study examines the relationships among transaction cost advantage, preview, trust, satisfaction, and repurchase intention within online tourism GB environments. To investigate differences in the constructs between the high and low emotional loyalty (EL) groups, this study draws on the moderating role of EL. The results reveal that transaction cost advantage, preview, and trust significantly and positively affect satisfaction, which, in turn, influences repurchase intention. The high-EL group shows stronger relationships between preview and satisfaction and between satisfaction and repurchase intention than the low-EL group. The low-EL group shows stronger relationships between transaction cost advantage and satisfaction and between trust and satisfaction than the high-EL group. The findings have implications for tourism academics and the tourism industry.
Introduction
Group buying (GB) begins with an online daily deal. If enough people desire to purchase the same product or service with a group discount, the deal goes into effect at significantly lower prices. Groupon’s initial public offering has certainly helped open this sector to consumers. Online group buying (OGB) has attained popularity in the hospitality industry (Xiong and Hu 2011). Groupon and LivingSocial, the largest GB companies, have focused on various popular categories of tourism products and services, such as tour packages, hotel accommodations, restaurants, transportation, entertainment, and events. In South Korea (hereafter, “Korea”), GB sites (e.g., Coupang, TiketMonster) were the most popular keywords used in Internet search engines in 2011 (Chung and Song 2011). In 2011, the cumulative transactions of the GB industry amounted to one trillion Korean won (equivalent to approximately US$900 million), which is 20 times the amount in 2010 (Lee 2011; Lim 2011). As GB travel sites become increasingly popular, there is no longer an excuse for consumers with tight budgets not to explore new holiday destinations (Archbold 2012). Although some controversial issues (e.g., fraud, quality, customer service) still need to be resolved in the online tourism group buying (OTGB) industry (Lee 2011; Lim 2011), the GB business and the tourism industry will continue to grow in the future (Archbold 2012; Chung and Song 2011).
OGB is defined as Internet platforms that provide places where consumers can unite to increase their collective bargaining power through the sheer volume of their purchase (Chang, Lee, and Su 2011). Because the procurement outcome depends on the collective actions of all buyers (i.e., if one buyer benefits, the rest of the buyers benefit from the transaction as well), GB sites that offer approximately a 50% discount while requiring a minimum number of buyers differ from other online trading mechanisms, such as online intermediaries (e.g., Expedia, Travelocity, Orbitz), opaque models (e.g., Priceline, Hotwire), and retail models (e.g., Booking.com, Quikbook.com) (Tan, Goh, and Teo 2007). Opaque mechanisms sell unsold travel inventory at discounted and nonrefundable and nonchangeable prices, and the specific supplier remains hidden until the purchase is completed. However, in the retail model, the supplier collects payments directly from the guests and pays a commission (usually 10%) to the provider (Stuart-Hill 2010). OGB is a model in which multiple buyers cooperate and buy the same good/service to bargain with the seller. If there are enough buyers, they may aggregate their purchasing power to obtain volume discounts such that all parties benefit from these transactions (Liao et al. 2012; Pi et al. 2011). By engaging in OGB, consumers can not only realize advantages in quantity system pricing and delivery services but can also collaborate with and share their shopping experiences with netizens (Sun, Luo, and Liu 2010). Xiong and Hu (2011) insist that by utilizing these recent GB practices while paying special attention to customers’ social network dynamics, the hotel industry could develop new business models. Previous research in this area has focused on discounts, buying methods, pricing schemes, profit models, and risk with respect to OGB.
Online group buyers tend to be sensitive to transaction cost advantage, preview, and trust, all of which affect their overall satisfaction. Kim, Chung, and Lee (2011) explore the relationship between transaction costs and satisfaction in the online tourism shopping context. However, no research has been conducted on the relationship between transaction cost advantage and satisfaction in the context of OTGB despite the growing number of online tourism group buyers. Online users might be interested in browsing, searching, and probing text, pictures, and videos, all of which serve as predictors of satisfaction, to determine in advance what they need to know (Reddig, Karreman, and Van der Geest 2008). According to Tanin et al. (1998) and Tate (1994), a preview serves as a significant predictor of consumer attitudes and behavioral intentions; however, no connection has been made in previous studies to online tourism group buyers.
Tourism group buyers are likely to visit sites that they believe to be reliable, which influences their satisfaction. Kim, Jin, and Swinney (2009) clearly demonstrate that trust and satisfaction are positively associated within an online context, although tourism group buyers do not receive exclusive treatment in that study. Tourism shoppers’ satisfaction increases the likelihood that they will purchase again; thus, repurchasing behavior is a key factor in the success of GB companies. Lee, Choi, and Kang (2009) and Mittal, Ross, and Baldasare (1998) note that consumer satisfaction actively influences repurchase intention; however, the connection between tourism group buyers’ satisfaction and repurchase intention is neglected. Therefore, the primary purpose of this study is to investigate the structural relationships between transaction cost advantage and satisfaction, between preview and satisfaction, between trust and satisfaction, and between satisfaction and repurchase intention within the OTGB context.
Previous researchers have studied emotions related to loyalty in the hospitality industry (Gracia, Bakker, and Grau 2011; Mattila 2001, 2004). Tourism scholars have also paid considerable attention to affective loyalty, which is similar to emotional loyalty (EL) (Han, Kim, and Kim 2011; Yuksel, Yuksel, and Bilim 2010). Sarri and Drennan (2006) define EL as a term that includes both affective loyalty and affective commitment. Commitment is identified as one of the key mediating constructs in customer loyalty (Garbarino and Johnson 1999; Morgan and Hunt 1994). EL is slightly different from commitment; commitment is an enduring desire to maintain valued relationships (Moorman, Deshpande, and Zaltman 1993). Previous studies have shown that EL has a crucial effect on heart versus mind, share of wallet, and music purchase behavior (Härtel and Russell-Bennett 2010; Kim and Lee 2010; Sarri and Drennan 2006).
Success in competitive GB industries depends on the products that various consumers want to buy. Because of the increasing competition of GB sites, GB companies need to segment their markets according to the loyalty levels associated with transaction cost advantage, preview, trust, and satisfaction. However, research on the relationships between transaction cost advantage, preview, trust (antecedent variables), satisfaction (mediator), and repurchase intention (dependent variable) is limited in OTGB environments. Furthermore, little is known about the moderating role of EL in the relationships that exist within OTGB. From a strategic perspective of leveraging OTGB initiatives, we examine the relationships between transaction cost advantage, preview, trust, satisfaction, and repurchase intention for low and high-EL groups. Specifically, we analyze the moderating role of EL in the relationships between transaction cost advantage, preview, trust, satisfaction, and repurchase intention within the context of OTGB.
Literature Review
Trends in OGB
After the maturation of the daily deal industry, the industry will continue to grow and niche sites that have developed original concepts instead of simply copying Groupon’s model will both survive and thrive (Tobias 2011). The Groupons of the world have exhausted their resources by acquiring new customers and finding new merchants, so Groupon and LivingSocial will make massive investments in mobile capabilities. Google, Facebook, and other major aggregators continue to extend their commitments to the integration of location, advertorial, mobile, and contextual commerce (Tobias 2011). According to Ramon Ray and the Smallbiztechnology.com team (2011), group deals are experiencing steady growth among local merchants, and group deals are highly favored among the businesses that have tried them. Based on Kamenec’s interview with Deer (2011), although travel is a specialist market, an innovative business model that targets the movement of low-shoulder and low-yield inventory will be successful in OGB.
Transaction Cost Advantage and Its Relation to Satisfaction
In tourism, purchasing travel products over the Internetis beneficial because Internet travel services can reduce travelers’ costs by providing the lowest prices and the highest discounts (Kim, Kim, and Han 2007). Kim and Li (2009) find that online travelers select transaction channels that have the lowest costs among all available options, and explain this by applying the theory of transaction cost economics for cost savings in e-commerce. To measure transaction cost effectiveness, Kim et al. (2012) adapt items indicating that shopping tourism products from online sites may be economical, reduce transaction costs, and generate discounts. Bharadwaj and Matsuno (2006) assess transaction cost advantages based on overall transaction cost savings, savings in terms of possession costs (e.g., lower inventory and warehousing costs, insurance costs), and lower acquisition costs (e.g., order processing costs, delivery monitoring costs, follow-up costs in case of delivery inaccuracy and delay, contract negotiation costs). In this study, transaction cost advantage is defined as saving costs, generating discounts, and taking advantage of transaction costs from OTGB.
Satisfaction is defined as a function of expectation and expectancy disconfirmation and is believed to influence attitude change and purchase intention (Oliver 1980). Feelings of satisfaction with not only a product or service but also with information arise if the product/service meets expectations and desires (Spreng, Mackenzie, and Olshavsky 1996). Fournier and Mick (1999) identify the following insights regarding satisfaction about technological products: (1) consumer product satisfaction is an active and dynamic process; (2) the satisfaction process often has a strong social dimension; (3) meaning and emotion are integral components of satisfaction; (4) the satisfaction process is context-dependent and encompasses multiple paradigms, models, and modes; and (5) product satisfaction is invariably intertwined with life satisfaction and the quality of life itself. According to Dube, Renaghan, and Miller (1994), there is no guarantee that a satisfied customer will make a repeat visit; however, it is almost certain that a dissatisfied customer will not return.
With respect to the relationship between transaction cost advantage and satisfaction, satisfaction with online travel products is negatively affected by transaction costs (e.g., comparison, searching, monitoring) (Kim and Li 2009). In the context of online tourism shopping, transaction cost effectiveness also has a significantly positive effect on satisfaction (Kim et al. 2012). According to Bharadwaj and Matsuno (2006), a customer’s transaction cost advantage has a positive effect on customer satisfaction in a supply chain relationship. Thus, we propose that transaction cost advantage is related to satisfaction in OTGB as follows:
Hypothesis 1: Transaction cost advantage has positive effects on satisfaction in OTGB.
Preview and Its Relation to Satisfaction
In the online environment, the term preview is defined as the ability to browse, search, and examine in advance. Browsing involves scanning, which is described as looking, examining, or sampling. It also involves a distinct consumer shopping behavior that is related to but not identical with buying behavior (Harper et al. 2004). According to Harper et al. (2004), preview is involved in the activities of searching and selecting worthwhile information. However, preview is also important for the successful completion of shopping behavior. To predict the helpfulness of sites, Aula et al. (2010) conceptualize two types of preview—visual (e.g., thumbnails) and textual (e.g., title/URL, full snippets) site preview. According to Xiang and Soberman (2011), from the consumer’s perspective, a preview provides information about products to potential consumers and helps consumers find products that they prefer and avoid products that they do not prefer.
With regard to the relationship between preview and satisfaction, Tate (1994) finds that realistic job preview tends to increase employee job satisfaction and retention. By facilitating data exploration, query preview can improve performance and lead to higher user satisfaction (Tanin et al. 1998). In content management systems, Reddig, Karreman, and Van der Geest (2008) find that previews enhance users’ satisfaction with the systems and their effectiveness in using the systems. The researchers also suggest that previews may help to interpret system reactions within the context of interface interactions on a website. Drawing on previous research, we propose that preview by online shoppers contributes to their satisfaction with OTGB as follows:
Hypothesis 2: Preview has a positive effect on satisfaction in OTGB.
Trust and Its Relation to Satisfaction
Trust has received considerable attention for its key role in relationships (Dickinger 2011; Doney and Cannon 1997; Garbarino and Johnson 1999; Moorman, Deshpande, and Zaltman 1993; Morgan and Hunt 1994). According to Moorman, Deshpande, and Zaltman (1993), trust includes both confidence in an exchange partner (the psychological component) and a willingness to rely on an exchange partner (the sociological component), and confidence and reliance indicate the critical roles of uncertainty and vulnerability in relationships. Morgan and Hunt (1994) state that trust exists if one party has confidence in an exchange partner’s reliability and integrity. Marketers who trust their trading partners should feel more secure. Doney and Cannon (1997, p. 36) define trust as “the perceived credibility and benevolence of a target of trust.” This definition implies that a buying firm facing some degree of risk in a purchase situation turns to a supplier or salesperson whom the buyer expects to perform effectively and reliably (credibly) and who is interested in the customer’s best interests (benevolence).
Rather than focusing on trust in individuals, Garbarino and Johnson (1999) examine customers’ trust in organizations, which is captured as customer confidence in the quality and reliability of services offered. With respect to the relationship between trust and satisfaction, Chiou and Droge (2006) find that trust is positively associated with overall satisfaction. Moreover, satisfaction is positively affected by management policies and practices as well as by the trustworthiness of frontline employees (Orth and Green 2009). According to Kim, Jin, and Swinney (2009), e-trust has a highly positive effect on e-satisfaction. Based on the previous literature, we posit that shoppers’ trust contributes to their satisfaction in OTGB as follows:
Hypothesis 3: Trust has a positive effect on satisfaction in OTGB.
Repurchase Intention and Its Relation to Satisfaction
Repurchase intention is defined as “the subjective probability that an individual will continue to purchase products from the online vendor or store in the future” (Fang, Chiu, and Wang 2011, p. 484). Satisfaction and repurchase intention are qualitatively different constructs in that satisfaction may be merely a judgment with cognitive and affective dimensions, whereas repurchase intention also has a behavioral component (Mittal, Ross, and Baldasare 1998). In addition, the aforementioned study confirms that overall satisfaction has distinct effects on repurchase intention. Online consumers’ repurchase intentions are included as a final dependent variable in Lee, Choi, and Kang’s (2009) model, and e-satisfaction positively influences repurchase intention.
In the tourism context, the relation of satisfaction to repurchase intention has been widely examined (Bojanic and Warnick 2012; He and Song 2009; Magnini, Crotts, and Zehrer 2011). Bojanic and Warnick (2012) demonstrate that satisfaction is the most salient antecedent among other determinants, including purchase decision involvement, prior attendance, and travel distance, in explaining the likelihood that a customer will return to a special event. He and Song (2009) find that satisfaction is a key mediator between quality/value and repurchase intention for packaged tour services. Unexpected value and surprise increase the satisfaction of travelers, which affects a customer’s repurchase intention and willingness to recommend (Magnini, Crotts, and Zehrer 2011). Regarding online shopping, the researchers claim that repurchase intention is primarily influenced by satisfaction and that satisfaction is a powerful mediator between quality perceptions and trust and has a strong influence on repurchase intention. Based on previous studies, we expect that online shoppers’ satisfaction contributes to their repurchase intention in OTGB as follows:
Hypothesis 4: Satisfaction has a positive effect on repurchase intention in OTGB.
EL and Moderating Effect
Recently, researchers have paid close attention to tourists’ emotional experiences based on festival atmospherics, which ultimately influence tourists’ intention to revisit the festival (Lee and Kyle 2012). Furthermore, conceptualizations of loyalty have incorporated emotion (Mattila 2001). Customers’ affective responses influence their loyalty; thus, emotional responses are likely to influence customers’ loyalty as well (Gracia, Bakker, and Grau 2011). According to Han, Kim, and Kim (2011), affective loyalty can be conceptualized in terms of positive emotions (e.g., peacefulness, romantic love, excitement) and negative emotions (e.g., regret, disappointment, shame, surprise, worry). Yuksel, Yuksel, and Bilim (2010) suggest that satisfaction with hedonic services builds affective loyalty, which is based on consumers’ affect-based attitudes toward a product and is measured by the following items: “I love staying in A,” “I feel better when I stay in A,” and “I like A more than other destinations.”
Härtel and Russell-Bennett (2010, p. 2) define EL as “the psychological preference for buying a brand that consists of positive feelings about and affective attachment to continually purchasing a brand.” The researchers assert that EL is most important for purchases of goods such as music, entertainment, fashion, and beauty treatments (Sarri and Drennan 2006). Customers with high levels of emotional bonding with their service providers show higher tendencies toward continuous loyalty than those with low levels of emotional bonding, suggesting the importance of affective commitment by demonstrating that emotional bonding moderates customer responses to service failures (Mattila 2004). Kim and Lee (2010) find that less educated customers with high-EL tend to be enthusiastic browsers and purchasers and that apparel shoppers tend to allocate a higher share of their financial resources to a particular retailer if they are emotionally attached to that retailer. EL is used as a term that encompasses both affective loyalty and affective commitment. Consumers with higher levels of EL are more inclined to purchase music rather than to download it free of charge (Sarri and Drennan 2006).
Under conditions of high loyalty, dissent increases strategic decision-making teams’ evaluations of decision quality, suggesting that individuals in teams with shared trustworthiness are more willing to voice divergent opinions (Dooley and Fryxell 1999). If loyalty is low, dissent appears to have a negative effect on the decision quality reported by a team (Dooley and Fryxell 1999). Purchases by consumers with high-EL tend to generate more profit and reduce operating costs compared to purchases by consumers with low-EL (Kim and Lee 2010). Drawing on the previous literature, we expect a moderating effect of EL between transaction cost advantage and satisfaction in OTGB. We propose the following hypothesis:
Hypothesis 1a: The relationship between transaction cost advantage and satisfaction is stronger in the high-EL group than in the low-EL group in OTGB.
The moderating effect of loyalty is found in the relationship between navigational functionality and satisfaction through trust in the online tourism shopping context (Kim et al. 2012), implying a moderating effect of EL between preview and satisfaction. Drawing on the previous literature, we expect a moderating effect of EL between preview and satisfaction in OTGB. Thus, we propose the following hypothesis:
Hypothesis 2a: The relationship between preview and satisfaction is stronger in the high-EL group than in the low-EL group in OTGB.
Based on Lee and Back (2009), a moderating effect of the behavioral brand loyalty of attendees exists for updated expectations of brand value, brand satisfaction, and brand trust paths, implying a moderating effect of EL on consumer trust and satisfaction. Drawing on the previous literature, we expect a moderating effect of EL between trust and satisfaction in OTGB. Accordingly, we propose the following hypothesis:
Hypothesis 3a: The relationship between trust and satisfaction is stronger in the high-EL group than in the low-EL group in OTGB.
In tourism environments, research on satisfaction and loyalty related to repurchase intention has focused on brand loyalty, tourist loyalty, and customer relationship management (Li and Petrick 2008; Prayag and Ryan 2012). Li and Petrick (2008) suggest that customer satisfaction with a brand highly affects the customer’s attitudinal loyalty to the brand, which influences their behavioral loyalty (i.e., the repurchase intention). Prayag and Ryan (2012) indicate that the relationships between antecedents and the loyalty of visitors with respect to revisit and recommendation intentions are mediated by satisfaction levels. A provider’s success in the online tourism market depends on its customers’ loyalty to its website, which, in turn, influences repurchase intentions for travel products and services (Kim, Lee, and Hiemstra 2004). Yi and La (2004) confirm that the mechanisms underlying the link between customer satisfaction and repurchase intention may differ according to the level of loyalty, predicting a moderating role of EL on satisfaction and repurchase intention. The result is a moderating effect of EL between satisfaction and repurchase intention in OTGB. Drawing on the previous literature, we propose the following hypothesis:
Hypothesis 4a: The relationship between satisfaction and repurchase intention is stronger in the high-EL group than in the low-EL group in OTGB.
Methodology
Measurements
In this study, the measures of the six constructs of OTGB—transaction cost advantage, preview, trust, satisfaction, repurchase intention, and EL—were derived from previous studies. Because a single item is usually too specific to capture all attributes of a construct and is likely to have a high rate of measurement error, we adapted multimeasurement items for each construct (Churchill 1979). Specifically, to assess the transaction cost advantage of the measurements, a five-item scale for transaction cost savings associated with TGB was adapted from Bharadwaj and Matsuno (2006), Kim et al. (2012), and Kim and Li (2009). Seven preview items related to TGB were drawn from the existing literature (Aula et al. 2010; Harper et al. 2004; Tanin et al. 1998; Xiang and Soberman 2011). Five items for the trust construct for TGB were adapted from previous studies (Doney and Cannon 1997; Garbarino and Johnson 1999; Moorman, Deshpande, and Zaltman 1993; Morgan and Hunt 1994). Five items for the satisfaction construct for TGB were drawn from previous studies (Dube, Renaghan, and Miller 1994; Fournier and Mick 1999; Spreng, Mackenzie, and Olshavsky 1996). For the construct of repurchase intention, five items were adapted from previous studies (Fang, Chiu, and Wang 2011; Lee, Choi, and Kang 2009; Mittal, Ross, and Baldasare 1998). To measure the construct of EL, we adapted five items from previous studies (Härtel and Russell-Bennett 2010; Kim and Lee 2010; Mattila 2004; Sarri and Drennan 2006). Ten general items related to GB sites were generated after we conducted an extensive review of the relevant literature (Liao et al. 2012; Pi et al. 2011; Tan, Goh, and Teo 2007).
To refine our measurements, first, three academic experts in online tourism were asked to verify the content validity of the preliminarily generated items. Second, four experts in GB businesses were asked to indicate whether any of these measurement items needed to be refined. Third, a pretest was conducted with 50 people who had had experience with OTGB during the previous year. Through these three procedures, we decided to remove two of the 48 items generated from the previous literature. Furthermore, several ambiguous items were reworded for clarity. All items were measured on a 7-point Likert scale ranging from strongly disagree (1) to strongly agree (7).
Data Collection
This study used online surveys to reach online tourism group buyers because online users are engaged in TGB. With the development of the Internet, researchers in online tourism fields can use online surveys to efficiently reach populations of interest (Kim, Chung, and Lee 2011). To collect data, we employed a top-ranking Korean Internet survey firm (Embrain: www.embrain.com), which possesses a panel of 970,000 users recruited from telephone and mobile phones, voluntary participation, recommendations by panel members, and offline promotions. The sample was selected from nationwide panels. Survey notices were sent using the company’s bulk e-mail and SMS mailing system.
Respondents who complete the questionnaire too quickly and provide responses in recognizable patterns in order to receive the reward for participation are automatically excluded by the data collection system. Respondents who provide such patterned responses three times have their memberships revoked. The survey result database is managed to prevent the same respondent from participating in a similar survey for a certain time period. The Internet research firm employed screening questions to exclude potential respondents who had not made OTGB purchases and who were only seeking participation rewards. When a respondent failed to answer a question, the survey engine refused to proceed to the next question until the omitted question had been completed. Completed questionnaires containing obvious response patterns were eliminated from the sample.
Online questionnaires were sent to 50,031 potential respondents who were chosen from the Internet survey firm’s panel. Confirmations of email addresses were received from 2,612 respondents, and 946 respondents connected to the questionnaire. The Internet survey was conducted in June 2011. Initially, each respondent was asked to provide the name of a GB site from which he/she had recently purchased tourism products or services. The name of the site mentioned by the respondent appeared on the online screen for every subsequent question. Through this procedure 400 questionnaires were collected (response rate of 42.3%). We checked the data for outliers, incomplete answers, and missing important questions. Because no errors were detected, all 400 questionnaires were coded for analysis. Cook, Heath, and Thompson (2000) find that web surveys are associated with relatively homogeneous responses and low response rates. Considering Neslin et al. (2009) predict a 41.3% response rate for online surveys, the response rate of 42.3% in this study is sufficiently high and, thus, the nonresponse rate is not a serious concern.
The quota sampling method was employed in our study to calculate the appropriate numbers of Korean GB respondents of each age, gender, and income category based on data from the Korea Communications Commission (2011). According to the Korea Communications Commission data (2011), 10.7% of all women in Korea have experience with OGB whereas 8.2% of men have experience with OGB, and the age group of 20–29 years represents the largest proportion (20.4%), followed by those 30–39 years old (10.5%) and 40–49 years old (5.2%). There were slightly more females in our sample (52.7%) than males (47.3%), and 20–29 years old represented the largest group (54.4%), followed by 30–39 years old (32.8%) and 40–49 years old (12.5%).
When the data for all the model variables come from the same respondents in one-time survey, common method variance may influence some postulated relationships in the partial least squares (PLS) path model (Sattler et al. 2010). We took precautions to minimize common method bias (Podsakoff et al. 2003). First, we rotated the sequence of the survey items so different respondents saw the survey items in different sequences. In addition, to decrease the respondents’ apprehension, we assured them that there were no right or wrong answers to the measures. We also assured them of the confidentiality of both their identities and their responses. Next, a statistics test for common method bias, Harman’s single factor test, was performed. All of the self-reported items were entered into a principal components factor analysis with varimax rotation. If a single factor emerges or one factor accounts for more than 50% of the variance in the variables, common method variance is present (Podsakoff et al. 2003). Our analysis showed that three factors were present, and the major factor accounted for 28.3% of the variance. Because this test suffers from some limitations (Podsakoff et al. 2003), we also conducted another test with a PLS path model, one with three factors specified and another with only one factor specified. When method variance is a significant problem, a single-factor model should fit the data as well as a more complex model (McFarlin and Sweeney 1992). The three-factor model in the PLS path yielded a better fit than the single-factor model, revealing higher average variance extracted (AVE), composite reliability, R2, Cronbach’s α, and lower latent variable correlations (Sattler et al. 2010). Therefore, these two statistical tests confirm that common method bias is not a threat in this study.
Data Analysis
To analyze the data, we employed a component-based approach using the PLS method. PLS has been widely used in theory testing and confirmation. Because this method is also appropriate for examining whether relationships exist, PLS can suggest useful propositions for later testing (Chin, Marcolin, and Newsted 2003). Additionally, PLS relies on a smaller sample size for validating a model than other structural equation modeling techniques (Kline 2011). Because both the high- and low-EL groups contained fewer than 200 participants, PLS was utilized in this study. The PLS method applies a principal component analysis that analyzes the total variance and estimates factors as simple linear combinations (composites) of the indicators with an ordinary least squares multiple regression (Kline 2011). We used PLS-Graph 3.0 and Smartpls 2.0 to analyze the measurements and structural models (Stevens 2009).
Analysis and Results
Respondent Profile
As shown in Appendix A, 74.0% of the high-EL group and 76.4% of the low-EL group were university students or degree holders. Additionally, 77.0% of the high-EL group and 61.3% of the low-EL group were single. With respect to monthly personal income, 35.9% of the high-EL group and 26.3% of the low-EL group were in the over 3 million Korean won (equivalent to US$2,730) bracket. Office workers constituted the largest proportion of the high-EL group (35.2%) and the low-EL group (29.6%). For gender, 56.6% of the high-EL group and 36.2% of the low-EL group were male. In terms of the largest category of age, 52.6% of the high-EL group and 61.8% of the low-EL group fell into the 20- to 29-year-old bracket.
Grouping Check
The respondents were divided into two groups, high- and low-EL. This distinction was based on the median split of EL construct scores (4.00) (Renkl 1997; Yi and La 2004). The EL construct was measured by four items (Cronbach’s α = .909), such as “I feel emotionally attached to the tourism products on the GB site” (factor loading = .891), “I continue to shop on the site because I am genuinely interested in the tourism products on the GB site” (factor loading = .840), “I continue to shop on the site because I enjoy being associated with the GB site” (factor loading = .932), and “I continue to shop on the site because I like the customer service staff of the GB site” (factor loading = .881). The high-EL group (n = 173) had a mean EL level of 5.030 and a standard deviation of .695, whereas the low-EL group (n = 152) had a mean EL level of 2.941 and a standard deviation of .740. The subjects at the median (n = 75) were excluded to achieve a more accurate analysis (Yi and La 2004).
Measurement Model
To validate all constructs in our research model, the measurement model was assessed separately for the entire group and for each subgroup. We conducted validity assessments of content, discriminant, and convergent validities to validate the measurement model. As shown in Appendix B and Table 1, all of the constructs (i.e., transaction cost advantage, preview, trust, satisfaction, and repurchase intention of OTGB) in the model satisfied the reliability requirements with a composite reliability greater than .70 and the discriminant validity requirements with AVE greater than .50. Additionally, for each construct, the square root of the AVE was greater than each correlation coefficient for convergent validity, and Cronbach’s α was greater than .70 for content validity (Campbell and Fiske 1959). We also examined the discriminant and convergent validity of each indicator (Bhattacherjee and Sanford 2006). The results presented in Tables 1 and 2 demonstrate adequate discriminant and convergent validity.
Reliability and Discriminant Validity.
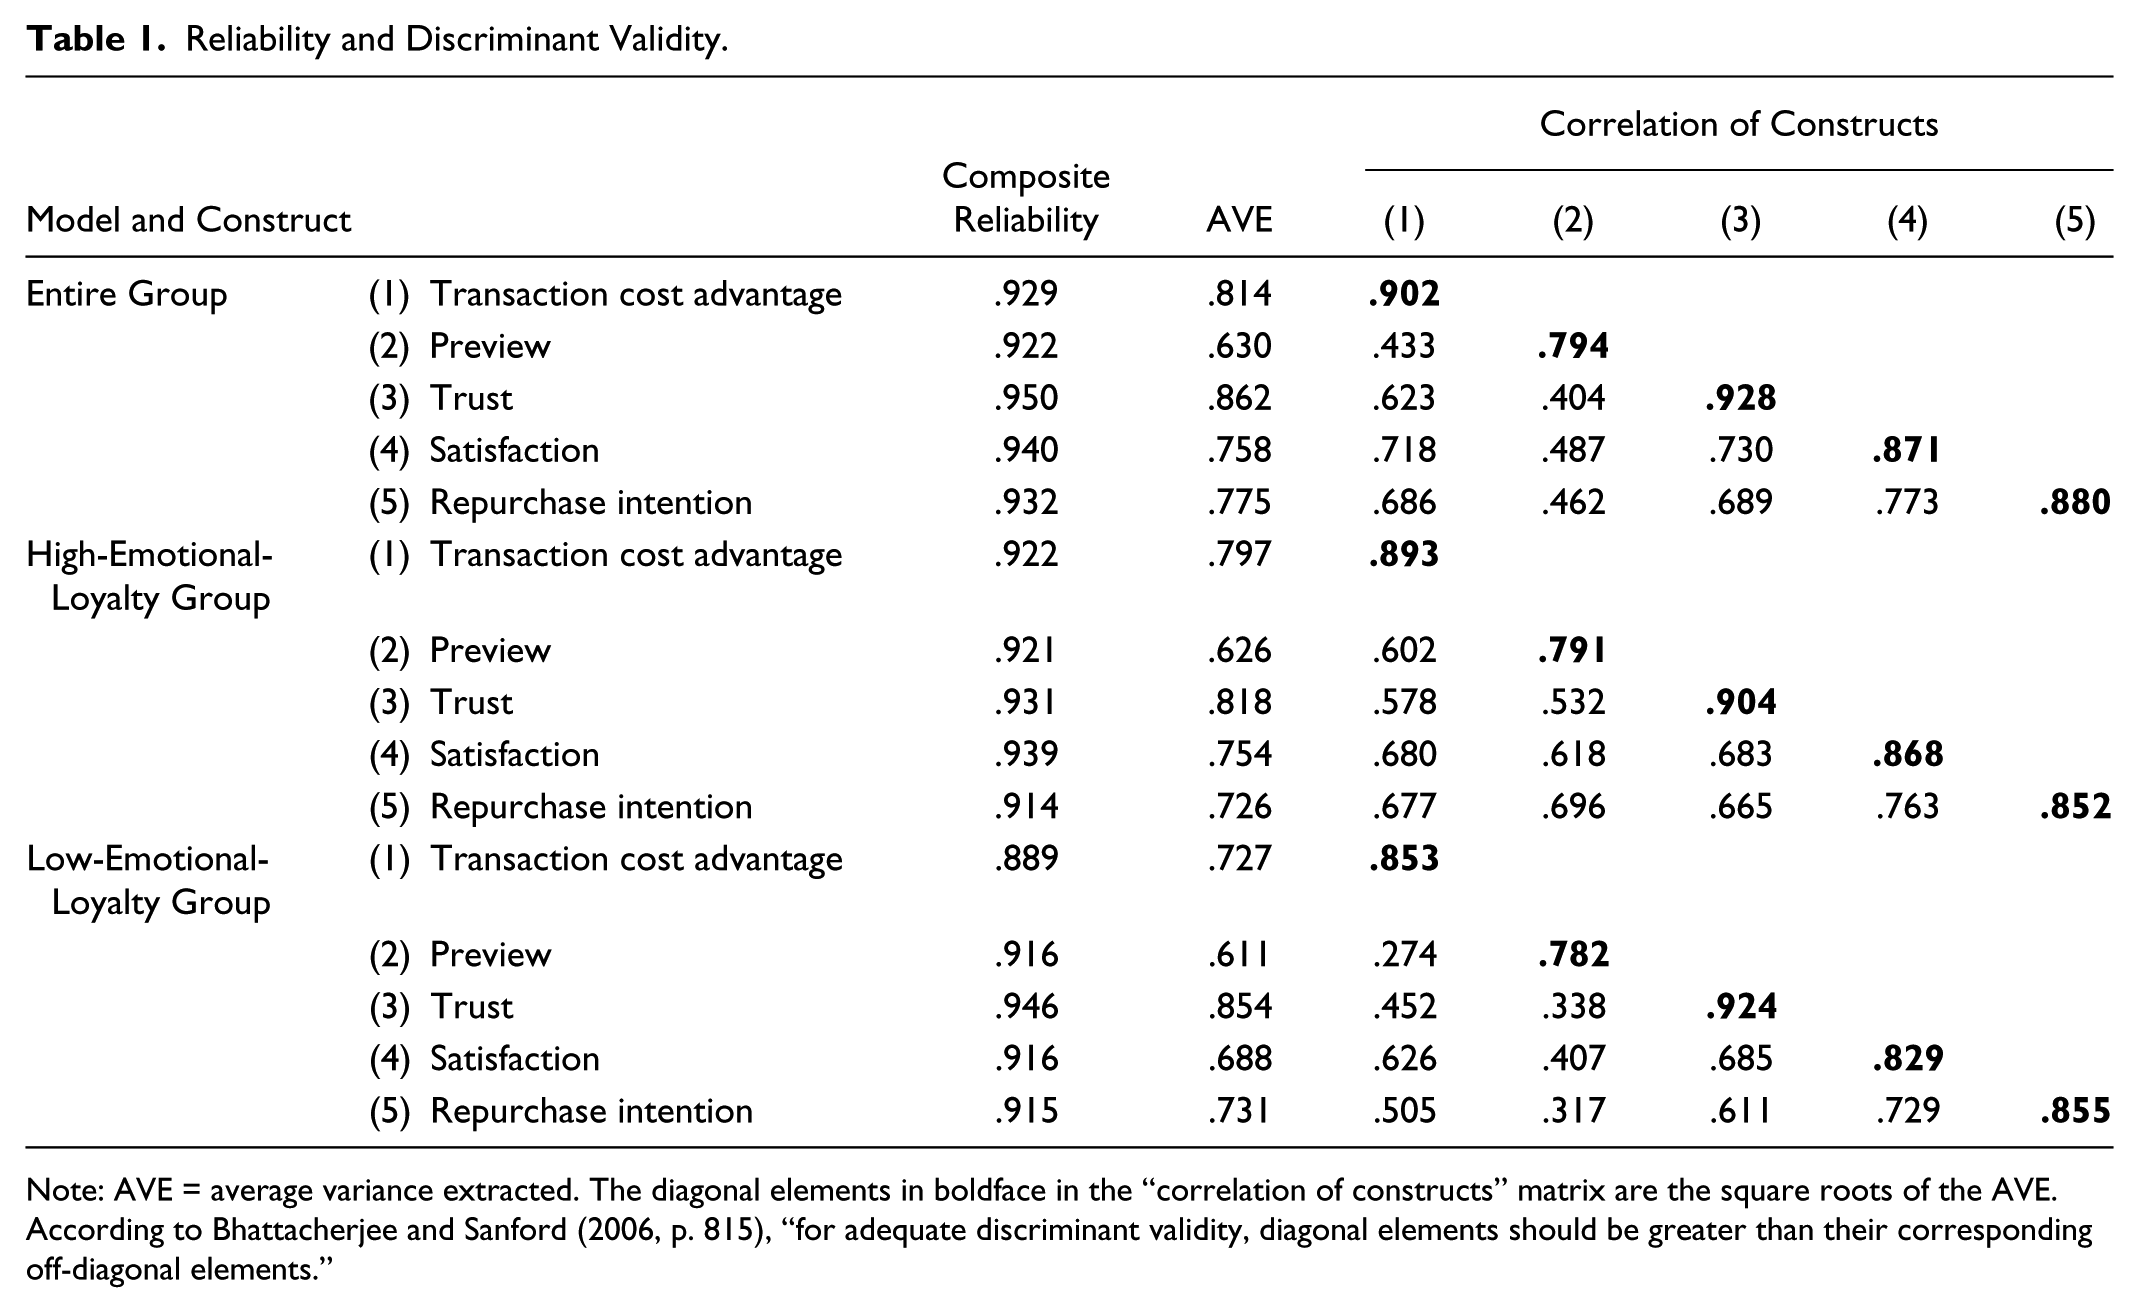
Note: AVE = average variance extracted. The diagonal elements in boldface in the “correlation of constructs” matrix are the square roots of the AVE. According to Bhattacherjee and Sanford (2006, p. 815), “for adequate discriminant validity, diagonal elements should be greater than their corresponding off-diagonal elements.”
Standardized Structural Estimates and Tests of the Main Hypotheses (Entire Group).
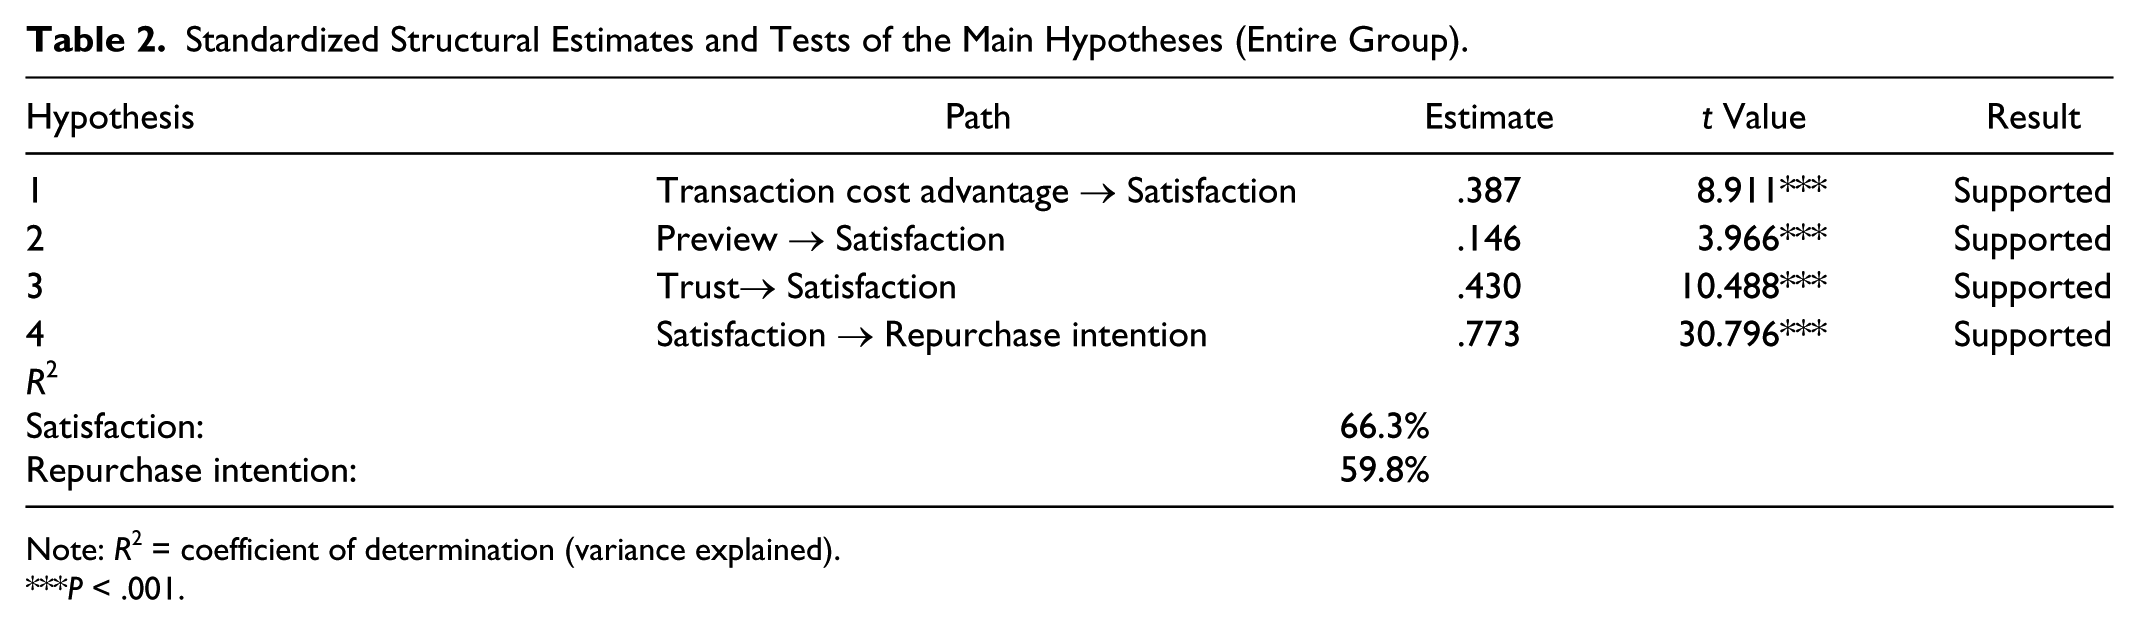
Note: R2 = coefficient of determination (variance explained).
P < .001.
Structural Model and Hypothesis Testing
We estimated three separate models in PLS for three groups: the entire group, the high-EL group, and the low-EL group. We then tested for differences across all three models. To evaluate the predictive power of the structural model, we calculated the R2 for satisfaction and repurchase intention with regard to OTGB. Interpreted in a manner similar to the multiple regression results, R2 indicates the amount of variance explained by the exogenous variables (Kline 2011). Using a bootstrapping technique, we calculated the path estimates and t-statistics for the hypothesized relationships. The results suggest that distinct antecedents influence the formation of satisfaction with and repurchase intention regarding OTGB within each group. The results using PLS are shown in Figures 1 and 2.
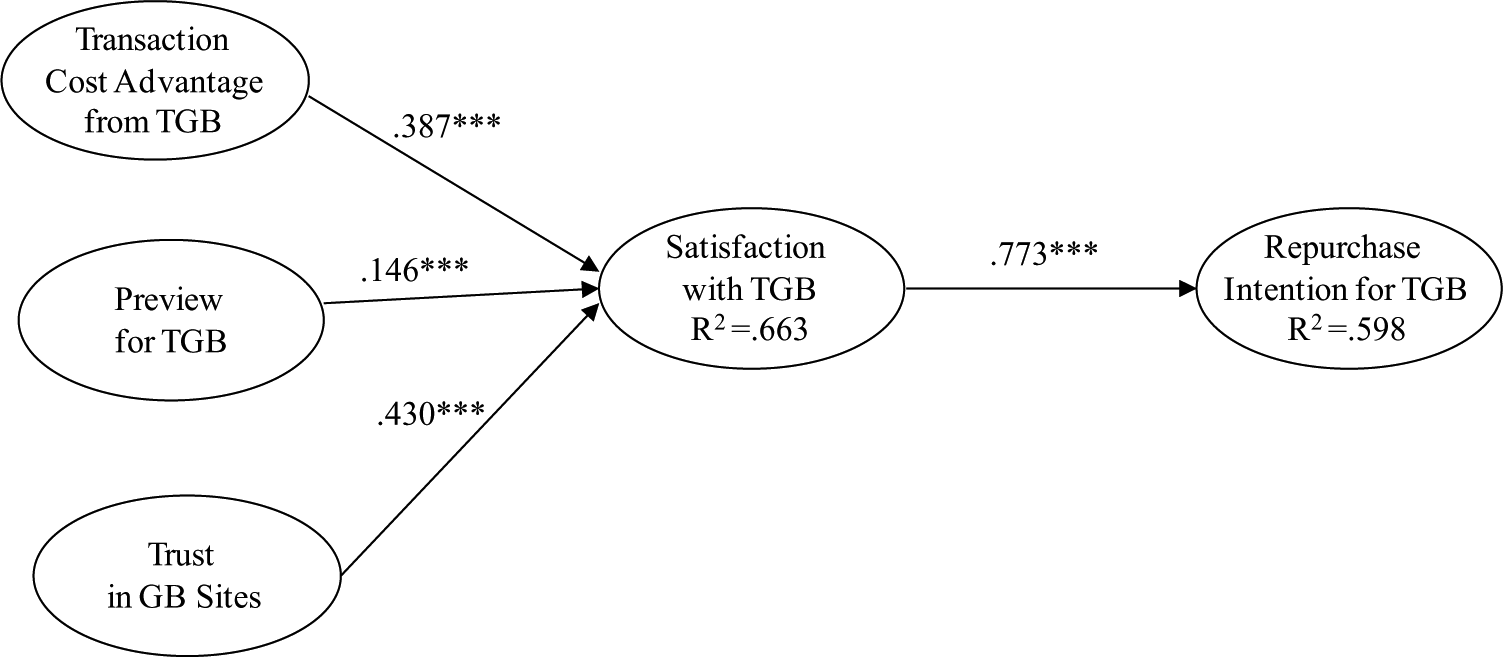
The estimated structural model for the entire group.
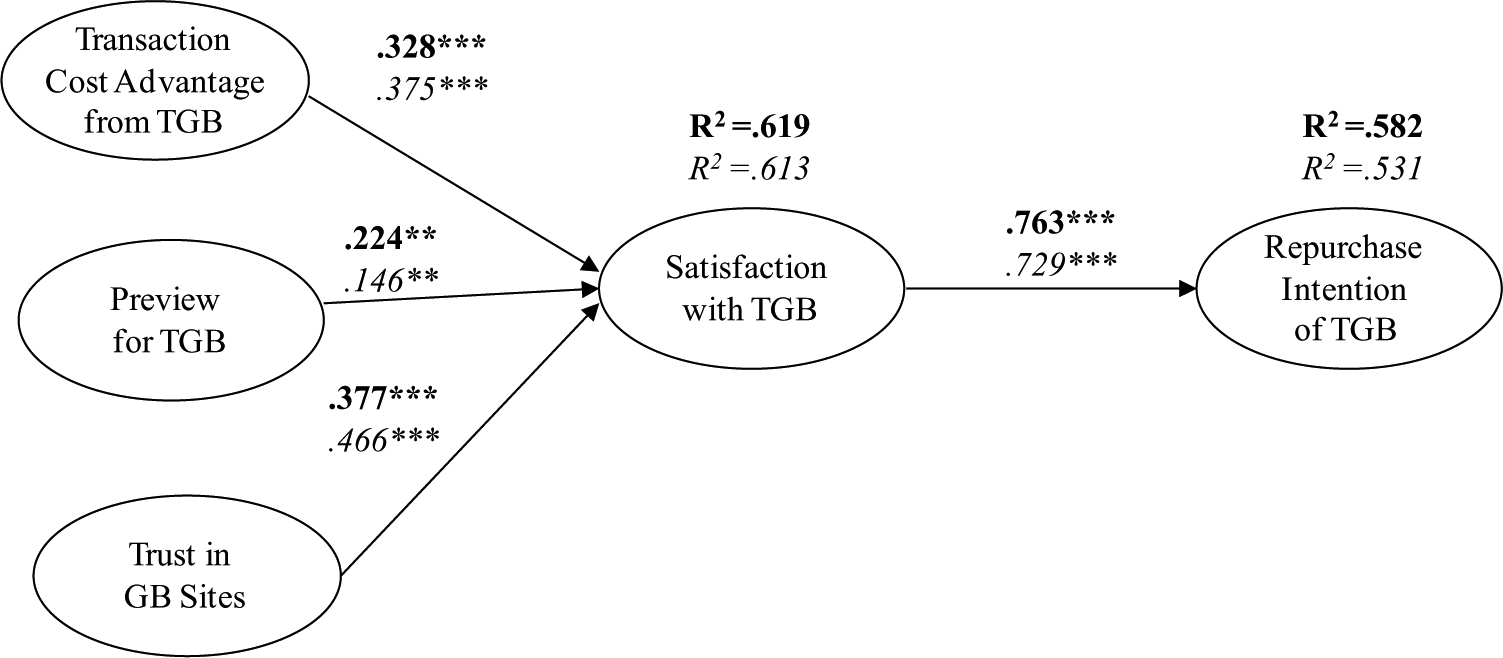
The estimated structural model for the high- and low-EL groups.
Figure 1 shows the PLS results for the entire group. All the research hypotheses posited in the literature review section are supported, and the results are statistically significant. Table 2 and Figure 1 indicate that satisfaction in OTGB is significantly influenced by transaction cost advantage (β = .387, t value = 8.911, P < .001), preview (β = .146, t value = 3.966, P < .001), and trust (β = .430, t value = 10.488, P < .001). Thus, hypotheses 1 to 3 are supported. OTGB repurchase intention is also significantly affected by satisfaction (β = .773, t value = 30.796, P < .001), supporting hypothesis 4.
We present the moderating effect of EL in Table 3. We also test the remaining hypotheses, 1a to 4a. Previous researchers have suggested comparing the model’s explained variance (R2) with the associated regression results when examining groups (Kline 2011). A comparison of the results suggests that differences exist between the groups. The structural model predicted a 5.1% greater variance for repurchase intention and a .6% greater variance for satisfaction in the high-EL group compared to their counterparts in the low-EL group. In terms of the structural model, a simple comparison of the standardized path coefficients suggests that transaction cost advantage, preview, trust, and satisfaction uniquely influence each group’s repurchase intention. To compare the research model across the two groups, we conducted a multigroup analysis using PLS by comparing the differences in the coefficients of the corresponding structural paths of the two research models. We used the multigroup analysis equation suggested by Chin, Marcolin, and Newsted (2003) and Keil et al. (2000) as follows:
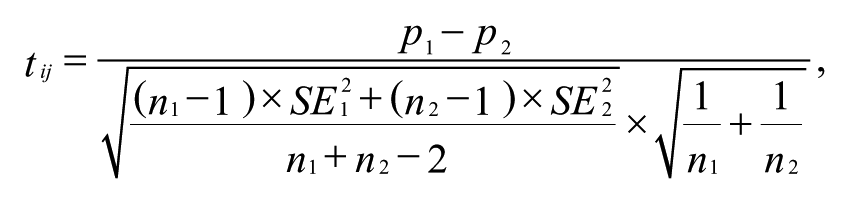
where
pi = path coefficient in the structural model of ELi
ni = sample size of the data set for ELi
SEi = standard error of path in the structural model for ELi
tij = t-statistic with n1 + n2; two degrees of freedom
i = 1 for the high-EL group and j = 2 for the low-EL group
Comparison of the Path Coefficients between the High- and Low-EL Groups.
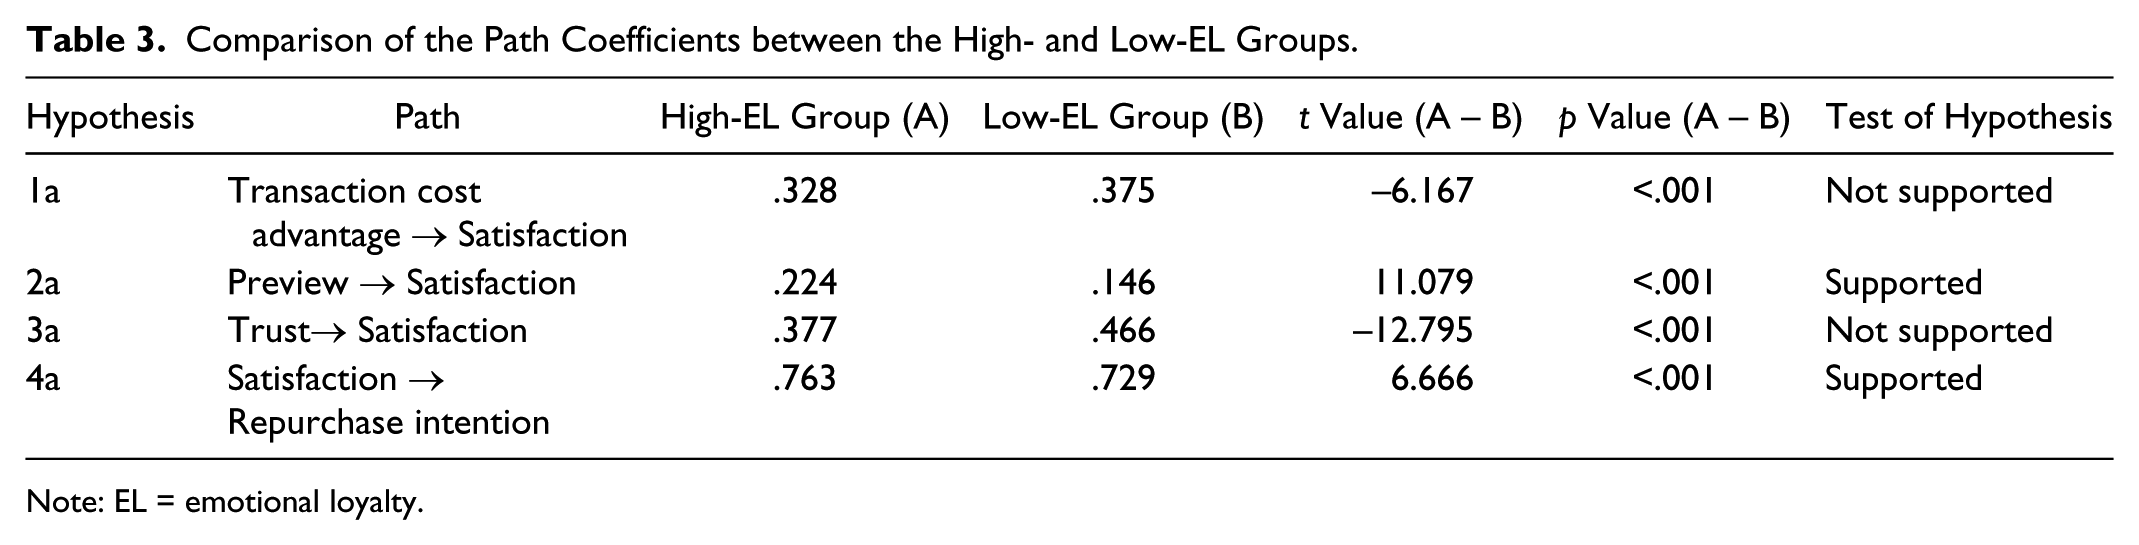
Note: EL = emotional loyalty.
The results indicate that the coefficients of each path for transaction cost advantage, preview, trust, satisfaction, and repurchase intention for the high- and low-EL groups are significantly different from their corresponding coefficients in the structural model (see Table 3). In the case of the high-EL group, the magnitude (high-EL group = .224 > low-EL group = .146) of the coefficient of preview on satisfaction and the magnitude (high-EL group = .763 > low-EL group = .729) of the impact of satisfaction on repurchase intention are significantly greater in the high-EL group than in the low-EL group. Therefore, the results support hypotheses 2a and 4a. However, transaction cost advantage (high group = .328 < low group = .375) and trust (high group = .377 < low group = .466) affect satisfaction more significantly in the low-EL group than in the high-EL group. Therefore, the results do not support hypotheses 1a and 3a. It appears that low-EL shoppers have a weaker emotional commitment to sites. They are more likely to search for lower transaction costs and lower price points than their counterparts in the high-EL group. Additionally, low-EL shoppers may not have much experience with OGB. Consequently, they believe that there is more risk involved and seek a greater level of trust from GB companies than their counterparts in the high-EL group.
Discussion and Conclusions
Interestingly, the findings of this study indicate that trust is the most vital antecedent of OTGB. Consumers may buy from GB sites to pay lower prices but they are primarily concerned about trust in GB sites, implying that GB companies should concentrate on reliability. Preview plays a significant role in TGB and contributes to the tourism literature on social commerce. To our knowledge, this study is the first to utilize multigroup analysis of the moderating effect of EL in OTGB environments.
In this study, transaction cost advantage had a significant effect on satisfaction for the entire group, the high-EL group, and the low-EL group in GB. The findings are partially consistent with those of previous studies (Kim, Chung, and Lee 2011; Kim and Li 2009), which revealed the significance of the relationship between transaction cost advantage and satisfaction. The results indicate that the effect of the transaction cost advantage of GB on customer satisfaction is fairly important to all shoppers. Thus, OTGB operators should mitigate transaction costs by offering lower prices, discounts, and benefits. Preview had a significantly positive effect on satisfaction for the entire group, the high-EL group, and the low-EL group in GB, somewhat similar to previous studies (Tanin et al. 1998; Tate 1994). The results show that the effect of preview on customer satisfaction is important to all OGB shoppers. Therefore, OTGB managers must significantly develop their site content to provide customers with preview with searching and social commerce elements. Trust had a significant effect on satisfaction for the entire group, the high-EL group, and the low-EL group in GB. The findings of this study are in line with previous findings (Chiou and Droge 2006; Kim, Jin, and Swinney 2009) that revealed a significant relationship between trust and satisfaction. The results demonstrate that the effect of trust on customer satisfaction is most significant among three exogenous variables. Accordingly, OTGB companies should boost trust in their GB sites by being honest, consistent, and responsible.
The relationship between satisfaction and repurchase intention was significantly positive for the entire group, the high-EL group, and the low-EL group in GB, extending the findings of previous studies (Fang, Chiu, and Wang 2011; Mittal, Ross, and Baldasare 1998). The entire group showed the strongest relationship between satisfaction and repurchase intention, followed by the high-EL and then the low-EL groups. The results indicate that the effect of satisfaction on repurchase intention is vital to all shoppers. This finding suggests that the OTGB industry should increase satisfaction to boost repurchase intention. To increase satisfaction, the GB industry should lower transaction costs, provide YouTube and vivid videos for preview, and enhance sites’ trustworthiness. To lower transaction costs, GB businesses should offer reasonable prices for quality and service. To improve the trust level, GB sites should have integrity, reliability, and dependability.
This study identified the moderating role of EL in the OTGB setting. The findings are somewhat consistent with those of previous studies (Mattila 2004; Sarri and Drennan 2006) and reveal the differences between the high- and low-EL groups. Specifically, those in the high-EL group have stronger relationships between preview and satisfaction as well as between satisfaction and repurchase intention than their counterparts. Conversely, those in the low-EL group have stronger relationships between transaction cost advantage and satisfaction as well as between trust and satisfaction than their counterparts. The results affirm that transaction cost advantage and trust are more important to low-EL shoppers than to high-EL shoppers. However, preview and satisfaction are more vital to high-EL shoppers than to low-EL shoppers. To exploit market segmentation, OTGB sites should employ different marketing strategies depending on whether they are targeting high- or low-EL customers.
In terms of theoretical implications, this study establishes a significant relationship between satisfaction and repurchase intention in the OTGB literature that expands on the previous studies of Bojanic and Warnick (2012), He and Song (2009), and Magnini, Crotts, and Zehrer (2011). That is, if a buyer is more satisfied with OTGB, he or she should generate a higher repurchase intention for the group buying site. Additionally, this study demonstrates significant relationships among satisfaction, EL, and the repurchase intention with respect to OTGB, expanding on the previous studies of Li and Petrick (2008) and Prayag and Ryan (2012) in the offline context. Lee, Kyle, and Scott (2012) indicate that satisfied visitors at a festival develop a moderating level of emotional attachment to the festival host destination and ultimately become loyal to that destination. In addition, this study confirms that satisfied consumers in the online travel environment are moderated by the level of high or low EL to TGB, which influences the repurchase intention with respect to OTGB.
The research suggests practical implications. First, among the exogenous variables, trust has the highest effect on satisfaction. GB sites should increase their integrity, reliability, and trustworthiness. Second, preview has a higher effect on satisfaction and on repurchase intention in the high-EL group than in the low-EL group. If GB companies want to target shoppers with high levels of EL, these companies should provide sites with explanations, vivid pictures and videos, opinions and evaluations by others, discussions, rules and terms, and questions and answers. In addition, GB companies should concentrate on the satisfaction level of high-EL shoppers if they wish to attract these shoppers. Third, the low-EL group’s satisfaction is affected more by trust and transaction cost advantage than their counterparts’ satisfaction is. If GB businesses want to target shoppers with low levels of EL, these companies should focus on increasing their trustworthiness and mitigating their transaction costs. If GB companies want higher rates of repurchase, they should focus on satisfying high-EL shoppers, who are more likely to repurchase.
This study has some limitations that offer opportunities for future research. This study examines shoppers with high and low levels of EL in Korea. Future studies may need to conduct cross-cultural studies to validate our results. Because our study examines three groups of buyers (the entire group and low- and high-EL groups) to assess their specific and detailed contributions to TGB companies, we suggest that future studies should examine each group (i.e., entire, low-EL, or high-EL groups) separately to identify more suitable implications for each market segment. Although our study provides new insights for TGB managers on the roles of economic (transaction cost advantage), social (preview and trust), and psychological (satisfaction) elements in the context of OTGB, the inclusion of more variables in the future (e.g., attachment, altruism) may improve the potential contributions to tourism managers for attracting online tourism group buyers.
Concluding Remarks
This study contributes theoretically to the tourism literature in several important ways. The first theoretical contribution of this study is the test of the moderating effect of EL in the OTGB context. In addition, the empirical results fully support the theoretical model in which transaction cost advantage, preview, and trust affect satisfaction and satisfaction affects repurchase intention. EL has a significantly moderating effect on the research model. Furthermore, the results of this study reflect increased awareness and interest in the emerging area of preview as social commerce elements (e.g., social networks, social media) of TGB. This study is one of the few studies that explain the decision-making processes for the repurchase intentions of tourism group buyers.
With respect to practical contributions, online tourism group buyers are highly concerned about trust and therefore the findings of this study can assist OTGB marketers who may need to consider trust in their sites when developing marketing strategies. In addition, this study identifies preview as a significant factor in TGB, implying that TGB marketers should focus on high-quality website content. Current GB companies are typically responsible for attracting consumers via advertising and for receiving payments directly from buyers. This process is quite complicated and involves multi-faceted aspects of social commerce elements that are related to social networks and media. Therefore, to produce successful GB businesses in an extremely competitive environment, TGB managers should practice marketing strategies that build trust by enhancing reliability, honesty, and trustworthiness and using attractive preview with social commerce elements.
Footnotes
Appendix
Measurements from Factor Analysis (Entire Group) in the TGB context
| Constructs and Variables | Standardized Factor Loadings | Cronbach’s α | ||||
|---|---|---|---|---|---|---|
| Transaction cost advantage from TGB | .886 | |||||
| 1. By purchasing tourism products from the GB site, I can save more on transaction costs than I could by using other shopping options. | .161 | .326 | .244 | .167 |
|
|
| 2. Purchasing tourism products from the GB site can generate more discounts than other shopping methods can. | .097 | .272 | .241 | .211 |
|
|
| 3. Purchasing tourism products from the GB site is the right choice if price and other expenses are considered. | .214 | .377 | .353 | .309 |
|
|
| Preview for TGB | .901 | |||||
| 1. I preview the explanations for tourism products on the GB site through social networks. |
|
.032 | .215 | .161 | .310 | |
| 2. Previewing the vivid pictures and videos related to the tourism products on the GB site helps my purchase decisions. |
|
.049 | .194 | .057 | .354 | |
| 3. Before purchasing, I look at the opinions of others for the tourism products on the GB site. |
|
.005 | .117 | .057 | .185 | |
| 4. Previewing others’ evaluations of the tourism products on the GB site helps my purchasing decisions. |
|
.062 | .144 | .162 | .022 | |
| 5. I preview the discussions between consumers and product developers for the tourism products on the GB site. |
|
.185 | .097 | .052 | −.061 | |
| 6. Before purchasing, I check the rules and terms of the tourism products on the GB site. |
|
.220 | .031 | .122 | .004 | |
| 7. Before buying, I read the questions and answers provided by the product developers and consumers on the site. |
|
.336 | .081 | .059 | .030 | |
| Trust in GB sites | .920 | |||||
| 1. The GB site has integrity. | .129 | .277 | .281 |
|
.242 | |
| 2. The GB site is reliable. | .167 | .303 | .253 |
|
.154 | |
| 3. The GB site is trustworthy. | .181 | .315 | .325 |
|
.174 | |
| Satisfaction with TGB | 920 | |||||
| 1. Overall, I am satisfied with the GB site. | .243 |
|
.367 | .327 | .166 | |
| 2. Overall, I am satisfied with the tourism shopping experience on the GB site. | .179 |
|
.399 | .295 | .225 | |
| 3. The content of the GB site’s tourism products meets my needs. | .173 |
|
.336 | .278 | .254 | |
| 4. It is easy to buy tourism products of my own choice from the GB site. | .270 |
|
.164 | .239 | .250 | |
| 5. I am more satisfied with the tourism products on the GB site than with the tourism products on other sites. | .104 |
|
.385 | .247 | .313 | |
| Repurchase intention for TGB | .902 | |||||
| 1. I will repurchase tourism products through the group buying site. | .167 | .280 |
|
.318 | .196 | |
| 2. Through social networks, I would like to recommend the tourism products on the GB site to others (including my family and friends). | .135 | .182 |
|
.224 | .271 | |
| 3. I would like to talk positively about the tourism products on the GB site to others. | .226 | .343 |
|
.238 | .164 | |
| 4. I would like to repurchase more tourism products on the GB site in the future. | .213 | .385 |
|
.192 | .189 | |
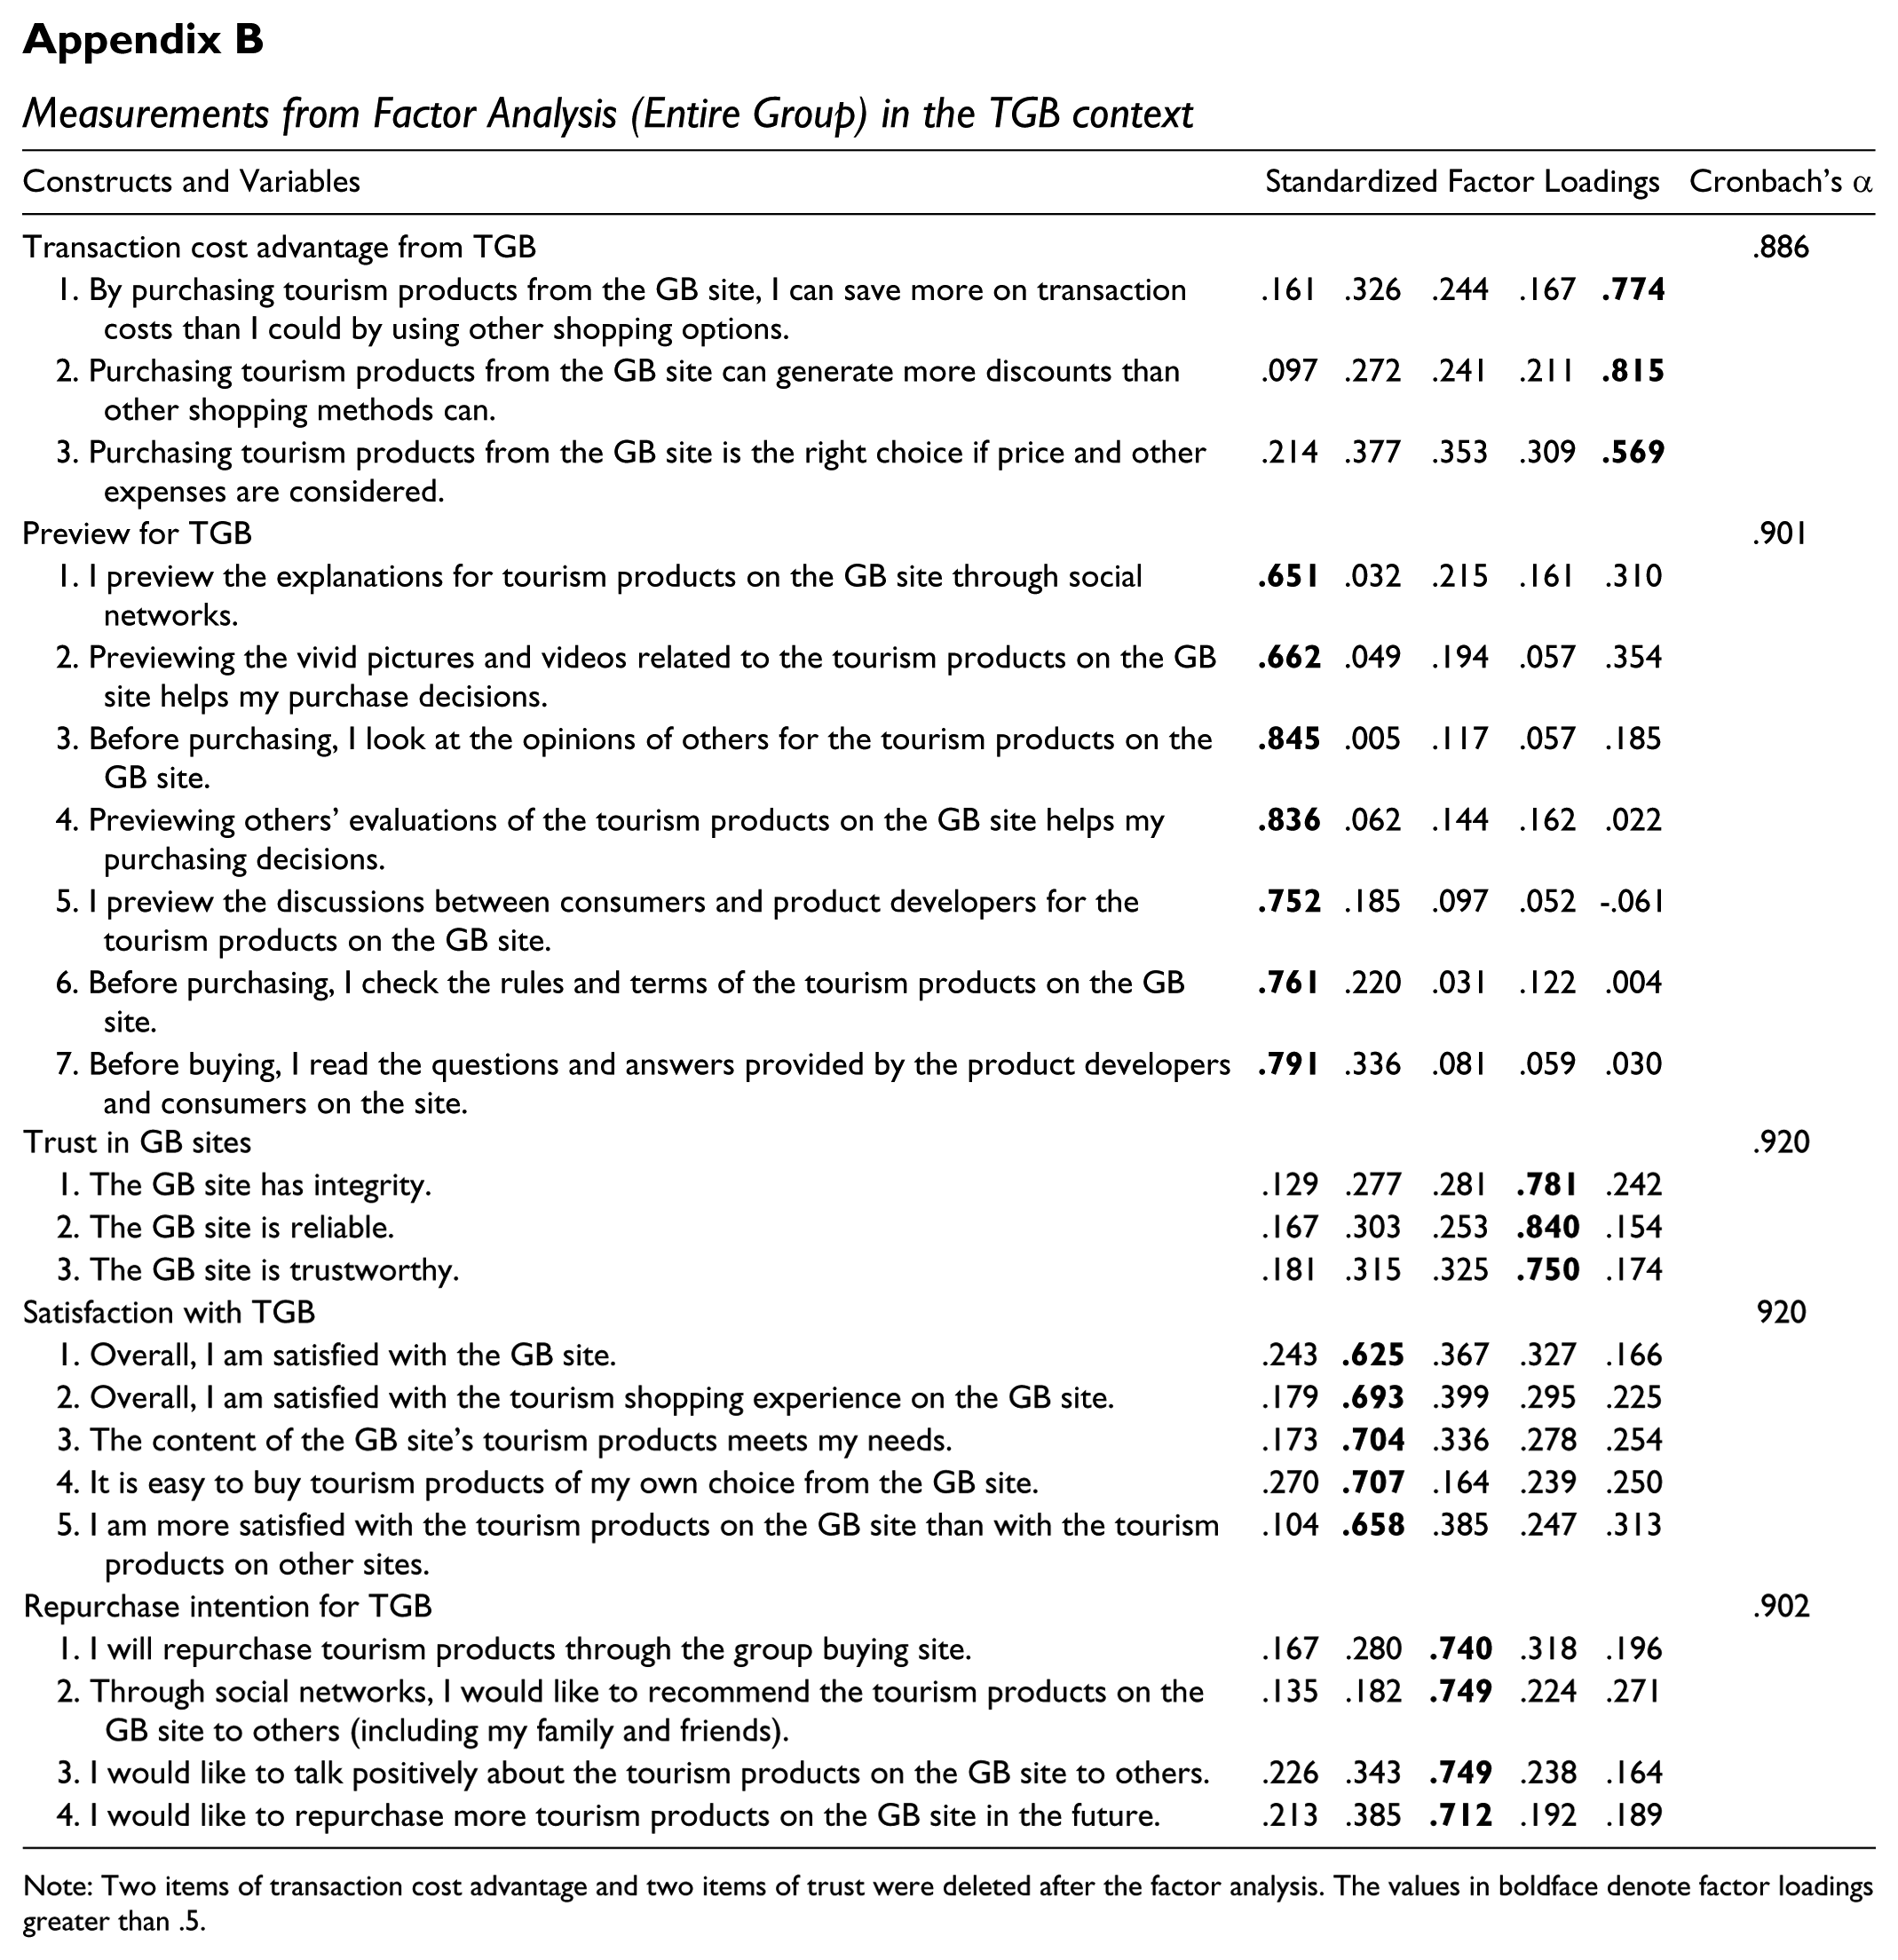
Note: Two items of transaction cost advantage and two items of trust were deleted after the factor analysis. The values in boldface denote factor loadings greater than .5.
Acknowledgements
The authors thank Dr. Michael W. Preis, University Of Illinois at Urbana–Champaign, and insightful comments from three anonymous reviewers.
Declaration of Conflicting Interests
The author(s) declared no potential conflicts of interest with respect to the research, authorship, and/or publication of this article.
Funding
The author(s) received no financial support for the research, authorship, and/or publication of this article.