
Abstract
Special events can have a sizable economic significance (ES) and economic impact (EI) in host communities. This study’s purpose was to update the input measurement concepts in assessing the EI for a short-term special event. Specific EI measurements were examined as suggested by Crompton, Lee, and Shuster (2001) and Stynes (1997) that differentiated between types of attendees. A trade market analysis (TMA) technique was applied to refine the measures of locals and nonlocals and to reconsider locals who have visiting friends and relatives (VFR) in their group profiles. Further refinement of day-trip attendees and visitors expenditure impacts were identified and used to adjust the EI when applied to a sales multiplier. Self-administered online surveys were emailed to 2,678 group leaders from a registration and on-site intercept population with a response rate of 46%. Measurement improvements were found for local, nonlocal, casual, time-switcher, and VFR attendees in EI application.
Introduction
The creation of special events and attractions is increasingly playing an important role in attracting tourists to a local region or community (UNWTO 2012). These attractions and events can enhance the image of the local area, build business networking, increase residents’ morale, and promote the civic pride (Dwyer, Forsyth, and Spurr 2004, 2005; Snowball 2008; Gursoy, Kim, and Uysal 2004; Lee and Taylor 2005). Besides these advantages, the local community can also benefit greatly from special events when “new money” comes into the local area from nonlocal attendees (e.g., tourists). Their expenditures can increase sales, support/create jobs and promote the residents’ incomes, and further enhance the residents’ quality of life when the impacts “multiply” and have a ripple effect throughout the community (Frechtling and Horvath 1999). However, the measurement of these effects must be carefully considered because of the unique nature of special events that differs from destinations. The challenges in measuring the impacts have been well documented by Tyrrell and Johnston (2001), Crompton, Lee, and Shuster (2001), Stynes (1999), and Crompton (2006). Furthermore, organizers of these events may have multiple objectives to achieve. These may include the need to attract vendors, corporate sponsorships, event participants/volunteers, and the business and community cooperation in addition to measuring impacts and costs.
Most economic impact (EI) studies focus on tourist destinations and long-term seasonal tourism attractions. Special events, by their nature, are different from static attractions. While substantial effort has been made in the past to measure the EI of attractions/destinations, less time has been spent on examining and adjusting the preliminary numbers that go into the EI models for projections and the adaptation of these measures in special event situations. Part of this critical need is to refine how to differentiate between locals and nonlocals to attract corporate sponsorships and to consider community and regional buy-in and event support.
These events generate a variety of economic activities and attract many diverse types of attendees and visitors in a highly concentrated time frame. There are numerous events that are held throughout the country that vary in length from one day (e.g., an international marathon running event: Boston Marathon) to several days (e.g., weekend air show: two-day Great New England Air Show) to a week or more (e.g., arts festivals: Centre County Festival of the Arts or the New England State Fair, aka The Big E) and cover large market areas of potential visitors. There is evidence that adjustments in measurement are needed to determine how to best configure and measure EI in a short-term setting.
For example, Tyrrell and Johnston (2001) suggested that work is needed on the measurements, specifically the visitation reasons, expenditure patterns and sources of different types of attendees, the actual flow of money into the local economy, and the difference between the impact of a destination and a special event. Event coordinators or sponsors unfamiliar with EI analysis often overlook simple distinctions in measurements. Crompton (2006), Tyrrell and Johnston (2001), and Crompton, Lee, and Shuster (2001) indicate that frameworks are important for maintaining and improving the primary focus on how the measurements of EI are applied and to avoid the common and fundamental mistakes of larger-scale tourism destination studies. They also recognized that even within standardized frameworks it is not possible to calculate all direct and indirect impacts associated with an event and that these measures are indeed estimates. However, they also implied that improvements are necessary to avoid common errors and EI calculations are not trivial, and they encouraged and recommended further refinement of EI measures. Therefore, the literature suggests an ongoing need to address the measurements that go into EI studies such as the definition of local and nonlocal attendees and associated types of attendees.
While Crompton, Lee, and Shuster (2001), Crompton (2006), and Croes and Severt (2007) do discuss the inclusion of locals and nonlocals in an EI study, they have only casually addressed how to define them or how the local economy works in their inclusion. Crompton simply suggests that “locals” are not to be included in a “true economic impact analysis” but does not suggest how in detail to define or measure locals. In the Springfest application, Crompton, Lee, and Shuster (2001) simply define “locals” as those attendees from the local, most immediate, or primary zip codes. All others who visit and attend are “nonlocals” and counted in the EI analysis without differentiation. This is complicated because “expenditures by those who reside in a community [locals] do not contribute to an event’s EI and these expenditures represent a recycling of money that already existed there” (Crompton 2006, p. 70). How people shop and use the local economy is not defined or explained. Croes and Severt (2007) define nonlocals as “visitors” who are essentially only counted if they stayed overnight in paid accommodations or stayed in nonpaid accommodations (visiting friends and relatives [VFRs]) and essentially report only on overnight trips regardless of distance. The latter, more extreme definition would preclude a number of nonlocals who attend special events as “same day” (day-trip) visitors who do have substantial EI (Wynen 2012, 2013).
Snowball (2008) reports that a failure to define the area of study and local spectators can yield widely differing results and, according to Crompton (2006), is one of the most frequent “mischievous” procedures used to inflate EI estimates. Therefore, defining “the area” of “locals” and “nonlocals” is a critical component of the EI analysis for events; however, few studies have used a systematic or a standardized technique for defining “the area,” especially examining how the “economics of the local market area” occur or are defined.
This is the major deficiency or gap in the literature; therefore, the goal of this study was to improve the implementation of an EI process through the application of the trade market area (TMA) analysis technique and to primarily improve the definition of the markets (locals as convenience and destination or shopping markets and nonlocals as day-trip attendees and overnight visitors). Furthermore, a TMA analysis best fits the needs of local and regional corporate sponsors who fund or support special events in exchange for access to the shopping markets of a variety of types—locals, regionals, day trip, and overnight visitors from outside the area.
Purpose of Study
The purpose of this study is to further examine and update the concepts and measurement issues associated with assessing the EI and ES of special events, and specifically, to examine the application of EI techniques in more detail for a large special event, the Westfield International Air Show (WIAS). Specifically, four basic concepts were reviewed in the context of special events: (1) to show how improving the definition of locals and nonlocals via a TMA technique improves the EI application framework developed by Crompton, Lee, and Shuster (2001); (2) to demonstrate how the expenditures differed by examining the fundamental definitions of locals and nonlocals, day-trip attendees and overnight guests/visitors, and other potentially overlooked groups such as the VFR market, “casuals” and “time-switchers” extending the special event research and application; (3) to show how the application of improved techniques would affect the estimation of the first round of expenditures of a specific event; and (4) to show how these primary estimates may further affect the basic rudimentary analysis of a typical sales multiplier in EI analysis.
Review of Literature
EI can be defined as “the net economic change in the incomes [and expenditures] of the local residents and the jobs of the local community that result from the expenditures attributed to tourists associated with tourist policy, events, facilities or destinations” (Crompton 2006; Tyrrell and Johnston 2001, 2006). The typical analysis of economic impact includes the direct, indirect, and induced effects and measures the economic expenditures by the “real visitors” (Stynes 1997). ES focuses on measuring the direct economic expenditures of all attendees and benchmarks these expenditures (Crompton, Lee, and Shuster 2001). Nevertheless, Crompton, Lee, and Shuster (2001) and Stynes (1997) suggest that adjustments are still needed when estimating the economic contributions of event tourism. Assessments of “event tourism impact” often miss or overlook critical distinctions between “tourism impact” and “event impact,” and potentially confuse the overall gross EI with net EI and lead to substantial overestimation of the actual EI for short-term tourism events (Tyrrell and Johnston 2001). Stynes and White (2006) suggested that guidance for gathering and further analysis of visitor spending data is limited and accurate measures are the most important initial inputs to an EI analysis. These important definitional concepts and measurement applications need to be carefully considered in determining the initial round of event-related expenditures before any of the data collected is subjected to Input/Output, multiplier, or other modeling techniques.
Crompton, Lee, and Shuster (2001) systematically built the basic process to undertake a tourism EI study and further defined four basic study adjustments: (1) the exclusion of local residents, (2) the exclusion of time-switchers and casuals, (3) the use of income rather than sales measures, and (4) the careful interpretation of employment measures. Based on these four important principles, they presented a refined instrument for data collection in the Springfest Event in Ocean City, Maryland. Hereafter, this is called the “Crompton technique.” Stynes (1999) also dedicated significant research to the development and implementation of EI measurements. While this study is not specifically an EI study, an extensive review of EI studies, models, and applications can be found in the Journal of Travel Research (2006, volume 45, number 3) including other publications such as Sainaghi (2012), Snowball (2008), and Croes and Severt (2007).
Economic Impact Studies in Special Events
Special events can be defined as the “major one-time or recurring events of limited duration, developed primarily to enhance awareness, appeal and profitability” (Dwyer, Forsyth, and Spurr 2005, p. 351). These events have common characteristics including that they (1) are limited in time and space; (2) do not require large investments in fixed infrastructure or destination development but may improve the utilization or capacity of a built infrastructure, (3) are driven by activit(ies) or participant(s) and might not fit the typical destination attraction model, (4) may not be easily substituted or have unique themes or activities, (5) may have a sponsoring agency that may be a unique community organization such as a 501 (c) 3 nonprofit organization or a private or community entity, and (6) might attract unique and special markets at a targeted time (e.g., First Night Festivities held on January 1).
Another key area in EI models is the identification of the market segments. Damonte, Collins, and Megehee (2012) indicated by segmenting a tourism market and eliminating locals at a festival event the impact of spending was significantly smaller, as only 30% of the attendees were from outside the region. Warnick et al. (2011) found value in segmenting attendees based on travel distance, frequency of attendance, and involvement measures using cluster analysis. Wilton and Nickerson (2006) collected visitor expenditure data and indicated important marketing and tourism implications, while Stynes and White (2006) indicated that there is rarely “an average visitor” in terms of spending. A lack of a methodological literature testing alternative initial measurement approaches to EI that provides guidance to researchers was also noted.
The measurement of same-day travelers in EI studies is also problematic. Wynen (2013) indicated same-day visits are often overlooked in EI studies and can contribute more to domestic tourism than overnight trips (quoted in Tourism Satellite Accounts [TSA], Eurostat-European Commission 2011), and that only a few studies focus on same-day (day-trip) visitor expenditures (e.g., Thrane and Farstad 2011; Wynen 2012). As the pioneers developed the EI theories and models, a number of scholars also conducted EI studies on particular attractions and events. Examples include the Scottish Highland Games in North Carolina (Chhabra, Sills, and Cubbage 2003); FIFA World Cup (Lee and Taylor 2005); cultural events (Herrero et al. 2006); Olympic Games (Li, Blake, and Cooper 2011); a review of 30 sports tournaments, festivals, and spectator events (Crompton and Lee 2000); and a cultural event (Crompton, Lee, and Shuster 2001) where the guide to the EI process was developed. In a comparative study of different events, Nicholson and Pearce (2000) found that of the four different types of events (i.e., a country music festival, a wine and food festival, a foods festival, and an air show), the air show was more characteristically a “tourism event” by the type of visitors attracted and that it brought a greater cross-section of “new visitors” to the local community than other events.
Exclusion of Locals
Typical tourism studies define a tourist as one who travels 50–150 miles one-way to a destination and a day-tripper as someone who travels less than 50 miles one way to a destination (Masberg 1998). Generally, the accepted “tourist” definition is “one who travels 100 miles or more from the home residence” (NTRRC 1973; U.S. Travel Data Center 1993). While these travel distances do offer ways to distinguish different types of attendees and the overnight visitor definition (travels one-way 100 miles) was adopted in this study, they do not fit cleanly into Crompton’s “local” and “nonlocal” market definitions. “Nonlocals” could be segmented into those who make the attendance a day trip and those who stay overnight. Confusion also enters into special event marketing when attendees are labeled as “visitors.” Crompton, Lee, and Shuster (2001) suggested that the measurement of EI is attributable to “new money” coming into the local economy and there is a need to carefully identify and distinguish between the types of attendees. “Attendees” who reside outside the community and have a primary motivation for visiting an event should be counted, and/or those who stay longer and spend more because of the event should be included in the economic impact study as “nonlocals” according to Wynen (2013). Many are day-trip attendees, but they do not fit into the definition of a “tourist.” However, the delineation of “who is local and who is nonlocal” is still open to debate.
First, if the special event is indeed “special” and no other such event is equivalent in time, scope, or magnitude, then it may be that expenditures by locals are worthy of measurement, especially if these attendees are not spending on a replacement activity (i.e., attending a movie, local fair, etc.). Next, while Crompton suggests excluding locals, defining who and what is a “local” purchase has evolved substantially in the last decade (see related discussion on buying and consuming local food products in Blake, Mellor, and Crane 2010). Crompton, Lee, and Shuster (2001) basically uses a “zip code definition” to differentiate between locals and nonlocals, counting only those residing in the immediate area zip codes as “locals.” However, there is a flaw in this identification of locals. Zip codes are for mailing purposes, but do not define how people actually shop. Consumers typically act “locally” based on areas conveniently reached or frequently shopped (e.g., grocery store), or are planned destination shopping trips (e.g., malls). Business districts or central business districts (CBDs) may have a central shopping district and market areas come in a variety of shapes and sizes, depending on the community’s pulling power, geography and the highway access (see “Downtown and Business District Market Analysis” site: fyi.uwex.edu/downtown-market-analysis/understanding-the-market/trade-area-analysis; University of Wisconsin Extension Service 2012).
Trade Market Analysis
For purposes of defining shopping areas of the local economy, the Wisconsin Extension Service (2012) identified two major categories: convenience and destination trade areas. A convenience trade area is based on regular product and service purchases such as gasoline, groceries, and hair care. Residents purchase these items frequently and desire convenience purchasing from businesses located close to their home or workplace. A destination trade area is larger and is based on the purchase of “major” products and services, such as appliances, furniture, or specialty items. It appears that the destination trade area would be the most appropriately defined trade market area for special events; however, it may be possible to define both a convenience trade market area central to a special event for convenience purchases close to the event location and a larger destination trade market area that may benefit directly from the hosting of the special event as visitors and attendees travel into the local community/region from multiple directions and multiple purposes and sponsors may wish to differentiate the markets.
VFR Market and Review of Locals
Crompton, Lee, and Shuster (2001) argue to exclude locals, but there are probably some incidents when it is appropriate to consider the locals’ expenditures. First, participant observation suggests that people who attend special events may travel in groups larger than one typical household. Group travel might be more prevalent when the event has a large attendance, parking on-site is limited, or travel to the destination is complicated or unique. Second, some events, because of their nostalgic nature, might involve intergenerational groups where multiple family households of parents, grandparents, and siblings travel together. Concerts or music festivals may be composed of groups of unrelated individuals with common music interests. So, one part of the group may reside within the local area and other portion(s) of the same group may not—this is referred to as the VFR market (Backer 2008; Moscardo et al. 2000).
Young, Corsum, and Baloglu (2007) suggest that a real lack of information exists on the EI of the VFR travel. Backer (2008) also suggests VFRs tend to be overlooked and not assessed adequately because they hold a secondary status in the industry and are perceived to have a minimal EI. However, she also found that (1) the attractiveness of the tourism product (e.g., destination or event) can influence the length of stay and enhance the impact of the VFR market on the local economy, (2) the hosting party influences what attractions and activities are consumed locally, and (3) additional hosting expenditures are incurred. Finally, most special events have numerous sponsors of various levels and geographic reach. The sponsor’s intent is not only to create a local branding identity but also to interact with large numbers of potential customers. This interaction is enhanced when markets based on location, travel, and hosting purposes (those who accommodate VFRs) are identified for corporate sponsors.
Time Switchers and Casuals
Crompton, Lee, and Shuster (2001) also suggest that time-switchers and casuals be excluded. Time-switchers are “nonlocal attendees” who changed the timing of their visit to coincide with the event, and this spending would have occurred in the community without the event, simply at a different time. The event did not “cause” these expenditures (Crompton 2006). Casuals are attendees who are also nonlocals who were in the locale and engaged in other activities but who elected to go to the special event instead of doing something else. Expenditures by these types of visitors would likely occur without the event, so income generated should not be counted (Crompton 2006). However, Crompton (2006) does say that either group might still qualify as “nonlocal” contributors to the EI if they stay in the locale longer because of the event and suggests that their extra-day expenditures be included.
The Crompton Technique—A Guide for Measuring EI Studies: The Springfest Example
Crompton, Lee, and Shuster’s (2001) guide for conducting an EI study incorporates adjustment techniques to improve and strengthen the process for local communities, planners, and event organizers. This study focuses in on the importance of measuring EI of special events because of unique differences of events compared to destinations that have long-term value and impact. It also serves to expand, extend, and clarify EI concepts developed over time by both Crompton and Stynes and improve EI measurement in event tourism. The need to more fully examine EI of special events also serves to justify the strategic planning for events as suggested by Getz (1991, 1997) and others (e.g., Damonte, Collins, and Megehee 2012; Allen et al. 2008; Goldblatt 1997 ) and helps to provide legitimacy to an evolving event tourism field. Furthermore, it fills the gaps of providing enhancements to the concepts and techniques offered by Wynen (2013), Stynes and White (2006), Crompton (2006), Crompton, Lee, and Shuster (2001), and Stynes (1999).
Methodology
This study’s implementation involved a detailed data collection instrument developed following the guidelines of Crompton, Lee, and Shuster (2001) and Stynes (1999), an online implementation process following the guidelines of a modified Dillman (2000) online survey approach, and the Qualtrics application of online surveys. Email addresses and group leader names were collected through both online registration processes and on-ground intercepts. For those groups with no email addresses, mailed surveys were sent, but only nine groups requested this collection method. The online registration process was established for visitors at the Westfield International Air Show (WIAS) web site to convey important event planning information, to sell priority seating, and to participate in incentives to be obtained at the show. The registration process was enhanced through targeted advertisements and media publicity.
Military personnel were stationed in uniform at each of the six major entry points to the air show venue and were trained to intercept every 20th group at peak arrival times between 10
Exclusion of Local Visitors
The Crompton technique defined the “locals” by the Westfield zip codes (01085 and 01086). Trade market analysis was used to improve the definition of “locals” by use of shopping districts or areas. The “shopping area” profile was used to classify the local groups into two subgroups of “local” and “regional” segments and to sort out the “nonlocals.” To define these markets, the TMA technique (University of Wisconsin 2012) was utilized to configure the shopping areas by the use of web site conversion tools that calculate straight line, travel time, and zip code radius information of each group’s home resident zip code. These conversion tools included Zip-Code.com (see www.zip-code.com), ZipMap.net (see www.zipmap.net), and BatchGeo.com (see www.batchgeo.com).
The event attendees were segmented into categories by combining straight-line zip code distance, estimated driving time, zip code proximity, visual map inspection, and knowledge of the shopping areas to define the convenience and destination trade areas as recommended by the University of Wisconsin Extension Service (2012):
Locals (Convenience Trade Market Area): These locals include attendees from Westfield and its neighboring cities or towns using Westfield as their convenience shopping area within a 10-mile radius and included 17 different zip codes communities. This market area was examined on a zip code-by-zip code basis to determine where shopping likely occurred, and zip code areas were excluded when tied to other convenience or destination market areas. The expected travel time was less than 15 minutes one-way.
Regionals (Shopping Destination Trade Market Area): These locals included attendees from the cities or towns within a 10- to 20-mile radius of Westfield who use Westfield as their destination market area and included 27 different communities by zip codes and excluded those tied to other destination market areas. The expected travel time ranged from 15 to 30 minutes one-way.
Nonlocals: All others were classified as nonlocals but these groups were also further segmented. The nonlocals from communities that were beyond a 20-mile driving radius or more than an estimated 30-minute travel time were categorized into two additional subgroups—day-trip attendees and overnight stay visitor groups. Day-trip groups were those who traveled more than 20 miles but less than 100 miles one-way to attend. Overnight stay visitor groups were those who traveled 100 miles or more one-way to attend the event and stayed overnight (Masberg 1998).
The VFR Market
The concept of measuring and defining the VFR market has rarely been used in EI analysis (Backer 2008; Young, Corsum, and Baloglu 2007). To obtain this information, a question was posed when asking about group size with the following extra dimension: “Were any of the people in the total number in your group party from outside the region (more than 20 miles away) who were visiting or staying with you as family and/or friends with the specific purpose of attending the WIAS? If so, please indicate the number of additional adults and children.”
Exclusion of Casuals and Time-Switchers
Casuals and time-switchers were other types of excluded visitors and their identification followed the recommendations by Crompton, Lee, and Shuster (2001). Crompton, Lee, and Shuster’s (2001) questions were followed to obtain this information, but two additional questions were used to determine the substitutability and to explore the groups’ intentions: (1) Was the trip a planned event, a substitute event away from home for a short vacation, an event that replaces some other local event (such as going to a park, a swimming area, playing golf, etc.) as a typical weekend event, or a spur of the moment activity as there was nothing else to do? (2) If the WIAS was not held, what other activities would you likely have engaged during this time period?
Crompton, Lee, and Shuster (2001) also recommend to further qualify time-switchers by asking this question: Would you have come to the Westfield Area within the next 2 months if you did not come at this time for the WIAS? The time period suggested by Crompton, Lee, and Shuster (2001) was shortened from three to two months as this event was held in late August and September and October were perceived to be the logical substitute months for travel. However, the WIAS respondents were also asked if they had ever been to the area before, and how likely they would be to return to the area to visit other attractions (using a 7-point Likert-type scale with 1 being “definitely would not return” to 7 being “definitely likely to return”).
Travel Group and Event Attendance
Total expenditures were collected by groups to estimate the EI and ES as recommended by Stynes (1999) and Crompton, Lee, and Shuster (2001). Group size and group expenditures were collected individually and then averaged by dividing the expenditures by the average group size in order to extrapolate the findings to all attendees. By classifying locals and nonlocals, and identifying other unique market groups (VFR groups), group spending patterns were segmented and extrapolated to the more specific EI measures. The groups were also segmented based on TMA classification of the home residence and the purpose of trip. The coordinating council of the air show and the military personnel measured the attendance figures for WIAS. This was accomplished by doing periodic venue gate counts and visual aerial flyover observations. Estimates were rounded to the nearest thousand by the military staff.
Measuring Expenditures
The overall expenditures were divided into eight (8) prescribed categories such as overnight accommodations, food and drink, transportation services, and shopping as recommended by Stynes (1999) and Crompton, Lee, and Shuster (2001). The total expenditures by group were calculated in real time by the online survey software for review by each respondent who was asked to review the summed total expenditures to recheck and adjust any of the specific expenditures.
Economic Impact versus Economic Significance
The exclusion of the local attendees, casuals, and time-switchers was considered to determine the actual “new money” coming into the local area by both the Crompton and the TMA techniques for comparative purposes. In this study, the conservative regional sales multipliers were employed as defined by the Massachusetts Office of Travel and Tourism (MOTT) (D’Agostino, “MOTT Multipliers for Pioneer Valley and Springfield/Chicopee MSA.” personal communication, 2010) for the Pioneer Valley and county area, and adjusted accordingly after both locals and causals/time-switchers were excluded. Leakages in these projections are recognized but these estimates are consistently collected and projected on an annual basis by county (D’Agostino, personal communication, 2010).
Since the expenditures of the local visitors, casuals, and time-switchers have some economic value, these group expenditures were included in the expenditures of all attendees to determine the total “economic significance” as a benchmark measure of overall event expenditures (Crompton, Lee, and Shuster 2001). The trade market areas (convenience and destination) were used to segment the “locals” and the EI estimates were adjusted using the average expenditures by each of these segments. The distribution of nonlocals was further adjusted for the EI estimates. Where appropriate, analysis of variance (ANOVA) was applied to the group expenditures to determine if the groups were significantly different at the .05 level.
The adjusted direct expenditures for nonlocals were calculated and the multiplier applied to these measures to provide an estimate of the direct and indirect impacts of the “new money” coming into the local area by the use of the modified I/O model. The real visitor estimates were also adjusted by the distribution of day-trip groups and overnight stays groups. The EIs for the Crompton technique and the TMA technique were then compared to determine how the estimates differed.
The economic impact and economic significance can be estimated using the following equations:
Economic impact = number of “real visitors” × average individual expenditures × multiplier
Economic significance = number of total attendees × average individual expenditures
Results
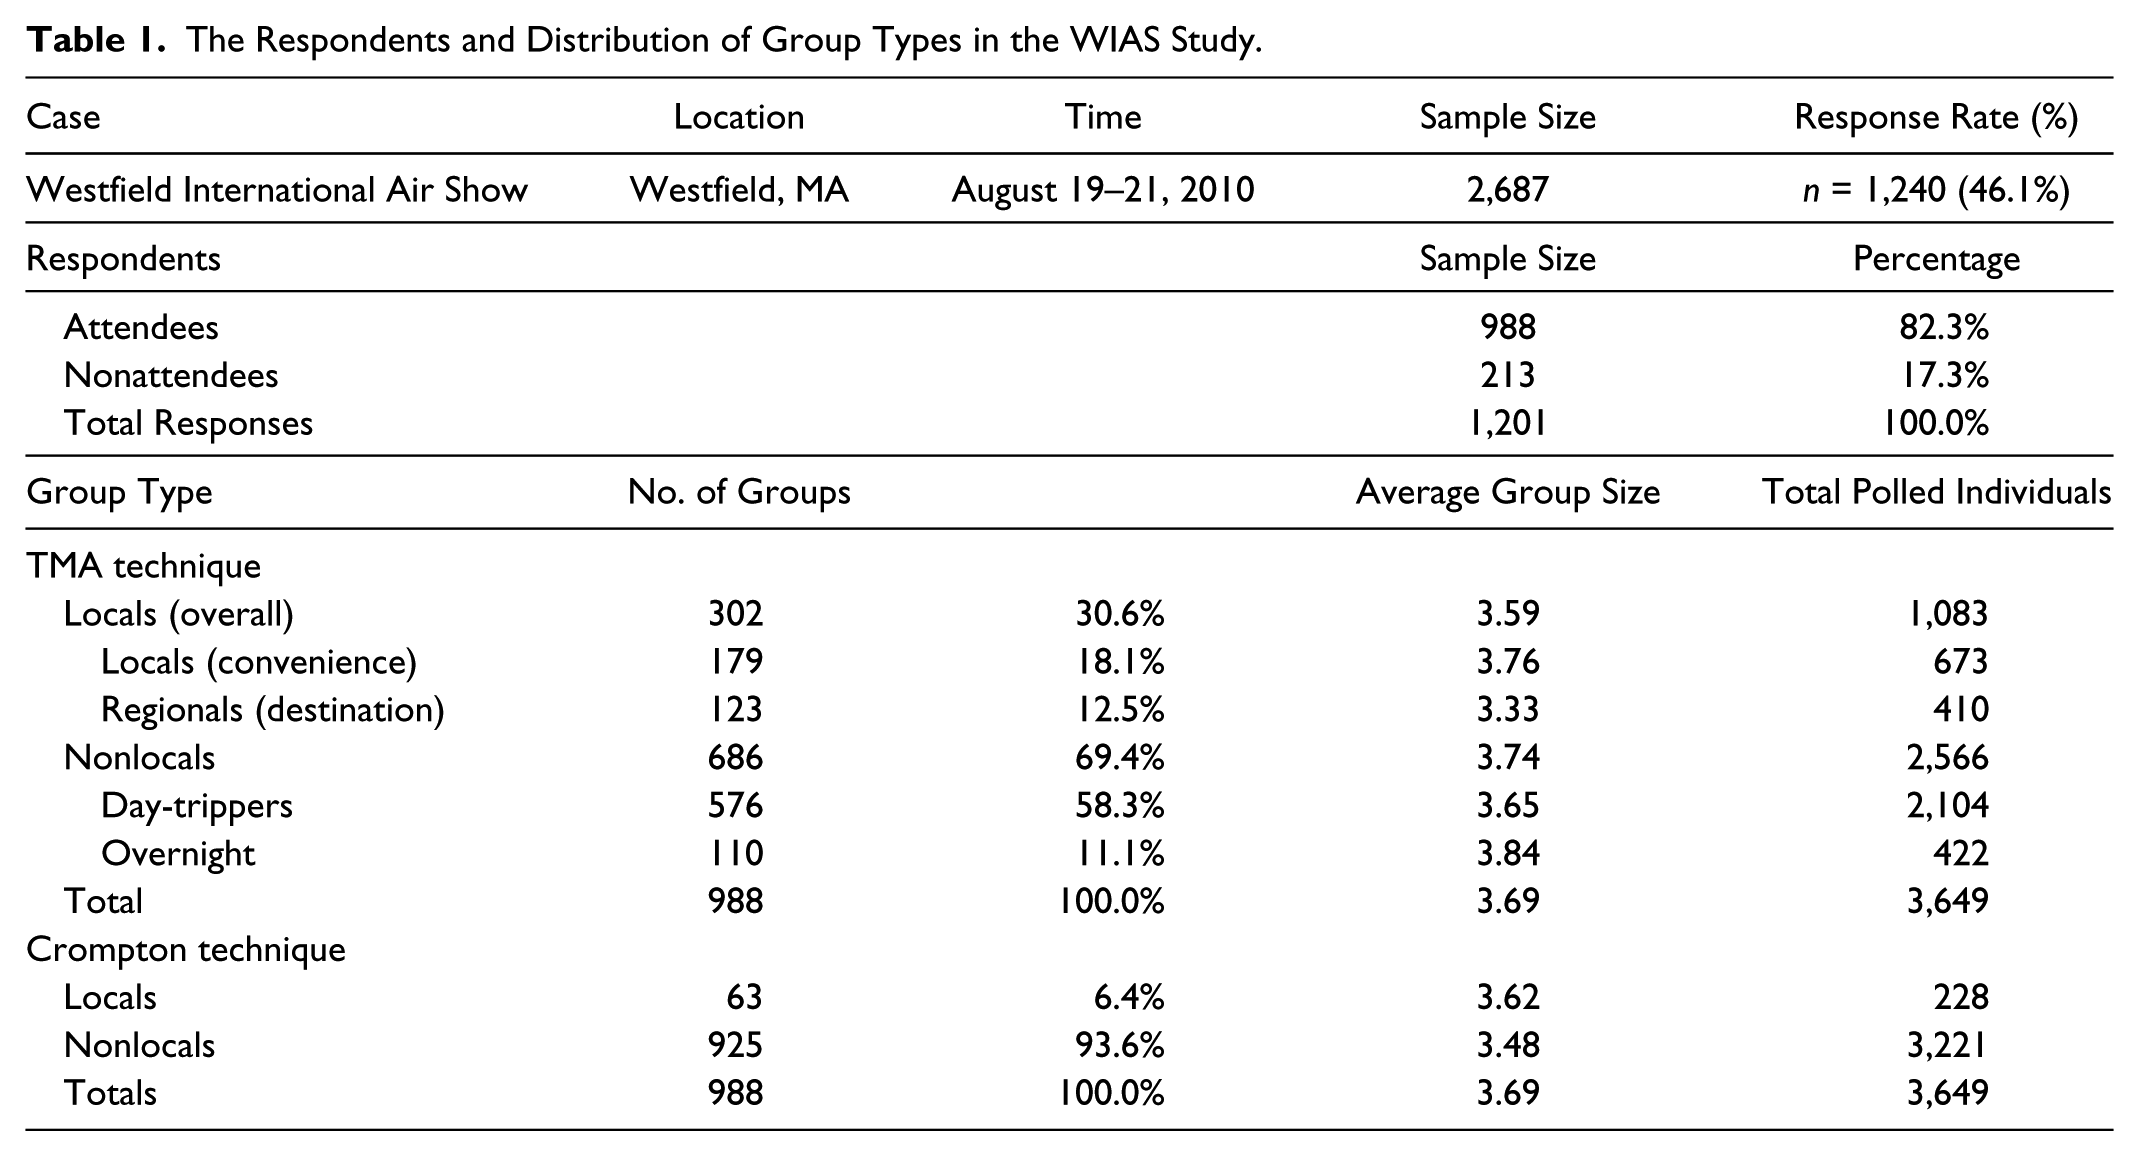
The Crompton technique and the TMA technique were compared for the Westfield International Air Show to determine if there were differences in the estimation of EI with the adjustment measures as applied within each technique. The two-day (August 20–21) air show event was held at the Barnes Air National Guard Base in Westfield, Massachusetts. There were approximately 268,000 visitors with an average length of event stay of 6.5 hours. For this case, 2,687 survey questionnaires were emailed beginning on August 23–24 and six (6) email reminders were sent via a modified Dillman (2000) and Qualtrics online survey technique. A total of 1,240 surveys were returned for a response rate of 46.1%. In this study, within the first week, August 23 to August 30, 1,005 surveys were started and 1,000 were completed. The remaining 240 were collected between August 30 and the six-week ending period. Of the returns, 988 surveys were useable for the EI study. An additional 213 respondents reported that they did not attend the air show even though they had registered to attend. This later group was analyzed for nonattendance purposes but not presented here, and 39 cases were discarded as incomplete.
Defining Locals and Nonlocals
According to the survey results and the trade market classification system, 18.1% (n = 179 groups; average group size 3.76) of the attendee groups were considered as the locals (within the convenience trade market area) and 12.4% (n = 123 groups; average group size = 3.33) of them were the regional attendee groups (within the destination trade market area). Nonlocals represented 69.4% (n = 686 groups; average group size = 3.74) of the respondent groups, and within this grouping, day-trip groups accounted for 58.3% (n = 576 groups; average group size = 3.65) and overnight stay groups accounted for 11.1% (n = 110 groups; average group size = 3.84) of the respondents. This distribution of attendees differed from the classification system when the Crompton technique was applied. Under the Crompton technique classification, “locals” accounted for 6.4% (n = 63 groups; average group size 3.62) and “nonlocals” accounted for 93.6% (n = 925 groups; average group size = 3.48) of the respondents. See Table 1 for the distribution of responding groups.
The Respondents and Distribution of Group Types in the WIAS Study.
Expenditure Patterns of Locals and Nonlocals by TMA and Crompton Techniques
When the locals were further analyzed under the TMA technique, the findings suggested that the attendees from these two local trade market areas act more similar in their purchasing patterns than the nonlocal attendees. The average expenditures for the regionals (destination trade market area visitors) were $56.63 per group or $17.01 per person while the locals (convenience trade market area) spent $56.22 per group or $14.95 per person on average. Nonlocals spent $146.71 per group on average, or $39.23 per person, which is more than twice what locals were spending. Nonlocal day-trip groups were found to be spending $118.16 per group, or $32.33 per individual, and overnight nonlocal visitors spent on average $294.88 per group, or $76.86 per individual. The overall average for all visitors was $125.99 per group, or $34.14 per person. The differences in expenditures can be explained by the categories where nonlocals spent substantially more for food and drinks before and after the event, transportation, and overnight accommodations.
Under the Crompton technique, the average expenditure per group for locals was $51.92 or $14.34 per person. The nonlocal group average expenditure was $124.79 per group, or $33.72 per person. When compared to the TMA technique, even if both convenient and trade market groups were combined and considered “locals,” differences were identified. The trade market classification system for all locals would be $56.39 per group, or $15.71 per person, and for all nonlocals $146.71 per group, or $39.23 per person. The average expenditures per group of the local attendees and nonlocal visitors are presented in Table 3 by the two classification systems, with additional expenditure details for the subgroups of locals and nonlocals by the eight expenditure categories, overall and per person.
The Average Expenditures by Category for Locals and Nonlocals by TMA Technique Classification.
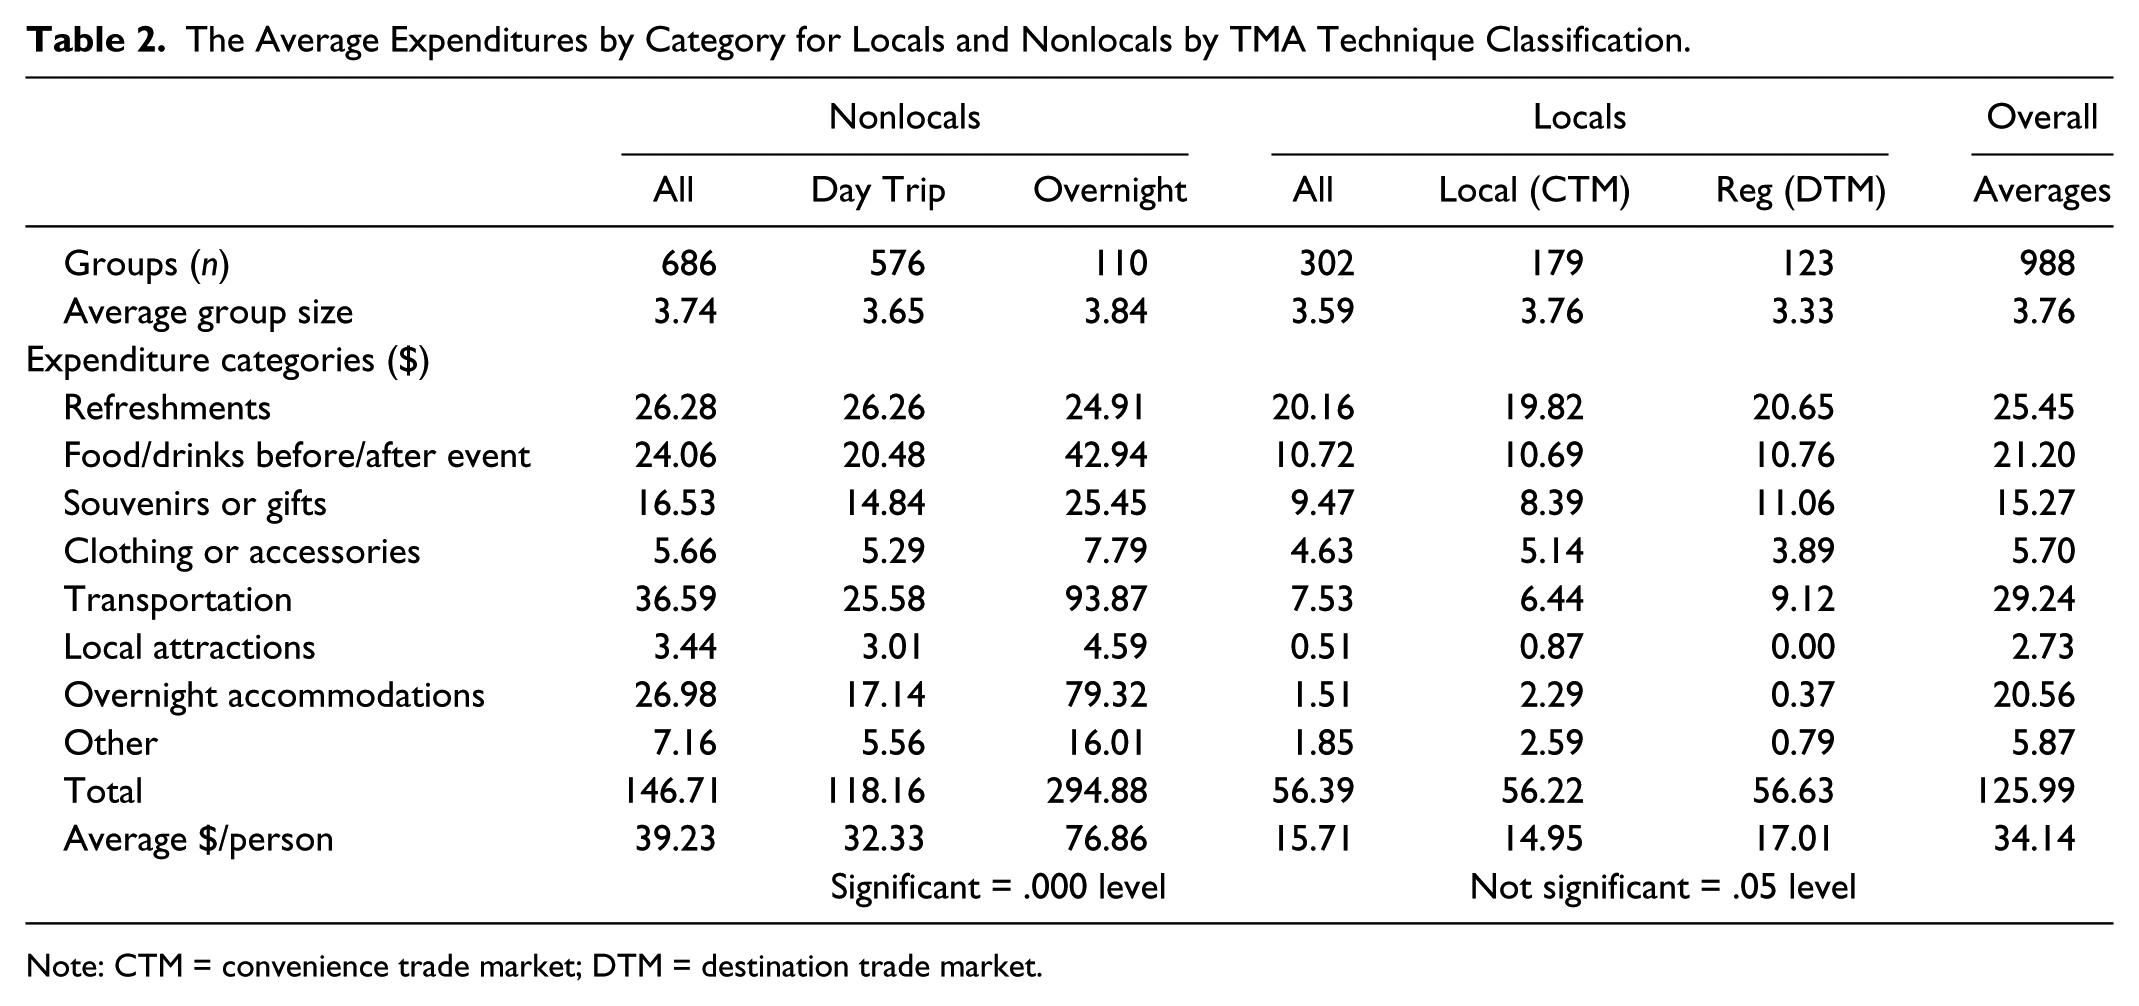
Note: CTM = convenience trade market; DTM = destination trade market.
Average Expenditures Compared: Crompton Technique versus TMA Technique.
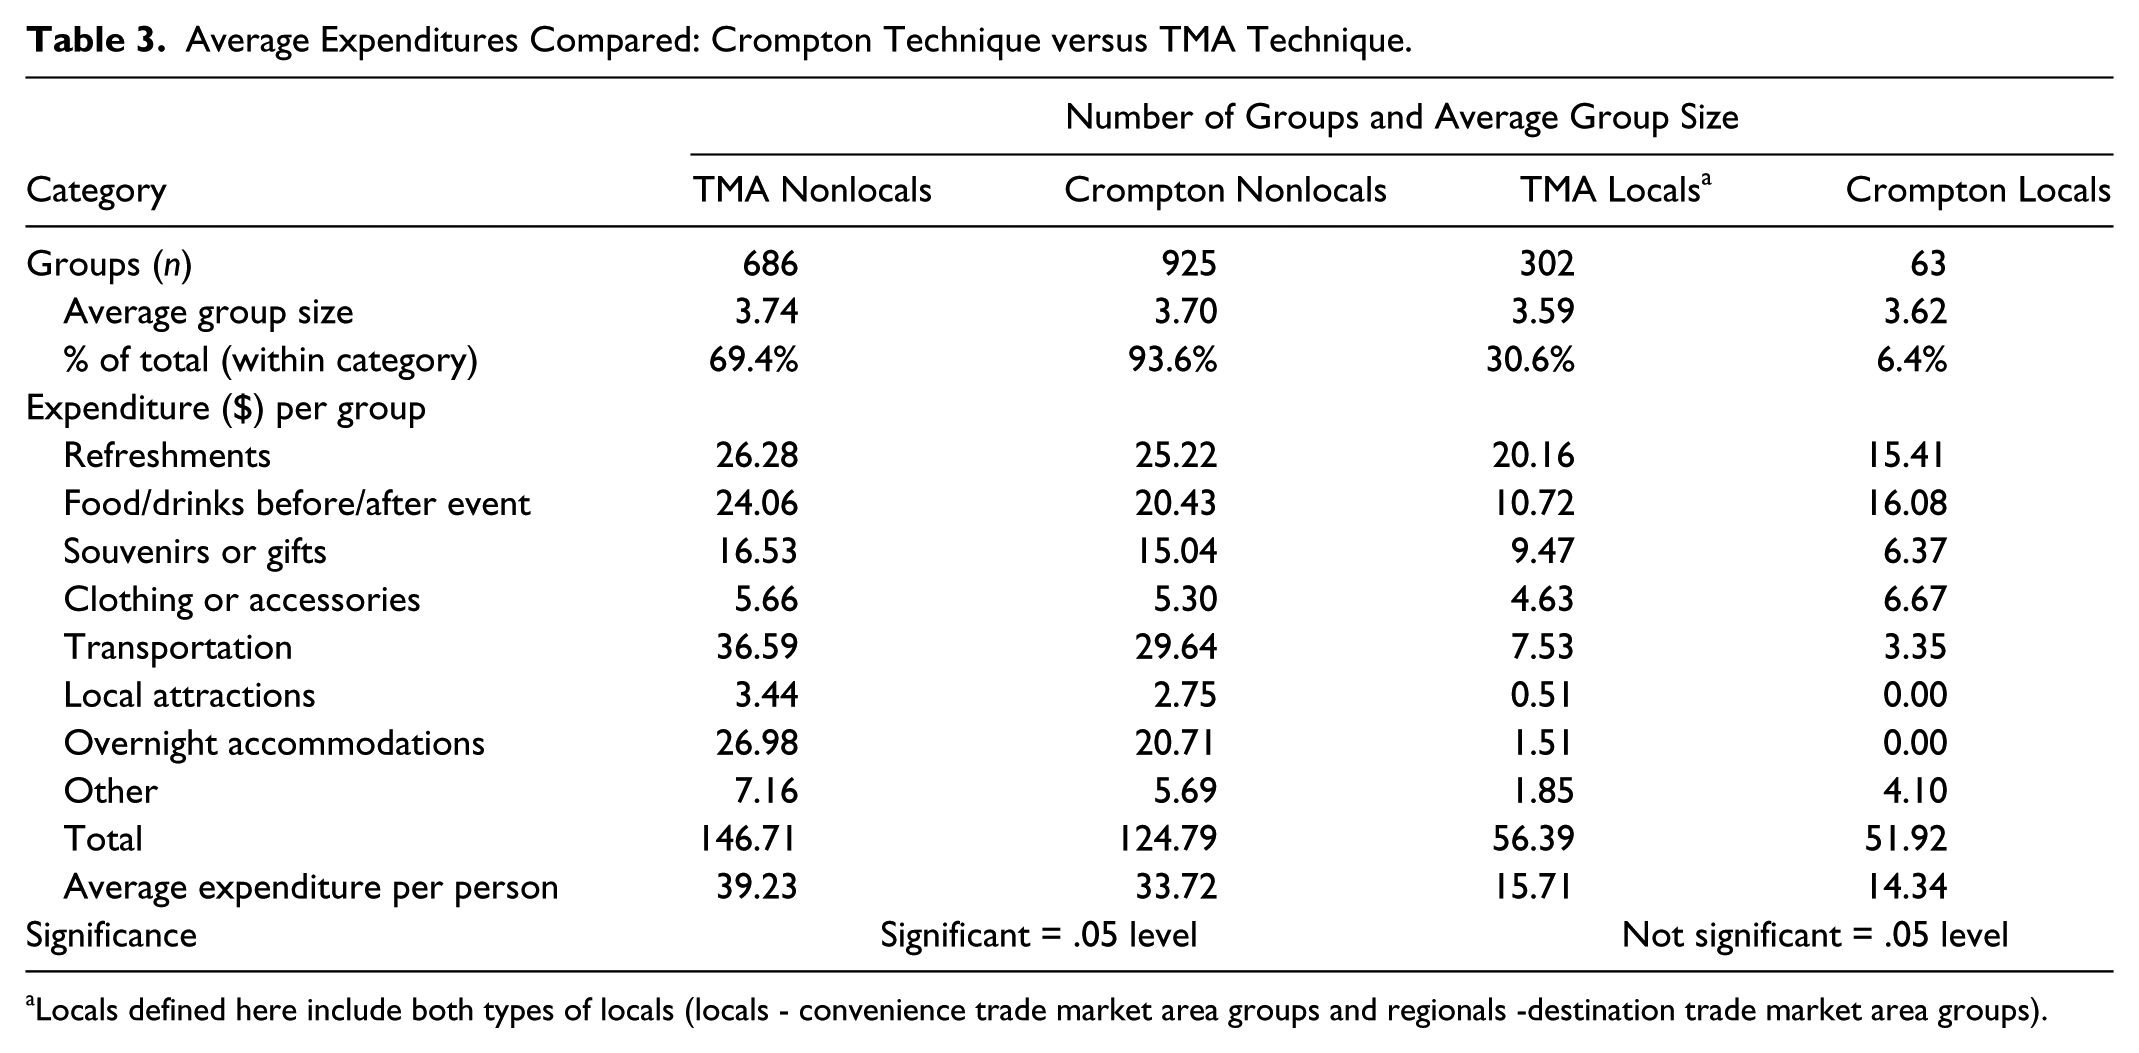
Locals defined here include both types of locals (locals - convenience trade market area groups and regionals -destination trade market area groups).
The Crompton technique’s locals were compared to both the trade market convenience market classification and also to the combined convenience and destination trade market areas. A one-way ANOVA was conducted to compare the effect of air show total expenditures by group under the two different classifications and then another one-way ANOVA was conducted to compare Crompton’s locals versus the trade market area when both convenience and destination trade market areas were combined. There was no statistical difference between the Crompton (mean = $51.92) and convenience trade market area (mean = $56.22) group classification at the p <.05 level, F(1, 240) = 0.096, p = 0.75746, for group expenditures. This seems to suggest that Crompton’s locals and the convenience trade market area are measuring roughly the same local markets. Under the combined condition, there was no statistical difference between the Crompton’s locals (mean = $51.92) and convenience/destination (combined mean = $56.39) trade market area group classification when combined at the p <.05 level, F(1, 363) = 0.146, p = 0.7026, for group expenditures. As noted, the locals in both classification systems seem to be measuring local groups with similar expenditure patterns. However, the nonlocal spending patterns in the Crompton technique are affected more by classifying those who are more likely “locals” as “nonlocals” under the simplified zip code definition application.
Therefore, two additional tests were conducted to determine if other differences existed. First, a one-way ANOVA was conducted to determine if group expenditure differences existed between the convenience and destination trade market areas on WIAS group expenditures. There was no statistical difference between the convenience (mean = $56.22) and destination (mean = $56.63) trade markets area groups at the p <.05 level, F(1, 300) = 0.0017, p = 0.9668, for group expenditures. Second, a one-way ANOVA was conducted to determine if differences existed between Crompton’s versus the trade market nonlocals classifications. There was a statistically significant difference between the group expenditures of Crompton’s nonlocals (mean = $124.79) and the trade market area nonlocals (mean = $146.71) at the p <.05 level, F(1, 1609) = 3.84431, p = .05.
Likewise, when the nonlocals are further segmented into day-trip groups and overnight stay groups, based on the mileage parameters, there is further differentiation and significance in expenditure patterns. Nearly 60% of the market for this event is composed of day-trip groups and only about 11% travel more than 100 miles one-way and stay overnight as visitors. However, the expenditure patterns within these groups are dramatically different. Overall, overnight groups are slightly larger and spend $294.88 per group on average compared to the day-trip groups who spend $118.16 per group on average. The major expenditure differences are largest in the meals before and after the event ($42.94 per group for overnight groups vs. $20.48 per group for day-trip groups), transportation ($93.87 per group for overnight groups vs. $25.58 per group for day-trip groups), and overnight lodging ($79.32 per group for overnight groups vs. $17.14 per group for day-trip groups. (Note: Some day-trip attendees did appear to rent campground or lodging rooms for the day but did not stay overnight when asked.) These differences result in an average per person expenditure for the overnight visitor of $76.86 versus $32.33 per day-trip visitor. These differences overall were found to be significantly different at the p <.05 level, F(1, 685) = 48.60563, p = 0.000. While these two groups are indeed different in their spending patterns on a per person average, they may be better classified as “day-trip attendees” (nonlocals) and “overnight visitors” (nonlocals).
VFR Market Expenditures within Local Segment
While Crompton recommends purging all the locals from the analysis in an EI study, a further analysis suggests a portion of the local segment may actually act and spend differently. The average expenditures of the local (convenience trade market area) and regional (destination trade market area) groups with VFR were $111.71 per group and $101.50 per group respectively, or $17.01 per person (locals—convenience trade market area) and $14.95 per person (regionals—destination trade market area). This was higher than the average expenditures of the typical local ($56.63 per group) and regional ($56.22 per group). These numbers were close to the average expenditures of the nonlocal day-trip groups ($118.16 per group). The difference appears in part due to the group size on a per person expenditure basis. The VFR groups were considered to be a hybrid submarket and their measurements were used to adjust the EI estimates. While these groups do appear to spend differently, they were extracted from the locals and added into the adjustments for the EI estimations. The results are presented in Table 4.
Visiting Friends and Relatives Expenditures and Group Size Effects.
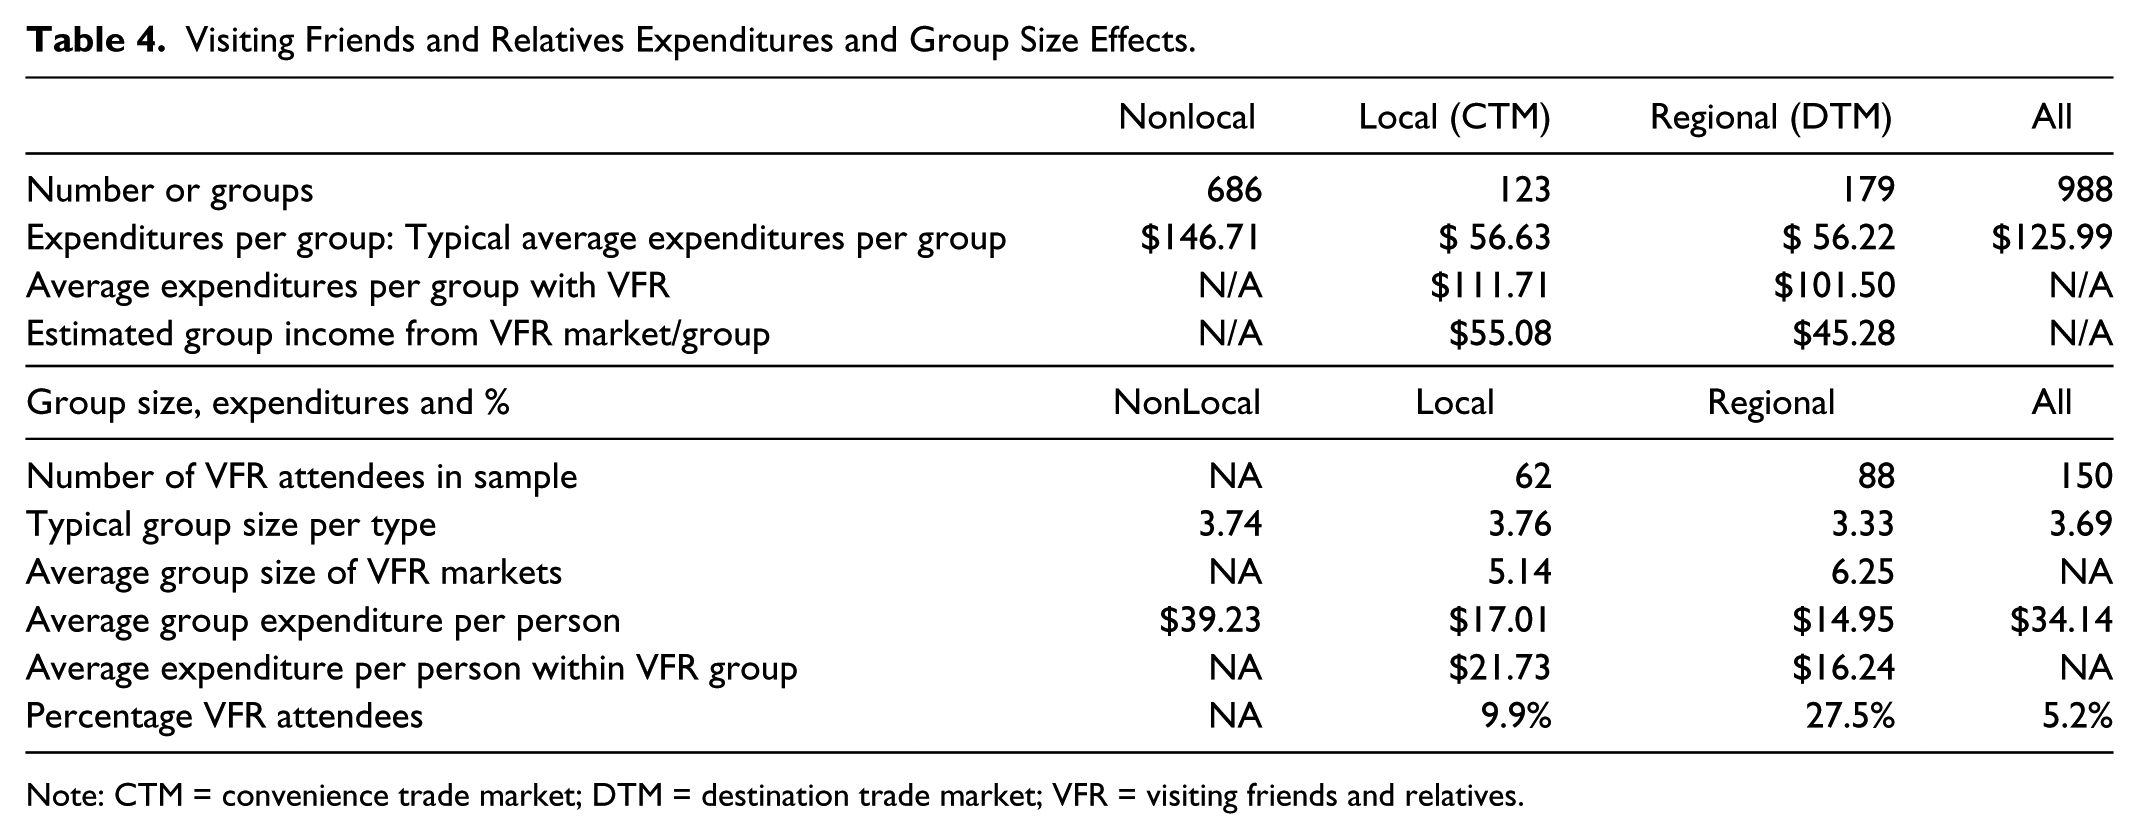
Note: CTM = convenience trade market; DTM = destination trade market; VFR = visiting friends and relatives.
Eliminating Casuals and Time-Switchers
Further investigation of special event attendees was conducted for casuals and time-switchers to determine their impact on the analysis. Additional questioning was employed to more fully understand the nature of the visit at the air show. For example, was the event a planned event or a substitute activity and was the visit to the area switched to coincide with the WIAS?
First, it was found that for 98% of the WIAS attendees, this was a “planned event” and not a substitute event. When asked if the event was not held on this particular weekend what would the attendees do, it was found that 47% would work or relax around the home, another 20% would engage in a local or home-based recreational activity, 8% would do nothing special or extraordinary, and only 24% would engage in another typical “tourist behavior” (i.e., go to the beach, visit another attraction/event). An estimated 346 different groups that would fall into these categories of inappropriate nonlocal groups being counted would have been excluded from EI measurements without the further questioning. When carefully sorted and examined, it was determined that only nine groups could definitely be classified as either time-switchers or casuals. These groups represented 1% of the groups attending. These groups were largely day-trip groups who spent substantially less on the air show. Therefore, in the projection of EI, no casuals or time-switchers were excluded in the adjustments because of the very small impact.
Calculating EI after Adjustment Improvements
In this process, three estimates were completed—one for economic significance (ES) and two economic impact (EI) estimates for each technique—the TMA technique with adjustments and the Crompton technique with adjustments. The process for estimating ES appears first, followed by the EI estimate process by method.
Estimate for Economic Significance
The following measure of ES serves as benchmark for all attendees to the WIAS and may be used for future comparisons.

Trade Market Analysis Technique Application for EI
First, the TMA technique was structured with the adjustments to correct and improve the estimation of locals and the segmentation of nonlocals into overnight stay and day-trip groups. Locals as defined by the convenience and destination trade market identities were eliminated. When excluding these locals, 69.4% of the attendees were nonlocals who bring new money into the local community. Day-trip visitors represented 84% while overnight visitors represented 16% of all nonlocals. Next, the casuals and time-switchers groups were analyzed. Only nine overall groups within the nonlocals were classified as casuals and time-switchers. This was a highly planned event and there were few, if any, substitutes for the event. No adjustments were made for these types but they should be carefully considered in any special event EI study.
Finally, a small segment of VFR groups were added back into EI estimation as they were identified as coming from outside the region. It was clear that additional expenditures did occur overall for these groups even though some savings were realized when these attendees stayed with family and friends. These were individuals who were eliminated as they were initially classified as locals (convenience or destination market area attendees); however, these VFRs and their related expenditures were entered back into the mix for estimation purposes. VFRs represented 9.9% of the convenience market (local shoppers) and 27.5% of the destination market (regional shoppers).
The Crompton technique eliminated the locals from the Westfield zip code areas and also eliminated casuals and time-switchers in the nonlocal group. Nonlocals represented 93.6% of all attending groups. The elimination of time-switchers followed the guidelines by Crompton, Lee, and Shuster (2001) and cut out the impact of 272 groups or 30.3% of the nonlocals, and the elimination of the casuals involved 64 groups or 7.5% of the nonlocals.
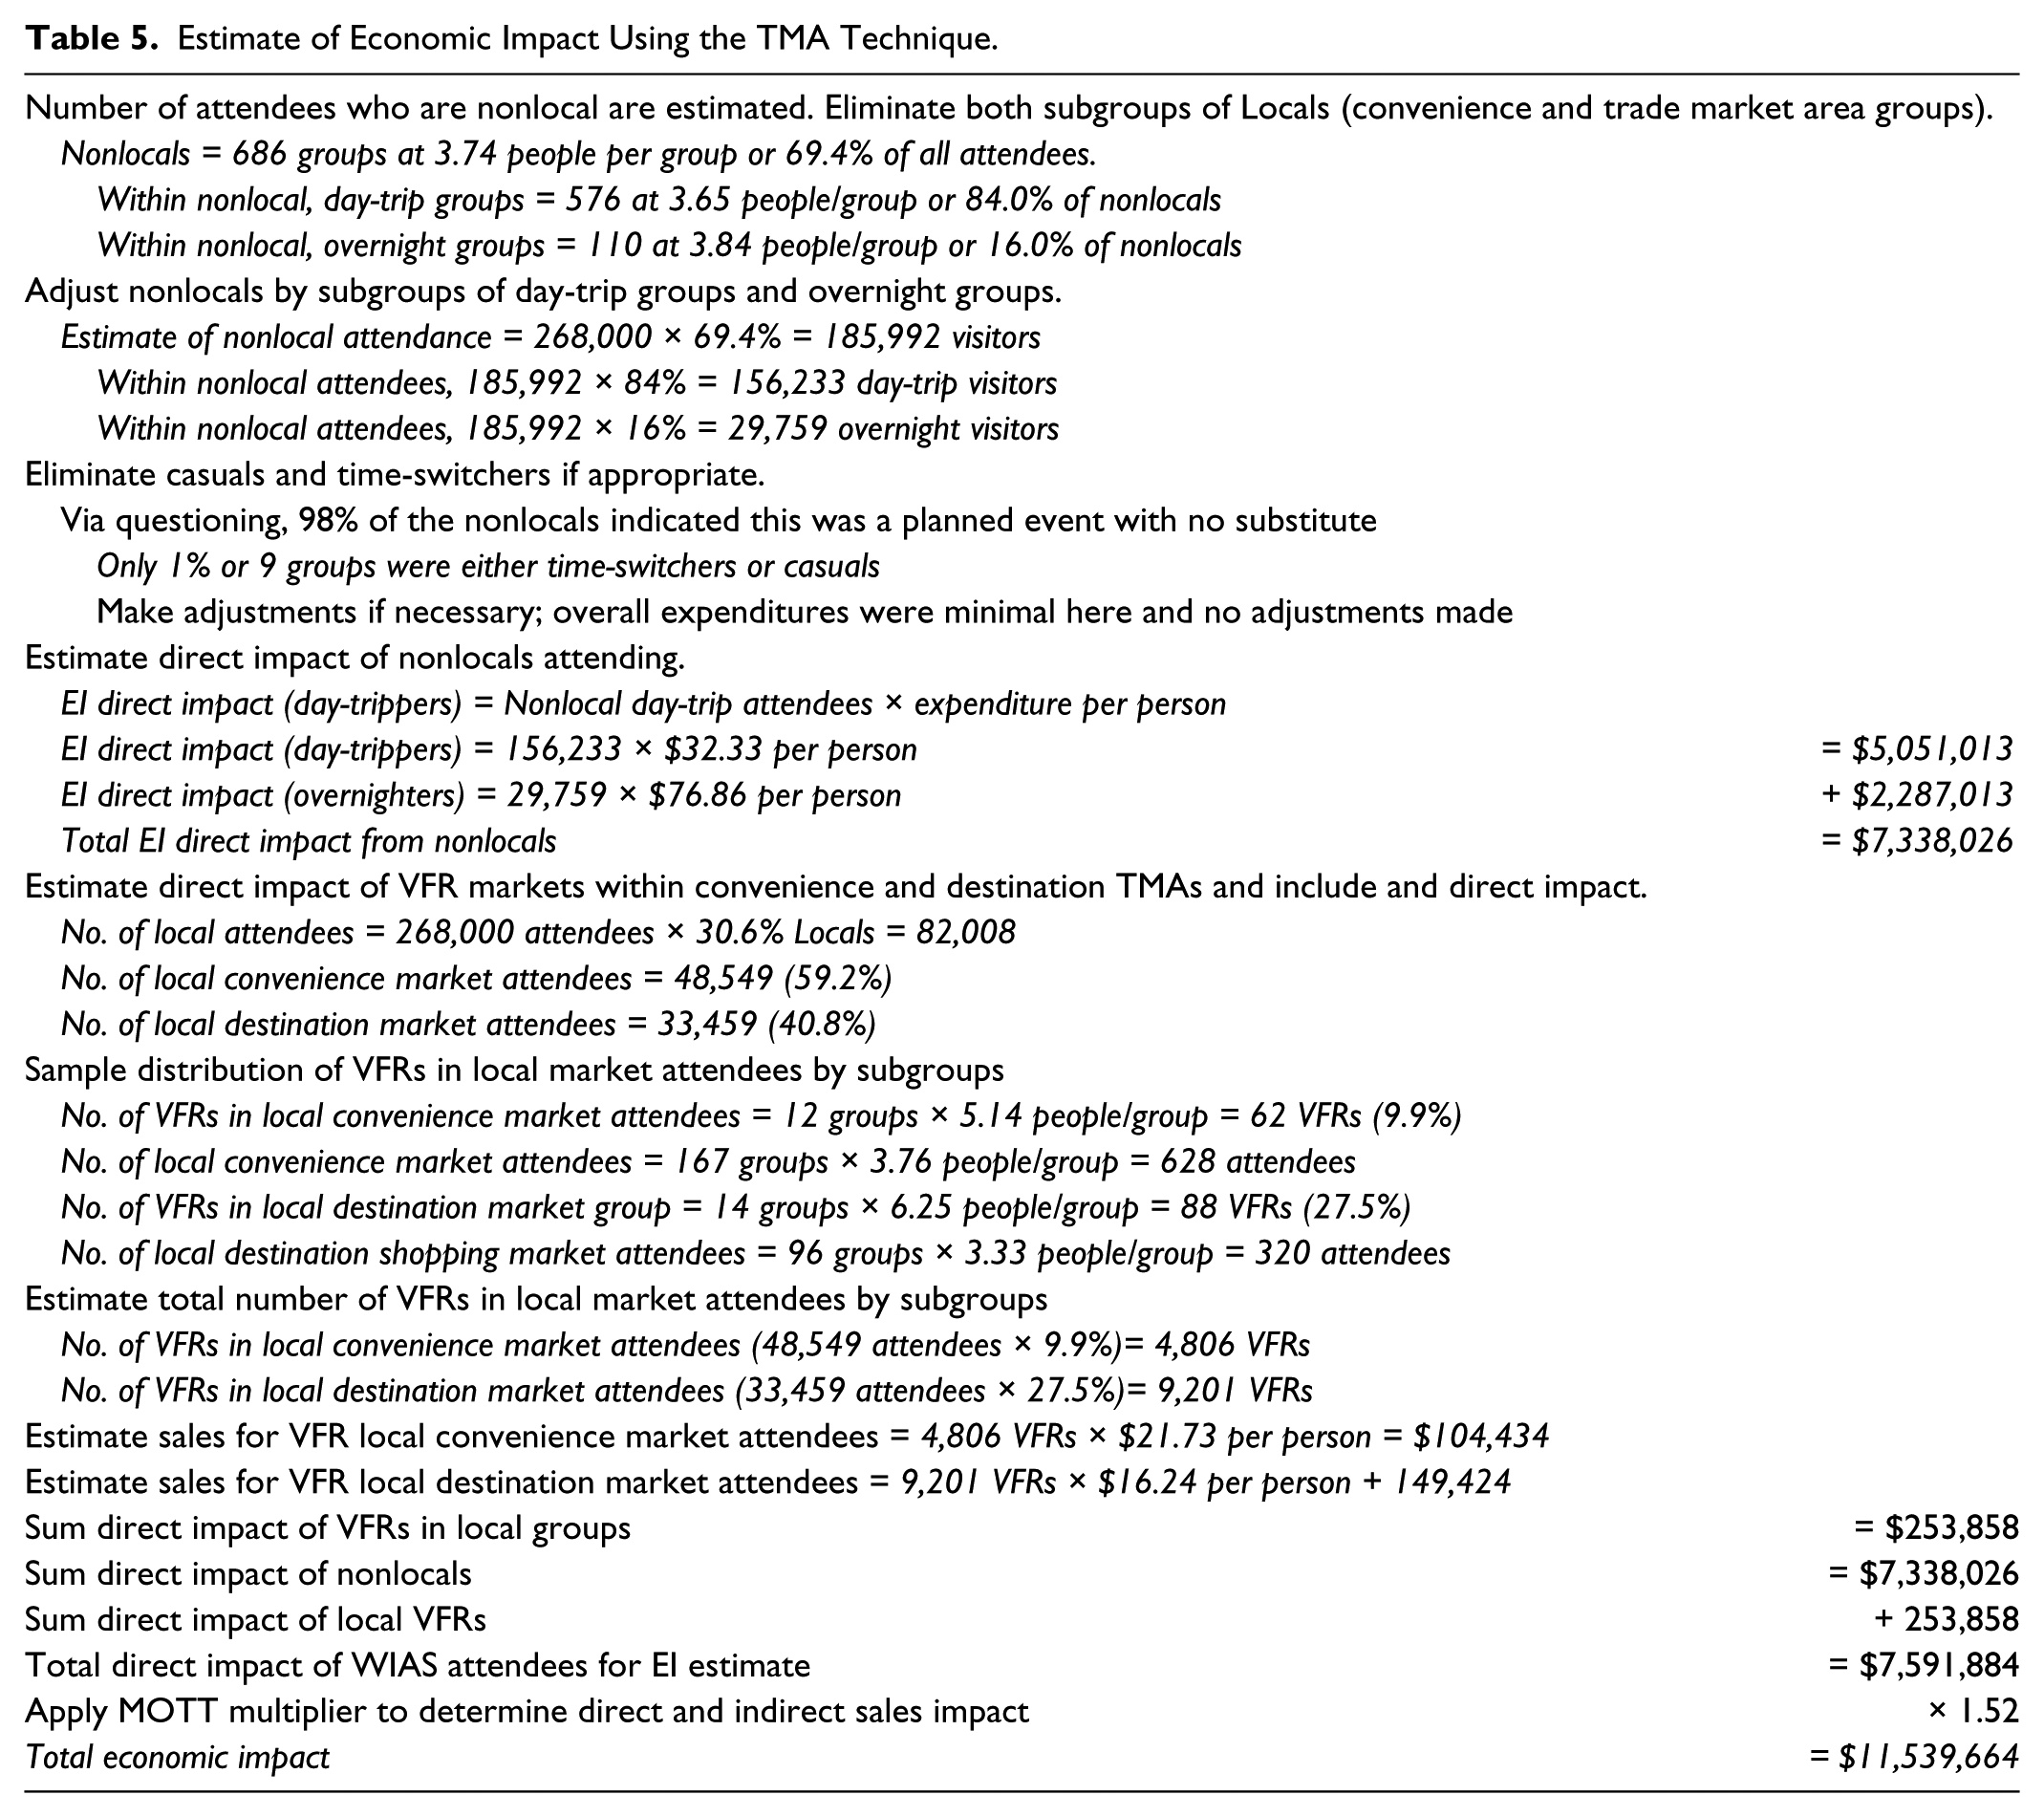
Tables 5 and 6 illustrate the estimation process for obtaining the EI using the TMA technique and the Crompton technique, respectively. Overall the total EI derived from the TMA technique with the appropriate adjustments suggested that the direct impact was $7.6 million while the Crompton technique with adjustments indicated a $6.0 million impact. When the sales multiplier was applied, the overall EI by the TMA technique was $11.5 million and the Crompton technique was $9.2 million.
Estimate of Economic Impact Using the TMA Technique.
Estimate of Economic Impact Using the Crompton Technique.
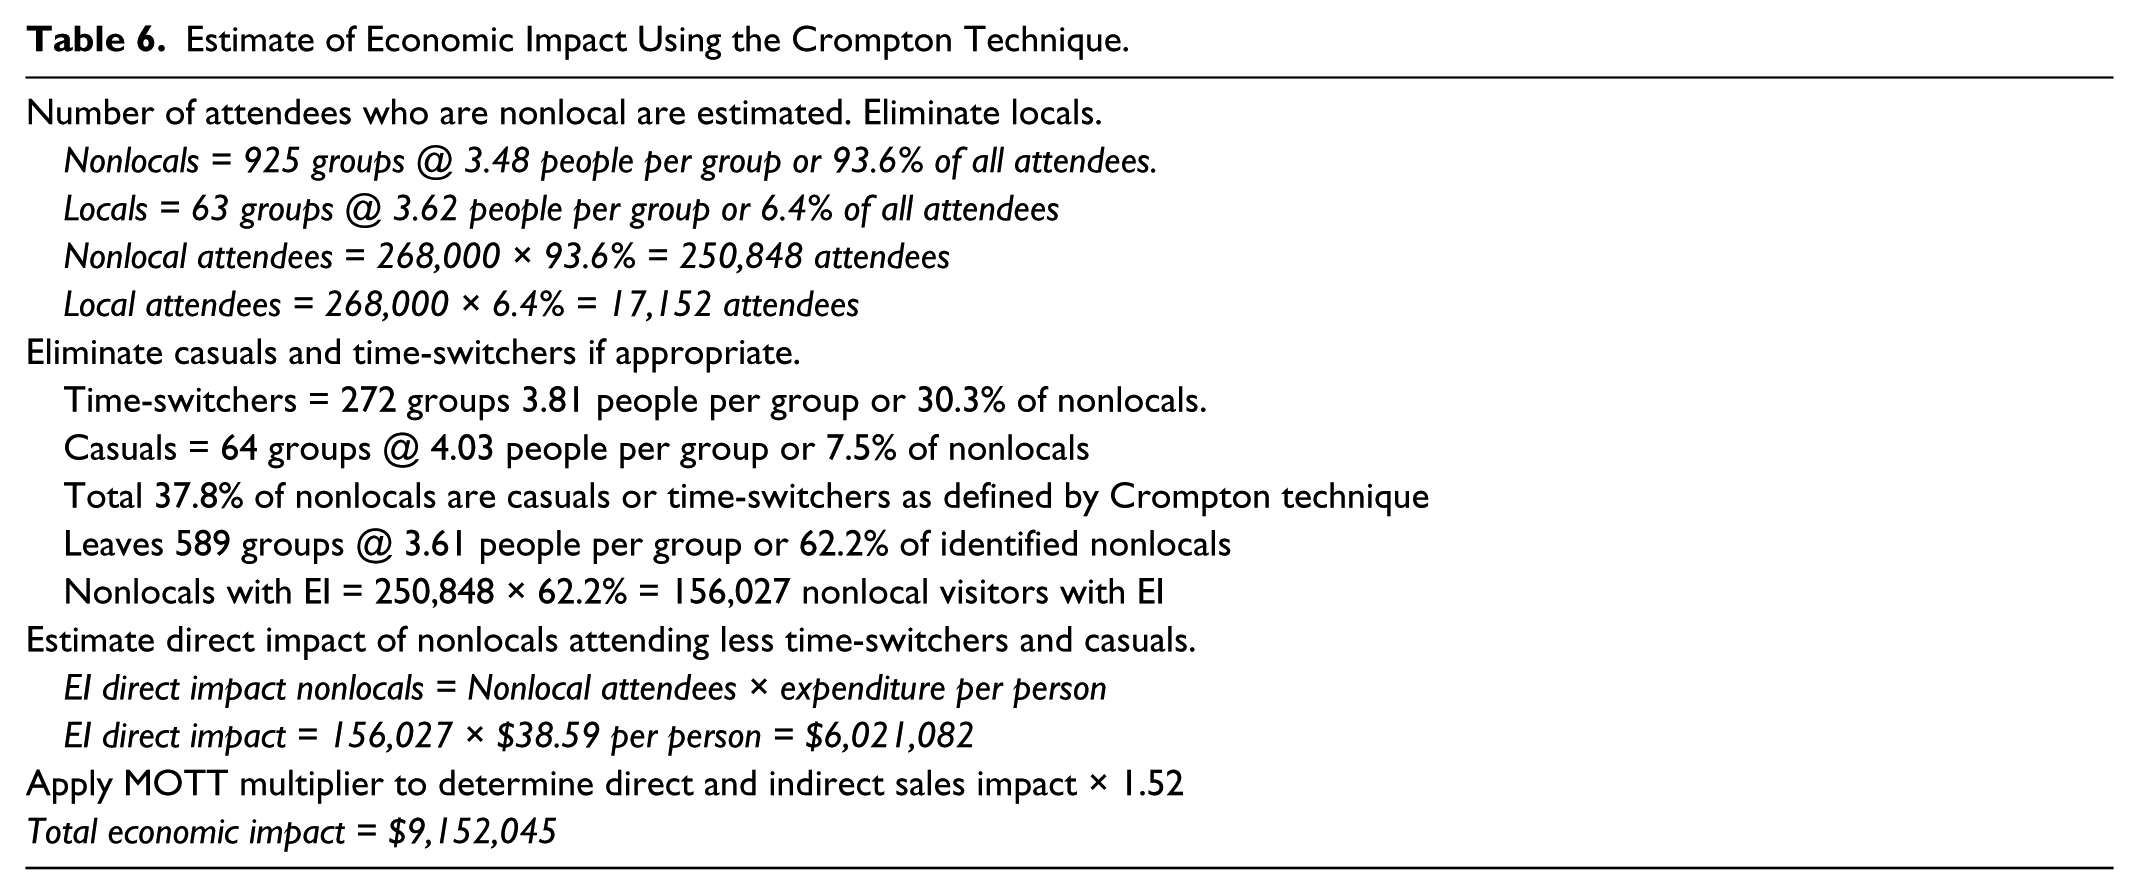
While the Crompton technique appears to be more conservative, it underestimates the impact of the nonlocals by including too many locals in the nonlocal classification, thus lowering the overall average. The TMA technique provides a better estimate since the various subgroups (locals, regionals, day-trippers, and overnight visitors) are more correctly identified with the appropriate adjustments. The TMA technique also added in the impact of the VFR markets within the locals who are not counted in the Crompton technique.
Conclusions and Discussion
This study examined the measurement techniques for assessing the EI and ES of a special event and further examined the concepts developed over time to improve the estimates of EI through the application of the TMA technique. These concepts included an examination of defining locals, examining further time-switchers and casuals, identifying hybrid local groups (the VFR markets), and finally adjusting the measures as applied to EI and benchmarking ES. The major contribution of this study was the refinement in the identification of locals and nonlocals. It is important to remember that EI is simply an estimate—a “best guess” of the overall expenditures—and that any method to enhance or improve these estimates is a step forward that both Crompton (2006) and Stynes (1997, 1999) recommended. The application of identifying locals through a more thorough review of the trade market areas and the segmentation of nonlocals enhances the EI estimates and moves away from an “average tourist expenditure” (Stynes and White 2006).
The Crompton technique should refine the definition of “locals” and include the consideration of trade market analysis of “convenience” and “destination shopping” segments for an improved classification of locals. It was clear that these two markets are more alike than different, and that combining them provides a more well-defined trade area for the local community and how its shopping economy works. It was also reasonable to further segment the “nonlocals.” This analysis demonstrated that nonlocals should be at least classified into “day-trip attendees” (those who travel from 20 to 99 miles one-way from the home residence to the special event) and “overnight visitors” (those who travel 100 miles or more one-way from the home residence and stay overnight). The additional improvements within these classifications of locals and nonlocals further the research recommendations previously noted (Damonte, Collins, and Megehee 2012; Wilton and Nickerson 2006; Stynes and White 2006).
The second important finding was the assessment and inclusion of the VFR (visiting friends and relatives) market in the EI estimates. This process and adjustment is not employed in the typical EI study even though it has been measured in other tourism studies (Moscardo et al. 2000; Backer 2008). Local and regional groups with VFRs spent more collectively than the typical local non-VFR group. The distribution of these groups varied from 10% to 28% of the local or regional market groups, respectively. The VFR groups do bring “new money” into the local area and may stimulate spending by hosts; however, in eliminating “locals,” their impacts under the Crompton technique are missed.
However, other issues must be carefully considered when measuring VFRs. First, it depends on which member of the group completes the survey. If the visitor completes it, the group’s expenditures may likely be recorded as “nonlocal,” but if the local host completes it, then the expenditures are recorded as “local” and might be dismissed. The additional probing is important. Second, it may be best to “split” the group and try to get a representative sample of each category to complete the survey, but this also suggests that spending by the group is segregated and this may not be the case. In this study, the VFR markets were added back into the EI measures as these groups acted more like nonlocals. Why? The expenditure patterns suggested these tendencies and it is likely the VFR group would spend more on direct event expenditures since savings are realized on lodging and some food and beverage expenses incurred by their hosts. Another method might be to simply ask who in the group paid the expenses for the event. Furthermore, the group sizes may explain away some of the differences and should be carefully monitored in future studies.
The following conclusions and applications for researchers and event planners were reached as a result of this comparative study to improve the EI process. Additional insights and implications into how special event organizers and planners may position and use EI and the ES benchmarking measures are noted here. These conclusions also substantiate the impacts and expenditures of attendees and visitors to a local community when a special event is staged even when the event is short term.
Improved Definition and Impact of Locals and Nonlocals. The improved definition of locals provides more precise measures of expenditure patterns. In addition, the classification of nonlocals also reveals a significant difference within nonlocals. Special event programmers should work to define locals through the use and mapping of the convenience and destination trade market shopping areas within the local community. This requires knowledge of the shopping areas and should follow the applications and recommendations by Wisconsin Extension Service (2012). This target may also help event planners that seek community involvement and local sponsorship from corporation and agencies. Researchers should continue to document the differences between locals and nonlocals to confirm and enhance the Crompton and TMA techniques.
Time-Switchers and Casuals Further Reviewed. More in-depth questioning of time-switchers revealed a relatively small pool of time switchers if appropriate probing questions are asked, and the online survey process offers this opportunity. The intentions and distribution of these types provides improved analysis. Casuals appear to be less of an issue since there were fewer of them as this event appeared to be a “special and planned” one with few substitutes. When respondents were asked to indicate what they would do if the event were not held, few substitute activities were suggested. Researchers should continue to probe by the use of these additional questions and enhance the Crompton technique.
VFR Markets Exist at Special Events and Behave More Like Nonlocals. The measurement of the VFR markets helps to further define “local” travel groups who act more like nonlocals in their respective expenditures and may in fact generate new money to the local economy. Planners and organizers of special events should carefully observe groups to determine if the groups are intergenerational or VFR markets and/or composed of unrelated individuals. Measuring the VFR markets by asking more direct questions about the group profile including the identity of group members and their numbers when surveying should help determine the magnitude and significance of these types of groups and their impact. Researchers should continue to explore and differentiate the VFR markets in the EI measurement process.
Limitations and Future Research
The estimates of the attendance numbers were primarily based on the organizers’ estimations, and therefore a subject of limitation even if specialists who are best equipped to do so participate and estimate the audience size. Furthermore, this study did not consider the negative cost aspects of the EI in the assessment process or volunteer costs in staging the event. While this study did capture some air show participants and some vendors in the sampling framework, more analysis of these “other groups” as suggested by Crompton, Lee, and Shuster (2001) may provide additional insights. This study also used a simplified and modified input–output model sales multiplier and measured only the sales and expenditure patterns. The induced specific detailed changes of sales, personal income, and employment were not fully examined in this two-day special event and as in most EI studies leakages do occur.
As for future research, this study did conclude that (1) improved adjustments can be made to the Crompton technique and Springfest framework for assessing EI in special events with the application of a TMA technique, (2) more precise EI estimates can be achieved in identifying locals and nonlocals, (3) addressing or considering the impact of the VFR markets, and (4) further analyzing time-switchers and casuals groups all have value in EI adjustments and impact. The opportunity to make further adjustments to these estimates and applications has a direct and important set of marketing implications in the evolving literature of event tourism. These areas should continue to be addressed in future research as a means of continuing to extend Crompton’s and Stynes’ significant work, knowledge, and application of EI and ES measurements.
Footnotes
Acknowledgements
Special thanks to the Great Springfield Convention and Visitors Bureau and specifically the Westfield International Air Show and support staff of the Barnes Air National Guard for access, implementation, and assistance in the completion of this study.
Declaration of Conflicting Interests
The author(s) declared no potential conflicts of interest with respect to the research, authorship, and/or publication of this article.
Funding
The author(s) disclosed receipt of the following financial support for the research, authorship, and/or publication of this article: The author(s) received support from the Department of Hospitality and Tourism Management in the Isenberg School of Management and the Graduate School of the University of Massachusetts in funding a research assistant to help with data collection and implementation of the study and in-kind support from the Greater Springfield Convention and Visitors Bureau and the Barnes Air National Guard Base in Westfield, Massachusetts, in providing staff and training for data collection.