
Abstract
Free-riding behaviors exist in tourism and they should be analyzed from a comprehensive perspective; while the literature has mainly focused on free riders operating in a destination, the destinations themselves might also free ride when they are under the umbrella of a collective brand. The objective of this article is to detect potential free-riding destinations by estimating the contribution of the different individual destinations to their collective brands, from the point of view of consumer perception. We argue that these individual contributions can be better understood by reflecting the various stages that tourists follow to reach their final decision. A hierarchical choice process is proposed in which the following choices are nested (not independent): “whether to buy,” “what collective brand to buy,” and “what individual brand to buy.” A Mixed Logit model confirms this sequence, which permits estimation of individual contributions and detection of free riders.
Keywords
Introduction
A collective brand is defined as a brand created by a public or governmental institution in order to endorse the product quality of the companies concerned, which can sell products with the legal backing and prestige of a specific geographical area and/or production method related to some level of quality (Fernández-Barcala and González-Díaz 2006). According to Vertinsky and Zhou (2000), a collective brand strategy involves producers of the same product category agreeing to use a label as the main brand, which is then tied to a code of practice that certifies the quality standards to be achieved. Only those firms meeting the quality standards can use the collective brand, thus rewarding them for investments contributing to the brand (Rangnekar 2004). Therefore, on the supply side, it allows service providers to have access to a collective reputation. In fact, trade associations very often manage collective reputation to defend their members’ interests with stakeholders such as regulators, employees, suppliers, and the media (Tucker 2008). On the demand side, a collective brand represents a quality signal (collective reputation) solving the problem of information asymmetries. In fact, the adoption of a collective brand is a very relevant marketing and communication tool for clusters since it transmits to the consumer a characteristic common to all the products or services included in the collective brand. This strategy is closely linked to the umbrella place branding, defined asa place brand spanning several functional contexts, thus favoring economies of scale since resources are focused on the determination of a consistent place brand (Therkelsen and Halkier 2008).
However, the reputation effect of the collective brand can be affected by the problem of free riding: If consumer perception of the quality of a collective brand is determined by their experiences of the quality offered by different members of the brand and if high-quality provision requires high investment, a given member will have the incentive to adopt a free-riding attitude with regard to the investments of the other collective brand members (Fishman et al. 2010). In a more succinct and intuitive way, free riding describes the situation where individuals or enterprises achieve benefits that they have not paid for (Lundtorp 2003). In this context, Bellini et al. (2010) claims that there is a clear need for political efforts of mediation, in order to reduce potential conflicts among the diverse stakeholders and harmonize innovative and traditional assets under a collective identity. Interestingly, Lundtorp (2003) detects a lack of academic interest in free riders in tourism, and more recently, Dwyer (2011, p. 245) suggests that this research line needs further exploration. Certainly, those tourism studies that deal with free riders focus mainly on specific facets of destinations, without considering collective brands that include different destinations (e.g., Angella and Go 2009; Hojman and Hiscock 2010). This is even more surprising on account of the growing interest in “interdestination ties” and network connections between destinations (Ness et al. 2013).
What is more, as collective brands base their essence on the transfer of quality perceptions between the individual brands and their collective brands (Wernerfelt 1988), in order to assess the impact of collective branding strategies on consumer choice behavior, Erdem (1998) suggests that researchers should study the process by which consumers draw inferences about these transferences and perceptions.
Accordingly, the objective of this study is to detect free-riding destinations by estimating the contribution of the different entities (individual destinations) that share the use of a collective brand from the point of view of consumer perception. Specifically, to estimate the individual brand’s contribution to the collective brand, and thus fill this gap in the literature, our analysis assumes that a collective brand should come from a range of relationships or associations among brands, in particular, from consumer impressions of the contributions of the individual brands to the attractiveness of the collective brand, in line with the Associative Network Theory (Collins and Loftus 1975) reviewed later in this article and with Keller (2003) who claims that collective brands exist to create a common set of associations. Moreover, we consider that collective brands could be better understood if they were studied through an approach that assesses the incremental effect of the individual brand through the various stages of a hierarchical choice process followed by the tourist, in line with Eymann and Ronning (1992) and Eymann (1995), in which the following choices are nested (not independent): whether to buy, what collective brand to buy, and what individual brand to buy.
In order to fulfill this objective, the remainder of the paper is arranged as follows: the second section reviews free riders in tourism, presents the context of the study, and justifies the estimation of the individual brands’ contribution to the attractiveness of their collective brands, based on a hierarchical choice process. The third section covers the design of the investigation, describing the methodology, sample, and variables used. The fourth section presents the results obtained and their discussion. Finally, the fifth section summarizes the conclusions.
Free Riders, Context of Study, and Decision Process
Free Riders in Collective Tourism Brands
Collective tourism brands are created to back the individual brands contained in it, which can be referred to a territory or a specific type of tourism destinations. In this context, free riders appear when one of these individual brands gets part of a demand that is generated without their contribution (Lundtorp 2003). Bimonte (2008) refers to it as a situation in which, because of the public nature of the good at stake, someone may escape the costs of an action without being prevented from enjoying its benefits.
According to Lundtorp (2003), the phenomenon of free riding is especially relevant in tourism marketing, even more considering that its scope should go beyond mere “advertising” or “promotion” activities (Dwyer et al. 2013). Destination marketing represents an investment intended to benefit all the firms operating in a destination, but not all of them contribute equally. Certainly, on account of the atomization of the tourism industry, with many small firms competing against each other in a destination, it is no wonder that free riding is more prominent in the tourism industry than in other businesses.
Lundtorp (2003) identifies four types of free riders in tourism: (1) Free riding in relation to the destination: a firm can open an establishment in a destination and take advantage of tourist flows that have already been generated by past investments. (2) Free riding in relation to other tourism elements: similar to the previous typology, a firm can choose its location close to an existing enterprise so that the former can try to attract the tourist that goes to the latter. (3) Free riding in relation to marketing: as indicated above, even though there might be firms that do not pay for the marketing applied to a destination, they are still selling their products and services to the people attracted by this marketing. And (4) free riding in relation to national and regional associations: a firm can choose whether to join an association, with some advantages exclusively for its members; however, the tourists going to the destination might consume any service from any firm, be it a member of the association or not. Besides, a firm may choose to join a local association but not a national one, and vice versa; either way makes it a free rider.
It is important to note that in this classification, one type of free riding is missing: in the context of collective destination brands, whether referred to a territory where several destinations can be found or a type of tourism destinations (where the individual destinations might not necessarily be adjacent), free-riding destinations can take advantage of collective brands. In fact, while some research recognizes the importance of considering the phenomenon of free riding (Gretzel et al. 2006; Sheehan, Ritchie, and Hudson 2007; Sharifpour et al. 2013), the few studies that explicitly attempt to analyze free riders tend to focus on specific aspects of a destination: Bimonte (2008) applies it to the conflicts regarding usage of tourism resources, both natural and man-made, at a destination; Hojman and Hiscock (2010) analyze free riding and its effects, in the specific case of the Sidmouth International Festival; and Angella and Go (2009) examine collaborative tourism marketing from a stakeholder’s theory approach, by focusing on the relationship between destination management organizations and tourism firms, in Barcelona and Vienna. This scarcity of research is recognized by Dwyer (2011, p. 245), who regards it as a pendant research line. Consequently, we analyze free riders in the context of tourism destinations types, where a “type” represents a collective brand composed of several individual destination brands.
Contextualization: Sun, Sea, and Sand versus World Heritage Destinations
In many countries, public administrations launch collective brands for tourist destinations because this strategy increases quality differentiation and acts as an informative tool, thereby increasing tourists’ utility. These collective brand names have the potential to alter consumer perceptions of destinations whose bundles of attributes may otherwise be very similar to competing offerings sourced from other geographical areas (Baker and Ballington 2002). Furthermore, following Han (1989), an individual brand destination can capitalize on a preexisting strong collective brand image (say, country reputation) on the basis that certain consumers transfer their knowledge and associations of a collective image to individual brands (e.g., associating a country’s image to specific products, or through the relationship between geographic experience and knowledge experience; Tussyadiah and Zach 2012).
In the particular case of Spain, the individual and collective brands of tourism destinations have developed in the following way: The predominant tourism in Spain in the 1960s was that of sun, sea, and sand, when the state authorities created various individual destination brands (e.g., Costa Brava, Costa del Sol, Costa Blanca and Costa de la Luz, among others). Later, the 1980s saw the creation of the collective sun, sea, and sand brand “Spain” by the Spanish promotional body Turespaña (Spanish Tourism Institute), which was mass promoted with the famous Sun of Miró as a logotype. In the final quarter of the 20th century, the number of tourists in Spain looking for sun, sea, and sand grew by more than 120%, and tourist spending grew from 528 to 3,624 million euros (Uriel et al. 2001). Currently, the promotion of individual coastal brands is done by the autonomous geographical regions, whereas the promotion of the sun, sea, and sand collective brand follows the formula of agreements with these regions under the umbrella of Turespaña (Eiros 2005).
Concurrently, various Spanish cities (e.g., Santiago de Compostela, Cáceres, Ávila, Salamanca, Cuenca, Segovia, Toledo, and Córdoba, among others) were awarded the distinction of World Heritage City by UNESCO; but until the 1990s they were only promoted as individual brands. It was in the 1990s that Spanish holiday habits began to change, manifested by a tendency of tourists to look for alternatives to the sun, sea, and sand–type holiday (Fuentes 1995). In this new context of a mature sun, sea, and sand sector, the public authorities of the autonomous regions and the cities (town halls) followed a differentiation strategy to adapt to the needs of clients (Espinet et al. 2003), meaning that they implemented the marketing of cities (Chías 2005) through the promotion of each individual brand of the World Heritage Cities. (Spain is the third country with the most World Heritage properties [UNESCO 2013].) This initiative has helped foment tourism alternatives in inland areas and this has facilitated environmental improvements and income generation through the diversification of the local economy (Hernández-Maestro and González-Benito 2013). In the mid-1990s, Turespaña supported these individual brands and strengthened the rich Spanish cultural heritage through the creation of the collective brand “World Heritage Cities.” In summary, the collective brands of Spain: Sun, Sea, and Sand and World Heritage Cities were developed and promoted after the individual brands of coastal destinations and of individual World Heritage Cities.
In this tourism context, the lack of perception of the collective interest in using and improving resources does not promote this interest adequately, leading to free-riding behaviors associated with an “investment incentive problem” (e.g., some entities might be reluctant to contribute to the costs of their maintenance, upgrading, or restoration; Briassoulis 2002). Therefore, it would be very useful to know the contribution of the different individual brands that share the use of a collective brand from the point of view of consumer perception in order to detect any free-riding behavior.
Hierarchical Decision Process: Whether to Buy, What Collective Brand to Buy, and What Individual Brand to Buy
While conscious processes are traditionally assumed to analyze the value of brands (Romaniuk, Bogomolova, and Dall’Olmo Riley 2012), some studies (e.g., Krishnan and Chakravarti 1999) show that many aspects of brands can be derived from non-conscious mental processes that cannot readily be accessed by traditional awareness measures, which makes it necessary to study indirect measures that capture the implicit types of brand memory; memories that may be the basis of brand predispositions that influence marketplace outcomes for the brand (Erdem et al. 1999). Accordingly, we estimate the contributions of individual brands to their collective brands by observing people’s choices, so that we base the analysis on what they do rather than on what they say. In an attempt to mimic and reflect the way people process information, we propose and test a hierarchical decision process, in line with Eymann and Ronning (1992), Eymann (1995), and Nicolau and Mas (2005, 2008). In the context of collective brands, a natural decision sequence arises: tourists first decide whether to buy (i.e., whether to take a vacation), second what collective brand to buy (i.e., what type of destination), and third what individual brand to buy (i.e., what destination out of the existing alternatives). This structure is proposed (and compared to the sequence “whether to buy” first and “what individual brand to buy” second) on the basis of the consumer’s bounded rationality and decision-makers’ limited ability to process information (Simon 1955). These characteristics must lead people to make decisions about collective brands by following strategies of the satisficing type (satisfice = satisfy + suffice), as defended by Simon (1955), where alternatives are considered sequentially. This proposal is further backed by:
The Associative Network Theory (Collins and Loftus 1975) that, through “cognitive networks,” explains the way the information on individual brands and collective brands is represented, processed and activated in consumers’ memory through nested links. Specifically, this theory proposes that information is held in the memory through an interrelated structure of cognitive networks, in which each cognitive network has various “nodes” and “links” between different nodes. Thus, brand names and implicit attributes can be represented as nodes in a network (e.g., Category node = tourism destination; Brand 1 node = Costa del Sol; Brand 2 node = Costa Blanca; Attribute node: sun, sea, and sand destination). A link between two nodes is established when a person processes information that associates the nodes in some meaningful way (Samu, Krishnan, and Smith 1999), such as the properties of the brand names represented. For example, stemming from the fact that a destination is, besides a geographical place, a “metaphysical space determined by a network of meanings and values that are attached to it” (Campelo et al. 2013), links between the node “tourism destination,” the node sun, sea, and sand destination, and the nodes Costa del Sol and Costa Blanca brands may indicate that these brands are members of a category that share the same attribute.
The Cybernetic model of decision making (Steinbruner 2002), which explains how the consumer can follow a hierarchical choice process (such as whether to buy, what collective brand to buy, and what individual brand to buy) to reduce uncertainty and complexity in the decision task. Destination choice has numerous factors for consideration and problems related with available information, so they are inclined to use a hierarchical strategy for their choice to reduce uncertainty to a certain manageable level.
Research Design
Methodology
In order to detect potential free riders, we follow a three-phase method: (1) we test and compare a two-stage hierarchical choice process of whether to buy and what individual brand to buy and a three-stage process of whether to buy, what collective brand to buy, and what individual brand to buy, using random coefficient multinomial logit models; (2) we then calculate each tourist’s utilities of collective and individual brands to estimate the contribution of the latter on the former by regressing the collective utility over the individual utilities; and (3) within each collective brand, we compare the individual brand’s contributions among them and to an average value to identify potential free riders.
First phase
We test two alternative hierarchical multistage choice processes: First, a two-stage model of the whether to buy and what individual brand to buy decisions. The choice in the first stage is between buying and not buying. People who choose to buy in the first stage go on to a second stage in which they decide among different individual brands. Second, a three-stage model of whether to buy, what collective brand to buy, and what individual brand to buy. The choice in the first stage is between buying and not buying. People who choose to buy in the first stage go on to a second stage in which they decide among different collective brands. Those who choose a collective brand in the second stage go on to a third stage choice among different individual brands of the previously chosen collective brand. A random coefficient multinomial logit model (RCL) estimates the earlier specified two- and three-stage models. Specifically, RCL models are an alternative to the more traditional multinomial logit models due to (Train 2009) (1) their ability to deal with the unobserved heterogeneity of tourists, by assuming that the coefficients of the variables vary among tourists (empirical research shows that heterogeneity in tourism is a fundamental aspect to consider [Barros, Butler, and Correia 2008; Correia, Santos, and Barros 2007]); and (2) their flexibility, which allows representation of different correlation patterns among alternatives, which is all important to this study as it allows us to reflect the decision structure of collective and individual brands.
With regard to the first point, unobserved heterogeneity of tourists in parameter estimations exists in the tourism market and it must be modeled. Hence, the utility of alternative brand i for tourist t is defined as

where J is the number of alternatives and g is the density function of βt, and θ are the parameters of this distribution (mean and variance).
As for the flexibility of the RCL model, it allows us to represent different correlation patterns among nonindependent alternatives. Certainly, apart from avoiding the assumption of Independence from Irrelevant Alternatives (IIA), the fact that RCL models do not have the restrictive substitution patterns of traditional Logit models allows representation of any random utility model (McFadden and Train 2000). In particular, an RCL model can approximate a Nested Logit (NL), which is appropriate for nonindependent and nested choice alternatives. Following Browstone and Train (1999), the RCL model is analogous to an NL model in that it groups the alternatives into nests by including a dummy variable in the utility function that indicates which nest an alternative belongs to. Technically, the presence of a common random parameter for alternatives in the same nest allows us to obtain a covariance matrix with elements distinct from zero outside the diagonal, obtaining a similar correlation pattern to that of an LN model. For the case of beach destinations versus World Heritage destinations, let us assume that the utility function of alternative i is Uit =βxt + µtzi + εit, where µ is a vector of random terms with zero mean and variance σ2µ,, and εit is independently and identically distributed extreme value with variance σ2ε. The nonobserved random part of the utility is ηi = µtzi + εit, which can be correlated with other alternatives depending on the specification of zi. For example, assume that four alternatives beach destination A, beach destination B, World Heritage destination C, and World Heritage destination D have the following utility functions:


If two alternatives A and B are truly correlated, their covariance is Cov(ηA,ηB) = E(µt + εAt)(µt + εBt) = σ2µ, which permits identification of correlated nonindependent alternatives. Therefore, if the parameter of the variance σ2µ is significantly different from zero, it implies that the alternatives are correlated and must be “closer to each other” and even at the same level of decision. In the context of this study, it means that the two destinations belong to the same “nest,” i.e., the same collective brand.
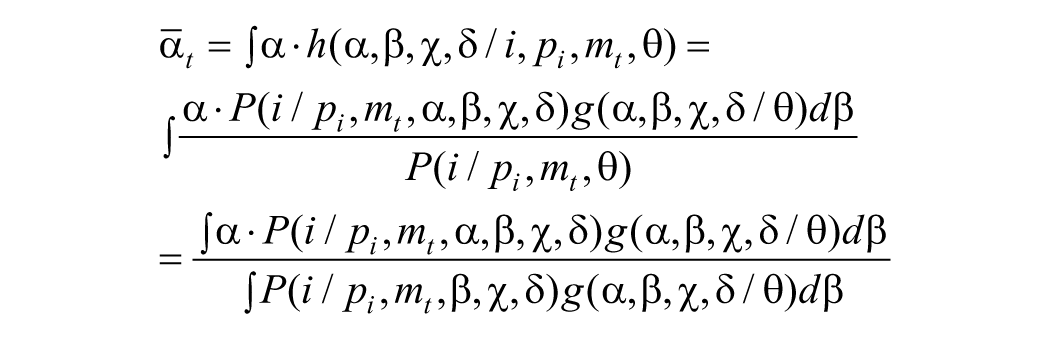
A further interpretation can be given to this common random parameter, as it represents the attractiveness of the nest. In fact, according to Train (2009), it plays an analogous role to the inclusive value of McFadden (1981) or category attractiveness of Guadagni and Little (1998) of NL models. In the context of collective brands, this coefficient indicates the utility that the tourist receives no matter which alternative individual brand they choose in the nest; and it represents a measure of the value of the collective brand to the consumer (Kamakura and Russell 1993). In line with these authors, we associate the parameter αk with nest k in order to reflect the information that describe collective brands, so that these variables differ over collective brands but not over alternatives within each collective brand. Thus, the utility of alternative individual brand i for tourist t is defined as:

where αkt is the k-nest-specific parameter (collective brand parameter) for tourist t, βit is the alternative-specific constant (individual i-brand parameter) for tourist t, χ t is the parameter of the attribute price pi for each tourist t, which represents personal sensitivity, and δt is the parameter of the interaction motivation × price, which indicates the moderating effect of motivations mt on the influence of price. This approach follows that of Kamakura and Russell (1993) whose choice model includes the constant and situational variables as explanatory variables; analogously, we use these independent variables for illustrative purposes and to show how to detect free riders. Especially important, though, is the constant, as it defines the intrinsic utility of the brand and “represents the value of the brand to the tourist, after the effect of the situational factors” (Kamakura and Russell 1993, p. 12). Therefore, the equation (1) becomes:

Note that g(pi, α, β, χ /θ) is the distribution of the random parameter vector β in the population of all tourists, and θ are the parameters of this distribution (mean and variance). We can derive the distribution h(α, β, χ/i, pi, θ) of the sensitivities of tourists selecting alternative i, by applying Bayes’ rule:

And rearranging,

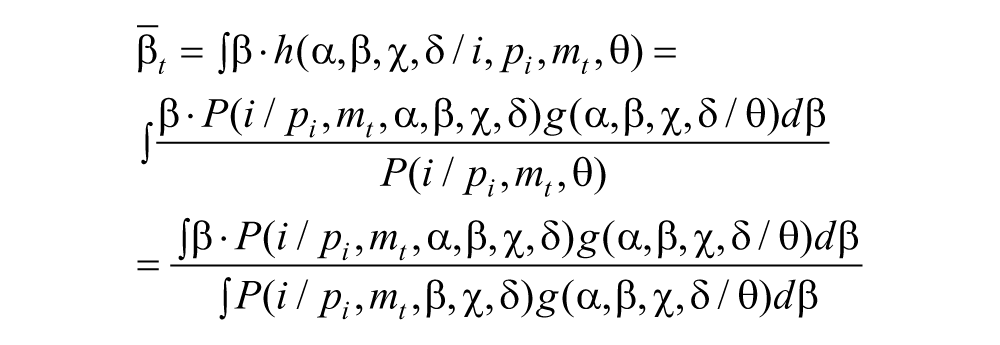
From this equation, we can obtain the collective brand parameter αt and the individual brand parameter βt of tourist t through the expressions
Second phase
We estimate the specific contribution of each individual brand to their collective brand by regressing the collective brand utility on each brand utility. The final utility of an alternative depends on the value of both the collective and individual brands. Thus, the decision is influenced by the addition of the two values. The parameter α is an average value of the collective brand; if we add the parameter β, the result would show the intrinsic global value that the tourist gives to the final choice (i.e., β would indicate how higher or lower the individual brand stays compared with the rest of the individual brands within the same collective brand). However, the central question is: how is the collective brand value generated? The value of a collective brand is created by the components in it, so if we estimate the value of its individual brands we can gauge their contributions to the collective brand they belong to. That is, this analysis allows us to know the positive or negative effect of the individual brand value on the average collective brand value. Even though the utility of an alternative is formed by the addition α + β, the individual brand value β exerts an effect on the collective brand value α. The contributions are obtained by estimating the following system of equations with one equation for each collective brand:


where λi ∀i∈{1, …, n1} and θi ∀i∈{1, …, n2} are the contributions of the individual brand utility on the collective brand utility and µk1 and µk2 are the respective disturbances for each collective brand equation. According to Klapper, Ebling, and Temme (2005), as the variables in the regression are estimated values, we weight them by their standard error.
3rd phase
As βi would indicate how higher or lower the contribution of an individual brand is than the rest of the individual brands within the same collective brand, we consider the average magnitude of the contribution of individual brands to the collective brand as a free-riding threshold. Specifically, an individual brand below this average contribution would reflect that tourists’ perceptions lead it to be regarded as a “free-rider” in a collective brand.
Sample, Data, and Variables
To reach our proposed objectives, we use information on tourist choice behavior obtained from the national survey Spanish Holidaying Behavior (III), which was carried out by the Spanish Centre for Sociological Research. This is due to the following reasons: (1) The availability of information on individual tourist destination brand choice behavior in terms of different collective brands “Spain, Sun, Sea, and Sand” and “World Heritage” and (2) the survey being directed at a sample obtained in origin, which avoids the characteristic selection bias of destination brand collected samples. This aspect is important as it ensures that the sample includes not only those people who travel but also those who do not, which leads to a more precise analysis of tourist demand by adding the “no choice” alternative and thus mimicking an actual set of alternatives.
The sample is taken by using multistage sampling, stratified by conglomerations, with proportional selection of primary units—cities—and of secondary units—censorial sections. The strata were formed by combining the 17 regions and 7 city sizes. Specifically, 7 categories were defined as (1) less than 2,000 inhabitants; (2) between 2,001 and 10,000; (3) between 10,001 and 50,000; (4) between 50,001 and 100,000; (5) between 100,001 and 400,000; (6) between 400,001 and 1,000,000; and (7) more than 1,000,000 inhabitants. The information was collected through personal, at home, interviews with a structured questionnaire. The sampled individuals were selected through random routes and quotas defined by gender and age. The sample size is of 2,390 individuals, with an average age of 43 years old, from whom 736 took a vacation.
In order to make the choice models operative, we define the variables used and identify the dependent and independent variables.
Dependent variables
To represent the set of individual brands available to the tourist, we use 13 dummy variables for the following alternatives: four coastal individual brands, chosen by 549 individuals (Costa Blanca [215 individuals], Costa Brava [105], Costa del Sol [104], and Costa de la Luz [125]), eight World Heritage individual brands selected by 187 individuals (Santiago de Compostela [38], Cáceres [28], Ávila [26], Salamanca [23], Cuenca [22], Segovia [17], Toledo [17], and Córdoba [16]), and the alternative “not to go on holiday” (1,654 individuals). Note that we do not have to explicitly define collective brand dummies for the dependent variable as we are observing their selection implicitly, that is, choosing an alternative a included in nest A implies choosing nest A. In the questionnaire, the individuals were directly asked about the place they stayed in during their holidays.
Independent variables
Collective and individual destination-specific variables
To represent the effect of each collective and individual destination brand on their own utility, we form several dummy variables to capture the idiosyncratic utility for each and every one of them. These variables take a value of 1 in the utility function of their alternatives.
Individual brand prices
Price is considered by the majority of tourists to be a decisive factor in their tourist decision making, being an element creating positive behavioral intentions such as repurchase (Petrick 2004; Chen and Tsai 2007; He and Song 2009), and a satisfaction generator (Chen and Tsai 2007). Price measurement is a complex task in tourism (Crouch 1994) and authors such as Eymann and Ronning (1992) and Usach (1999) consider that the correct method of reflecting the prices of a certain tourist market is to compare destination prices with those of the home market and those of competing destinations. In line with these authors, our study measures destination prices of intracountry administrative units through consumer price index differentials among origins and destinations, which are published in the National Institute of Statistics (INE), and which represent the cost of living of each origin/destination. As the individuals were asked to provide both destination and their origin, we build these differentials for each individual.
Motivations
The Theory of Consumer Behavior by Blackwell, Miniard, and Engel (2006) considers that motivations represent individual internal forces that lead to action (Schiffman and Kanuk 2009). In this respect, tourist motivations are characteristics of individuals that influence the choice of destinations, since they act as push factors leading to the realization of tourist travel (Grimm and Needham 2012; Li and Cai 2012; Prebensen et al. 2012; Schneider and Vogt 2012). It is important to stress that the selection of a certain holiday destination implies a desire for some kind of benefit. Because of this, motivations play a fundamental role in destination choice and mobility decisions (Masiero and Zoltan 2013), as they constitute internal thoughts that lead tourist behavior toward certain ends (Nahab 1975); in other words, they are the reasons why people take a holiday). The analysis of the tourist motivations that lead to the choice of a destination is crucial, even more so considering that the relationship between destination choice and motivations should be borne in mind by tourism organizations in order to identify the maximum price that tourists are prepared to pay (Lo and Lee 2011); accordingly, the interaction motivation × price will be considered in our study to explain the decision to take a vacation. People were asked in the questionnaire to indicate the top three motivations to take a vacation. In this empirical analysis, we focus on the three most often selected motivations in the sample, which in turn are the ones that have traditionally occupied the top three reasons for Spanish people to take a vacation (Familitur Reports 1999–2009), which are search for climate (16.11%), visiting friends and relatives (13.39%), and search for tranquility (12.01%).
Search for climate and tranquility
In the opinion of Rugg (1973), a stay at a destination over a period of time facilitates the enjoyment of attributes of the destination, such as the climate or tranquility of the place, which generate utility for the tourist. Furthermore, the motivation to go on holiday determines the valuation of attributes (price) (Nicolau and Mas 2006) and the choice of destination (Eymann and Ronning 1997; Eugenio-Martin and Campos-Soria 2013), which means that we can assume that people who choose a destination for its climate or tranquility have a greater propensity to pay higher prices if they can obtain these attributes, which is in line with the dual function of price–value perceptions (Chia-Jung 2013). If an individual expects to find good climate and tranquility, they might be willing to forego some extra money to enjoy these attributes.
Visiting family and friends
The interpersonal motivation of socializing through visits to family and friends explains why many people travel. In fact, in countries such as Spain, returning to the place of origin at least once a year is a very common practice (Usach 1998). Consequently, we can expect that visiting family and friends moderates the effect of destination prices, as the tourist would travel to these places regardless of their prices. Note that the accommodation needed to stay at the destination has no cost as they tend to be lodged at family and friends’ houses which represents an important incentive. Actually, in some related empirical results, staying with friends and family are linked to longer stays (Silberman 1985; Alegre and Pou 2006).
All three motivations are measured through dummy variables, where the value of one means that the individual considers this motivation when selecting a destination, and zero otherwise (Eymann and Ronning 1997). In the survey, the individuals were asked to provide the three main motivations to select the destination they chose.
Results and Discussion
First, we choose the best hierarchical multistage process with the different motivations. The results obtained (see Table 1) show that the likelihood function calculated for nested structure with three stages (first stage: whether to buy [going on holiday]; second stage: what collective brand to buy [Sun, Sea, and Sand vs. World Heritage]; third stage: what individual brand to buy) has a better fit than that of a nested structure with two stages (first stage: whether to buy [going on holiday], second stage: what individual brand to buy). This better fit is significant for all the motivations (see likelihood ratio tests in Table 1). Therefore, this result indicates that the structure to better represent the tourist decision sequence is a nested structure with a first stage in which individuals decide whether or not to go on holiday; a second stage in which those who decide to go on holiday choose between the Sun, Sea, and Sand and World Heritage collective brands; and a third stage that decides the individual brand of the previously chosen collective brand. It supports the idea that the decision process on tourist brands (what to buy) is nested.
Performance of Alternative Hierarchical Choice Processes with Different Motivations (Log Likelihoods).
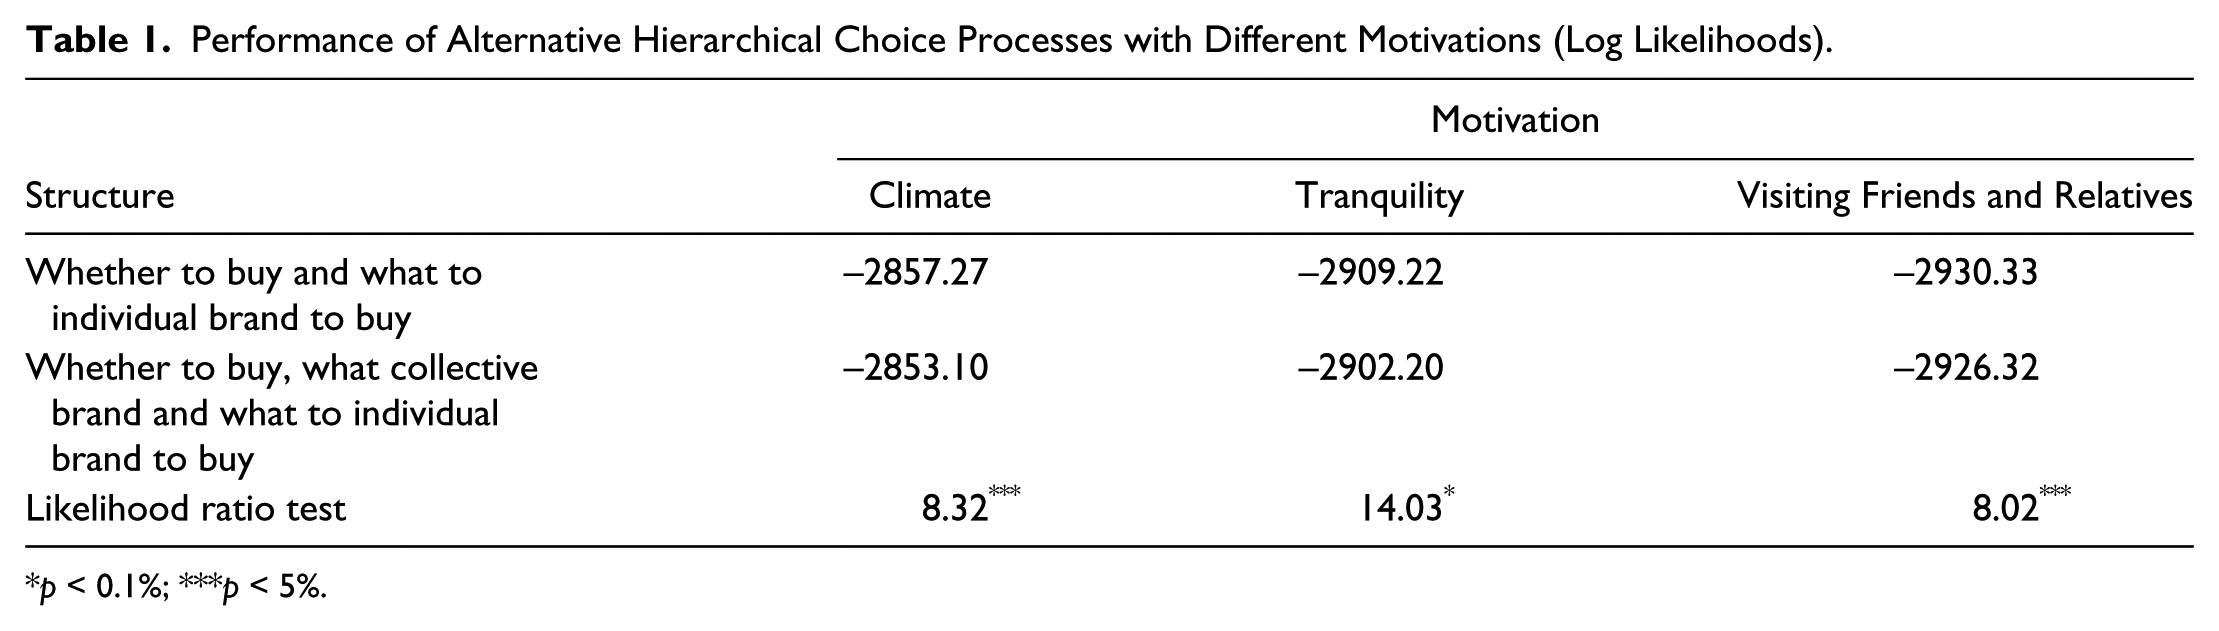
p < 0.1%; ***p < 5%.
Within this three-stage process, search for climate is identified as the motivation that reaches the highest likelihood function (see Table 1); thus, Table 2 shows the estimates for this sequential model with climate motivation. With regard to the coefficients estimated, it is important to stress that the significance of parameter b indicates the average effect of the dimension analyzed, and that the significance of the parameter of standard deviation SD(β) shows that the effect of this dimension is different for each tourist (which shows the existence of heterogeneity and the superiority of the RCL model over the standard Logit). The results obtained show the following:
Parameter Estimates: Hierarchical Choice Process: Whether to Buy, What Collective Brand, and What Individual Brand to Buy.
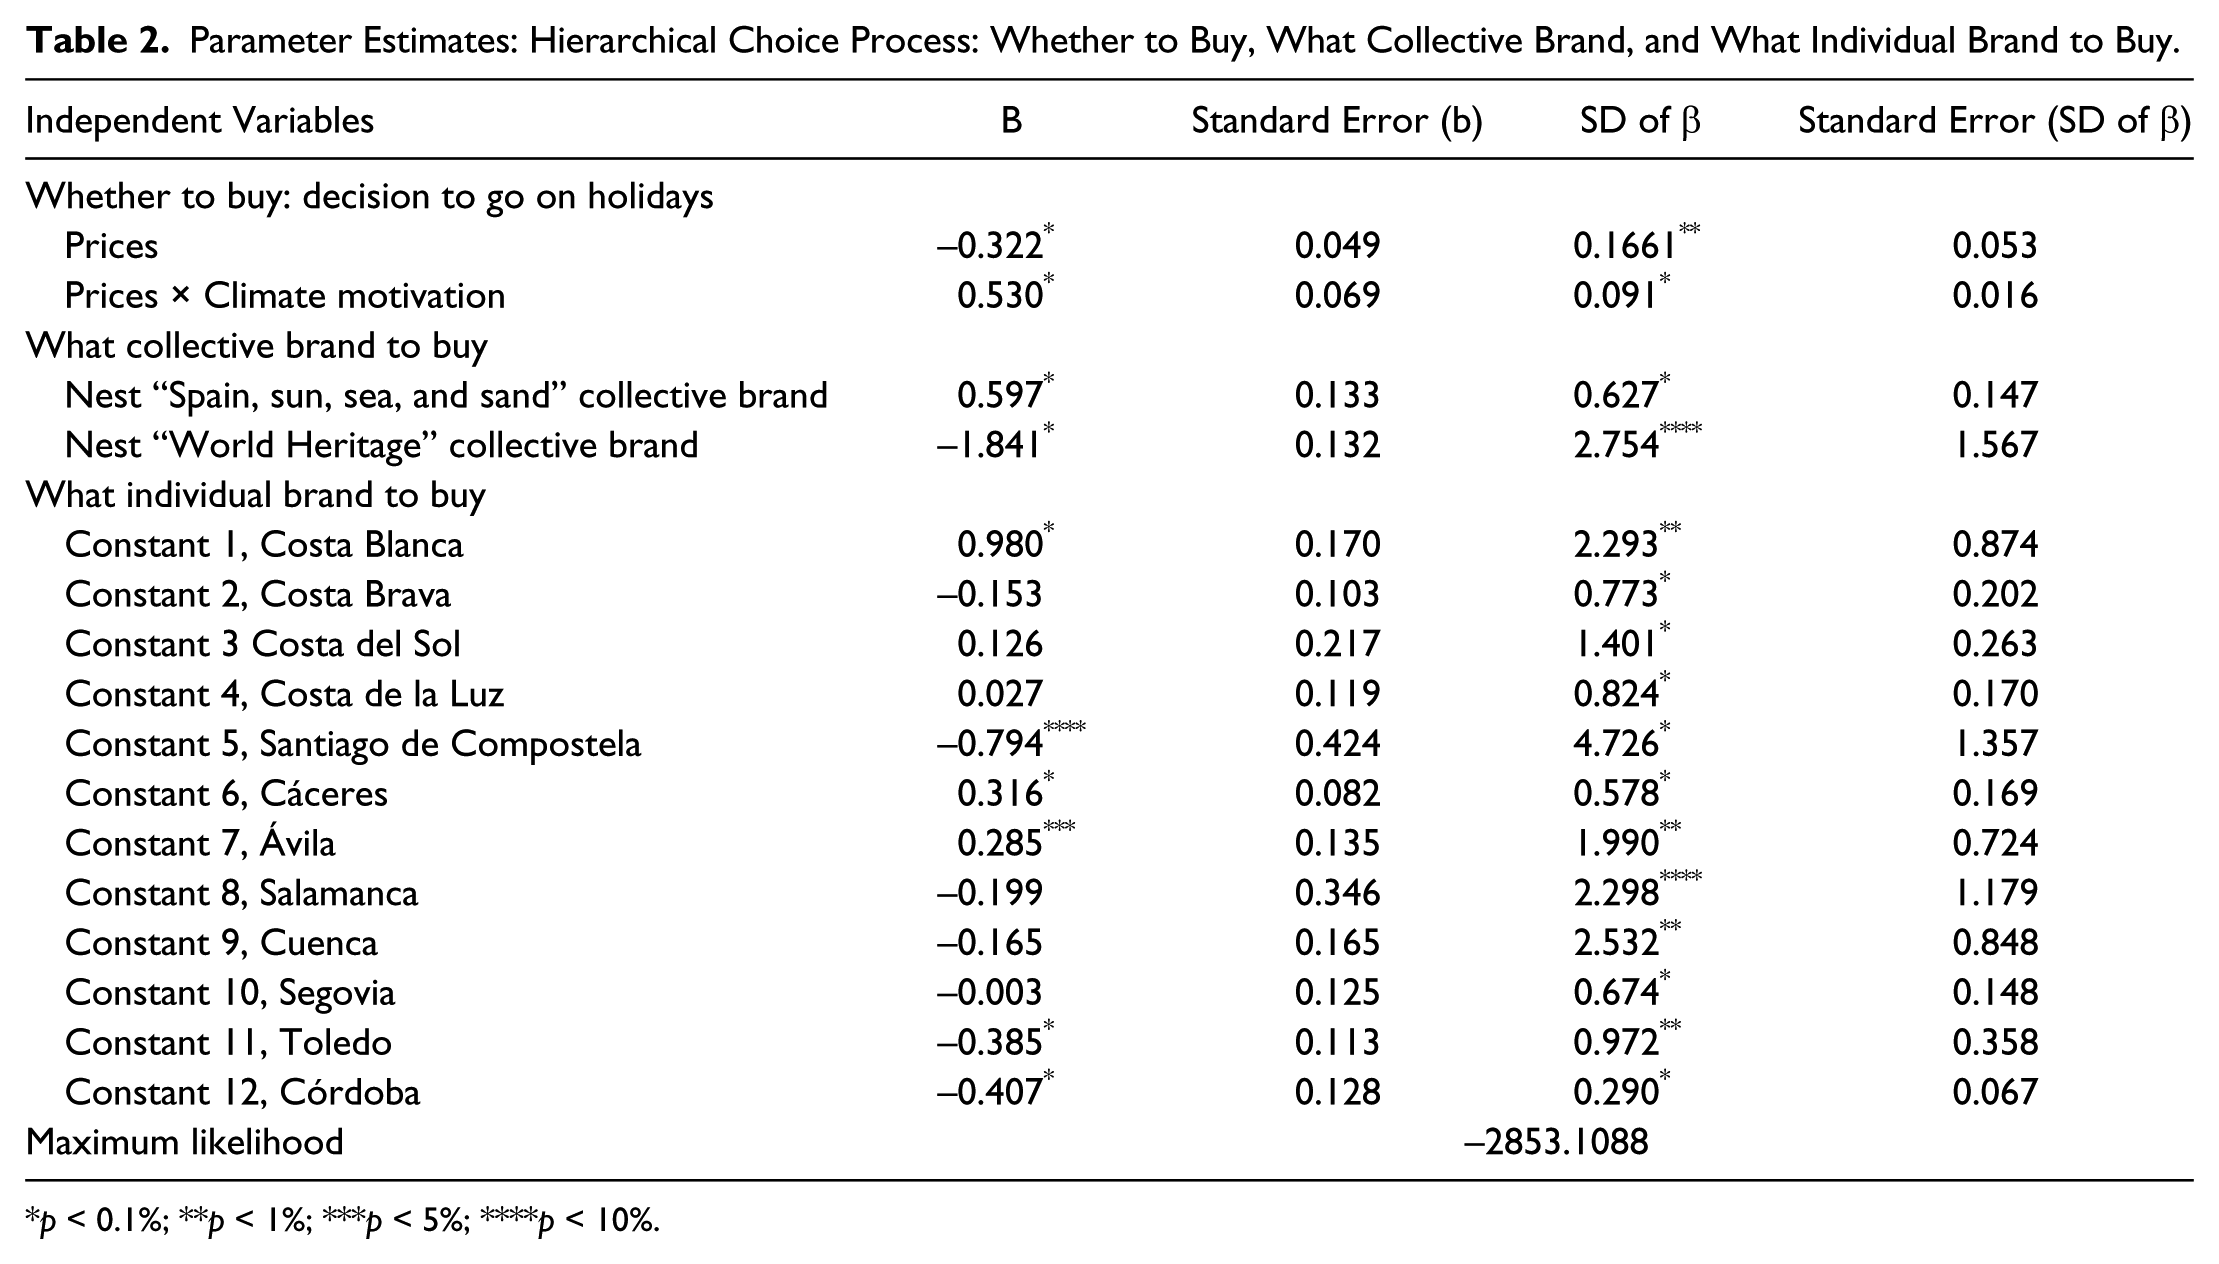
p < 0.1%; **p < 1%; ***p < 5%; ****p < 10%.
In the first stage of the choice process (“whether to buy”: decision to go on holiday), price shows a significant and negative parameter. This suggests that tourists tend not to go on holidays with higher prices; in line with Smith (1995). Therefore, price is a dissuasive element. Standard deviation of the coefficient of price is significant, which indicates that its effect is not homogeneous for all individuals. For the interaction price × search for climate, the estimation of the interactive coefficient presents a positive sign, significant at the 0.001 level, which implies that an individual motivated by climate as an important attribute of a holiday is prepared to accept higher prices or, in other words, the negative effect of prices is lower when an individual is searching for climate as an important attribute of their holidays. The interactions price × search for tranquility and price × visiting friend and relatives also show positive and significant results in line with the expectations explained before. For the sake of space, we do not portray the estimates of the models including them, but they are available from the authors on request.
Regarding the nest parameters, a positive coefficient is associated with the Sun, Sea, and Sand collective brand and a negative coefficient with the World Heritage collective brand. As they represent the attractiveness of the nest, their values show the collective brand attractiveness derived from the contribution of the individual brands contained in each nest. These different signs might be explained by individual interests and the level of maturity of each collective brand. As for individual interests, it is important to note that the most sought type of tourism in Spain is beach holidays, which in turn, is in line with the aforementioned motivations of climate and tranquility. As climate and relaxation are the main motivations for holidays (Familitur Reports 1999–2009), beach destinations are generally linked to this interest. Concerning the maturity argument, note that the maturity of the World Heritage collective brand is by no means that of the Sun, Sea, and Sand collective and individual brands: coastal brands were promoted in the sixties while the promotion of World Heritage cities collective and individual brands started in the midnineties. The different degree of maturity affects the manner in which tourists behave, as they do not know what they are going to find with World Heritage brands (at least, to lesser extent) as compared to coastal brands, because the former are not as popular (more than half of Spanish tourists [about 60%] travel to beach destinations (Familitur Reports 1999–2009)).
This pattern is also manifested through the individual brand parameters. Costa Blanca shows a positive utility with respect to the reference alternative “not going on holiday” and the other three brands (Costa Brava, Costa del Sol, and Costa de la Luz) remain neutral (none of them are negative). Regarding the World Heritage destinations, two out of eight (Cáceres and Ávila) present significant and positive utilities, three (Salamanca, Cuenca, and Segovia) are neutral, and three show negative parameters (Santiago, Toledo, and Córdoba). Note that the parameter of standard deviation SD(β) is significant in all of the variables, showing the existence of heterogeneity.
Finally, we estimate the specific contribution of each individual brand to the collective brand utility by regressing each destination collective brand utility on every individual destination brand utility for each individual, that is, the Sun, Sea, and Sand collective brand over Costa Blanca, Costa Brava, Costa del Sol, and Costa de la Luz; and the World Heritage collective brand over Santiago de Compostela, Cáceres, Ávila, Salamanca, Cuenca, Segovia, Toledo, and Córdoba (see Table 3).
Individual Brand Contribution to Collective Brand (Standard Deviation in Parenthesis).
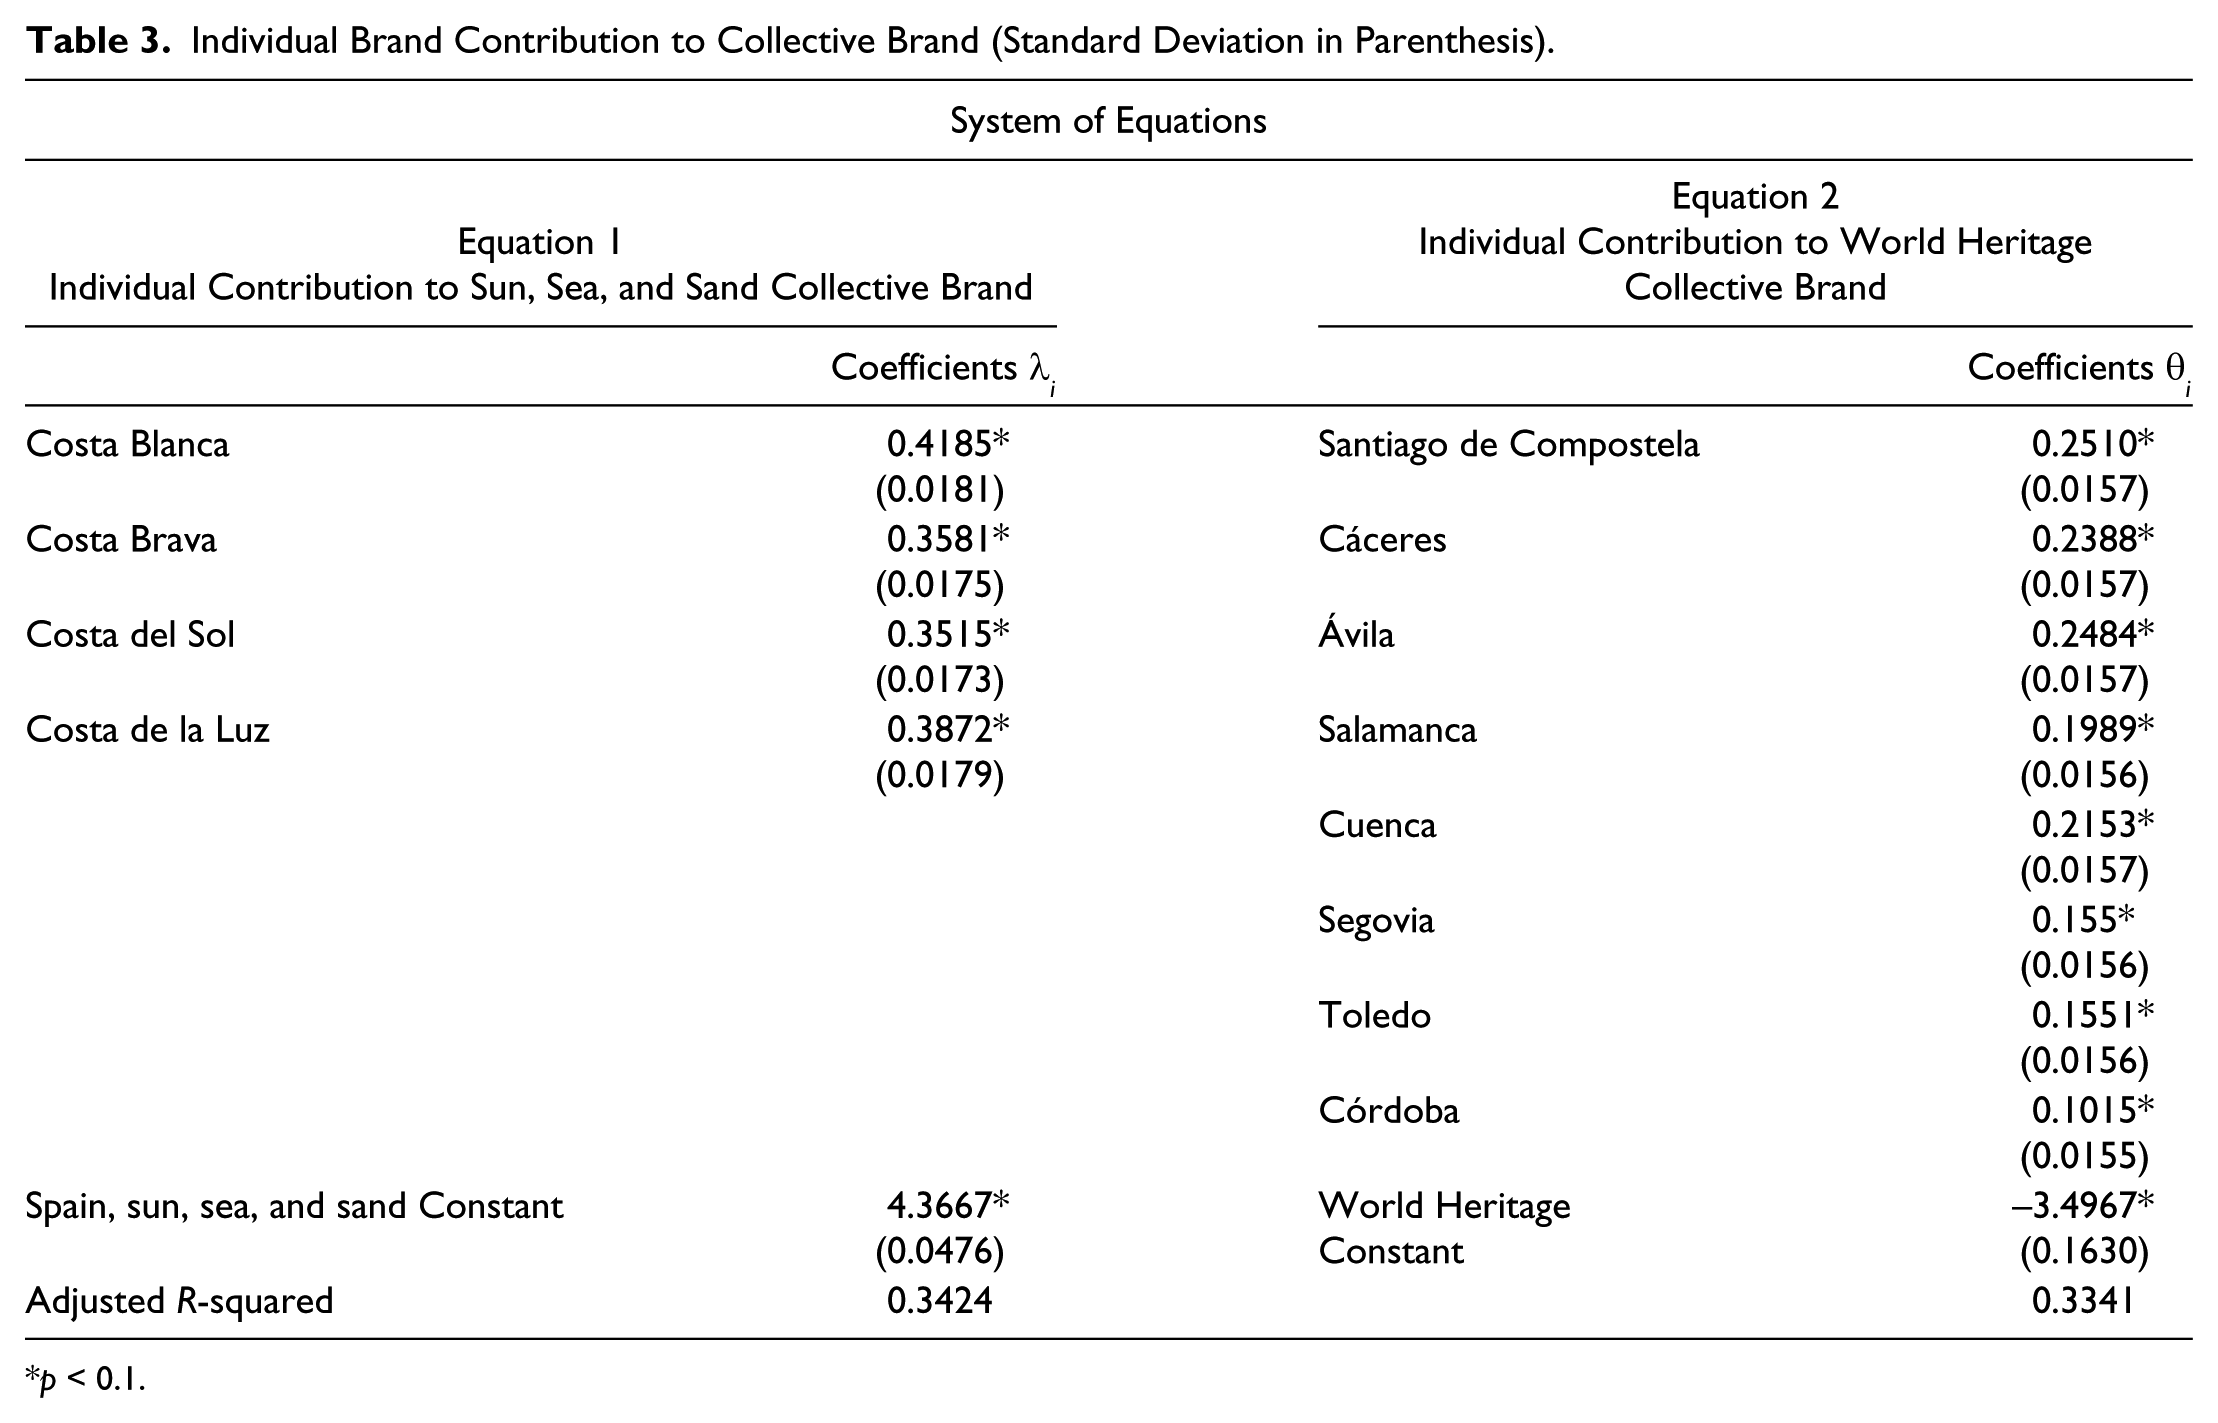
p < 0.1.
Equation (1) shows positive significant coefficients for every individual destination under the Sun, Sea, and Sand collective brand, explaining 34.24% of variation. Furthermore, Costa Blanca contributes the most to this collective brand, followed by Costa de la Luz, Costa Brava, and Costa del Sol. Equation (2) depicts positive significant coefficients for all the destinations under the World Heritage collective brand, with an ability to explain 33.41% of variation. We observe that the ordered contributions are Santiago de Compostela, Ávila, Cáceres, Cuenca, Salamanca, Toledo, Segovia, and Córdoba.
In order to identify potential free-riding behaviors, we can make comparisons between each individual brand’s contribution to its collective brand and the average contribution within this collective brand. This allows the analyst to see which individual brand contributes above or below average (see Table 4). For example, we observe that in the Sun, Sea, and Sand collective brand, every individual brand is around the average contribution (0.3788) except for Costa Blanca, which has a higher value. Although the analysis and the reasons for the position occupied by each brand is beyond the purpose of this article, anecdotally one might consider that the most renowned Spanish beach holiday destination, that is, Benidorm, is located in Costa Blanca.
Differences in Contributions.
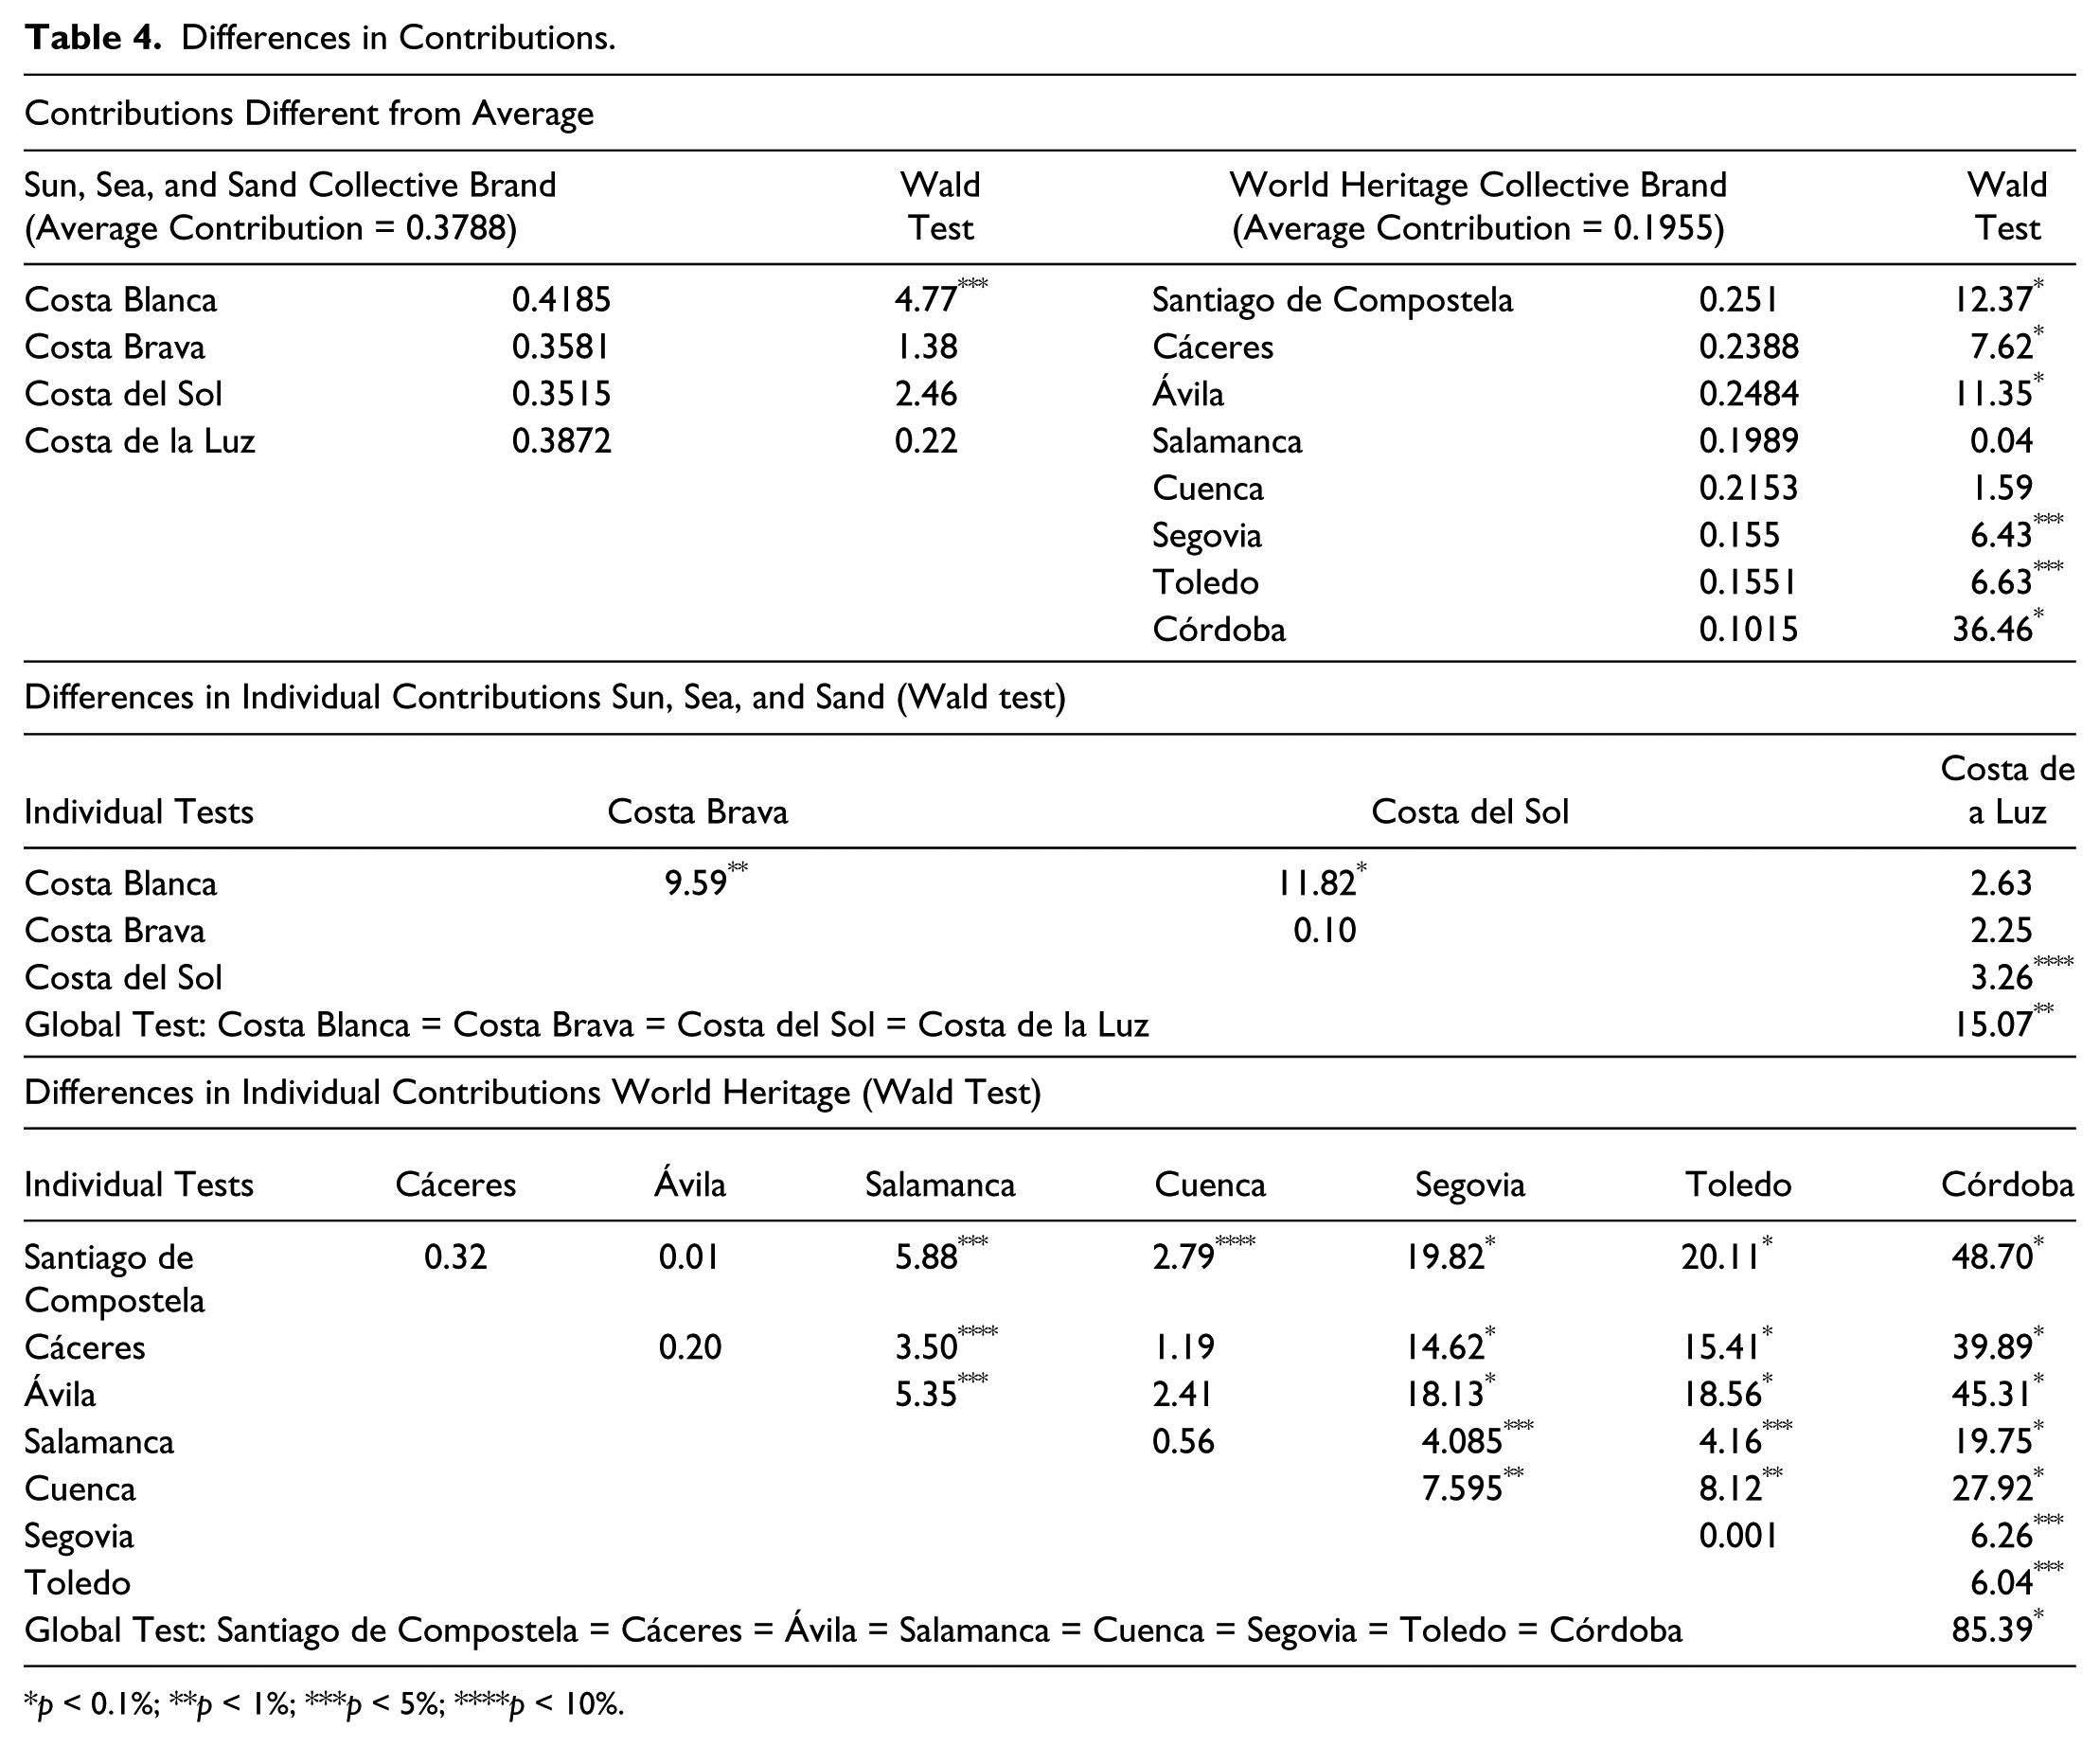
p < 0.1%; **p < 1%; ***p < 5%; ****p < 10%.
Note that we have used the average contribution in this example, but the researcher’s criterion might change according to the circumstances of each situation analysis. The middle and bottom sections in Table 4 show differences in contributions among individual brands within their collective brand so that the analyst can establish a ranking and reach a more refined analysis. Note that as global tests confirm that the contributions of individual brands are significantly different within each collective brand, individual tests permit detection of significant differences among individual brands in a collective brand, thereby allowing for ranking.
Conclusions
Free-riding behaviors exist in tourism and they should be analyzed from a general perspective; while the firms operating in a destination might have incentives to free ride, the destinations themselves might also free ride if we consider collective brands that include different individual destinations. In this line, we have assessed the incremental effect of individual brands to their collective brands through various stages of a hierarchical choice process followed by the tourist (whether to buy, what collective brand to buy, and what individual brand to buy). The empirical analysis carried out on the sample reaches the following conclusions:
The joint modelization reveals the nested and nonindependent character of the tourist decisions of whether to buy and what to buy (both collective and individual brands) and also reveals a multistage nature of the decision-making process, on account of the fact that tourists would first structure various brands into a multilevel hierarchy. The structure that best represents the tourist decision sequence is that with a first stage in which tourists decide whether to buy (whether or not to go on holiday); a second stage in which those who decide to buy (go on holiday) choose between the Sun, Sea, and Sand and World Heritage collective brands and a third stage that decides a individual brand of the previously selected collective brand. The fact that the hierarchical has proven to be superior represents an important theoretical implication: according to the results, people tend to use a hierarchical decision process. Therefore, if the analyst wants to mimic as much as possible the process people follow to make decisions, more than one stage should be considered as it reflects more accurately how the information is processed in their mind. In terms of the estimation of the idiosyncratic utility of each collective and individual brand for each tourist and the posterior regression of the former on the latter, we have been able to evaluate the contribution of each individual brand to the collective brand it belongs to; and in this way we have revealed the importance of the problem of free riding, whose implications for managers and policy makers are as follows:
Managers of collective brands (e.g., policy makers of geographical areas) can not only know the differentiated value of different collective brands competing in a market (sun, sea, and sand destinations vs. World Heritage sites, for example) but also, according to the contribution of the individual brand to the collective brand, they can find out if there is a free-riding problem within a collective brand.
These managers of collective brands must ensure that the individual brands comply with minimum quality standards as opposed to being free-riders. The fact that the contributions can be measured and, in turn the degree of free riding (if any) can be estimated, allows decision makers to establish some courses of action, such as rewarding the loyal contributors, setting some penalties for the free riders, or simply providing information on the current situation.
The technique employed is based on individual tourist measures, which are especially important to tourism marketing where, according to Sirakaya and Woodside (2005), decision behavior is the structure on which any marketing strategy must hang. Note that our analysis revolves around the fact that the meaning of a brand is first individually determined according to people’s perceptions; it means that these perceptions will have an influence on the way they will socialize and place their ideas about the brand into social discourse (which is especially relevant these days because of their social media interactions [Casaló, Flavián, and Guinalíu 2012]). Therefore, this method might help brand managers recognize what individuals think of their destination.
In line with the previous implication, the fact that we base the analysis on perceptions might give extra value to the proposal as we estimate the contributions of individual brands to their collective brands by observing people’s choices, so that we focus on the decisions they have really made and not on what they have said. Many times the perceptions are the internal dimensions that guide people’s actions. Accordingly, as the transfer of quality perceptions between the individual brands and their collective brand is a central issue in the context of collective brands, we build the method following this idea, which is in line with Erdem’s (1998) suggestion of assessing the impact of collective branding strategies on consumer choice behavior through the process by which consumers draw inferences about these transferences and perceptions.
We have shown how the results found in this application are used to detect different patterns of contributions by observing the above/below average contributions as well as the differences among the contributions of individual brands to a collective brand, allowing for rankings within each collective brand. This provides a useful tool of positioning analysis as allows the manager of an individual destination to know how people see the destination and, what is more, how people regard the destination compared to the other competitors. Actually, the manager of the individual destination with an excellent position in people’s mind can even decide whether to continue with the collective brand strategy or whether to abandon it in favor of independent promotion of the individual brand.
The fact that the contributions can be quantified makes it possible for the decision maker of an individual destination to determine how higher or lower with respect to the others the destination stays and, more importantly, if there is a need to enhance the destination’s image (Gómez, García, and Molina 2013), some policies that encourage the firms located in it to improve their performance can be better justified; at the very least, they can be justified in a more objective way.
Derived from these quantified measures, it is possible to identify more readily potential misbehaviors. If the number of individual destinations is low, it is both difficult to avoid cooperation and easy to detect misconducts; however, when the number of destinations within a collective brand is high, it is easier for a free rider to hide. The fact that you can establish a ranking where the performance of each individual destination is depicted does not make it easy to conceal a free-riding behavior. This can be especially helpful for the development of interdestination ties and network connections between destinations (Ness et al. 2013).
Managers of individual destinations can also undertake measures against other destinations that are behaving as free riders. For example, the loyal contributors can put pressure directly on free-riding destinations, or to put pressure on the local and regional authorities and the government to persuade them to intervene against free riders.
To conclude, the extent to which the free rider phenomenon represents a problem in tourism is contingent on the region or the country, but it is something not to be override. As tourism policies should include measures to prevent individual destinations from free riding, and since every plan needs evaluation and control, the method presented in this article offers a device to carry out these tasks.
Among the limitations of this study are the following: First is its static character, as it is only based on cross-section data. Alternatively, collective brand value may be inferred from studying tourist switching patterns over time. Second, the field of study is Spain and it would be better if the results were reinforced by applications on other geographical areas in order to be able to generalize the conclusions.
For further research remains the analysis of the factors controlled by a destination decision makers that determine the tourist’s utility; in other words, knowing the utilities—individual by individual—we can observe the effect of specific marketing variables on these utilities. Therefore, we would be able to see the brand-related dimensions that can be manipulated by brand managers in order to have a positive influence on their brand reputation.
Footnotes
Declaration of Conflicting Interests
The authors declared no potential conflicts of interest with respect to the research, authorship, and/or publication of this article.
Funding
The authors received no financial support for the research, authorship, and/or publication of this article.