
Abstract
In this study, we quantify the link between climate variables, such as temperature, rainfall, humidity, number of tropical cyclones, and number of thunderstorms, and seasonal variation in the Hong Kong inbound tourism demand from mainland China, Taiwan, South Korea, and Japan using the average Euclidean distance (AED) statistics and tourism demand modeling approach. Seasonal variation is measured as the fluctuation in the number of tourists from one season to another. Based on the smallest AED value, results of this study showed that climate variables play a dominant role in shaping seasonal variation relative to season and country. The fluctuation of tourist numbers from one season to another is determined not only by climate variables (e.g., the temperature of Hong Kong vs. the temperature in the country of origin of the tourist) but also by economic factors, including price and income. The variation in the impact of relative temperature depends on the country of origin.
Keywords
Introduction
A strong link between spatial movements of people as tourists on the demand side and climate variables and variations on the supply side is commonly accepted. The existing interaction between these two sides is reciprocal. Places with favorable climate for a given product (summer and winter) and certain resources that would attract tourists may affect demand or arrivals. Kozak, Uysal, and Birkan (2008) stated that the key to the continued attraction of significant tourist numbers to a country is the careful coordination of marketing and planning of tourism supply resources, which include favorable climate and climatic elements. Seasonal variation is an important feature of tourism demand, and the factors that affect this feature are threefold: (1) climate variables, including temperature, humidity, and rainfall in different seasons; (2) institutional factors (Chinese New Year, Christmas, Easter, and Ramadan) and time-specific decisions (school vacation, industry vacation, tax years, accounting periods, and dividend and bonus payment dates); and (3) economic factors, such as tourist income, cost of living in the destination, cost of living in alternative destinations, and travel cost. Factors such as calendar events and time-specific decisions remain constant, and only climate variables and economic factors change and influence variation in seasonal tourism demand.
Climate and climate variables, which affect the choice of destination and the distribution pattern of tourists in different seasons, are greatly relevant to tourism stakeholders in both the private and public sectors. These variables affect not only the profitability of day-to-day operations but also the planning and design of tourism facilities to maintain destination competitiveness in the future. Therefore, the link between climate variables and seasonal variation needs to be identified to develop and implement new policy measures. In doing so, better distribution patterns throughout the year are maintained to maximize the benefits of tourism and future investment. Previous studies (Amelung, Nicholls, and Viner 2007; Stern, de Hoedt, and Ernst 2000; Hamilton and Lau 2004; Martín and Belén 2005; Dwyer and Kim 2003) have recognized the link between climate variables and seasonal variation, but no attempt has been made to quantify this link. In recent years, some studies have attempted to measure the effects of climate on tourism flows (Lise and Tol 2002; Goh, Law, and Mok 2008; Hamilton, Maddision, and Tol 2005; Hamilton and Tol 2007; Berrittella et al. 2006; Taylor and Ortiz 2009; Goh 2012). Although these studies attempted to establish the link between climate variables and total tourism flow or tourism expenditure, they ignored the effects of climate variables on seasonal variation in tourism demand. Kulendran and Dwyer (2012) and Ridderstaat et al. (2014) applied a regression model to quantify the impact of climate variables on seasonal variation, but ignored the economic factors that influence the regression model. In this study, we investigate the link between the seasonal variations in Hong Kong inbound seasonal tourism demand and climate variables, economic factors, and institutional factors using the statistical modeling approach. Seasonal variation is the deviation from the annual mean, which is defined as the fluctuation of tourist numbers or tourism demand from one season to another. First, this study used the average Euclidean distance (AED) statistics (Kulendran and Dwyer 2010, 2012) to select the specific destination climate variable that could play a dominant role in shaping the characteristic of seasonal variation in inbound tourism demand in the four different seasons. Second, the tourism demand modeling approach was used to measure the impact of economic factors and climate variables, including climate variables in Hong Kong, temperature in the tourist’s country of origin, and temperature in Singapore (a substitute destination), on the seasonal variation of inbound tourism demand in Hong Kong. Finally, to predict the future changes in seasonal tourist demand, this study constructed the composite climate variable index (CCI).
To construct a CCI for each source market, this study considered climate variables, specifically the temperature of a tourist’s country of origin and that of the substitute destination (i.e., Singapore). By using a CCI, we can consider all climate variables and subsequently project accurate and necessary future changes in the fluctuation of tourist numbers in different seasons as a result of the changes in any climate variable. Accurate forecasts of future changes in seasonal variation are required by policy makers to formulate more informed decisions on tourism marketing, planning, and investment. In the past, information on climate variables in different seasons, which is supposedly necessary for the strategic planning of the tourism industry in Hong Kong, has been neglected in tourism forecasting. Past studies (Goh, Law, and Mok 2008; Matzarakis 2001a, 2001b; Mieczkowski 1985; Skinner and de Dear 2001) have attempted to construct a tourism climate index (TCI) to capture relevant weather information for specific tourist activities in a particular destination. Mieczkowski (1985) created a TCI based on the following subindices: (1) daytime comfort index (CID), which was measured by obtaining the maximum daily temperature (°C) and minimum daily relative humidity (%); (2) daily comfort index (CIA), which was measured by mean daily temperature (°C) and mean daily relative humidity (%); (3) precipitation (R, mm); (4) sunshine (S), which was measured by the daily sunshine duration (h); and (5) wind speed (W) (m/s or km/h). The TCI is weighted and computed as follows: TCI = 4CID + CIA + 2R + 2S + W, thereby indicating that more weight is given to CID followed by precipitation and sunshine. Moreover, Goh, Law, and Mok (2008) derived a climate index for Hong Kong based on the TCI by Mieczkowski (1985). When constructing TCIs, researchers subjectively assign weights to climate variables, which may change according to the corresponding tourist activity. The present study constructed the CCI by emphasizing on climate variables in relation to their importance as measured by correlation.
Weather is determined by a number of atmospheric measures, including temperature, rainfall, and humidity, whereas climate is the average weather pattern in a specific place for a certain number of years. Mean weather conditions tend to vary according to the season. Thus, we refer to these conditions as climate variation. Climate variation can be a push or pull factor in the destination choice. If the mean weather condition in a tourist’s country of origin at a particular season or time is more favorable than or similar to that in a destination country, then the tourist may want to stay in his own country (Hamilton and Tol 2007). Tourists may not only look at the climatic conditions in the destination country but may also compare these conditions with those in their countries of origin and in another country (an alternative tourist destination).
Tourism is a major sector in the Hong Kong economy and is a climate-dependent industry. In 2012, visitor arrivals to Hong Kong reached a total of 48,615,113, which accounted for an annual increase of 16.0%. Mainland China was the leading source of tourists to Hong Kong in 2012, accounting for the increase in arrivals from 2.36 million in 1997 to 34.91 million in 2012, or 71.8% of the total arrivals. Besides mainland China, the top four sources of tourists traveling to Hong Kong in 2012 were Taiwan, with 2.08 million tourists (4.3%); Japan, with 1.25 million (2.6%); South Korea, with 1.18 million (2.4%); and USA, with 1.07 million (2.2%) (Hong Kong Tourism Board 2013).
To attract tourists, Hong Kong provides information on the climatic conditions to tourists by using an advertisement with the following slogan: “What to do in Hong Kong in different seasons.” Hong Kong has a subtropical climate with the following seasons: spring (March to May), with average temperatures ranging from 17 °C to 26 °C; summer (June to August), with average temperatures ranging from 26 °C to 31 °C; autumn (September to November), with average temperatures ranging from 19 °C to 28 °C; and winter (December to February), with average temperatures ranging from 12 °C to 20 °C (Hong Kong Tourism Board 2013).
In recent years, the average temperature in each season in Hong Kong changes because of increased atmospheric concentrations of greenhouse gases and because of local urbanization, thereby resulting in “urban heat islands” where temperatures are higher than those in their rural surroundings. An urban heat island is created by a combination of factors, including surface changes from vegetation to concrete and Tarmac, reduced air ventilation because of the presence of buildings, anthropogenic heat production, and motor vehicle emissions (Climate Change Business Forum 2013). Distribution patterns of climate variation in different seasons are also changing globally, and such changes may be due to “global warming” (Amelung, Nicholls, and Viner 2007). These changes in the distribution patterns of climate variation are also observed in major tourist markets in Hong Kong and alternate destinations, specifically Singapore, thereby affecting the Hong Kong tourism industry.
Considering standard economic and climate variables in modeling seasonal variations has a number of advantages. First, climate variables that strongly influence seasonal variation can be identified. Second, the differences between the impact of climate variables and that of standard economic variables on seasonal variation in tourism demand can be determined. Therefore, via a tourism demand modeling approach, we quantify the impact of standard economic variables (tourist income, cost of living in Hong Kong and in substitute destinations, and cost of travel to Hong Kong) and climate variables, such as relative temperature (°C) compared with the country of origin, rainfall (mm), humidity (%), number of tropical cyclones, number of thunderstorms, and temperature (°C) of substitute destination (Singapore), on the seasonal variation in inbound tourism demand in Hong Kong. The tourists come from selected major source markets, namely, mainland China, Japan, Taiwan, and South Korea. This study does not consider the pollution index in Hong Kong because the focus of this study is only climate variables, and pollution index is highly correlated with the temperature in Hong Kong.
This article is structured as follows. The next section provides the method for obtaining the seasonal variation and the AED statistics to identify the link between climate variables and seasonal variation in different seasons. The third section discusses the impact of climate variables and economic variables using the tourism demand model. The fourth section constructs the CCI for each selected market and evaluates the forecasting performance. The final section provides the conclusion.
Seasonal Variations and AED Statistics
Seasonal variation in the time series of quarterly tourist arrivals is the repetitive and predictable deviation of tourist numbers above and below the annual mean, which is extracted using the STAMP (5.0) program (Harvey 1990). The time series of quarterly tourist arrivals to Hong Kong from the March quarter (Mq) 1997 to the December quarter (Dq) 2012 from the selected major markets, namely, mainland China, Japan, Taiwan, and South Korea, were obtained from visitor arrival statistics published by the Hong Kong Tourism Board. Figure 1 shows the extracted seasonal variation in quarterly tourist arrivals to Hong Kong from the selected major markets, and the seasonal variations in China and South Korea are increasing.
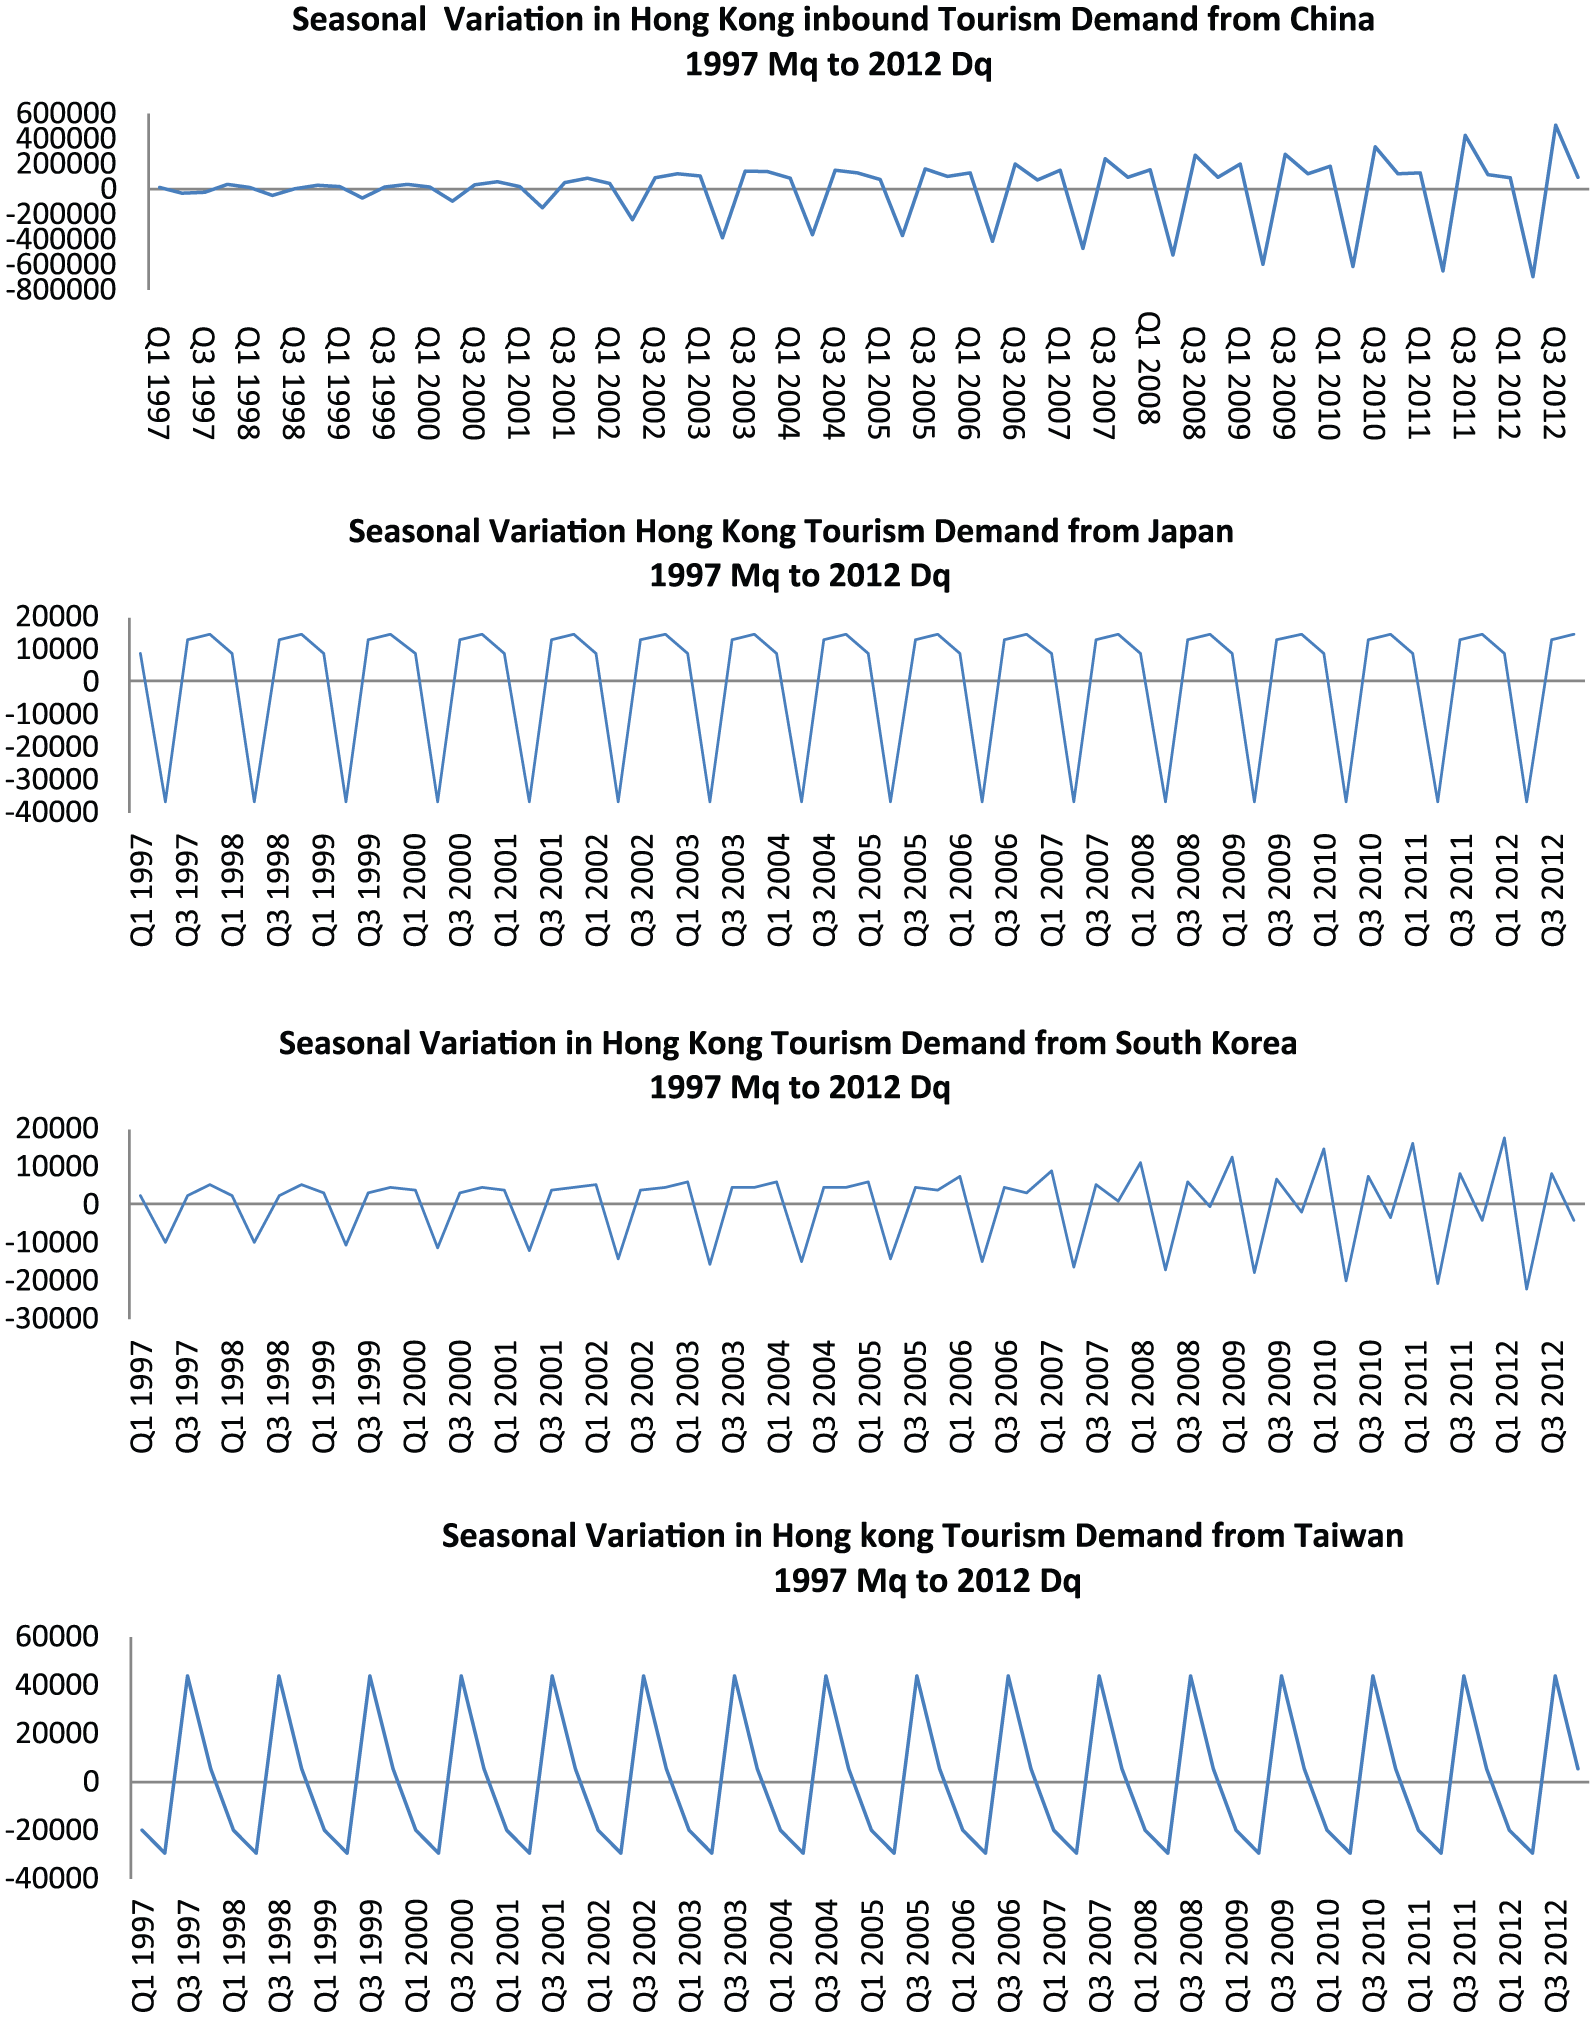
Plots of seasonal variation in Hong Kong inbound tourism demand from mainland China, Japan, South Korea, and Taiwan from 1997 Mq to 2012 Dq.
Table 1 shows the estimated average seasonal deviation of tourist numbers above or below the annual mean in different seasons for mainland China, Japan, Taiwan, and South Korea during the above-mentioned period. For all selected countries, the June quarter (Jq) has a negative seasonal deviation, whereas the September quarter (Sq) has a positive seasonal deviation. The estimated average seasonal deviation of the tourist number in Jq for mainland China is −356, which means that on average, the number of Jq tourist arrivals from mainland China would decrease below the annual mean by 356,000. The Sq average seasonal deviation for mainland China is 181, which explains that on average, the Sq tourist arrivals would increase above the annual mean by 181,000. This variation in tourist numbers below and above the annual mean from Jq to Sq may be explained by the climatic condition in Hong Kong. Jq is the hot summer in Hong Kong exacerbated by high humidity level, whereas Sq is autumn characterized by plenty of sunshine, pleasant breezes, and comfortable temperature. Thus, Sq comprises the best months of the year to visit Hong Kong.
Extracted Seasonal Deviation Mean Values of Tourist Flow to Hong Kong by Origin and by Seasons (Tourists in ‘000s’) Sample Period 1997 to 2012.
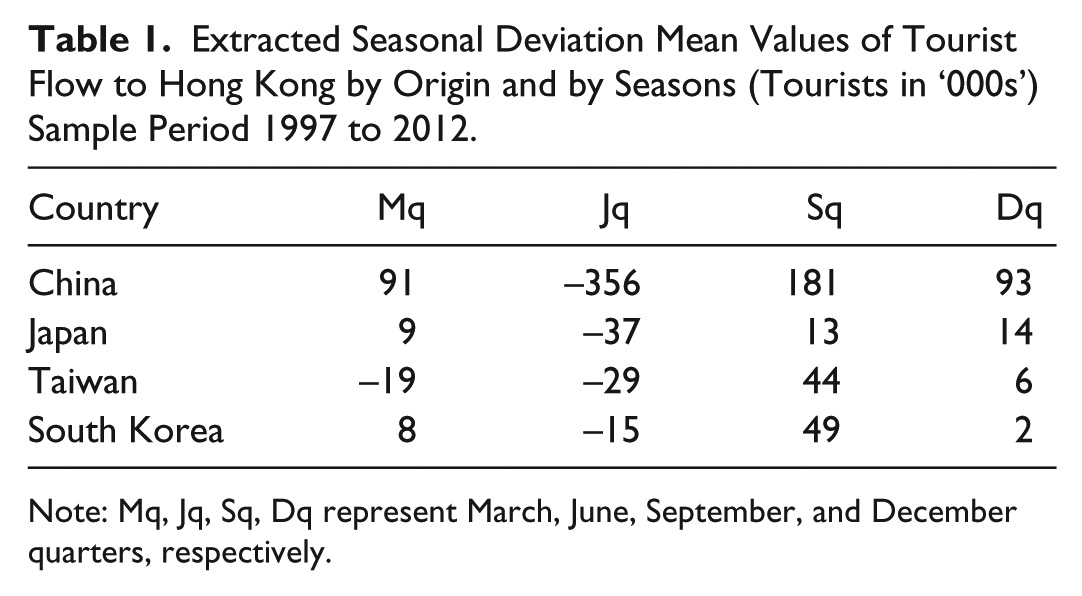
Note: Mq, Jq, Sq, Dq represent March, June, September, and December quarters, respectively.
The above-mentioned analysis indicates a link between seasonal variations in the inbound tourism demand in Hong Kong and climate variables, but identifying the specific climate variable in Hong Kong that has the greatest effect on seasonal variation in each quarter may be useful in developing policy and marketing strategies for the Hong Kong tourism industry. For this purpose, the data of key climate variables in Hong Kong, such as temperature (°C), humidity (%), rainfall (mm), number of thunderstorms, and number of tropical cyclones, were obtained from the Hong Kong Observatory and the Hong Kong Special Administrative Region from 1997 Mq to 2012 Dq.
Figure 2 shows the selected Hong Kong climate variables: average temperature (°C), rainfall (mm), humidity (%), and number of thunderstorms.
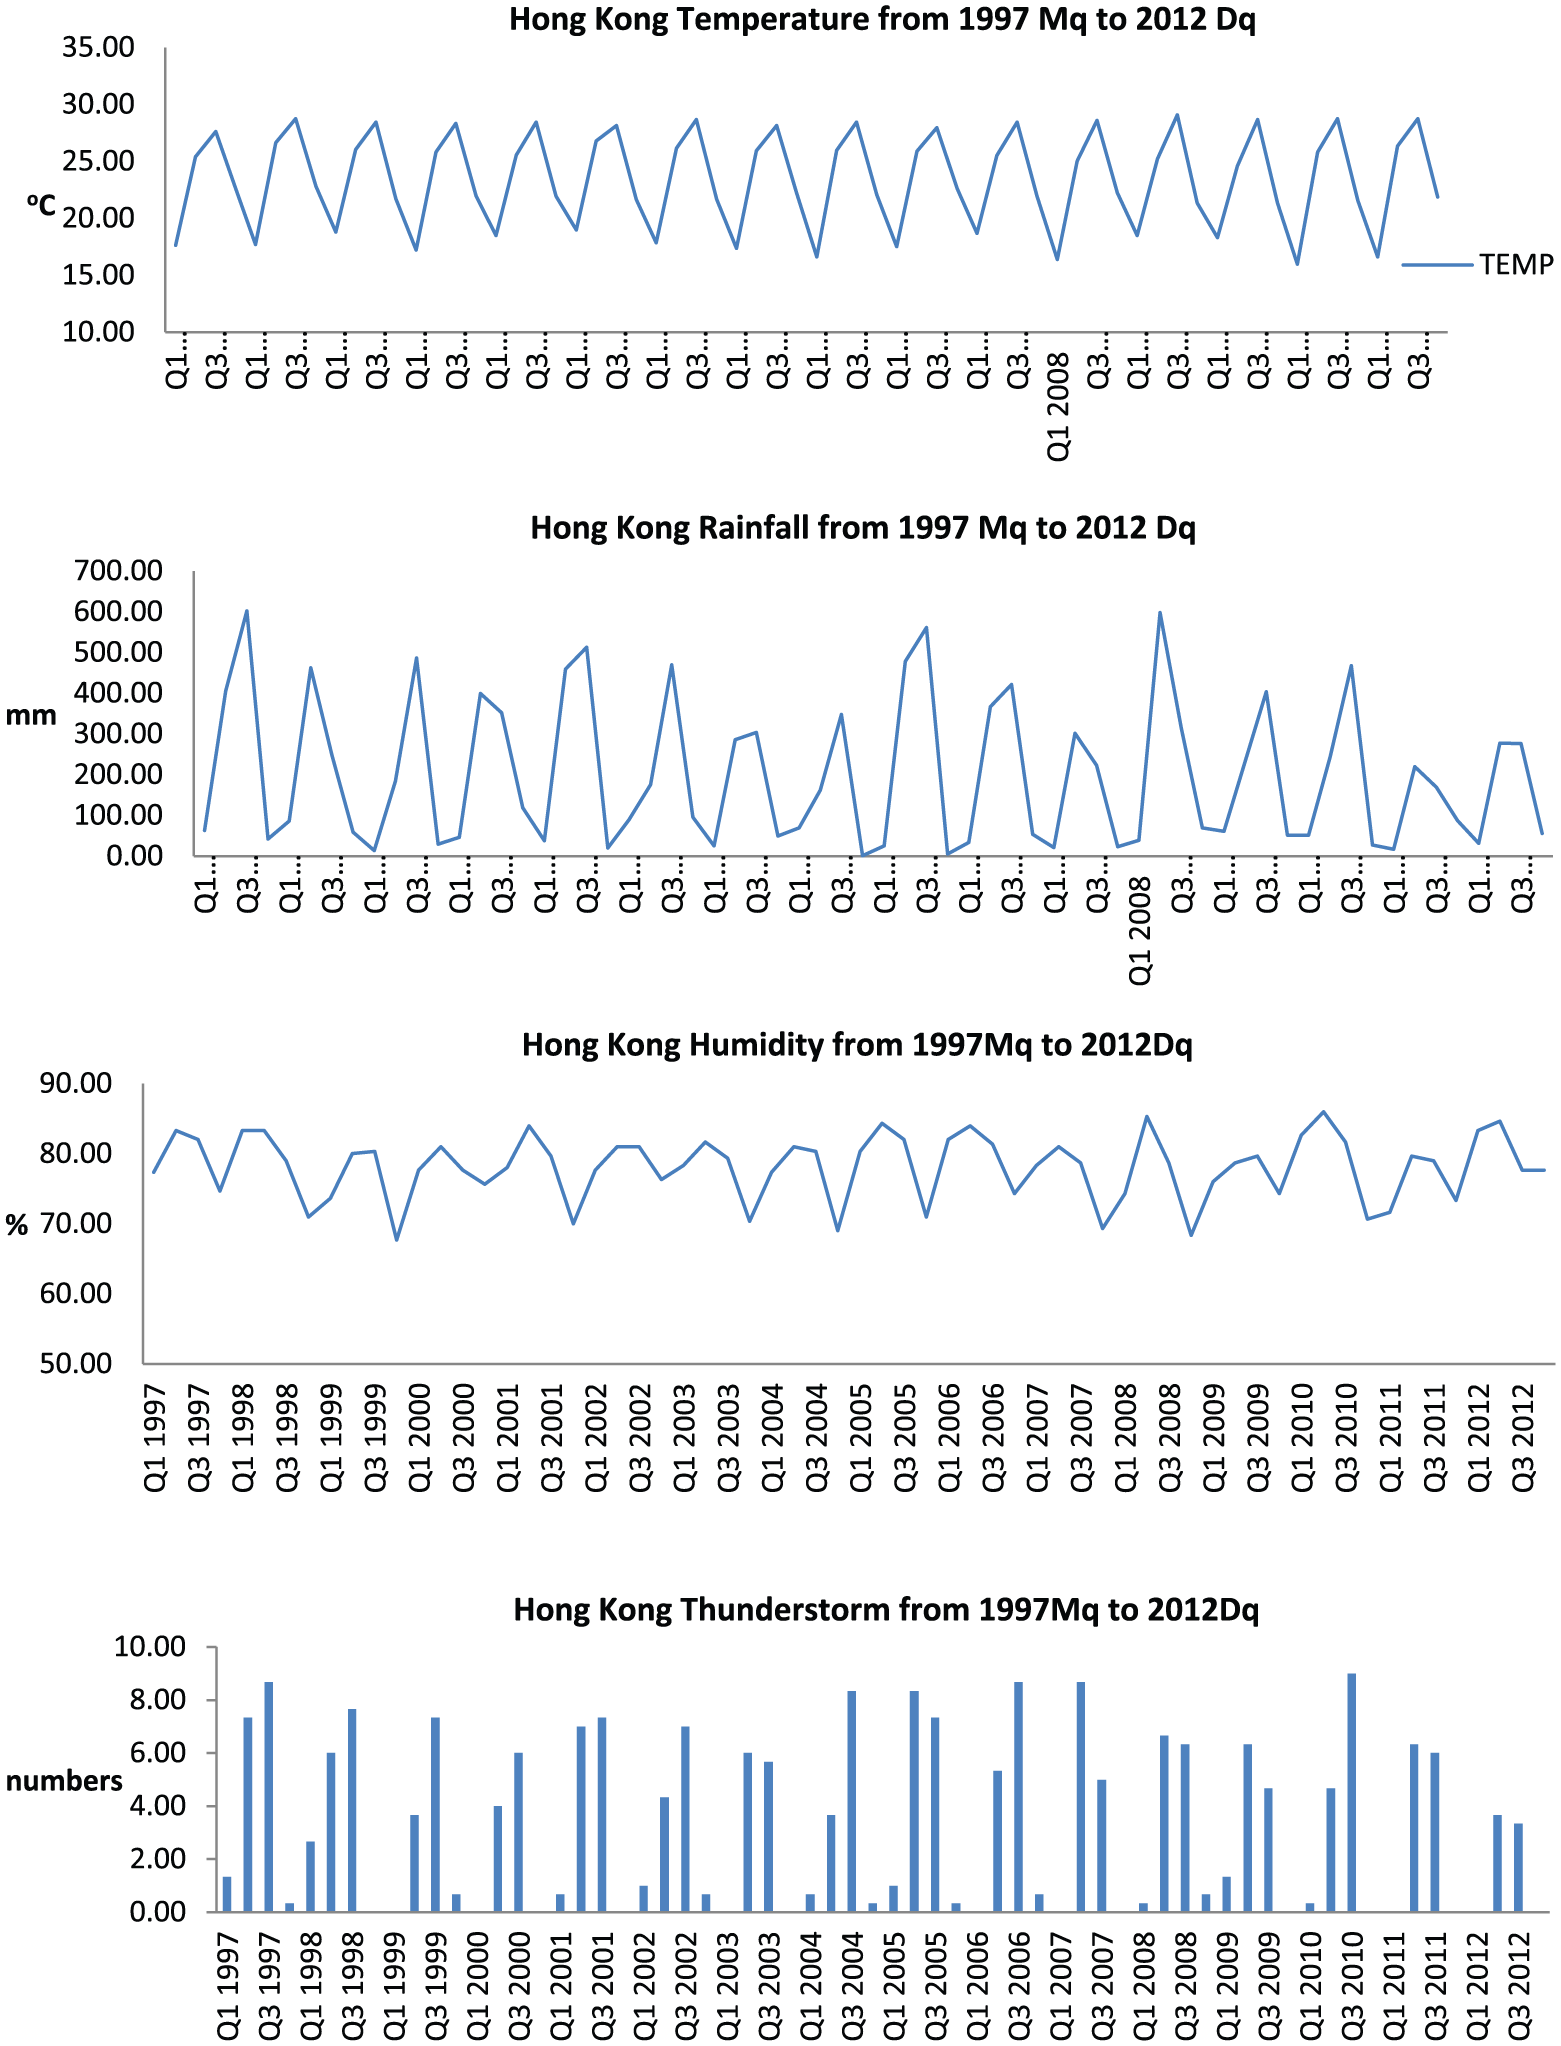
Plots of selected Hong Kong climate variables, temperature, rainfall, humidity, and thunderstorm from 1997 Mq to 2012 Dq.
To identify the climate variable that plays a dominant role in shaping the characteristics of seasonal variations in the inbound tourism demand in Hong Kong during the four different seasons (Mq, Jq, Sq, and Dq), this study considered AED statistics (Kulendran and Dwyer 2012). AED measures the deviation between standardized climate variable variation and standardized seasonal variation in different seasons. The smallest deviation between the two alternative values provides the following useful information: (1) a high pattern of similarity between climate variable variation and seasonal variation and (2) the dominant role of a climate variable in shaping the characteristics of seasonal variation. Temperature is measured in degrees Celsius, humidity is expressed as a percentage, rainfall is measured in millimeters (mm), the number of thunderstorms is counted, and seasonal variation is measured by the number of tourist arrivals. To apply the AED approach and to measure the deviations between seasonal variation and temperature, humidity, rainfall, and the number of thunderstorms in each quarter, both seasonal variation and climate variables need to be standardized. The AED statistics excludes the number of tropical cyclones because they occur in Sq and are not regular events. The deviation between standardized climate variables and seasonal variation for each season can be measured by

where i = 1, 2, 3, … n and AED (seasonal, climate) is the deviation between the standardized seasonal variation and the standardized climate variation. As AED decreases or approaches zero, a climate variable plays an increasingly dominant role in shaping the characteristics of seasonal variation. The calculated AED statistics between the standardized climate variables and the standardized seasonal variation by country of origin for the different seasons are shown in Figure 3.
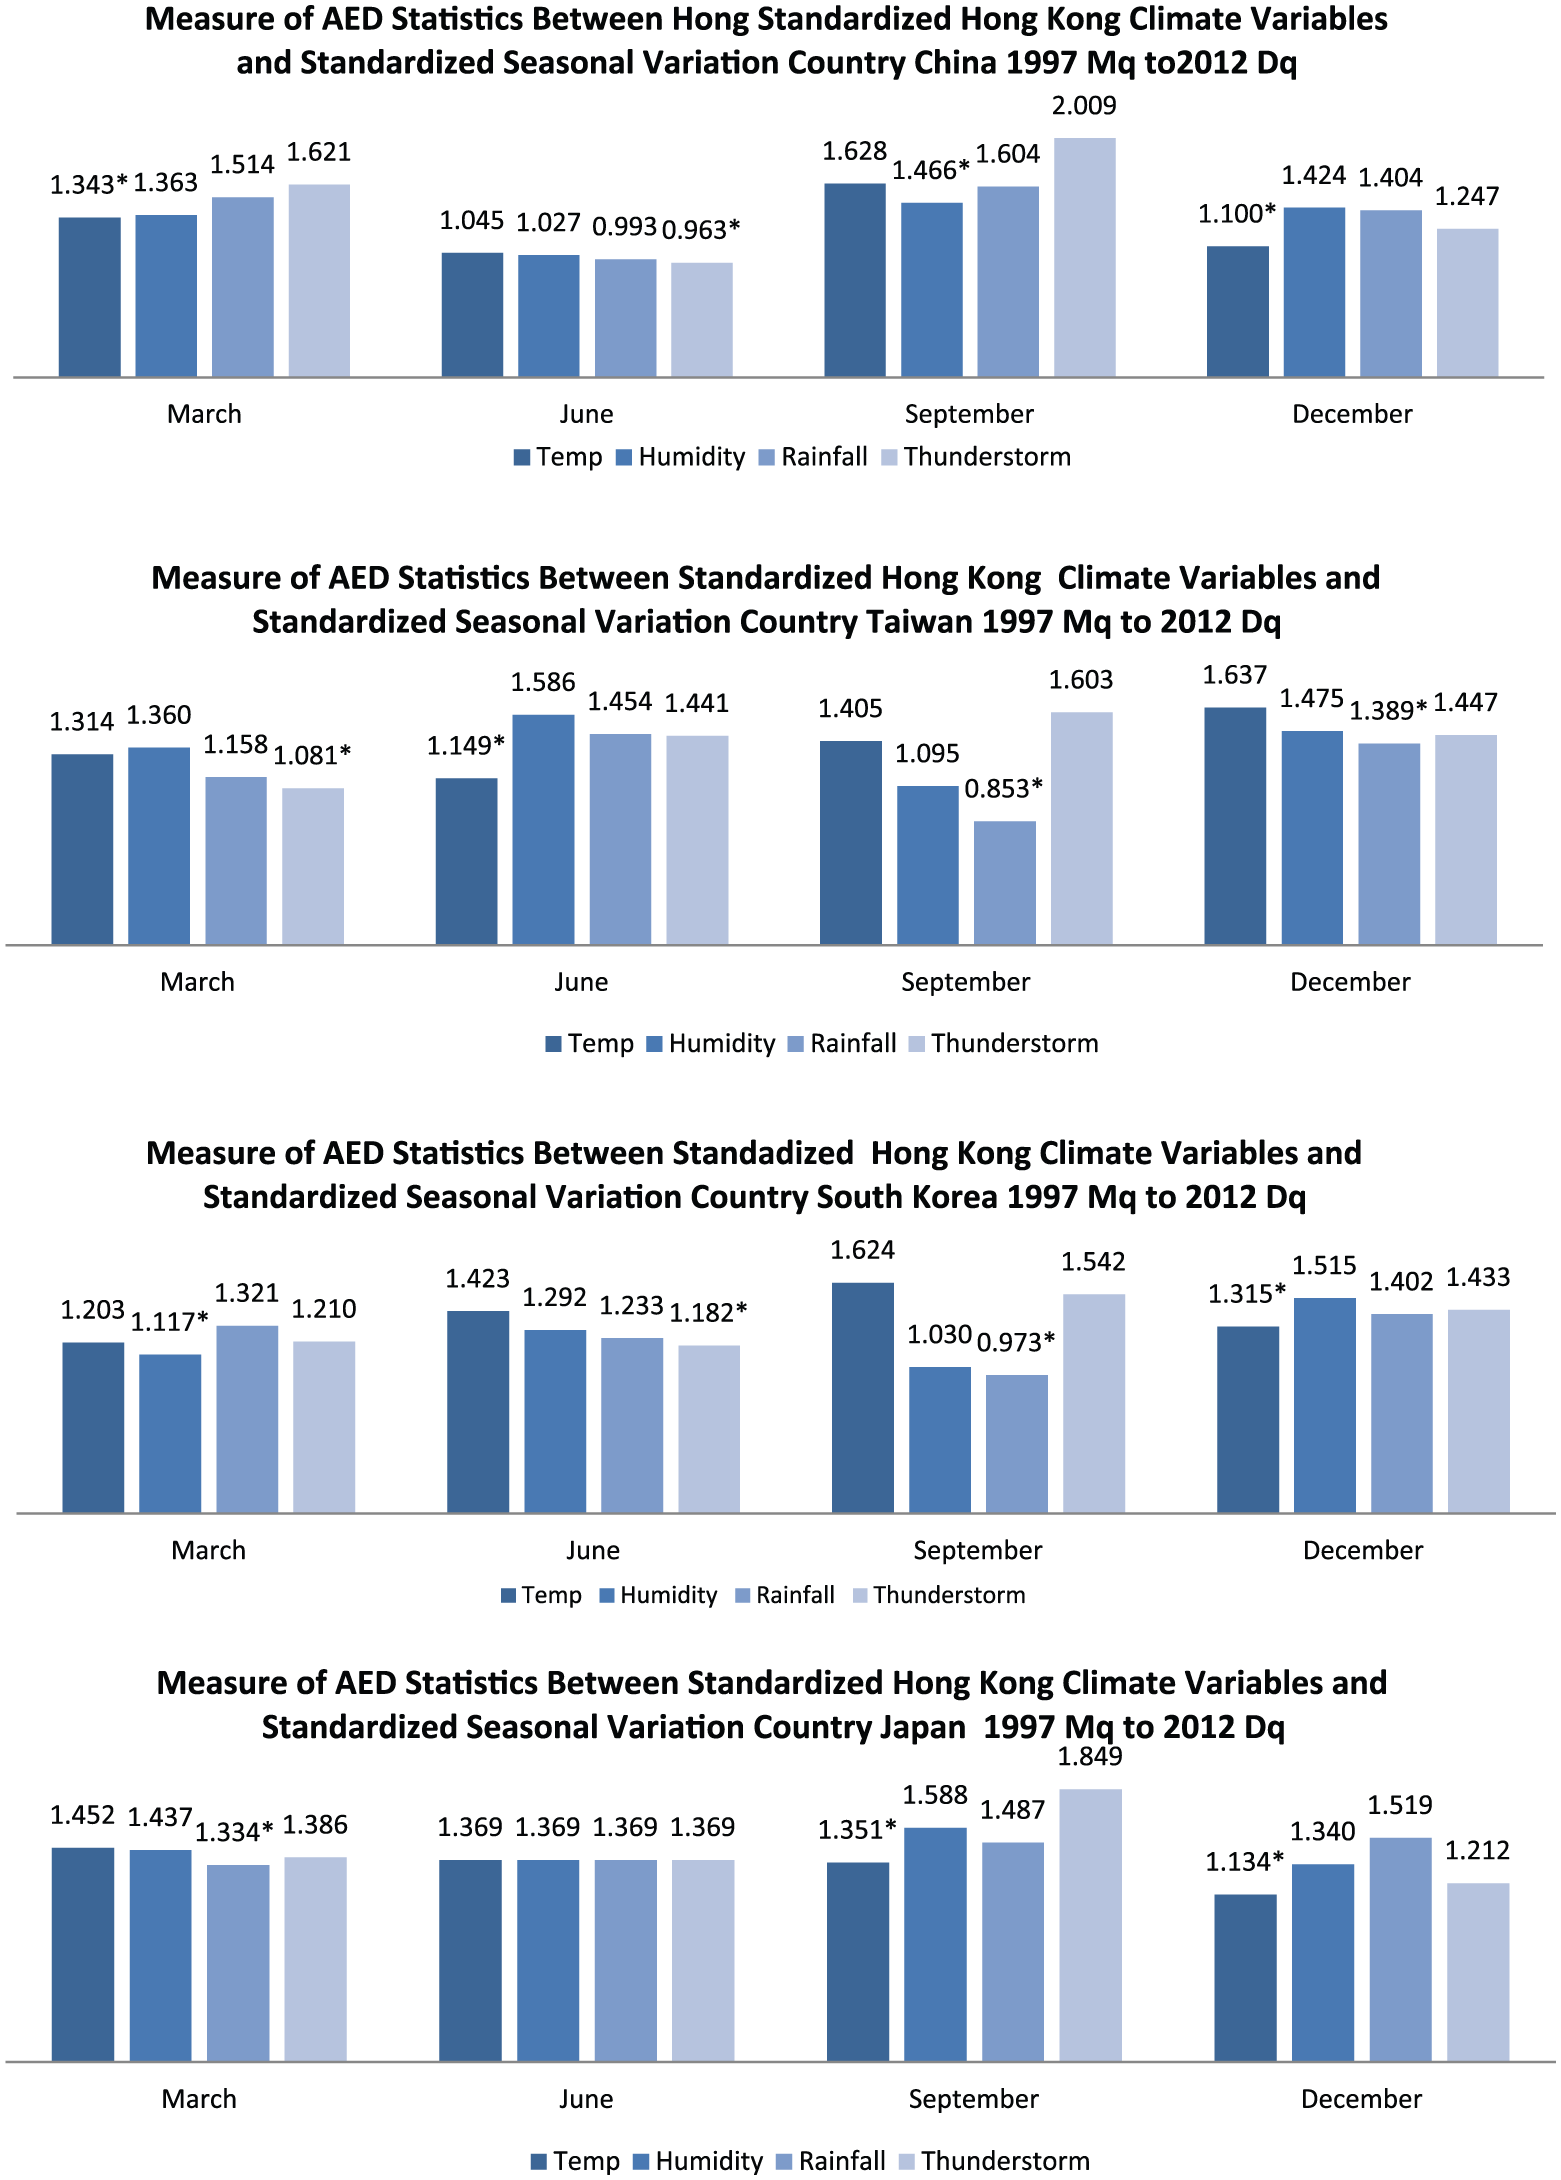
Measure of AED statistics between standardized Hong Kong climate variables and standardized seasonal variation by country of origin (sample period 1997 Mq to 2012 Dq).
Figure 3 shows that the climate variable in Hong Kong with the smallest AED value for each quarter (denoted with an asterisk) has the strongest association with seasonal variation in the inbound tourism demand in Hong Kong. Based on the smallest AED statistics, seasonal variation in tourist arrivals from mainland China is strongly associated with the temperature in Mq, number of thunderstorms in Jq, humidity in Sq, and temperature in Dq. Seasonal variation in tourist arrivals from Taiwan has the strongest association with the number of thunderstorms in Mq, temperature in Jq, rainfall in Sq, and rainfall in Dq. In addition, seasonal variation in tourist arrivals from South Korea has the strongest association with the humidity in Mq, number of thunderstorms in Jq, rainfall in Sq, and temperature in Dq. Lastly, seasonal variation in tourist arrivals from Japan has the strongest association with the rainfall in Mq, temperature in Sq, and temperature in Dq. In Jq, all climate variables in Hong Kong have the same value with the AED statistics in Japan, thereby resulting in an inconclusive decision on the selection of a climate variable for the quarter.
Table 2 shows the selected climate variables that have strong associations with seasonal variation in different quarters for mainland China, Taiwan, South Korea, and Japan.
Selected Hong Kong Climate Variables That Have the Strongest Association with Seasonal Variation Based on the Smallest AED Statistics by Season and Country.
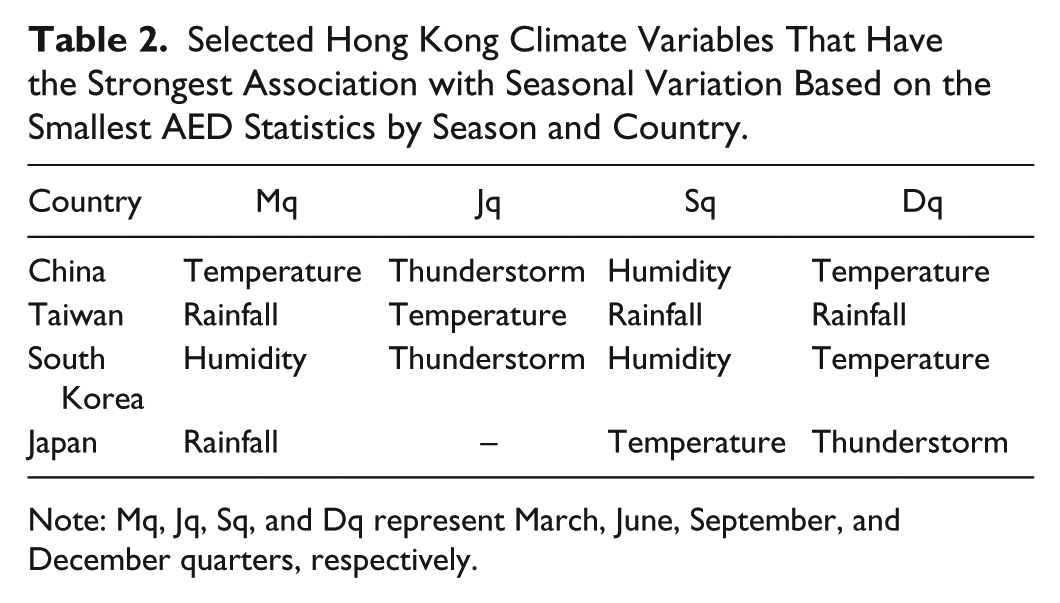
Note: Mq, Jq, Sq, and Dq represent March, June, September, and December quarters, respectively.
As shown in Table 2, the climate variable that plays a dominant role in shaping the seasonal variation in the inbound tourism demand in Hong Kong varies according to season and country of origin.
Impact of Climate Variable Variation on Seasonal Variation
A tourism demand model based on the consumer theory of choice is developed to measure the impact of climate variables and economic factors on seasonal variation. Consumer theory stipulates that the demand for a given commodity depends on consumer income, prices, and any other variables specific to the commodity in question. In this context, seasonal variation in the seasonal inbound demand in Hong Kong can be determined by the following factors: economic factors (e.g., tourist income, cost of living in Hong Kong, cost of living in substitute destinations for Hong Kong, cost of travel to Hong Kong, and cost of travel to substitute destinations for Hong Kong), climate variables in Hong Kong, temperature in the country of origin, temperature in Singapore (a substitute destination), and institutional factors (e.g., Chinese New Year, Christmas, Easter, and special events). Other noneconomic factors, such as the cultural and political attributes of a destination, can also cause seasonal variation, but they were not included in the model because some of these factors were difficult to quantify.
Seasonal variation = f(economic factors, climate variables, institutional factors, noneconomic factors)
Table 3 shows the description of economic factors, climate variables, institutional factors, and noneconomic factors that are considered in the tourism demand model.
Variable Description for Tourism Demand Model.
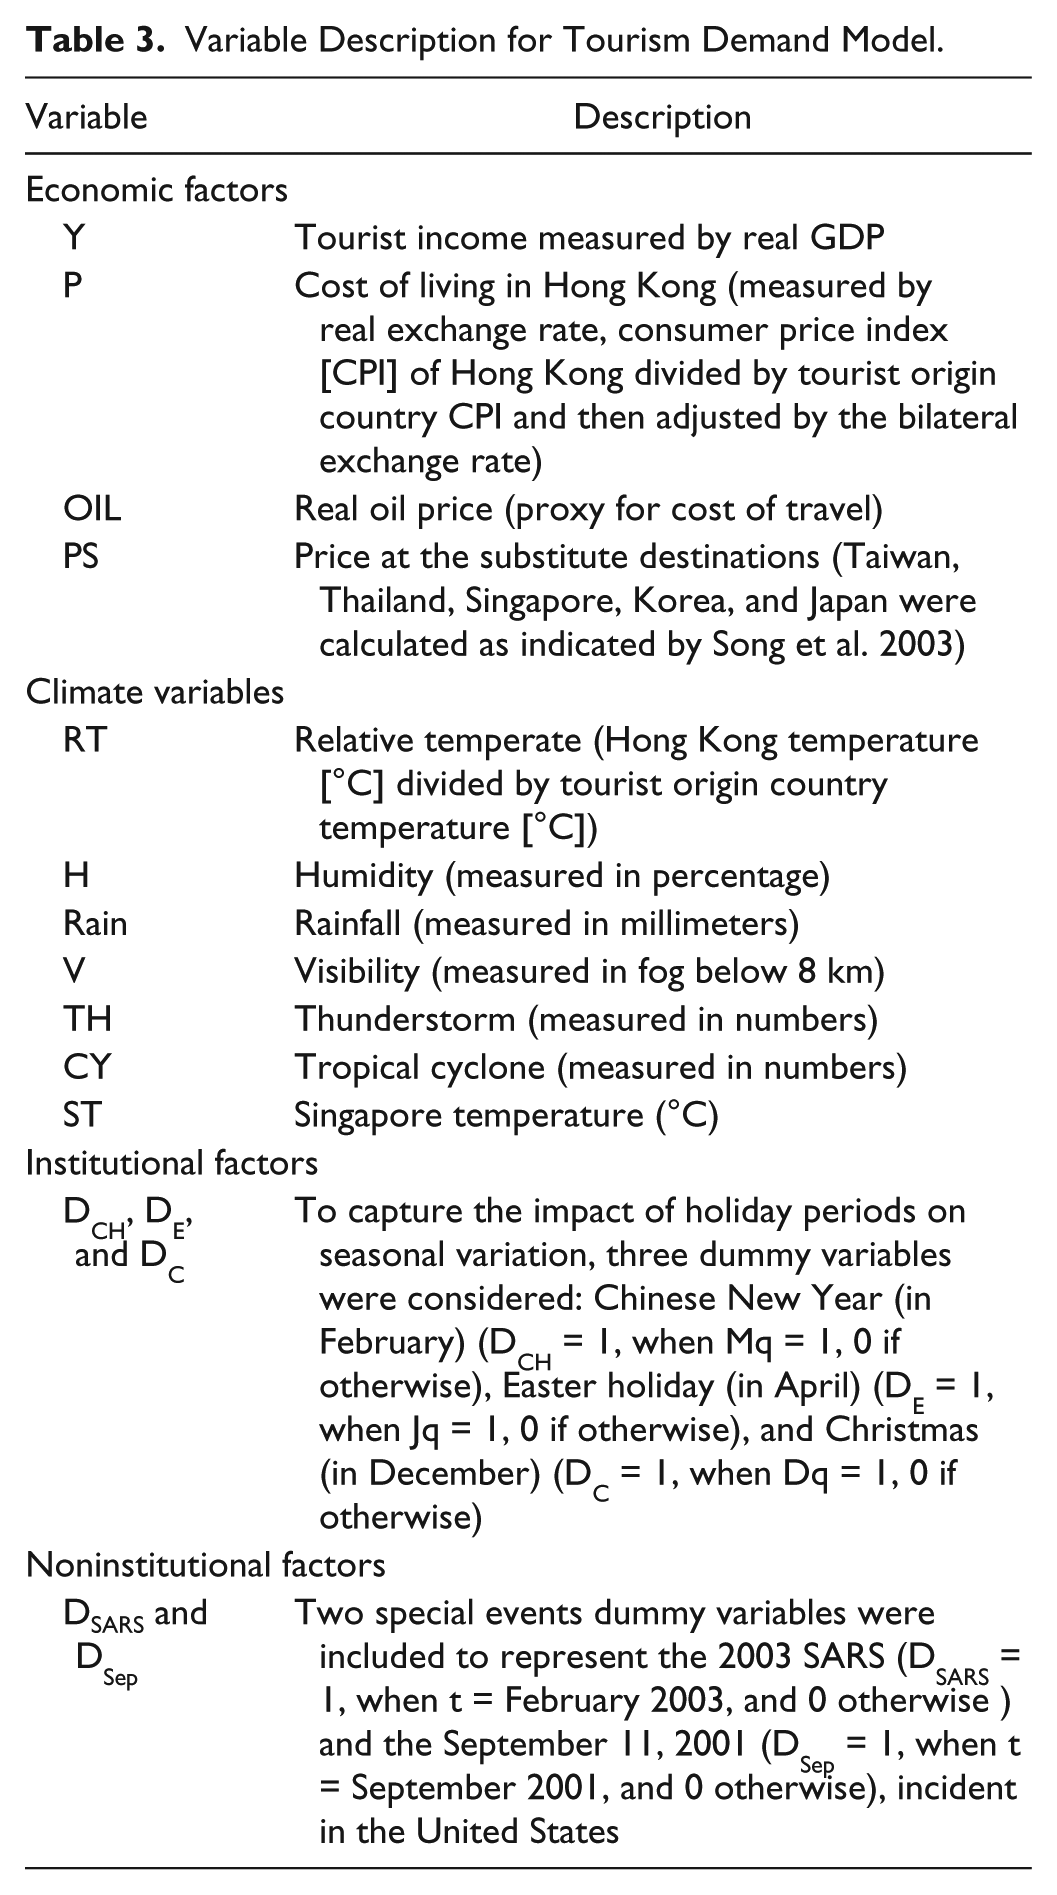
In calculating the temperature in China, the temperatures in three cities, namely, Guangzhou, Shanghai, and Beijing, which are markets for Hong Kong, were adjusted in relation to their market shares of 60%, 21%, and 19%, respectively (Hong Kong Tourism Board 2013). The climate data of these three major Chinese cities were collected from the National Bureau of Statistics of China. The temperature in Taiwan was obtained from the Taiwan Central Weather Bureau, and that in South Korea was obtained from the National Aeronautics and Space Administration in Seoul. The temperature in Japan was obtained from the Tokyo station of the Japan Meteorological Agency. Lastly, the temperature in Singapore (ST) was collected from the Singapore National Environment Agency. Humidity (H) was measured in percentage, rainfall (Rain) was measured in millimeters, visibility (V) was measured in fog below 8 km, and the number of thunderstorms (TH) and number of tropical cyclones (CY) were counted.
The following tourism demand dynamic model was estimated to measure the impact of economic factors, climate variables, and institutional factors on seasonal variation. The dynamic model captures the time adjustment process of the tourism demand by assuming that the current tourism demand is being influenced not only by the current values but also by their past values (Zhang, Kulendran, and Song 2010).
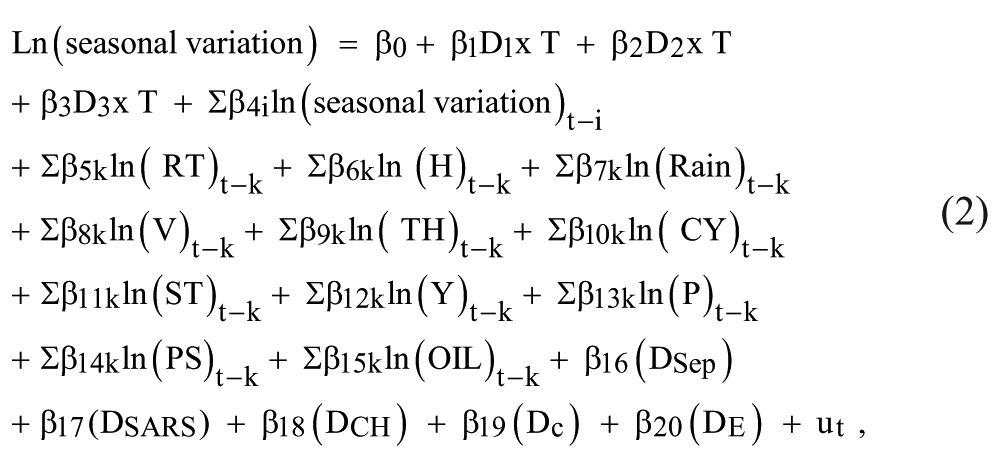
where i = 1, 2, 3, 4 indicates past values and k = 0, 1, 2, 3, 4 includes current and past values. ln is the logarithmic transformation, and ut is the error term. The dependent variable Ln(seasonal variation) is measured by the number of tourist arrivals, whereas ln(seasonal variation)t-i is the lagged dependent variable that includes the effect of word of mouth.
To capture the impact of holiday periods on seasonal variation, three dummy variables were considered: Chinese New Year (in February) (Dch = 1, when Mq = 1, 0 if otherwise), Easter holiday (in April) (DE = 1, when Jq = 1, 0 if otherwise), and Christmas (in December) (DC = 1, when Dq = 1, 0 if otherwise). In addition, two special events dummy variables were included to represent the 2003 SARS (DSARS = 1, when t = 2003(2), 0 if otherwise) and the September 11, 2001 (DSep = 1, when t = 2001(3), 0 if otherwise), incident in the United States.
D1, D2, and D3 are seasonal dummy variables. D1 = 1, if Jq = 1; D1 = 0, if otherwise. D2 = 0, if Sq = 1; and D2 = 0, if otherwise. D3 = 1, if Dq = 1; D3 = 0, if otherwise. T is the time trend. Figure 2 shows that the seasonal variation increases by quarter. To model an increasing seasonal variation, D1, D2, and D3 are multiplied by a trend component (s1 = D1 × T; s2 = D2 × T; and s3 = D3 × T, where T is the trend, D1 = Jq, D2 = Sq, and D3 = Dq). This method of modeling the increasing seasonal variation is based on the study by Frances and Koehler (1998).
The ordinary least squares method cannot be used to estimate the regression model of seasonal variation because the error term (ut) of the regression model does not have a constant error variance and exhibits the heteroskedasticity problem. As discussed by Maddala (2001, 468), the test for autoregressive conditional heteroskedasticity (ARCH) effect in ut confirmed the ARCH effect. Therefore, to model seasonal variation, the current study considered the ARCH modeling approach (Engle 1982). This ARCH model was estimated using the Eviews 7.0 program.
In Table 4, the correlation matrix of the climate variables in Hong Kong shows that temperature, rainfall, number of thunderstorms, and number of cyclones are highly correlated. To avoid the multi-collinearity problem, the study only considered temperature and humidity variables in the model estimation.
Hong Kong Climate Variables Correlation Matrix. Sample Period: 1997 Mq to 2012 Dq.
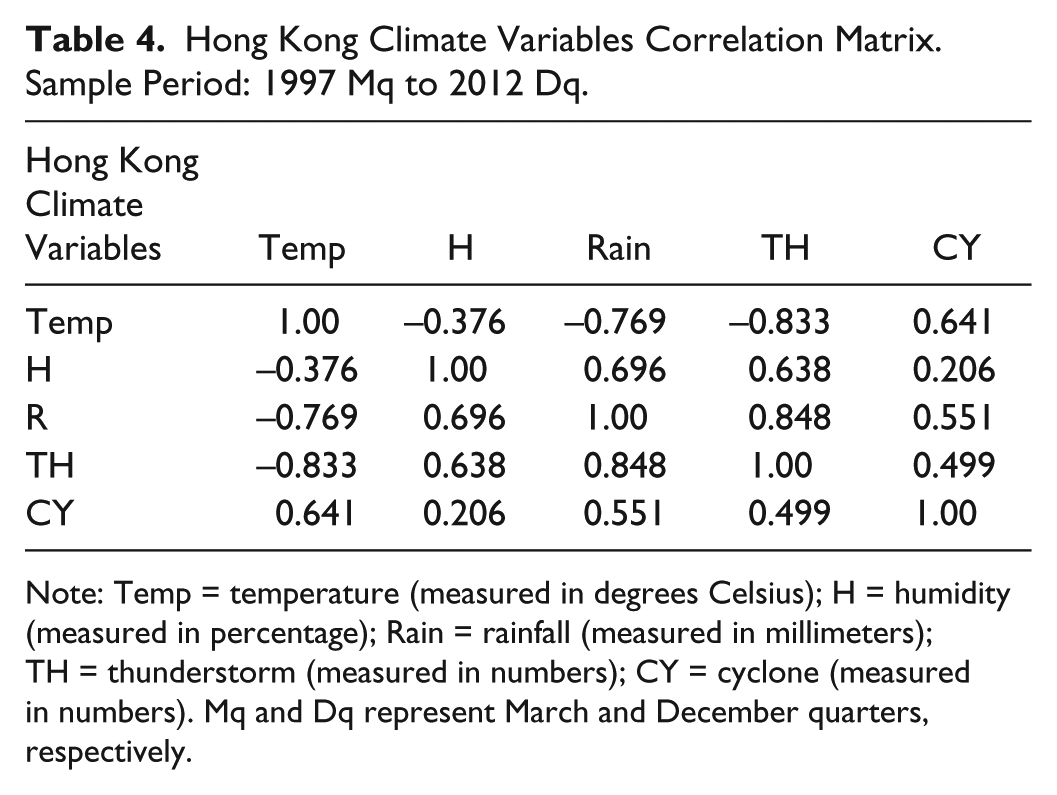
Note: Temp = temperature (measured in degrees Celsius); H = humidity (measured in percentage); Rain = rainfall (measured in millimeters); TH = thunderstorm (measured in numbers); CY = cyclone (measured in numbers). Mq and Dq represent March and December quarters, respectively.
The ARCH model was estimated using data from 1997 Mq to 2012 Dq by implementing the method of maximum likelihood using Eviews (7.0). The estimated econometric models for China, South Korea, Taiwan, and Japan are presented in Table 5. The effect of institutional factors, such as Christmas, Easter, and Chinese New Year on seasonal variation is not significant for China, South Korea, Taiwan, and Japan. The key findings and the significant determinates are reported in Table 6.
Estimated Seasonal Variation Model from the Sample Period 1997 Mq to 2012 Dq.
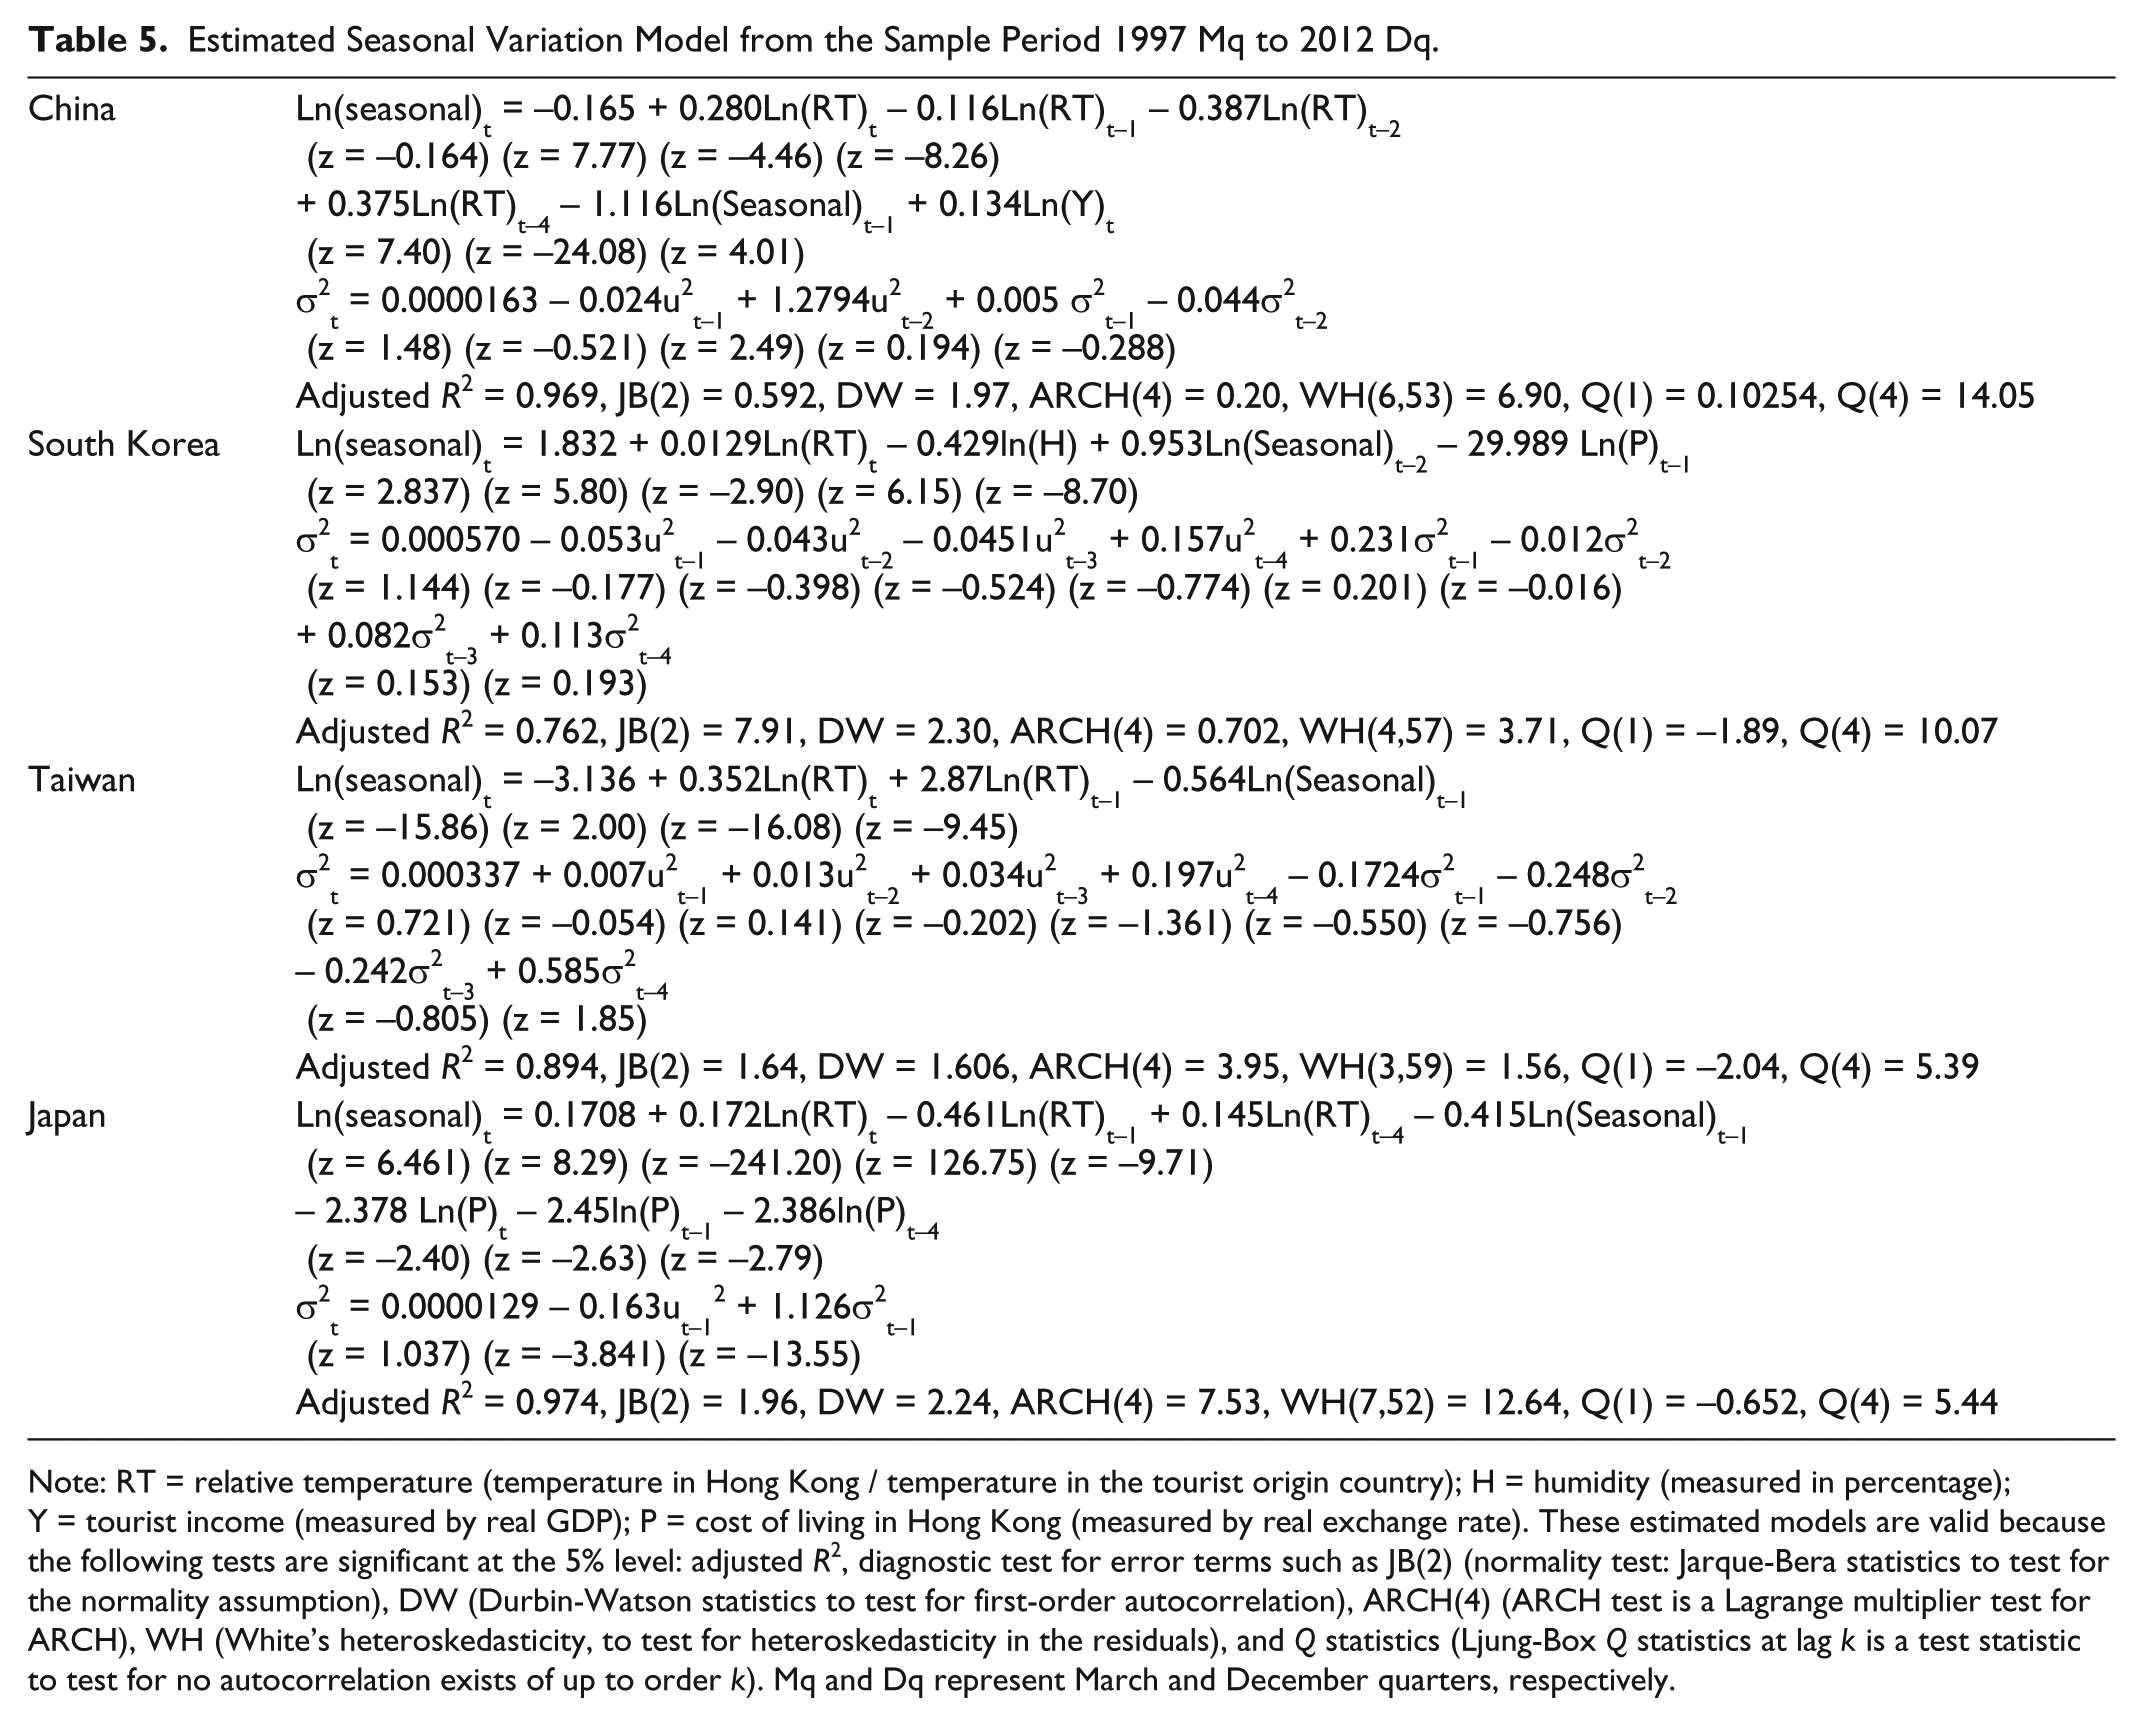
Note: RT = relative temperature (temperature in Hong Kong / temperature in the tourist origin country); H = humidity (measured in percentage); Y = tourist income (measured by real GDP); P = cost of living in Hong Kong (measured by real exchange rate). These estimated models are valid because the following tests are significant at the 5% level: adjusted R2, diagnostic test for error terms such as JB(2) (normality test: Jarque-Bera statistics to test for the normality assumption), DW (Durbin-Watson statistics to test for first-order autocorrelation), ARCH(4) (ARCH test is a Lagrange multiplier test for ARCH), WH (White’s heteroskedasticity, to test for heteroskedasticity in the residuals), and Q statistics (Ljung-Box Q statistics at lag k is a test statistic to test for no autocorrelation exists of up to order k). Mq and Dq represent March and December quarters, respectively.
Key Findings and Significant Determinants of Seasonal Variation.

Sensitivity Analysis
Table 7 shows the estimated impacts of RT, H, Y, and P on seasonal variation in inbound tourism demand from China, South Korea, Taiwan, and Japan. RT is positive for all countries, and its impact varies according to country. A sensitivity analysis was conducted to examine the increase or decrease in the seasonal variation or fluctuations of tourist numbers from a 1% change in explanatory variable, with other things being constant. A 1% increase in RT from the reduction of temperature in a tourist’s country of origin compared with that in Hong Kong would increase the seasonal variation by 0.28% in China, 0.0129% in South Korea, 0.352% in Taiwan, and 0.172% in Japan. A 1% increase in H would decrease the seasonal variation by 0.429% in South Korea. This analysis shows that warm temperature and low humidity compared to a tourist’s country of origin would increase the number of tourist arrivals to Hong Kong, thereby benefiting the Hong Kong tourism industry. A 1% increase in real Gross Domestic Product (GDP) would increase the seasonal variation by 0.167% in China. Lastly, a 1% increase in the cost of living in Hong Kong would decrease the seasonal variation by 29.98% in South Korea and by 2.37% in Japan.
Estimated Impact of Climate Variables and Economic Factors on Seasonal Variation during the Sample Period from 1997 Mq to 2012 Dq.
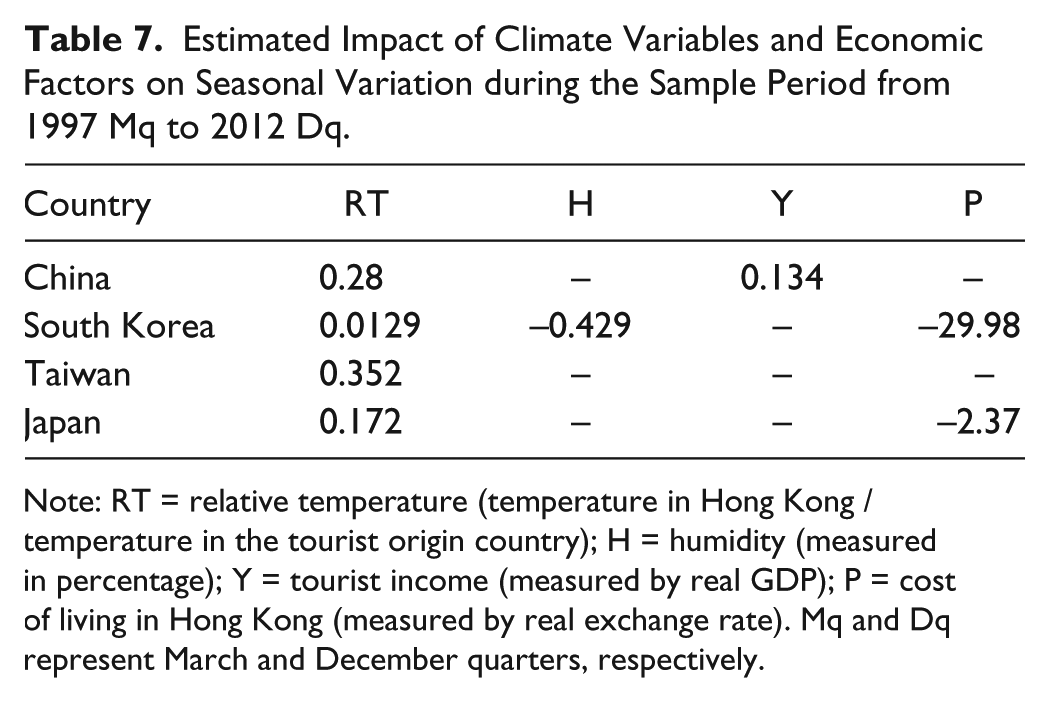
Note: RT = relative temperature (temperature in Hong Kong / temperature in the tourist origin country); H = humidity (measured in percentage); Y = tourist income (measured by real GDP); P = cost of living in Hong Kong (measured by real exchange rate). Mq and Dq represent March and December quarters, respectively.
Construction of CCI
In tourism, leading indicators are widely used to forecast the number of tourist arrivals and the turning points in the tourism growth cycle (Dwyer, Forsyth, and Dwyer 2010; Kulendran and Wong 2011). However, no attempt has been made to construct CCI from climate variables to forecast seasonal variation in the seasonal inbound tourism demand in Hong Kong as of this writing.
The construction of CCI involves adding the individual climate variable components while accounting for the importance and volatility of each component (Niemira and Klein 1994, 170).

where w is the weight of the component representing its relative importance (considering the correlation), and σ is the standardized weight calculated from the inverse value of the volatility measure (the average absolute deviation in relation to the average growth rate) to minimize the influence of a highly volatile series on CCI.
To construct CCI for the selected Hong Kong major markets, the study considered the following climate variables: temperature, temperature of tourist’s country of origin, temperature in the substitute destination (i.e., Singapore), humidity, rainfall, and number of thunderstorms. The number of cyclones in Hong Kong was not considered because they mostly occur only during Sq, and the correlation between the number of cyclones and seasonal variation is approximately 0.2. For the selected source markets, the allocated weights for the climate variables in the construction of CCI based on the correlations are shown in Table 8.
Allocated Weights to Climate Variables Based on Correlation for China, Taiwan, South Korea, and Japan.

Note: ST = temperature in Singapore; T = temperature in tourist origin country; HKT = temperature in Hong Kong; H = humidity; R = rainfall in Hong Kong; TH = number of thunderstorms in Hong Kong.
To determine the causality and lead time of the constructed CCI, the study implemented the Bivariate Granger-causality test (Maddala, 2001, p. 375). This method was applied by Seip and McNown (2007) and by Kulendran and Wong (2011) in their construction of the composite leading index. CCI is considered to be “lagging” if the direction of the causality is from seasonal variation to CCI and “leading” if the CCI predicts seasonal variation. The Granger-causality test was conducted to test the null hypothesis, as follows: H0: CCI does not cause seasonal variation; or H0: seasonal variation does not cause CCI. A significant causation between CCI and seasonal variation exists at 5%. CCI leads seasonal variation by two quarters for China, South Korea, Taiwan, and Japan. The plots illustrated in Figure 4 indicate that CCI leading seasonal variation can be useful in identifying the changes in the fluctuations in tourist arrivals from one season to another.
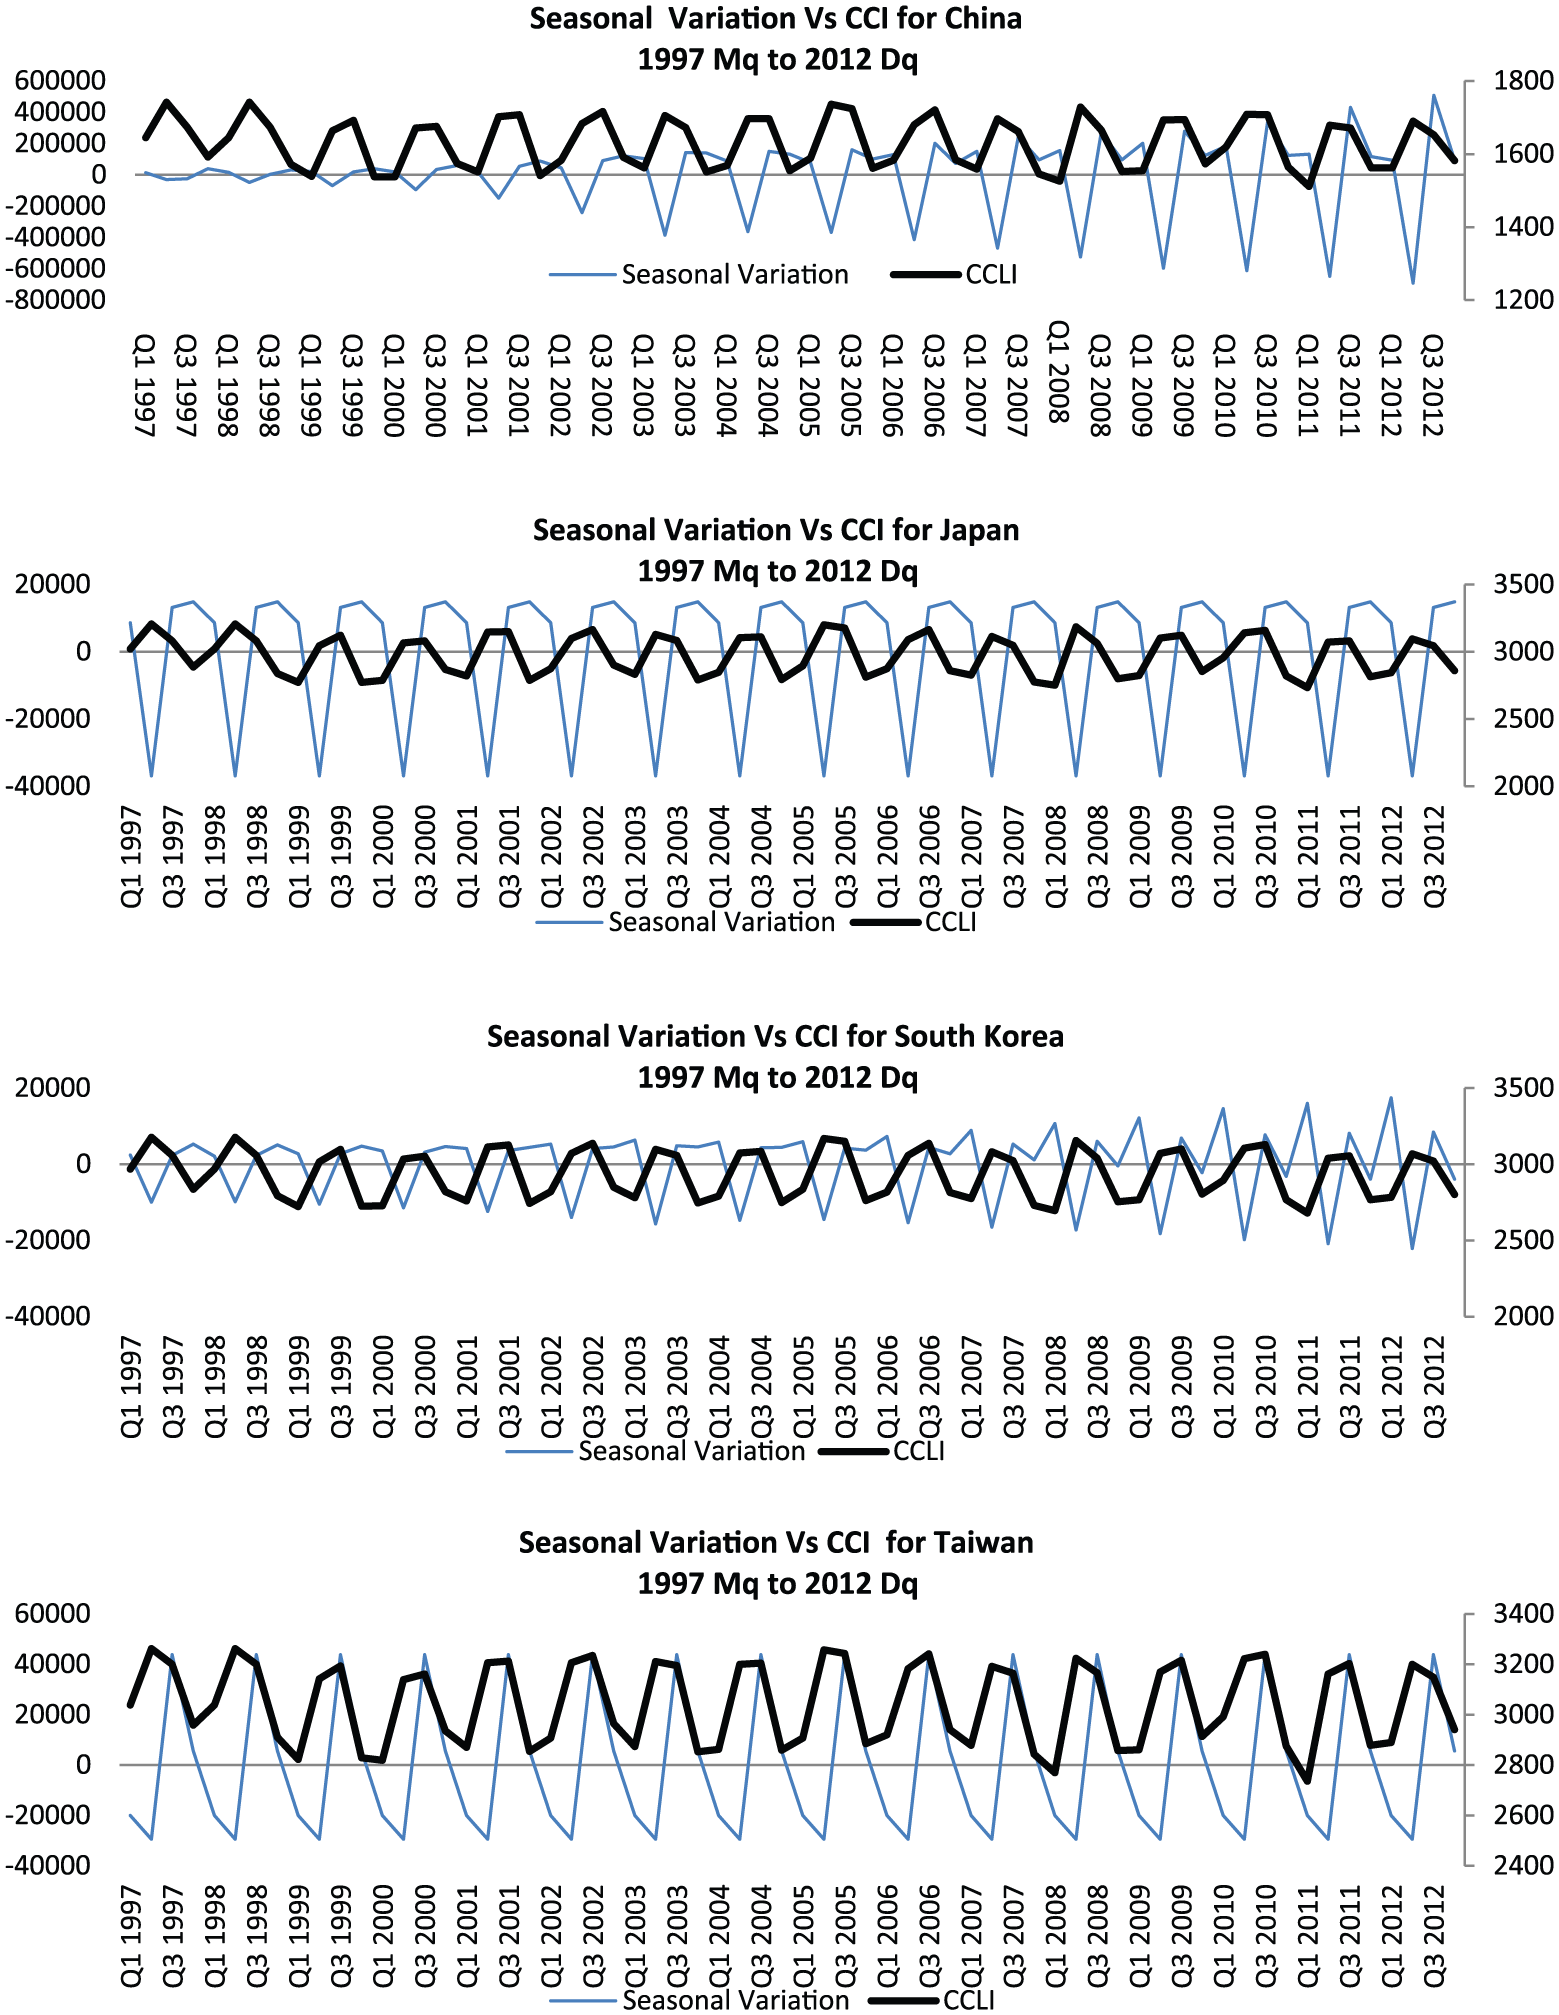
Plot of seasonal variation versus composite climate variable index by country of origin from 1997 Mq to 2012 Dq.
After identifying that CCIs lead seasonal variation in the inbound tourism demand in Hong Kong, this study estimated the tourism demand models using composite climate variable leading index (CCLI) and economic and institutional factors to predict future changes in seasonal variation. The CCI model is presented in detail in Table 9.
Estimated Seasonal Variation Model with Composite Climate Variables (CCI) Index from the Sample Period 1997 Mq to 2012 Dq.

Note: CCCI = composite climate variable index for China; SKCCI = composite climate variable index for South Korea; TCCI = composite climate variable leading index for Taiwan; JPCCI = composite climate variable leading index for Japan; Y = tourist income measured by real GDP; P = cost of living in Hong Kong measured by real exchange rate. These estimated models are valid because the following are observed as significant at the 5% level: adjusted R2, diagnostic test for error terms such as JB(2) (normality test: Jarque-Bera statistics to test for the normality assumption), DW (Durbin-Watson statistics to test for first-order autocorrelation), ARCH(4) (ARCH test is a Lagrange multiplier test for ARCH), WH (White’s heteroskedasticity, to test for heteroskedasticity in the residuals), and Q statistics (Ljung-Box Q statistics at lag k is a test statistics to test for no autocorrelation exists of up to order k). Mq and Dq represent March and December quarters, respectively.
CCI is significant in all estimated models, as shown in Table 7. Models are valid because the adjusted R2, diagnostic test for error terms JB(2), DW, ARCH(4), WH, and Q statistics are significant at the 5% level.
Forecast Comparison
In assessing the forecasting performance of CCI, the estimated tourism demand model with climate variables and economic factors, as reported in Table 5, and the estimated tourism demand model with CCI and economic factors, as reported in Table 9, were re-estimated for 1997 Mq to 2010 Dq, and out-of-sample forecasts for 2011 Mq to 2012 Dq were generated. To assess the out-of-sample forecasting performance, the following measures were considered: mean absolute percentage error (MAPE) and root mean square error (RMSE) (see Eviews 7.0). This study compares only the one-step-ahead out-of-sample forecasts instead of the multi-step because the purpose of this study is to identify whether CCLI improves forecasting performance. For both models, the output of Eviews 7.0 measured the accuracy of MAPE and RMSE, as reported in Table 10. The one-step-ahead out-of-sample forecasting comparison shows that tourism demand models with climate variables and economic factors provide better forecasts than those with CCI and economic factors, based on the accuracy of RMSPE and MAPE.
Forecast Accuracy in Terms of RMSPE and MAPE (Out-Of-Sample Period 2011 Mq to 2012 Dq).
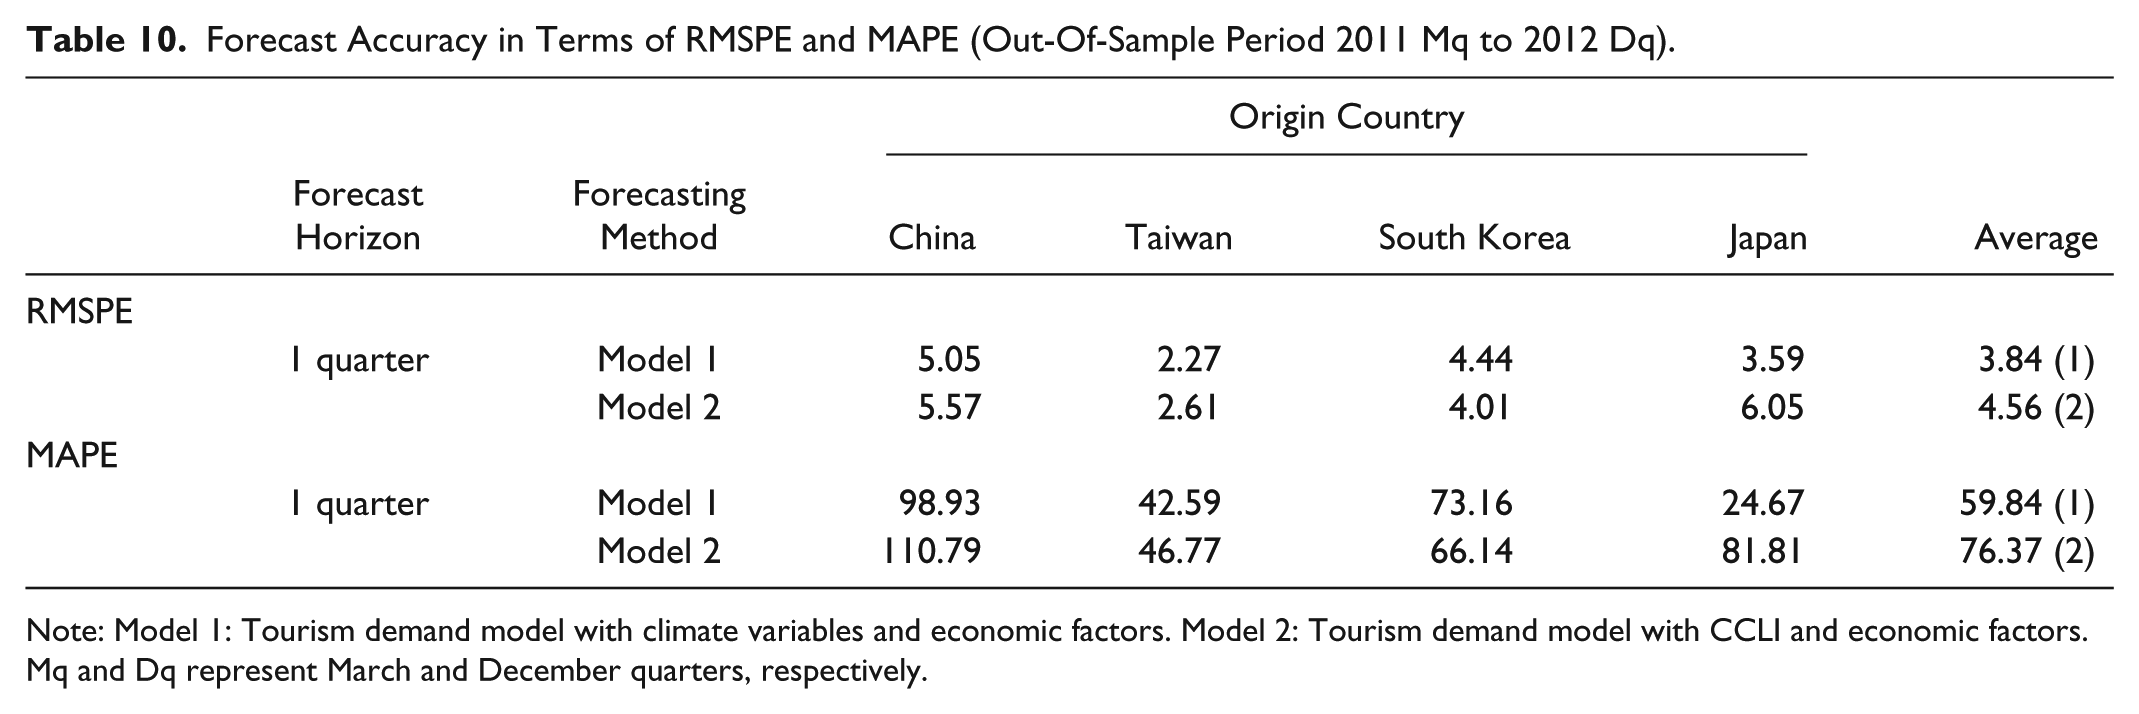
Note: Model 1: Tourism demand model with climate variables and economic factors. Model 2: Tourism demand model with CCLI and economic factors. Mq and Dq represent March and December quarters, respectively.
Conclusion
This study first considered the AED statistics to examine the link between climate variables in Hong Kong and seasonal variation in the inbound tourism demand in Hong Kong from selected major source markets, namely, mainland China, Taiwan, South Korea, and Japan. The AED statistics measured the deviation between the standardized climate variables in Hong Kong and the standardized seasonal variation in the inbound tourism demand in Hong Kong. Based on the smallest AED statistic, the climate variables with the strongest associations with seasonal variation in different seasons were identified. The climate variable that plays a dominant role in shaping seasonal variation patterns in different seasons is relative to the season and country. Information about daily weather conditions and climate-related activities, such as activities in different seasons, are important to tourists and the tourism industry to plan seasonal travel and efficiently allocate resources in different seasons.
To identify the determinants of seasonal variation, this study estimated the tourism demand model by considering climate variables, economic factors, and institutional factors, such as Chinese New Year, Easter, Christmas, and special events. This study found that only climate variables and economic factors were significant determinants of seasonal variation. Institutional factors such as SARS and the September 11, 2001, incident in the United States were not significant since these two institutional factors would seem to be more closely associated with the growth rate and/or trend in the seasonal tourism demand and independent of seasonal variation. Holiday periods such as Chinese New Year, Easter, and Christmas were not significant because these events may have created irregular changes in the seasonal variation that would have been removed when extracting the smooth seasonal component from the STAMP program. Given the high correlation among the climate variables, only relative temperature (RT, °C) (measured by comparing the temperature in Hong Kong with that in a tourist’s country of origin) and humidity (H, %) were included in the model. RT is significant and positive for all the selected markets, but the impact varies according to country demand. H is significant only in the Korean market. The findings confirm that favorable conditions such as warm temperature and low humidity level in the destination compared with those of the country of origin have a positive effect on the benefits enjoyed by tourists, supporting the findings of Kozak, Uysal, and Birkan (2008).
Tourist income (Y, measured by real GDP) is only significant for China, whereas cost of living in Hong Kong (P, measured by real exchange rate) is significant for South Korea and Japan. Institutional factors are not significant. This study finds that climate variables and economic variables are important determinants of seasonal variation in the inbound tourism demand in Hong Kong, supporting the findings of Goh, Law, and Mok (2008).
This study is the first attempt to construct CCI from the climate variables in Hong Kong, specifically the temperature in a tourist’s country of origin and that in the substitute destination (i.e., Singapore), to forecast the seasonal variation in the seasonal inbound tourism demand in Hong Kong. The study found that CCI leads seasonal variation by two quarters but does not provide a better forecast than that by the tourism demand model in the one-step-ahead forecast comparison. However, a previous study (Kulendran and Dwyer 2012) found that adding climate variables improves the forecasting performance. If tourism-forecasting practitioners would aim to obtain an accurate forecast of the fluctuations of tourist numbers from one season to another, then they must consider economic and climate variables. Based on the results of the present study, we recommend that climate variables in both the country of origin and the tourist destination must be considered. CCI that leads to seasonal variation may be useful in identifying directional changes in the seasonal variation by visual examination. The construction of CCI is exploratory and in the future, the scope of the present study should be extended.
To prevent the concentration of tourists in a particular season because of the pleasant and warm weather in the destination compared with the country of origin, the tourism industry in Hong Kong can develop marketing initiatives to promote special-interest holidays among the visitors who are willing to travel to the country during off-season. The economic factor that influences tourists from Japan and South Korea is the cost of living in Hong Kong. To increase the number of seasonal tourist arrivals to Hong Kong, hoteliers and the tourism industry should promote “packaged tourism” and “seasonal pricing strategy” to these countries. Although there have been many discussions on the climate variables influencing tourism inflow, this article makes a significant contribution to the literature by identifying the significant climate variables by isolating and quantifying their effect on seasonal tourism demand. Given that climate variables are beyond the control of policy makers, a useful application of the results of the study would be for those parties involved in the supply side of tourism. For instance, once the forecasts have been generated by the model, the suppliers of tourism-related services such as tour operators, food and catering establishments, hoteliers, airlines, etc. will be able to optimize resource allocation by adjusting supply to meet the predicted seasonal demand. Limitations exist in this study. First, climate variation in different seasons is nearly stable, but any extreme weather condition not factored into this model may adversely affect tourism demand. Second, this study does not consider the seasonal segmentation to measure the impact of climate variables on the selection of winter and summer holidays to Hong Kong because we focused on identifying the impact of climate variables on seasonal variation. Finally, only one-step-ahead forecasts are considered for four short-haul markets, and this study can be extended to long-haul markets with long-horizon forecasts.
Footnotes
Acknowledgements
Authors acknowledge the anonymous referees for their valuable comments.
Declaration of Conflicting Interests
The author(s) declared no potential conflicts of interest with respect to the research, authorship, and/or publication of this article.
Funding
The author(s) disclosed receipt of the following financial support for the research, authorship, and/or publication of this article: Authors acknowledge the financial support by the Research Grants Council of the Hong Kong Special Administrative Region, China (Project No. PolyU 5506/12H).