




Abstract
The purpose of this study is to empirically test an integrative model linking tourists’ emotional experiences, perceived overall image, satisfaction, and intention to recommend. The model was tested using data collected from domestic tourists visiting Sardinia, Italy. Results show that tourists’ emotional experiences act as antecedents of perceived overall image and satisfaction evaluations. In addition, overall image has a positive influence on tourist satisfaction and intention to recommend. The study expands current theorizations by examining the merits of emotions in tourist behavior models. From a practical perspective, the study offers important implications for destination marketers.
Keywords
Introduction
Modeling antecedents of destination image (Baloglu and McCleary 1999), tourist satisfaction (del Bosque and San Martín 2008; Engeset and Elvekrok 2015), and behavioral intentions (Baker and Crompton 2000; Huang, Weiler, and Assaker 2015) remains a widespread research agenda in tourism. In recent years, scholars such as Chen and Phou (2013), Elliot, Papadopoulos, and Kim (2011), and Zhang et al. (2014) have called for research on developing and testing “global” or “integrative” models. Specifically, when modeling the antecedents of tourist satisfaction and loyalty, there is a need to include tourists’ emotional experiences (del Bosque and San Martín 2008; Prayag, Hosany, and Odeh 2013). Emotions are ubiquitous in tourism (Aho 2001), play a central role in defining memorable experiences (Tung and Ritchie 2011), and are the most relevant component of affect to the travel industry (Mitas et al. 2012). Emotions influence various stages of the tourist experience (Bigné, Andreu, and Gnoth 2005; Ene and Schofield 2011; Prayag, Hosany, and Odeh 2013). At the pre-travel stage, emotions play a fundamental role in tourist motivation (Gnoth 1997; Goossens 2000) and destination choice processes (Chuang 2007). During the trip, emotions can vary in intensity on a day-to-day basis (Nawijn et al. 2013). At the postconsumption stage, emotions influence satisfaction (del Bosque and San Martín 2008; Faullant, Matzler, and Mooradian 2011), destination attachment (Yuksel, Yuksel, and Bilim 2010), and loyalty (Bigné, Andreu, and Gnoth 2005; Yuksel and Yuksel 2007).
Although tourism research acknowledges the importance of studying emotions (Hosany and Gilbert 2010; Lee 2014; Nawijn et al. 2013), prior research fails to simultaneously examine the relationship between emotional responses, destination image, satisfaction and behavioral intentions. Existing studies can be classified in two categories. The first category (e.g., Assaker and Hallak 2013; Bigné, Sanchez, and Sanchez 2001; Castro, Armario, and Ruiz 2007; Chen and Phou 2013; Chen and Tsai 2007; Chi and Qu 2008; Hallmann, Zehrer, and Müller 2015; Lee, Lee, and Lee 2014; Qu, Kim, and Im 2011) models destination image as either a direct or indirect antecedent of satisfaction and/or behavioral intentions but omit emotions in their conceptual framework. The second research stream (Bigné, Andreu, and Gnoth 2005; Grappi and Montanari 2011; Lee 2014 ; Lee et al. 2008; Prayag, Hosany, and Odeh 2013; Yuksel and Yuksel 2007) theorizes the interrelationships between emotions, satisfaction, and/or behavioral intentions/loyalty but fails to include destination image in their conceptualization.
Integrating the effects of emotions on postconsumption behaviors is an important development in consumer and tourism research (Bagozzi, Gopinath, and Nyer 1999; Gnoth 1997; Mano and Oliver 1993). The purpose of this study is to empirically test a conceptual model linking tourists’ emotional experiences, overall image, satisfaction, and intention to recommend. The tourism experience is an extended service transaction in which consumption of the destination entails a sequence of episodes. While emotions are experienced at specific points or episodes along the service process (in-process emotions), in this study, tourists’ emotional responses were assessed in terms of a holistic postconsumption experience. The proposed framework (Fig. 1) draws on existing theorizations from various disciplines such as environmental psychology (e.g., Farber and Hall 2007), mainstream psychology (e.g., Izard 1977; Lerner and Keltner 2000; Plutchik 1980), marketing (e.g., Machleit and Eroglu 2000), and tourism (e.g., Faullant, Matzler, and Mooradian 2011). The model shows that tourists’ emotional experiences (joy, love, and positive surprise) influence their overall image perception. In addition, assessment of overall image has an effect on satisfaction and intention to recommend. The contribution of this research is twofold. First, this research responds to the recent call for tourism researchers (e.g., del Bosque and San Martín 2008; Chen and Phou 2013) to develop integrative models. More specifically, this study expands current theorizations by examining the merits of including emotions in tourist behavior frameworks. Research in marketing (Allen, Machleit, and Kleine 1992; Nyer 1997; Yu and Dean 2001) demonstrates the predictive power of emotions in consumer models. For example, Nyer (1997) establishes that emotions add significantly to the predictive power offered by satisfaction in modeling postconsumption behaviors such as word-of-mouth intentions. Allen, Machleit, and Kleine (1992) show emotions serve as incremental predictors, beyond attitudes, of behavior.
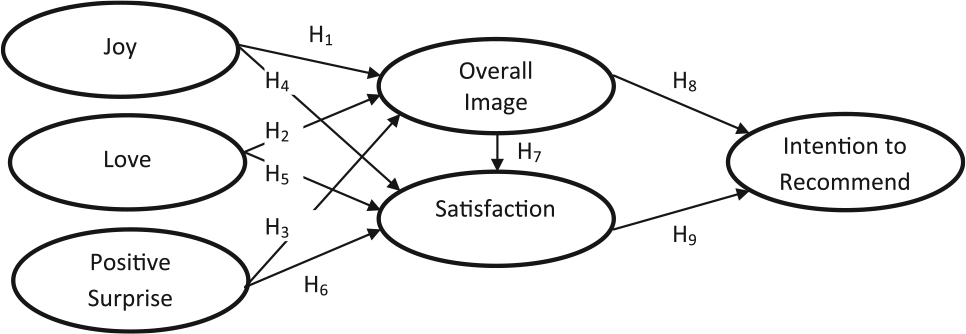
The conceptual model.
Second, unlike research in marketing, it is common for tourism studies (e.g., del Bosque and San Martín 2008; Grappi and Montanari 2011; Lee et al. 2008; Zins 2002) to aggregate emotions into summary dimensions. While this approach is useful, studying the role of specific emotions in shaping tourists’ experiences is important to both academics and marketers. Hence, this study focuses on measuring emotions at the specificity level, an underdeveloped area of research in tourism (Faullant, Matzler, and Mooradian 2011). In particular, this study adopts Hosany and Gilbert’s (2010) conceptualization, representing tourists’ emotional experiences in terms of three distinct dimensions: joy, love, and positive surprise. The three dimensions are also common in recent tourism research in the context of festivals (Lee 2014; Lee and Kyle 2013). Examining a few global dimensions (e.g., positive and negative) oversimplifies the emotional experience’s complexity (Bagozzi et al., 2000; Rucker and Petty, 2004). For example, Machleit and Eroglu (2000) note combining emotional responses into summary dimensions hide relationships between specific emotions and satisfaction. To benefit theory development and measurement, it is important to understand the behavioral consequences of discrete emotions (Bagozzi et al. 2000; Soscia 2007; Zeelenberg and Pieters 2004). Identifying relationships between specific emotions and outcome variables (such as satisfaction and image) are also of managerial significance in designing and enhancing tourism experiences.
Conceptual Background and Hypotheses Development
Tourists’ Emotional Responses
Emotions are affective states characterized by episodes of intense feelings associated with a specific referent (such as a person, an object, or an event) and instigate specific response behaviors (Cohen and Areni 1991). The psychology literature offers two major theoretical approaches to study emotions: dimensional (valence based) and categorical (emotion specificity). Dimensional approaches conceptualize emotions using few dimensions such as positive and negative (Watson, Clark, and Tellegen 1988), or pleasure and arousal (Russell 1980; Walsh et al. 2011). Under the dimensional approach, there is no distinction between specific positive (e.g., joy, happiness, and excitement) and negative (e.g., fear, regret, and disappointment) emotions. Categorical approaches conceptualize emotions as a set of idiosyncratic affective states (e.g., joy, anger, sadness, surprise) (see Izard 1977; Plutchik 1980). Emotions of the same valence have different effects on outcome variables such as judgment (Lerner and Keltner 2000), decision making (Raghunathan and Pham 1999), satisfaction (Machleit and Eroglu 2000), and behavioral intentions (Soscia 2007; Zeelenberg and Pieters 2004). Measurement of emotions in tourism has favored the valence-based approach. Summary dimensions such as positive and negative emotions (del Bosque and San Martín 2008; Grappi and Montanari 2011; Lee et al. 2008) or pleasure and arousal (Bigné, Andreu, and Gnoth 2005; Yuksel 2007; Yuksel and Yuksel 2007) are common.
Prior studies in tourism focus on emotional experiences associated with festivals (Grappi and Montanari 2011; Lee 2014; Lee and Kyle 2013; Lee et al. 2008), shopping (Yuksel 2007; Yuksel and Yuksel 2007), restaurants (e.g., Han and Jeong 2013; Ladhari 2009), theme parks (Bigné, Andreu, and Gnoth 2005), holidays (Hosany and Prayag 2013; Lin et al. 2014; Mitas et al. 2012; Nawijn et al. 2013), heritage sites (Prayag, Hosany, and Odeh 2013), and adventure tourism (Faullant, Matzler, and Mooradian 2011). Overall, these studies show that (1) types (positive or negative) and intensity of emotions differ across products and stages of the travel; (2) positive emotions are more pervasive in tourists’ recalled experiences; and (3) emotions are important precursors to satisfactory tourist experiences and/or behavioral intentions.
Research in tourism often borrows psychology-based self-report emotion measures. Four commonly adapted scales include Plutchik’s (1980) eight primary emotions, Izard’s (1977) Differential Emotion Scale, Mehrabian and Russell’s (1974) Pleasure, Arousal, and Dominance Scale, Watson, Clark, and Tellegen’s (1988) Positive Affect and Negative Affect Scales. Despite their widespread application, in recent years, researchers have questioned the applicability, reliability, and validity of psychological emotion scales in consumer studies (see Laros and Steenkamp 2005; Richins 1997; Schoefer and Diamantopoulos 2008). Hosany and Gilbert (2010) further note that emotion scales from psychology are context specific and fail to capture the richness of tourist and destination characteristics. Existing emotion scales overlook the complexity of positive emotions (Fredrickson 1998), commonly associated with tourism experiences (Nawijn et al. 2013). As a result, adapting scales from psychology often fails to achieve content validity (Haynes, Richard, and Kubany 1995), leading to erroneous conclusions.
Realizing the need to validly measure the diversity, intensity, and complexity of tourists’ emotional responses, Hosany and Gilbert (2010) developed the Destination Emotion Scale (DES). The DES consists of 15 items representing three emotional dimensions of joy, love, and positive surprise. Joy is associated with positive outcomes such as the realization of one’s goals (Izard 1977; Lazarus 1991). The pursuit of pleasure is a core facet of tourist experiences (Currie 1997; Goossens 2000; Nawijn 2011). The Love dimension is consistent with research in marketing establishing that consumers experience love toward products and brands (e.g., Ahuvia 2005; Albert, Merunka, and Valette-Florence 2008). Finally, the last dimension, surprise, is often characterized as a neutrally valence emotion arising from unexpected occurrences (Meyer, Reisenzein, and Schutzwohl 1997). However, other emotions accompany surprise to elicit positive surprise (e.g., surprise and joy) or negative surprise (e.g., surprise and anger).
Overall, the DES dimensions are theoretically consistent with conceptualizations of emotion in marketing (e.g., Batra, Ahuvia, and Bagozzi 2012) and tourism research (e.g., Crotts and Magnini 2011; Faullant, Matzler, and Mooradian 2011; Lee and Kyle 2013). For example, in their study of festival visitors’ emotional experiences, Lee and Kyle (2013) identified joy, love, and positive surprise as key emotion dimensions. More recently, using data collected from international tourists visiting two distinct destinations, Thailand and Petra, Hosany et al. (2015) further confirm the DES external validity. Accordingly, Hosany and Gilbert’s (2010) DES is used to measure tourists’ emotional responses. In so doing, this study also responds to Hosany and colleagues’ (2015) call for research to incorporate the DES into conceptual frameworks that promote holistic understanding of tourists’ experiences.
Tourists’ Emotional Responses and Perceived Overall Image
Destination image is commonly conceptualized as a mental or attitudinal construct consisting of the sum of beliefs, ideas, and impressions that a tourist holds of a destination (Crompton 1979). Tourists’ perceived image of a destination is dynamic (Lee, Lee, and Lee 2014), and a rich body of literature exists that distinguishes between different types of image, formed during specific stages (e.g., previsit, during a visit, and postvisit) of the tourist experience (e.g., Fakeye and Crompton 1991; Gunn 1988; Phelps 1986). Lee, Lee, and Lee (2014) emphasize the importance to differentiate between the many facets of destination image when explaining tourist behavior. Earlier studies establish that previsit image influence intention to visit and destination choice (Alhemoud and Armstrong 1996; Baloglu and McCleary 1999). During a trip, the image of a destination positively influences on-site recreation experiences (Bigné, Sanchez, and Sanchez 2001). However, the majority of research focuses on tourists’ postvisit image perceptions and its relationship with posttrip evaluations such as satisfaction level (e.g., Assaker and Hallak 2013; Chen and Phou 2013; Lee, Lee, and Lee 2014) and intention to recommend (Bigné, Sanchez, and Sanchez 2001; Papadimitriou, Apostolopoulou, and Kaplanidou 2015). Under this research tradition, destination image is operationalized as an overall evaluative construct measuring tourists’ holistic impression of a destination (Echtner and Ritchie 1993). In a meta-analysis of the literature, Zhang et al. (2014) show that overall image serves as a strong proxy for capturing destination image. Accordingly, in line with prior research and recent theorizations (e.g., Assaker and Hallak 2013; Assaker, Vinzi, and O’Connor 2011; Papadimitriou, Apostolopoulou, and Kaplanidou 2015; Prayag 2009), this study focuses on tourists’ postvisit overall image perceptions.
Beyond its physical properties, the holistic image of a destination is influenced by an amalgam of emotional attributes (Walmsley and Young 1998). Prior studies establish that people elicit emotions toward physical and social environment (Farber and Hall 2007). When emotions evoked by a place coincide with the benefits sought, tourists will construct a positive evaluation of the destination’s overall image (San Martín and del Bosque 2008). Empirical research in tourism investigating the relationship between emotional responses and destination image is scarce. However, in a restaurant setting, Chen, Yeh, and Huan (2014) theorize nostalgic emotions as antecedents of restaurant image. Accordingly, the following hypotheses are formulated:
Hypothesis 1: The emotion of Joy has a positive influence on perceived overall image.
Hypothesis 2: The emotion of Love has a positive influence on perceived overall image.
Hypothesis 3: The emotion of Positive Surprise has a positive influence on perceived overall image.
Tourists’ Emotional Responses and Satisfaction
Measuring and managing satisfaction is vital for the survival, development, and success of tourist destinations (Sirakaya, Petrick, and Choi 2004; Song et al. 2012). Satisfaction is a positive reaction resulting from favorable appraisals of consumption experiences (Babin and Griffin 1998; Oliver 1997). Despite its relevance, ambiguities exist about the nature and definition of satisfaction in tourism (Baker and Crompton 2000; del Bosque and San Martín 2008; Kozak 2001). A rich body of research follows a cognitive approach, conceptualizing tourist satisfaction as a postconsumption evaluation of whether or not expectations are met (Eusébio and Vieira 2013). Other studies, however, consider satisfaction as an emotional reaction derived from the consumption experience (Huang, Weiler, and Assaker 2015; Spreng, MacKenzie, and Olshavsky 1996). More recently, some studies (del Bosque and San Martín 2008; Žabkar, Makovec-Brenčič, and Dmitrović 2010) adopt a cognitive–affective perspective and operationalize satisfaction as tourists’ cognitive–affective state derived from the destination experience. Irrespective of how satisfaction is conceptualized (either cognitive, affective, or both), it is common for studies to measure satisfaction at the aggregated level (Bigné, Sanchez, and Sanchez 2001; Chen and Chen 2010; Engeset and Elvekrok 2015; Huang, Weiler, and Assaker 2015; Lee, Yoon, and Lee 2007) as opposed to the attribute level (Chi and Qu 2008; Eusébio and Vieira 2013). Accordingly, consistent with recent research in tourism (Assaker and Hallak 2013; Engeset and Elvekrok 2015; Sun, Chi, and Xu 2013), satisfaction is operationalized as a summative overall construct.
Emotions arising from consumption experiences deposit affective memory traces that consumers process and integrate to form postconsumption evaluations of satisfaction (Westbrook and Oliver 1991). Studies in marketing (Bagozzi, Gopinath, and Nyer 1999; Ladhari 2007; Liljander and Strandvik 1997; Walsh et al. 2011) and tourism (Bigné, Andreu, and Gnoth 2005; del Bosque and San Martín 2008; Yuksel and Yuksel 2007) confirm a relationship between emotions and satisfaction. Satisfaction is a key outcome of positive emotional responses such as pleasure, interest, and joy (Oliver 1997). In tourism, positive emotions such as joy (Faullant, Matzler, and Mooradian 2011), happiness, excitement, and pleasure (Grappi and Montanari 2011) have a favorable influence on satisfaction. In a heritage tourism context, Prayag, Hosany, and Odeh (2013) show that joy, love, and positive surprise can generate satisfaction. Positive emotions are also related to the formation of satisfaction in the context of tourist services such as restaurants (Lin and Mattila 2010) and theme parks (Bigné, Andreu, and Gnoth 2005). Based on the above discussions, the following hypotheses are formulated:
Hypothesis 4: The emotion of Joy has a positive influence on tourist satisfaction with a destination.
Hypothesis 5: The emotion of Love has a positive influence on tourist satisfaction with a destination.
Hypothesis 6: The emotion of Positive surprise has a positive influence on tourist satisfaction with a destination.
Perceived Overall Image and Satisfaction
Destination image plays a significant role in predicting tourists’ behaviors (Baloglu and McCleary 1999; Castro, Armario, and Ruiz 2007). The effects of overall image on tourist satisfaction are well established (Prayag 2009; Wang and Hsu 2010). Generally, favorable assessment of a destination’s overall image positively influences tourist satisfaction (Bigné, Sanchez, and Sanchez 2001; Prayag 2009; Wang and Hsu 2010). Hence, these findings lead to the following hypothesis:
Hypothesis 7: A more favorable overall image will result in higher level of tourist satisfaction with a destination.
Perceived Overall Image and Intention to Recommend
Modeling loyalty remains of high relevance in tourism research (see Zhang et al. 2014). Revisit intention and recommendations to others are the most commonly used measures of tourist loyalty (Eusébio and Vieira 2013; Horng et al. 2012; Oppermann 2000; Um, Chon, and Ro 2006). However, Kozak and Rimmington (2000) note that intention to revisit is problematic as a measure of loyalty given the variety-seeking nature of tourists. More recently, McKercher and Tse (2012) show that intention to revisit (return) is not a valid surrogate measure for actual repeat visitation. For the purpose of this study, behavioral intention is measured in terms of tourists’ propensity to recommend the destination to others such as family and friends. Prior studies confirm that positive overall image contributes to higher propensity to recommend (e.g., Assaker, Vinzi, and O’Connor 2011; Bigné, Sanchez, and Sanchez 2001; Papadimitriou, Apostolopoulou, and Kaplanidou 2015; Prayag 2009; Qu, Kim, and Im 2011). As such, the study proposes the following hypothesis:
Hypothesis 8: A more favorable overall image will result in higher propensity to recommend the destination.
Satisfaction and Intention to Recommend
Satisfaction is one of the main precursors of loyalty in both the marketing (e.g., Cronin and Taylor 1992; Cronin, Brady, and Hult 2000; Lam et al. 2004) and tourism (Baker and Crompton 2000; Chen and Tsai 2007; Chen and Chen 2010; Engeset and Elvekrok 2015; Grappi and Montanari 2011; Huang, Weiler, and Assaker 2015; Hutchinson, Lai, and Wang 2009; Yuksel and Yuksel 2007) literatures. Satisfied tourists are more likely to recommend the destination to others (Beeho and Prentice 1997; Bigné, Sanchez, and Sanchez 2001; Chen and Tsai 2007). Dissatisfied tourists are unlikely to return to the destination (Alegre and Garau 2010) and will engage in negative word-of-mouth (Chen and Chen 2010). More recently, Dolnicar, Coltman, and Sharma (2015) challenge the link between satisfaction and behavioral intention. Inconsistency in construct operationalization, that is, loyalty and behavioral intention measured using similar items, and the frequent omission of causal factors impede theoretical advancements on the nature of this relationship. However, previous studies confirm a positive relationship between satisfactory tourist experiences and intention to recommend (Bigné, Sanchez, and Sanchez 2001; Grappi and Montanari 2011; Žabkar, Makovec-Brenčič, and Dmitrović 2010). Hence, it is logical to hypothesize as follows:
Hypothesis 9: A higher level of tourist satisfaction with a destination will result in higher propensity to recommend the destination
Methods
Measurement Scales
Respondents had to rate the study main constructs (overall image; emotions of joy, love and positive surprise; satisfaction and intentions to recommend) using multiitem measures. In line with previous studies (Assaker and Hallak 2013; Assaker, Vinzi, and O’Connor 2011; Baloglu and McCleary 1999; Papadimitriou, Apostolopoulou, and Kaplanidou 2015; Prayag 2009), the study focuses on tourists’ posttravel overall image perception. Perceived overall image was measured using two statements: “your impression of the overall image of Sardinia?” (1 = unfavorable and 7 = favorable; 1 = very negative and 7 = very positive). Positive emotions were operationalized using 15 items commonly associated with tourist destinations (Hosany and Gilbert 2010; Hosany and Prayag 2013; Hosany et al. 2015), reflecting the three dimensions of the DES scale (joy, love, and positive surprise). Respondents had to rate the intensity of their overall emotional experiences toward Sardinia using a 7-point scale ranging from 1 = not at all to 7 = very much.
Satisfaction was operationalized as a summative overall construct using the following statements (adapted from Faullant, Matzler, and Mooradian 2011; Lee et al. 2008): “Please indicate your overall satisfaction with the destination experience of Sardinia” (1 = very dissatisfied and 7 = very satisfied; and 1 = terrible and 7 = delighted). Intention to recommend was captured using three items adapted from Grappi and Montanari (2011) and Lee et al. (2008): “I will recommend Sardinia to other people”; “I will say positive things about Sardinia to other people”; and “I will encourage friends and relatives to visit Sardinia” (1 = strongly disagree and 7 = strongly agree). The questionnaire was available in two languages, English and Italian. Back-translation was used to ensure consistency of the Italian version.
Since respondents had to rate all study variables in the questionnaire using self-report, data may be susceptible to common method variance (Lindell and Whitney 2001). To minimize any potential common method variance (CMV), the survey design and administration adhered to Podsakoff et al. (2003) guidelines. For example, to reduce evaluation apprehension, respondents were assured anonymity and confidentiality. Second, in terms of layout and format, measures for the dependent variables follow independent variables in the final questionnaire (Salancik and Pfeffer 1977). Third, Harman’s single-factor test was employed to assess CMV (Podsakoff and Organ 1986). The test requires loading all the study variables in an exploratory factor analysis (EFA) statistical procedure. CMV is assumed if either a single factor emerges from the data, or one general factor explains majority of the variance (Podsakoff et al. 2003). EFA results reveal the existence of a multifactor structure (four factors with eigenvalues greater than 1), with the first factor accounting for only 25.5% of the total variance. These results suggest that common method variance is not a pervasive issue in the data.
Study Settings, Sampling, and Data Collection
The island of Sardinia, located in the Mediterranean Sea, is an international tourist destination with a unique history, environment, and culture (Pulina, Meleddu, and Del Chiappa 2013). Sardinia has experienced a significant increase in tourism flows as a result of transport deregulation that occurred in the late 1990s and the increasing number of low-cost flights to the island. Like many other island destinations, Sardinia depends heavily on sun and sand tourism. However, the region has potential for other activities such as heritage and archaeology, food and wine tourism, trekking, and other outdoor activities. Favorable opportunities also exist in the area for sport tourism (golf, sailing, cycling, rally, etc.), as demonstrated by successful events such as the World Rally Costa Smeralda.
Data were collected from domestic tourists living in Italian regions other than Sardinia. The reasons to focus on domestic tourists are twofold. First, in recent years, Sardinia has experienced a steady decline in domestic demand (Global Travel Industry News 2012). As a result, the Sardinia Regional Department of Tourism (SRDT) has launched several promotional campaigns to recover domestic tourist market share (Global Travel Industry News 2012). Second, from a theoretical perspective, it is important to understand the intricacies of domestic tourists’ experiences and behavior. Although utilizing the same vacation space, domestic tourists often differ from international tourists in terms of their attitudes and behaviors (Singh and Krakover 2015). In comparison to their international counterparts, domestic tourists often have different perceptions (Bonn, Joseph, and Dai 2005; Tasci and Gartner 2007) and satisfaction levels (Yuksel 2004).
A purposive sampling procedure identified potential respondents. Trained research assistants were instructed to survey only Italian tourists. If subjects did not qualify as domestic tourists or were not willing to participate in the study, the research assistants would intercept the next available person(s). Congruent with the dominant research tradition (e.g., Zhang et al. 2014) and consistent with the conceptualization of tourist destinations (e.g., Xu 2010), the study focuses on tourists’ holistic experiences as opposed attribute-level evaluations. Data were collected from domestic tourists at the end of their holidays around the airport and port areas in Olbia. In total, 350 respondents were approached to take part in the survey and 275 valid questionnaires were obtained, resulting in a 78.57% response rate. The sample was almost equally split between males (49.1%) and females (50.9%). Respondents’ age groups were as follows: 16–24 years old (16%); 25–34 years old (26.5%); 35–44 years old (28.7%); 45–54 years old (12%); and more than 54 years old (16.5%). In terms of education level, respondents were well educated, with 17.5% completing at least high school, 46% college degrees, and 24.9% postgraduate degrees. The two main purposes of visit were leisure (66.2%) and visiting family and friends (21.5%).
Results
Measurement Model
Following Anderson and Gerbing’s (1988) recommended guidelines, reliability, convergent validity, and discriminant validity of the main constructs are first established (see Tables 1 and 2) before testing the structural model. Skewness and kurtosis indices for the scale items were within the recommended absolute values of 3 and 8, respectively, indicating no violation of the normality assumption (Kline 2011). To assess the psychometric properties of the scales, a six-factor measurement model was estimated using AMOS. The initial model displayed mediocre fit and modification indices suggested that a more parsimonious model could be obtained by deleting two statements (I feel a sense of tenderness toward Sardinia; I feel warm-hearted toward Sardinia) from the love dimension. The standardized maximum likelihood (ML) loadings (Table 1) and fit statistics of the respecified model indicated satisfactory fit indices (χ2 = 276.33, df = 148, p<0.001). The descriptive global fit measure (goodness-of-fit index = 0.91) and incremental fit measures (Tucker–Lewis index = 0.97, comparative fit index = 0.98, and incremental fit index = 0.98) were above the 0.90 cut-off level (Byrne 1998). In addition, the inference statistical tests provided further evidence of the appropriateness of measurement model, with the root mean square error of approximation (RMSEA) = 0.055, and χ2/df = 1.87 (Turner and Reisinger 2001).
Assessment of the Measurement Model: Reliability and Convergent and Discriminant Validity.

Note: AVE = average variance extracted; N/A = not applicable.
In AMOS, one loading has to be fixed to 1; therefore, no t-statistic can be computed for this item.
Significant at the 0.001 level.
Mean, Standard Deviation, and Inter-construct Correlations.
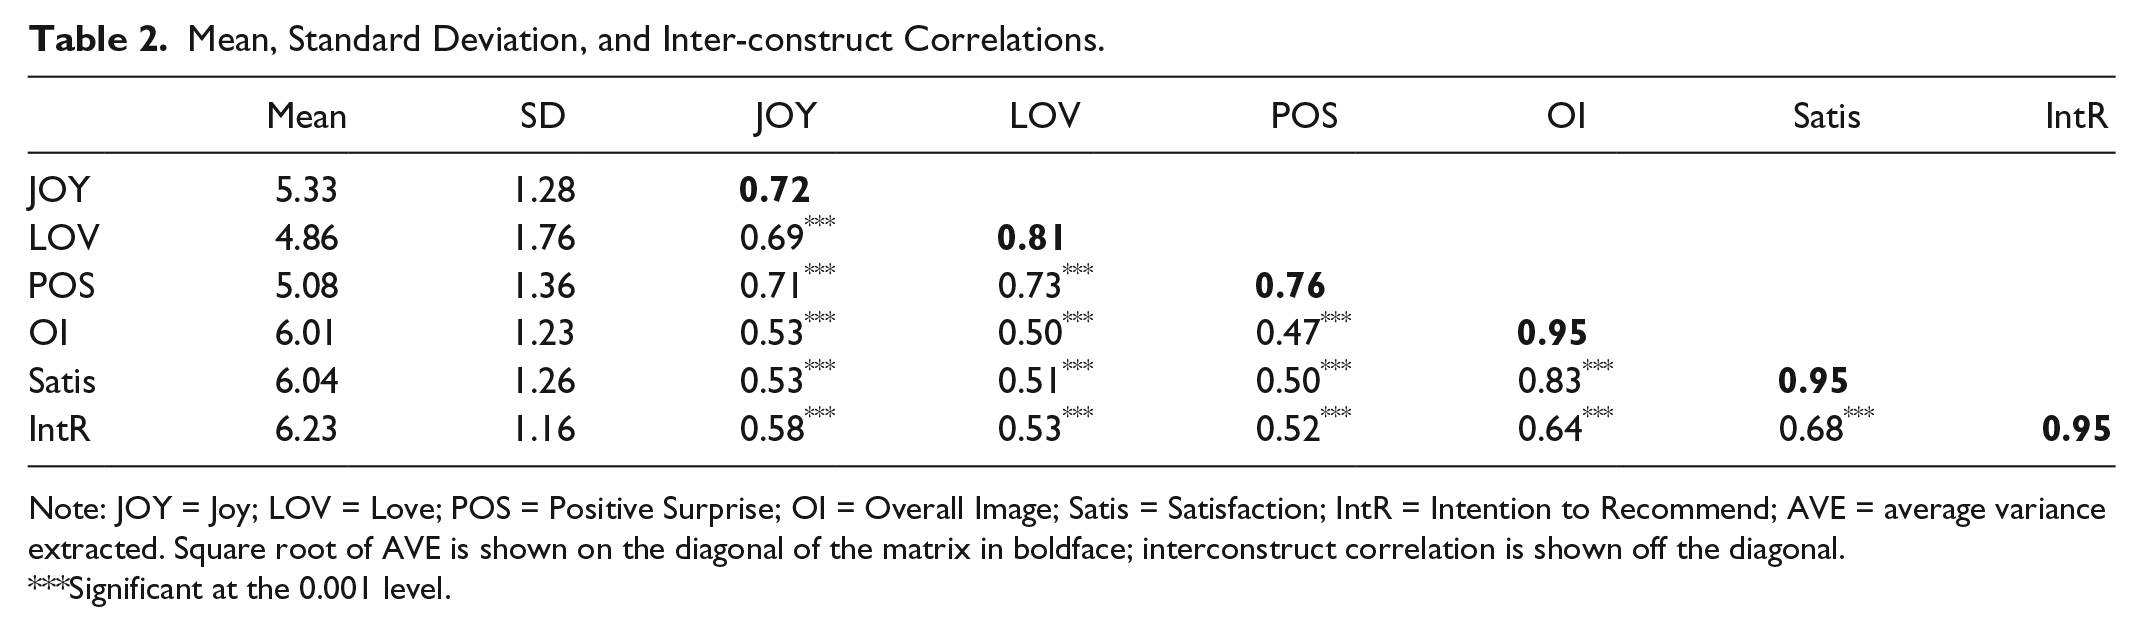
Note: JOY = Joy; LOV = Love; POS = Positive Surprise; OI = Overall Image; Satis = Satisfaction; IntR = Intention to Recommend; AVE = average variance extracted. Square root of AVE is shown on the diagonal of the matrix in boldface; interconstruct correlation is shown off the diagonal.
Significant at the 0.001 level.
From Table 1, for each construct, composite reliabilities estimates were above the recommended threshold of 0.70 (range from 0.84 to 0.96), indicating the measures are reliable (Fornell and Larcker 1981). Construct validity was assessed using convergent and discriminant validity. To establish convergent validity, the significance and magnitude of factor loadings were examined, together with average variance extracted (AVE). From Table 1, all factor loadings were greater than 0.55 and significant (p < 0.001), with t values exceeding the critical value of 3.29 (Tabachnick and Fidell 2007). AVE for each construct was above 0.50, establishing the scale’s convergent validity (Fornell and Larcker 1981). Discriminant validity was examined by comparing the square root of AVE for each construct with the correlations between pairs of latent variables. For adequate discriminant validity, the diagonal elements in Table 2 should be greater than the off- diagonal elements (Fornell and Larcker 1981). Comparing all correlation coefficients with square roots of AVEs in Table 2, the results suggest strong evidence of discriminant validity.
Structural Model and Hypothesis Testing
The hypothesized relationships were tested using structural equation modeling (SEM). Overall, the structural model achieves acceptable fit (χ2 = 425.16, df = 146, p < 0.001). The incremental fit measures (Tucker–Lewis index = 0.93, comparative fit index = 0.95 and incremental fit index = 0.95) were above 0.90 recommended values (Byrne 1998). Furthermore, the inference statistical tests reveal a satisfactory structural model with RMSEA = 0.075 and χ2/df = 2.91 below the tolerable values (RMSEA < 0.08, χ2/df < 3) (Byrne 1998). Standardized estimates path coefficients (see Table 3) establish a positive relationship between tourists’ emotions of joy (β = 0.435, p < 0.001) and love (β = 0.256, p < 0.001) and overall image. Emotions explain more than 25% of variance in overall image (R2 = 0.255). Findings thus support hypotheses 1 and 2 but not 3. Nonsignificant paths emerge for joy→satisfaction and love→satisfaction relationships, thus rejecting hypotheses 4 and 5. However, the relationship between positive surprise and satisfaction (hypothesis 6) is established (β = 0.159, p < 0.001). Results also confirm hypothesis 7 linking overall image to satisfaction (β = 0.782, p < 0.001). Together, tourists’ emotions (joy and love) and overall image as predictors explain a high proportion of variance in satisfaction (R2 = 0.746). Hypothesis 8, proposing a relationship between overall image and intention to recommend (β = 0.656, p < 0.001), is also supported. Finally, as theorized, the relationship between satisfaction and intention to recommend is positive and significant (β = 0.404, p < 0.001). Overall image and satisfaction explains 30.6% variance in intention to recommend. Further analyses reveal that the emotions of joy and love have an indirect effect on satisfaction via overall image (Table 3).
Results for the Hypothesized Model.
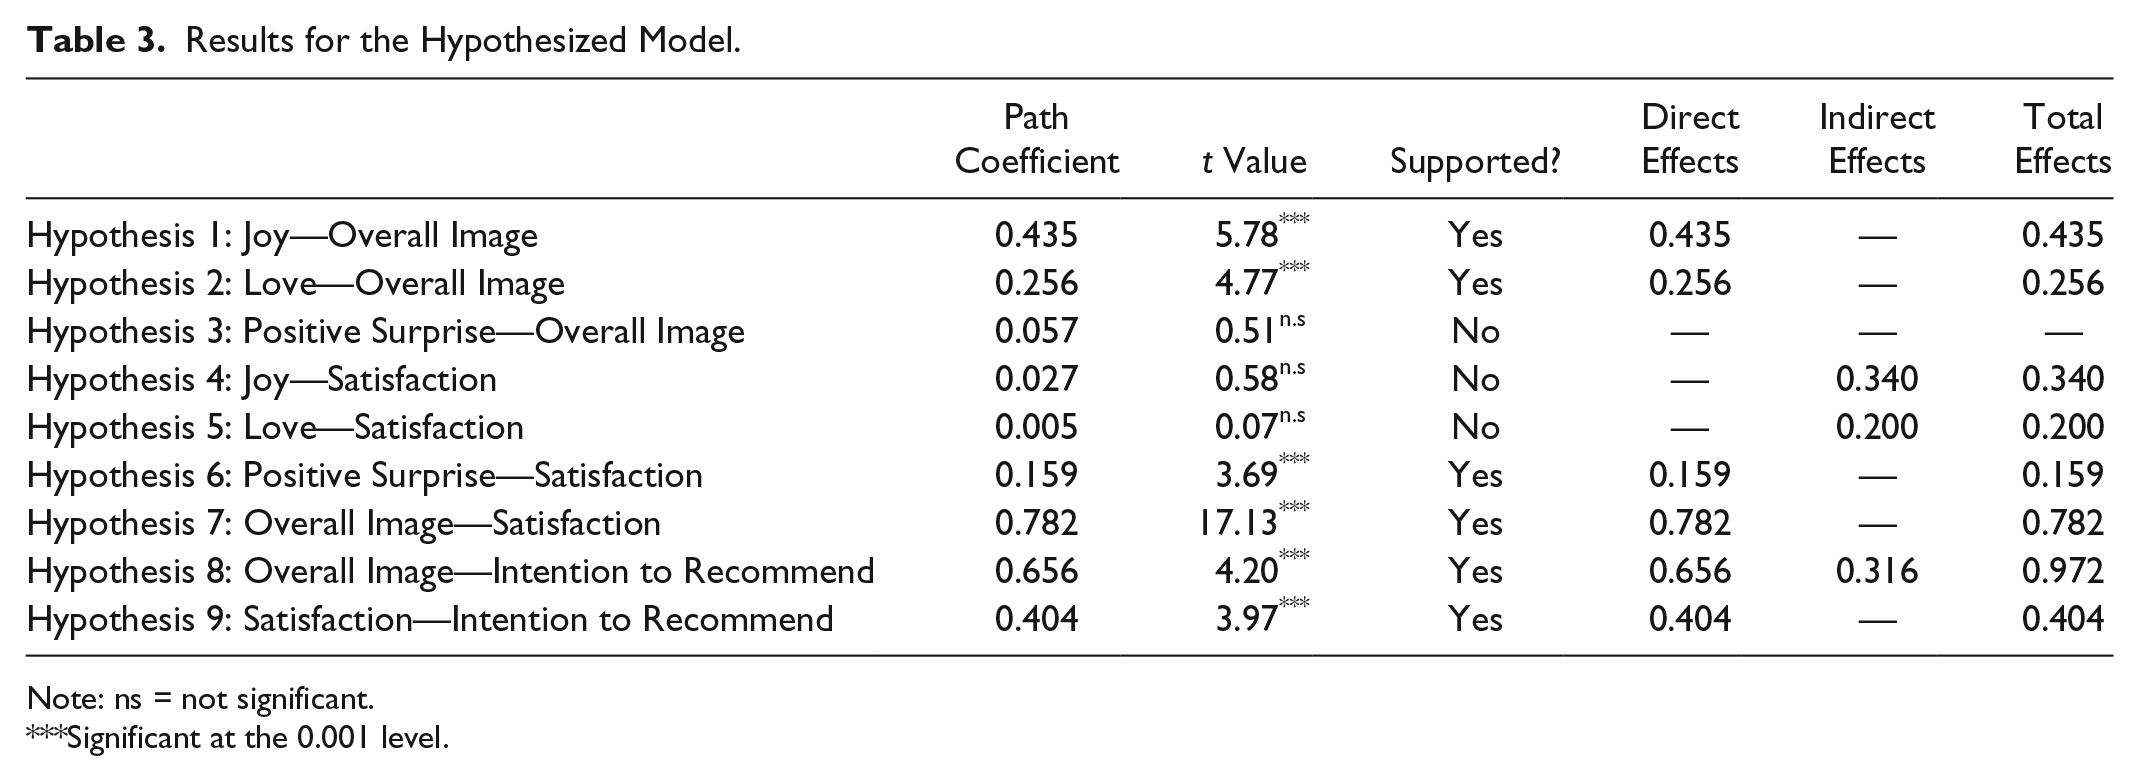
Note: ns = not significant.
Significant at the 0.001 level.
Discussions and Implications
In response to calls for tourism researchers (e.g., del Bosque and San Martín 2008; Chen and Phou 2013) to develop integrative models, the main objective of this study is to examine the relationship between tourists’ emotions, overall image, satisfaction, and intention to recommend. Extending current theorizations and congruent with research in marketing (e.g., Allen, Machleit, and Kleine 1992; Nyer 1997; Yu and Dean 2001), this study demonstrates the predictive power of emotions in tourist behavior models. In particular, the proposed integrative framework allows the identification of relationships between (1) specific emotional responses and perceived overall image; (2) perceived overall image and tourist satisfaction; (3) perceived overall image and intention to recommend; (4) specific emotional responses and tourist satisfaction; and (5) tourist satisfaction and intention to recommend. The results confirm that specific emotions are significant predictors of attitudinal and behavioral outcomes.
Empirical research in tourism investigating the direct relationship between emotions and destination image remains scant. Advancing knowledge, findings show that tourists’ emotional responses, in particular joy and love, positively influence overall image evaluations. Despite being core in understanding tourists’ emotional experiences (see Hosany and Gilbert 2010; Hosany et al. 2015; Lee and Kyle 2013), positive surprise does not exert a significant influence on perceived overall image. A plausible explanation relates to the complex nature of surprise as an emotion (Meyer, Reisenzein, and Schutzwohl 1997). Furthermore, congruent with prior studies (e.g., Machleit and Eroglu 2000; Prayag, Hosany, and Odeh 2013), findings show that emotional responses of the same valence have differential effects on the outcome variable satisfaction. Only positive surprise was related to tourist satisfaction (hypothesis 6). Prior consumer research establishes surprise as a key component of satisfactory consumption experiences (Westbrook 1987; Westbrook and Oliver 1991). Overall, from a methodological perspective, the results demonstrate that combining variables of similar valence into summary dimensions is inappropriate.
The nonsignificant paths joy–satisfaction (hypothesis 4) and love–satisfaction (hypothesis 5) are inconsistent with Faullant, Matzler, and Mooradian (2011) and Prayag, Hosany, and Odeh (2013) studies in tourism. A number of plausible reasons exist to explain these discrepancies. First, the research settings are dissimilar. Prayag, Hosany, and Odeh (2013) tested their model using data collected from tourists visiting a UNESCO world heritage site. Faullant, Matzler, and Mooradian (2011) demonstrated the link between joy and overall satisfaction in the context of adventure tourism (mountaineering), which may elicit more intense emotions than the vacation context. Second, the sample characteristics differ. For the current study, in contrast to Prayag, Hosany, and Odeh (2013), data were collected from domestic tourists. Faullant, Matzler, and Mooradian’s (2011) study focuses on a group of German-speaking tourists of various nationalities (Austrians, Germans and Italians). Prior research has established that differences in perceptions and evaluations exist between domestic and international tourists (Tasci and Gartner 2007; Yuksel 2004). Third, the inherent complexity, in terms of types and intensity, of tourists’ emotional experiences may account for these diverging results.
The study confirms the direct relationship between overall image and satisfaction (hypothesis 7), in line with previous research (e.g., Bigné, Sanchez, and Sanchez 2001; Prayag 2009; Wang and Hsu 2010). In addition, results support prior studies (Assaker, Vinzi, and O’Connor 2011; Bigné, Mattila, and Andreu 2008; Papadimitriou, Apostolopoulou, and Kaplanidou 2015) identifying a positive relationship between destination image and behavioral intentions (hypothesis 8). Specifically, overall image has both a direct and indirect effect on tourist’s propensity to recommend. The indirect path is via satisfaction. Finally, as hypothesized, a positive relationship was found between satisfaction and intention to recommend (hypothesis 9). Prior studies (Baker and Crompton 2000; Bigné, Sanchez, and Sanchez 2001; Chen and Tsai 2007; Engeset and Elvekrok 2015; Prayag, Hosany, and Odeh 2013) identify that satisfied tourists are more likely to say positive things about the destination to others.
From a methodological perspective, consistent with Faullant, Matzler, and Mooradian (2011) and Prayag, Hosany, and Odeh (2013), results show the merits of measuring specific emotions in tourism. Prior studies (e.g., Bigné, Andreu, and Gnoth 2005; del Bosque and San Martín 2008; Grappi and Montanari 2011) adopt a valence-based method (positive and negative or pleasure and arousal) in theorizing emotions. Such research tradition, however, oversimplifies the complexity of emotional experiences (Bagozzi et al. 2000; Rucker and Petty 2004) and fails to adequately capture the consequences of same valence emotions (e.g., joy and love). As the findings of this study indicate, joy, love, and positive surprise have differential effects on both overall image and satisfaction. Tourism researchers should be cautious not to collapse emotions into summary dimensions (positive vs. negative). Such approach masks important relationships between specific emotions and the global evaluative variables satisfaction and behavioral intentions (Machleit and Eroglu 2000; Zeelenberg and Pieters 2004) and lead to erroneous conclusions.
Managerial Implications
From a practical point of view, the results offer important marketing implications for tourist destinations, in particular for Sardinia. Findings show tourists’ emotions favorably influence evaluation of overall image and satisfaction. It is important for marketers and specialist organizations, such as travel agencies and tour operators, to promote a holistic and consistent image (Qu, Kim, and Im 2011) based on specific emotions a destination elicits. Marketing campaigns should emphasize the types of emotional experiences that can be evoked by the destination (such as joy and love). In particular, tourism providers should strive to activate, stimulate, and promote positive emotions (such as joy and love) through advertising appeals. To instigate an emotional appeal, many tourist destinations around the world have successfully employed sophisticated imagery, visual effects, and music in their advertising. Examples include Australia’s “There’s Nothing Like Australia” and Cyprus “In Your Heart” promotional campaigns. Recent evidence shows that advertising campaigns with emotional appeals are effective in influencing tourists’ motivations (Min, Martin, and Jung 2013).
Findings of this study show positive surprise as the only emotion significant in predicting tourist satisfaction. Surprising consumers is an important strategy in creating memorable experiences (Vanhamme 2008). Previous research demonstrates that positive (pleasant) surprise is often associated with consumer delight (Berman 2005; Finn 2005; Oliver, Rust, and Varki 1997). Marketers and local businesses should aim to create on-site experiences that exceed expectations and delight tourists. In the case of Sardinia, various stakeholders should collaborate to develop tourism programs incorporating “unexpected” and “spurring” events/activities. Surprising tourists will also require destinations to innovate in terms of their offerings. For example, tourists visiting Sardinia should be offered opportunities to interact with local communities in order to cocreate the lived experiences. However, it is a challenge for destinations to effectively design new surprising strategies, especially among repeat tourist groups. Over time, experiences that were once deemed “surprising” become mundane encounters (Rust and Oliver 2000).
Limitations and Directions for Future Research
Building on existing conceptualizations of satisfaction and behavioral intentions, the study tested a model linking tourists’ emotional responses, overall image, satisfaction, and intention to recommend. The results of the study should be interpreted with caution for a number of reasons. First, the relatively small sample size does not allow for generalization of the model beyond the context of Sardinia. In addition, given the lack of official demographic data about domestic tourists visiting Sardinia, it is difficult to establish the sample representativeness. Future research should test the model in other locations of differing geographical sizes. Second, the study focuses on domestic tourists visiting Sardinia. Replication on international tourists is likely to produce different results in terms of the hypothesized relationships. Prior research shows that domestic tourists have different image perceptions (Bonn, Joseph, and Dai 2005; Tasci and Gartner 2007) and satisfaction levels (Yuksel 2004) compared to international tourists. Third, destination image was operationalized as an overall postconsumption evaluative construct. Yet, destination image is recognized as an influential pull factor in tourists’ choice processes (Baloglu and McCleary 1999; Beerli and Martin 2004; Prayag and Ryan 2011). Tourists are motivated to travel in anticipation of positive emotions during their holidays (Nawijn 2011; Sirgy 2010). Future studies should investigate the relationship between tourists’ pretravel images and emotional experiences.
Furthermore, similar to destination image, satisfaction was operationalized at the global level. Although, global satisfaction measurements produce more stable relationships with behavioral intentions (Zhang et al. 2014), future studies could adopt an attribute-level conceptualization of satisfaction (e.g., Chi and Qu 2008; Eusébio and Vieira 2013). Fifth, expanding on the model proposed in this study, future research could include other relevant variables such as appraisal determinants of tourists’ emotional experiences (see Hosany 2012), destination personality, and tourists’ motivations. Finally, emotions were measured retrospectively using self-report. Memories of emotions often provide inaccurate accounts of actual experiences (Levine 1997; Thomas and Diener 1990; Wirtz et al. 2003). In addition, emotions are dynamic and time-dependent (Kuppens, Stouten, and Mesquita 2009). Throughout the vacation, tourists’ self-reported emotions vary in type and intensity (Lee and Kyle 2012; Lin et al. 2014; Nawijn et al. 2013). Future studies should attempt to capture tourists’ emotions in real time (see Kim and Fesenmaier 2015 for a recent and novel application of physiological emotion measures in tourism and Li, Scott, and Walters 2015 for a review of current and potential methods to measure emotion in tourism).
Footnotes
Declaration of Conflicting Interests
The author(s) declared no potential conflicts of interest with respect to the research, authorship, and/or publication of this article.
Funding
The author(s) received no financial support for the research, authorship, and/or publication of this article.