
Abstract
Conversion studies are a standard technique by which marketers evaluate advertisement effectiveness. A review of the tourism literature finds that advertising conversion studies use a number of metrics that have evolved to include most aspects of visitor decisions; however, this literature also indicates that there are few comparative studies focusing on the variability of response. The overall goal of this study is to identify and compare estimates of impact on visitor expenditures using four different approaches ranging from traditional advertising models (i.e., gross conversion rate and net conversion rate) to a more comprehensive facets-based destination advertisement response (DAR) model. The various models result in a huge range of impact estimates and it is concluded that the DAR model offers, both theoretically and practically, a powerful framework for evaluating advertising response in that it incorporates the possibility that destination advertising affects decisions related to a range of trip-related activities.
Keywords
Introduction
Destination marketing organizations (DMOs) promote their destinations in a number of ways, including tourism destination advertising, promotional activities, and sponsoring events. Among these, tourism destination advertising is one of the most important and visible marketing practices used to attract potential travelers to a destination. Indeed, over 40 years of research has demonstrated that tourism destination advertising can inspire travelers to extend their length of stay, change their plans for activities, and eventually increase their overall expenditures while visiting a destination (Kim, Hwang, and Fesenmaier 2005; Park, Nicolau, and Fesenmaier 2013; Pratt et al. 2010; Stienmetz, Maxcy, and Fesenmaier 2015).
Given the high potential impact of destination advertising, advertising conversion studies have become a standard technique by which marketers evaluate the effectiveness of their efforts. Recent research has been conducted to increase the usability and practical relevance of advertising conversion studies by considering the single versus bundling effect (Park and Nicolau 2015), the use of eye-tracking methods (Scott, Green, and Fairley 2015), and the development of the destination advertising response (DAR) model and its extensions (Choe, Stienmetz, and Fesenmaier 2013, 2014a, 2014b; Park, Nicolau, and Fesenmaier 2013; Stienmetz and Fesenmaier 2014; Stienmetz, Maxcy, and Fesenmaier 2015).
In particular, Stienmetz and his colleagues argue that the DAR model improves the accuracy and reliability of the estimates of destination advertising impact by integrating several trip-related decisions (i.e., decisions related to attractions, restaurants, hotels, events, and shopping) within the evaluation framework. However, while the DAR model appears to better reflect the role of advertisements in travel planning and decision-making processes, research has not been conducted to evaluate the differences between the alternative approaches in assessing the most important advertising metric—the amount of money spent as the result of destination advertising. Thus, the goal of this study is to compare the differences in estimated advertising impact (i.e., estimates of total visitor expenditure induced by destination advertising) for four alternative conversion analysis approaches. By evaluating the variation in impact estimates among these conversion approaches, we improve our understanding of the strengths and weaknesses of each approach to advertising evaluation, which, consequently, will enable us to develop more effective destination advertising campaigns.
Theoretical Foundations
Marketing practitioners often develop and execute a communications plan to promote their products, increase brand equity, and differentiate products against competitors, which in turn leads to improved competitiveness and increased marketing performance (Boulding, Lee, and Staelin 1994; Rust et al. 2004). Among several strategies, advertising is often one of a firm’s most important marketing expenditures because it has a potential to impact the entire market as well as each individual customer in the long term (Ambler 2008; Boulding, Lee, and Staelin 1994). In the tourism industry, destination marketers use destination advertising to stimulate travelers to visit the destination and to change travelers’ behaviors during their visit to the destination (e.g., length of stay, activities, and expenditures) so as to create substantial economic impact (Kim, Hwang, and Fesenmaier 2005; Park, Nicolau, and Fesenmaier 2013; Park and Nicolau 2015; Pratt et al. 2010; Wöber and Fesenmaier 2004).
Research in advertising evaluation has grown substantially over the past several decades in search of identifying the underlying mechanisms of persuasion and on developing appropriate measures of response. Lavidge and Steiner (1961) first proposed a hierarchical sequence of advertising effects from awareness of advertising through knowledge, liking, preference, conviction, purchase intention, and finally actual purchase. This model integrates three distinctive (and important) dimensions of consumer behavior (i.e., cognitive, affective, and conative components) explaining the underlying psychological processes of persuasion. The cognitive component is the first step of an individual’s decision making relating to tourism advertising influence in which an individual is made aware of a particular destination and/or has sufficient knowledge about the destination. The affective component encompasses an individual’s emotional and feeling states and strongly relates to destination choice in that liking and preference may eventually evoke favorable attitudes toward the destination and destination advertising. Finally, the conative component is associated with conviction and/or the purchase of a particular product, and is driven by both the cognitive and affective components in that it closely relates to the tendency to induce the motivation and/or make a trip-related decision (Lavidge and Steiner 1961). Most advertising studies in tourism have adopted this hierarchy-of-effects model to describe the linkages between attitudinal and behavior components, visitation, and expenditures (Kim, Hwang, and Fesenmaier 2005; McWilliams and Crompton 1997; Park, Nicolau, and Fesenmaier 2013; Siegel and Ziff-Levine 1990).
Many methodological approaches have been used to assess the effectiveness of destination advertising campaigns including conversion studies, advertising tracking studies, true and quasi- experiments, econometric modeling, and aggregated buyer-purchase modeling (McWilliams and Crompton 1997; Siegel and Ziff-Levine 1990; Silberman and Klock 1986; Woodside 1990, 2010). An extensive review of these studies was undertaken to identify the methods used most frequently. The literature search process employed a keyword search strategy in Web of Science and Google Scholar based upon a combination of the four words: advertising, advertisement, tourism, and destination. Once the articles were identified this study then scanned their references so as to identify additional articles. This effort resulted in a total of 82 published articles that are summarized in Tables 1 and 2.
Selected Tourism Advertising Research and Methods (n = 82).
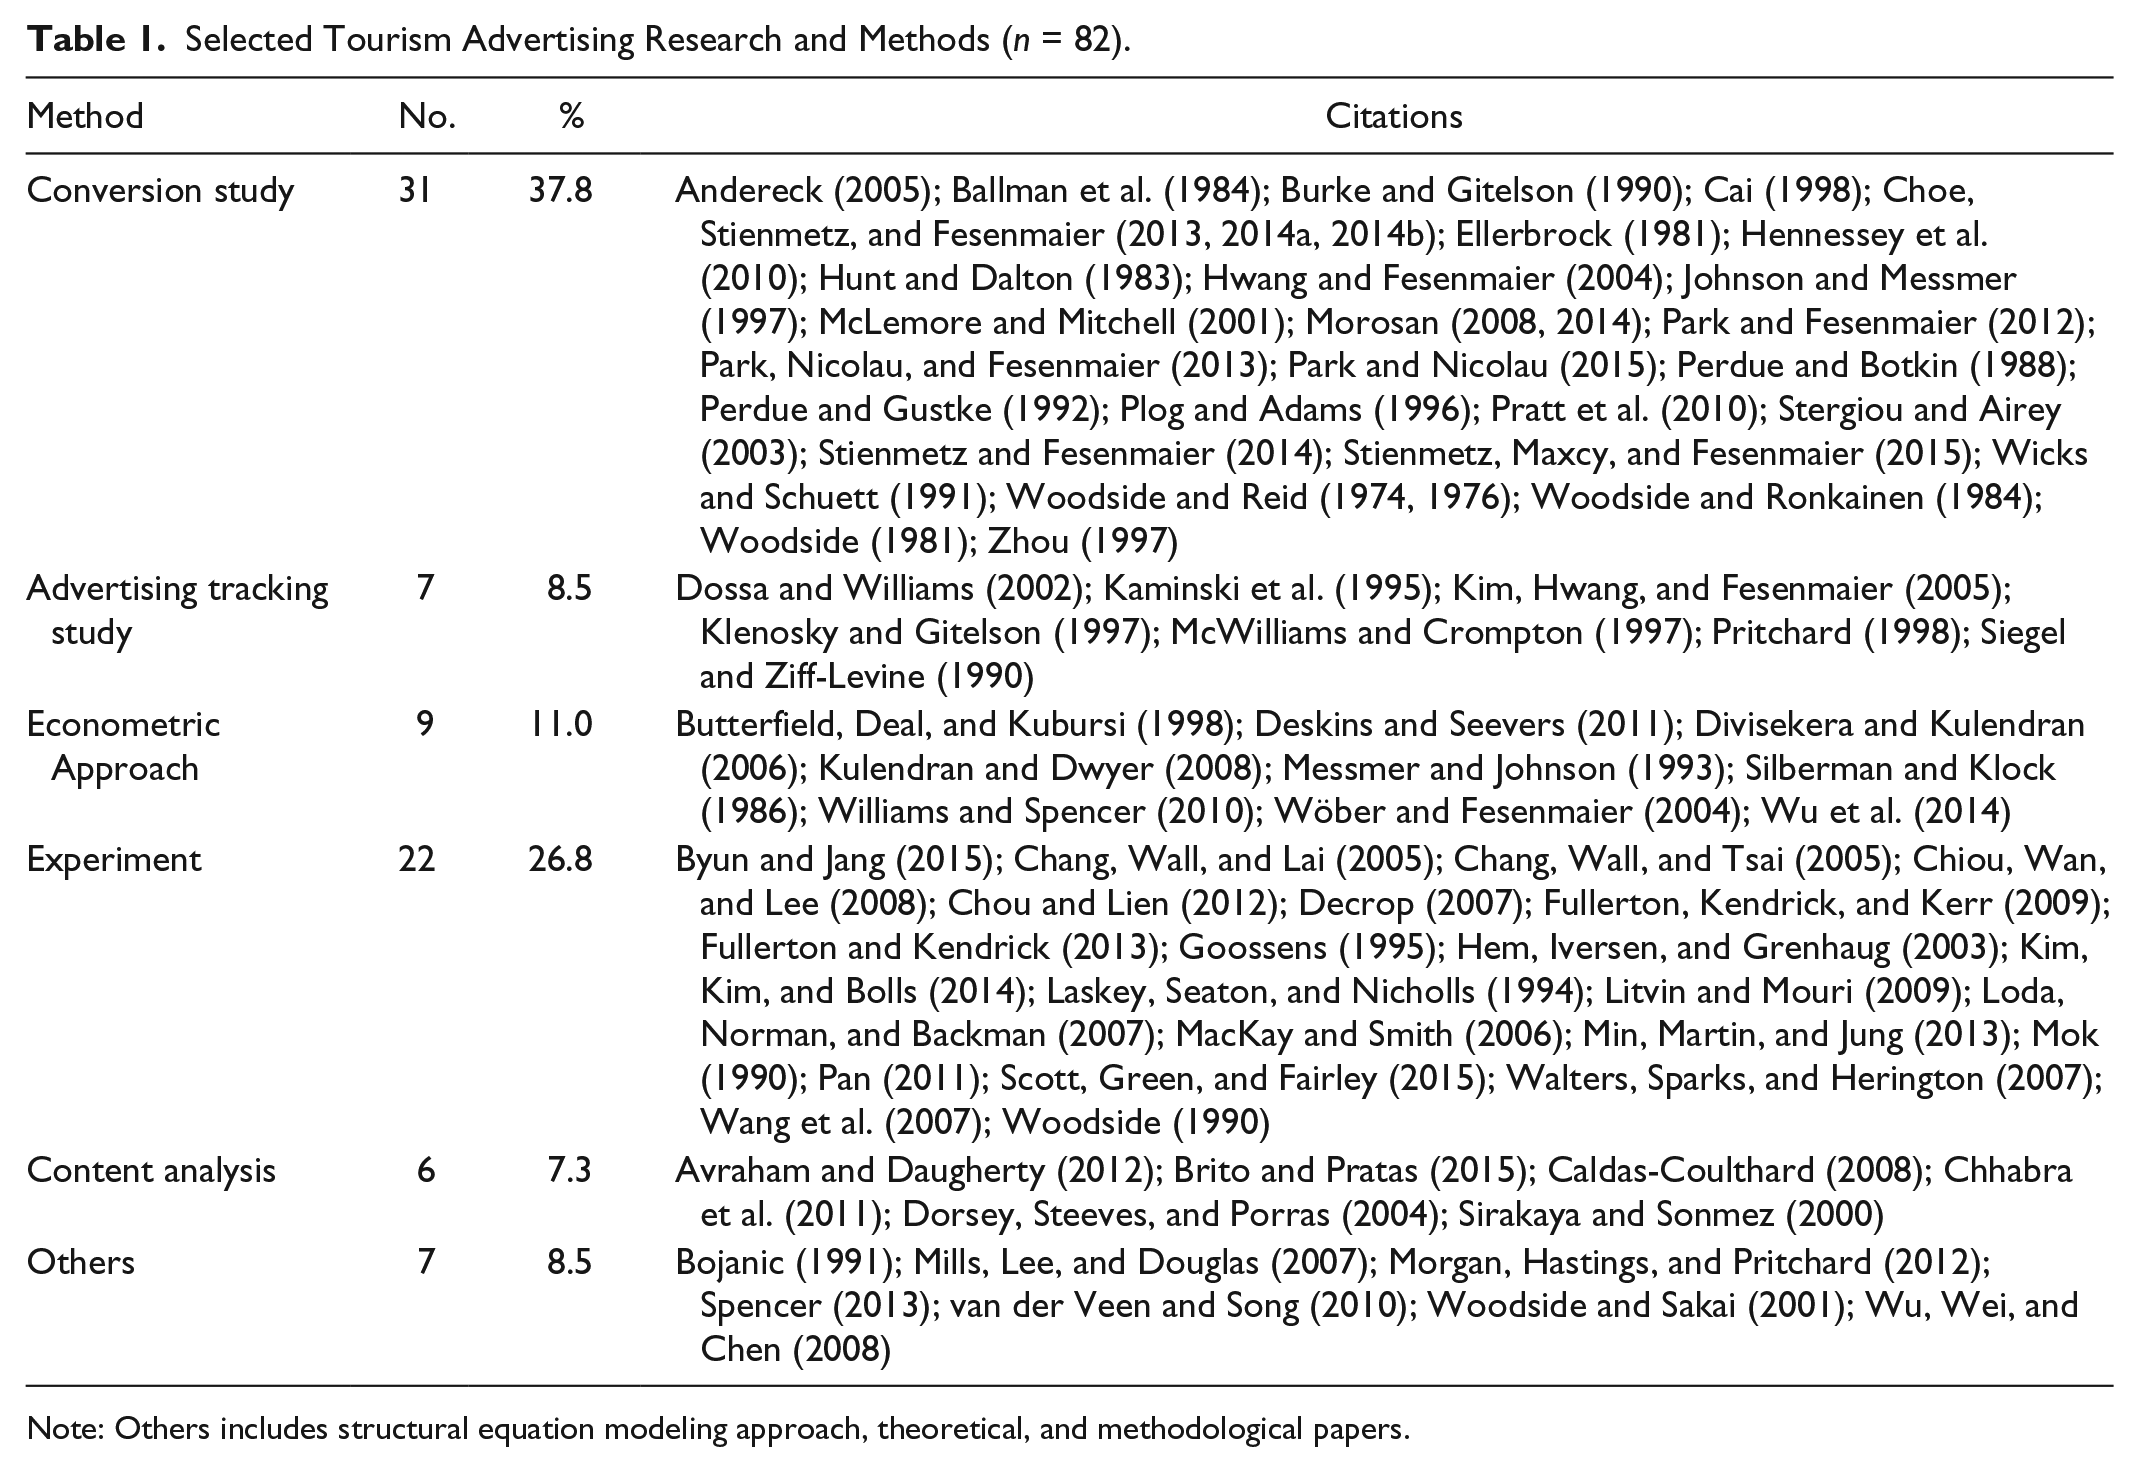
Note: Others includes structural equation modeling approach, theoretical, and methodological papers.
Trends in Research Method Used in Tourism Advertising Studies.
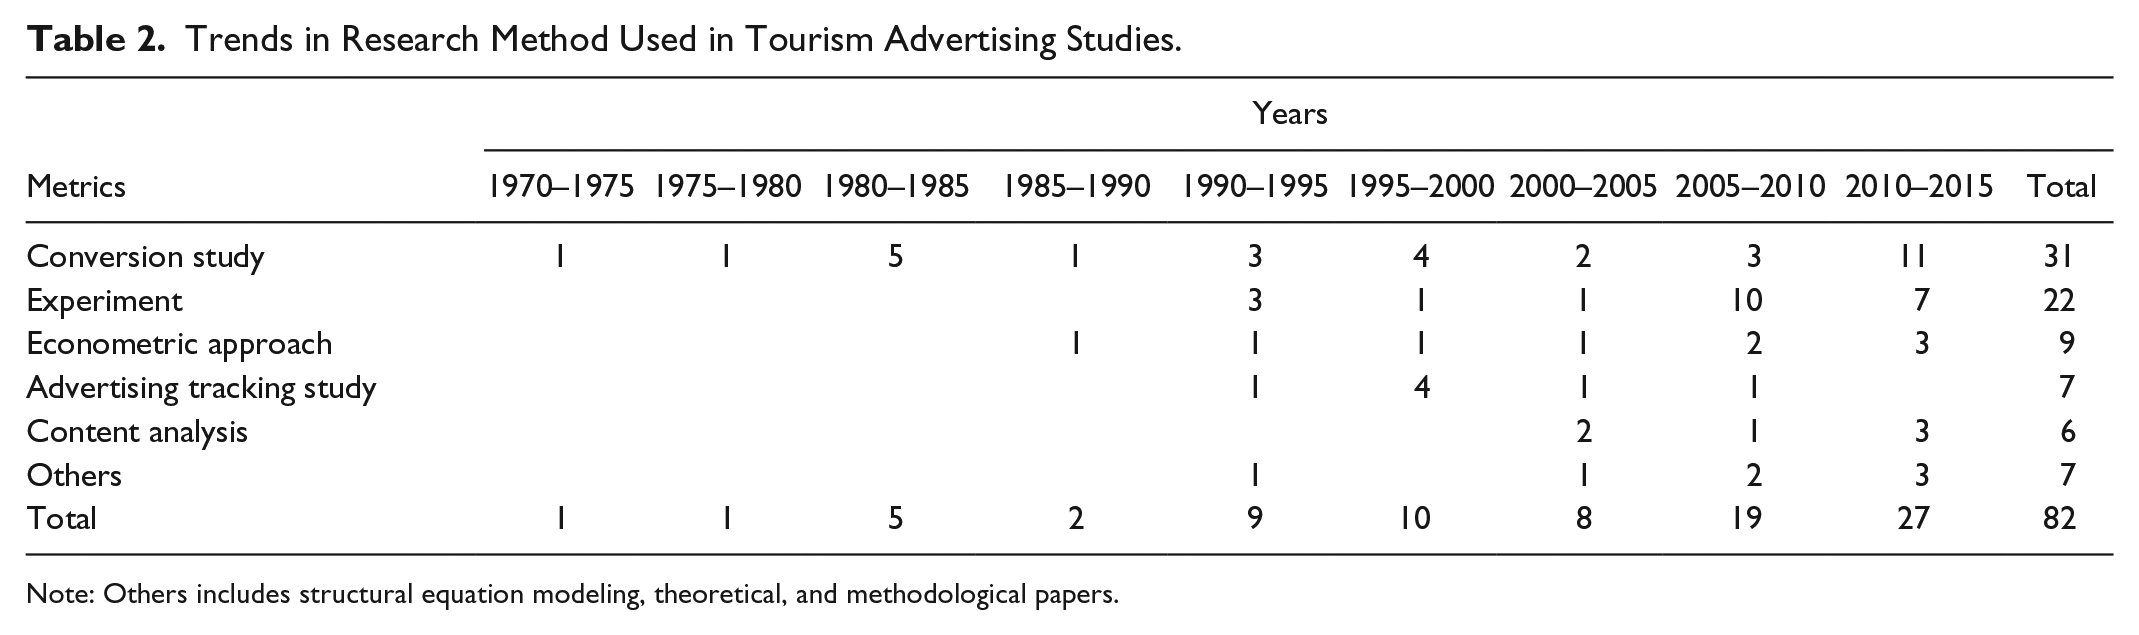
Note: Others includes structural equation modeling, theoretical, and methodological papers.
As can be seen, conversion studies have a long history in tourism advertising research (the first paper appeared in 1974) and was the most “popular” method between 2010 and 2015 (40.7% of total studies during this period). Experimental design is another popular method for understanding tourism advertising (26.8%) that identifies potential ways to increase tourism advertising effectiveness through changes in message format, language, photos, and distribution channels. After 2000, the use of experimental methods was reported more frequently than conversion studies (18 experiment-based studies vs. 16 conversion studies). Interestingly, advertising tracking studies, which utilize a probability sample of the target market audience to examine changes in awareness, image, knowledge, and intention to visit the destination as a result of destination advertising, were popular during the period between 1995 and 2000, but have not been published recently in tourism journals. Econometric studies (11.0%), on the other hand, have appeared much less frequently in the tourism literature and tend to focus on the linkages between advertising expenditures and tourism demand, revenue, and return on investment. Last, only a few recent studies have used content analysis to understand and evaluate the characteristics of tourism brochures and slogans and tourism advertising response (7.3%).
While each of these approaches has its own strengths and weaknesses, the popularity of the conversion study approach is due in great part to its straightforward methodology, which is easy to implement (Kim, Hwang, and Fesenmaier 2005; Pratt et al. 2010). In order to obtain information regarding visitor characteristics and trip behaviors and to assess the effects of advertising programs, conversion studies use a survey of those persons requesting information from the destination marketing organization. Importantly, a “conversion” is determined by asking the survey respondent whether he/she visited the destination as a result of being exposed to the advertising message (Perdue and Pitegoff 1990; Woodside and Reid 1974; Woodside 2010). From the marketers’ perspective, conversion studies are relatively inexpensive, provide feasible results (e.g., economic impact and return on investment), and are easy to interpret (Burke and Gitelson 1990; Cai 1998).
Among conversion studies, many different metrics has been used to measure the effectiveness of tourism advertising. As shown in Table 3, approximately one-third of the conversion studies (32.3%) consider only Gross Conversion Rate (GCR)—the percentage of travelers that requested travel information and then traveled to the destination—and have appeared in tourism journals starting from early 1970. In the early and mid-1980s there was a debate focusing on the definition of “conversion” (Burke and Gitelson 1990); these articles concluded that GCR was inappropriate because it included visitors that were not influenced by tourism advertising (i.e., some requested travel information after deciding to visit the destination) and, therefore, potentially inflates estimates of advertising response. The Net Conversion Rate (NCR) was proposed to adjust the GCR by excluding those who had planned their trip before exposure to tourism advertising (Ballman et al. 1984; Burke and Gitelson 1990; Ellerbrock 1981; Stergiou and Airey 2003). After these early studies, researchers used both GCR and NCR for estimating tourism effectiveness (22.6%). Moreover, there is another metric called the Net Influence Rate (NIR) wherein both timing and perceived influence of the destination advertising are considered, and where all trip expenditures are included as the metric of impact. Yet it appears that NIR has rarely been applied in actual conversion studies because it provides the most “conservative” (i.e., the lowest) estimate of marketing influence on visitor expenditures as compared to GCR and NCR.
Trends in Advertising Evaluation Metrics Used in Tourism Journals.
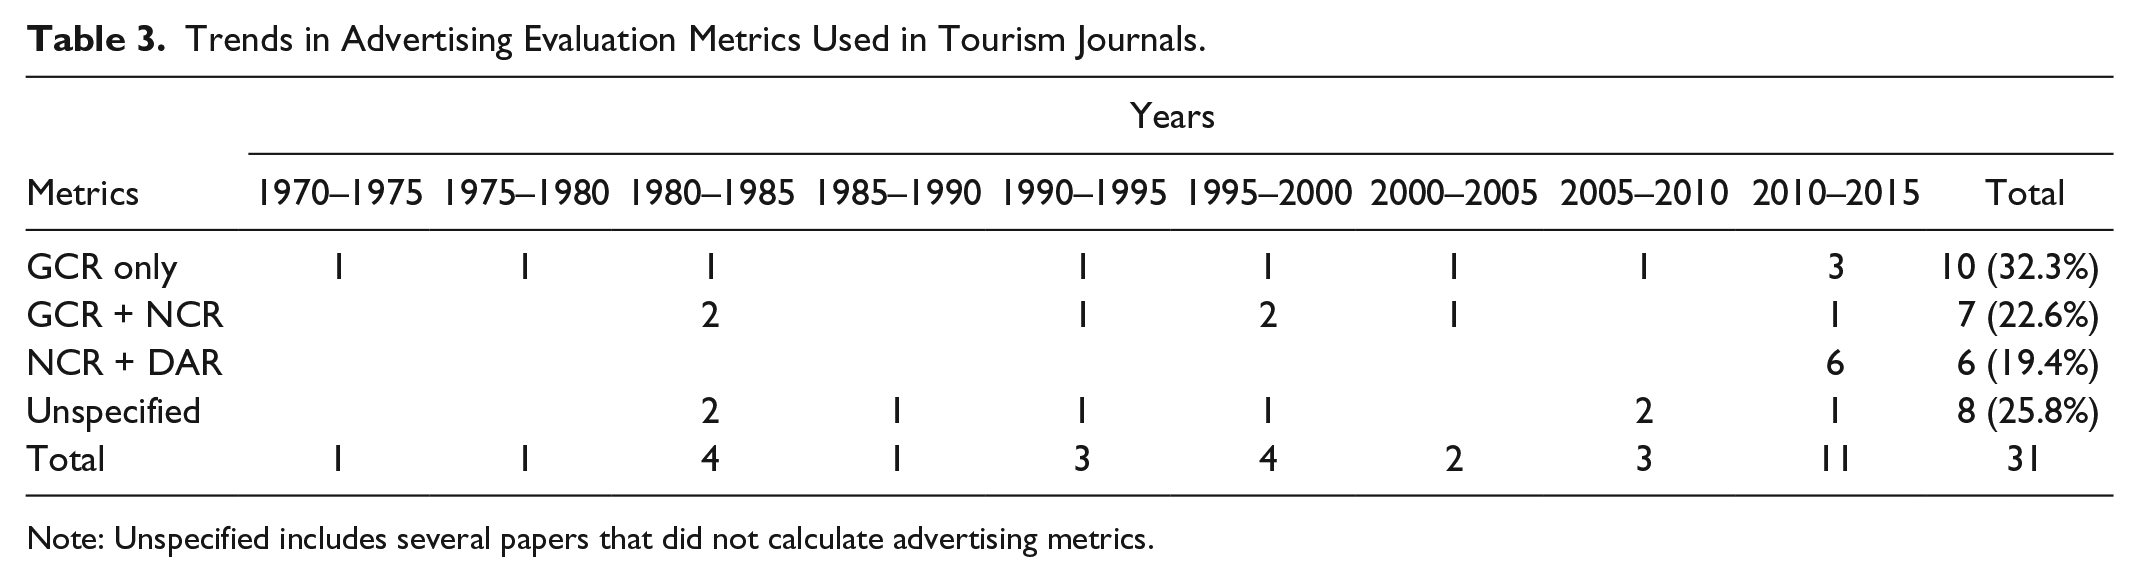
Note: Unspecified includes several papers that did not calculate advertising metrics.
The GCR, NCR, and NIR approaches, however, are often criticized in that they focus solely on destination choice rather than on the many decisions that comprise a trip. On the basis of these criticisms, Park, Nicolau, and Fesenmaier (2013) proposed a facet-based advertising evaluation framework in order to better reflect travelers’ actual response to advertisements by incorporating the role of trip-related decision facets (e.g., destination choice as well as trip decisions to visit featured attractions, accommodation, restaurants, events, and shopping). More recently, Stienmetz, Maxcy, and Fesenmaier (2015) examined the viability of the proposed destination advertising response (DAR) model by conducting a series of empirical analyses examining the relative impact of each decision facet on visitor expenditures, as well as the importance of various advertising channels in these decisions.
The basic assumption of the DAR model is consistent with earlier advertising studies (Macinnis and Jaworski 1989; Mehta 1994) whereby potential travelers are exposed to tourism advertising, which in turn eventually “causes” change in attitudinal formation and behaviors. However, the DAR model differs from traditional advertising models (i.e., conversion studies) in two important ways. First, the DAR model incorporates many trip-related decision facets based on the assumption that travelers follow a hierarchical structure of the decision-making process. Second, the “core” decisions (e.g., destination, accommodations) made in the earlier stages strongly influence later decisions (Choi et al. 2012; Hwang and Fesenmaier 2011; Jeng and Fesenmaier 2002). Importantly, this model can be used to estimate the marginal contribution of each trip-related decision facet to overall trip expenditure (Becker 1971; Lancaster 1971). The DAR model has been supported by several recent studies demonstrating that travelers’ facet-based responses to tourism advertising can differ significantly based on destination advertising (Stienmetz, Maxcy, and Fesenmaier 2015), the channels and sources people use to guide their trip decisions (Stienmetz and Fesenmaier 2014), previous visits made to the destination (Choe, Stienmetz, and Fesenmaier 2014a), and physical distance from origin to destination (Choe, Stienmetz, and Fesenmaier 2014b).
While the research by Stienmetz and his colleagues advocates for a facet-based approach, they have not provided an estimate of advertising impact using this approach. Indeed, while many tourism advertising studies have used both GCR and NCR, there are no studies comparing the estimates resulting from each approach. Thus, the goal of this article is to identify and compare estimates of visitor expenditures induced by destination advertising based on GCR, NCR, NIR, and the facets-based approach (i.e., the DAR model) as proposed by Stienmetz, Maxcy, and Fesenmaier (2015).
Methodology
Travelers’ responses to destination advertising were obtained using an online survey of American travelers who had requested travel-related information via a destination advertising website in response to one of 75 destination marketing programs. These online marketing programs were all conducted by Madden Media, Inc., on behalf of 30 different state and regional tourism offices located throughout the United States between April 2012 and September 2014. In total, 487,241 online survey invitations were successfully delivered via email; a $100 Amazon.com gift card was provided to one randomly selected respondent for each program. These efforts resulted in 30,814 usable responses, representing a 6.3% response rate.
The same questionnaire was used to evaluate all 75 online advertising programs and included several questions related to advertising response based on previous studies (Stienmetz, Maxcy, and Fesenmaier 2015). In particular, the timing of advertising exposure, the degree to which the advertising affected the trip decision, the impact of destination advertising on trip-related (facet) decisions, and whether travelers altered (i.e., increased, decreased, or stayed-the-same) the number of attractions visited in response to advertisements were all measured. Additionally, questions regarding total trip expenditures and various aspects of the trip such as overall length, the nature of travel, travel group, and satisfaction were also included in the survey.
The above measures of advertising response used two different formats. Specifically, for assessing the impact of advertising on destination choice, respondents were asked on a five-point scale the likelihood that they would have visited the destination even if they had not seen the advertising. A dichotomous variable was created whereby those responding “definitely yes” or “probably yes” were given values of 1, and those responding “maybe no,” “definitely no,” or “not sure” were given values of 0. Timing of the destination decision was assessed by asking the respondent “When was your destination decision made?” with the response options of “before seeing the advertising,” “after seeing the advertising,” or “not certain.” The impact of advertising on each trip-related decision was assessed by asking the respondent whether or not (yes = 1, no = 0) the destination advertising they saw somehow influenced (1) the attractions they visited, (2) the accommodations where they stayed overnight, (3) the events they visited, (4) the places they went shopping, and (5) the restaurants at which they ate. Additionally, the survey included a follow-up question asking the respondent to indicate whether or not (yes = 1, no = 0) they increased (or decreased or stayed the same) the number of attractions they visited as the result of the advertising they saw.
Because of the relatively low response rate, which can be problematic for accurate estimates of advertising conversion (Dolnicar, Laesser, and Matus 2009; Pan 2010), analyses were then performed to test the impact of nonresponse bias on variables of interest in this study (e.g., conversion ratio and trip expenditure). Specifically, this study used the inverse propensity scores as a weighting adjustment technique to quantify any possible nonresponse error (Rosenbaum and Rubin 1984). The collected data were then reweighted based on several known characteristics of the study population (i.e., PRIZM segment, market area, the state of residence, and advertising campaign), as described in Park and Fesenmaier (2012). The unweighted and weighted samples were compared to determine whether or not nonresponse statistically significant bias was present in a given survey. The results of this process indicate that the unweighted and weighted samples are statistically stable in terms of gender (chi-square = 1.885, df = 1, p = .170), age (chi-square = 1.903, df = 5, p = .862), and household income (chi-square = 3.335, df = 8, p = .912). An additional chi-square analysis for trip decision facets (chi-square = 0.701, df = 5, p = .983) reveal that there are no statistical differences in the conversion ratios between the unweighted and weighted samples. However, a statistically significant (t = 2.690, df = 23,291, p = .007) difference for average trip expenditure of $42.96 was found between the unweighted sample ($939.71) and the weighted sample ($982.67). This finding indicates that use of the unweighted sample results in an underestimation of approximately 4.4% and, therefore, the results discussed in this paper are based on a weighted sample that corrects for nonresponse bias. Once nonresponse bias was corrected for, analysis of variance (ANOVA) and independent sample t-tests were conducted to compare advertising response and trip expenditures among three visitor groups as defined by the timing of exposure to destination advertising and advertising impact on the destination decision. Last, a series of estimates of advertising response (i.e., GCR, NCR, NIR, and DAR) were calculated based on an assumption of 1 million travelers visiting a hypothetical destination.
Research Findings
Figure 1 summarizes the grouping of travelers based on the timing of exposure to destination advertising and then timing of the destination decision. Group 1 (1.6% of the sample) includes respondents reporting that the advertising they saw before deciding where to travel somehow influenced their decision to visit the destination. Respondents comprising group 2 (3.8% of the sample) saw advertising before deciding where to travel, but indicated that their destination decision was not at all influenced by advertising. Last, those in group 3 (30.8% of the sample) include the visitors that indicated they saw the destination advertising only after deciding to visit the destination. Based on these distinctions, visitors included in all three visitor groups were used to calculate the gross conversion rate (GCR). The analyses of the 75 destination advertising campaigns (based on the responses of the 30,814 respondents) found an overall GCR of 36.2% (11,161 actual visitors), while the GCR for individual campaigns ranged from a low of 11.7% to a high of 59.9%. Based on groups 1 and 2, the overall net conversion rate (NCR) for the 75 marketing programs was 5.4%, with the NCR values for individual programs ranging from a low of 0.0% to a high of 13.9%. Finally, the net influence rate (NIR) is represented exclusively by those respondents in group 1; as such, the overall NIR for the 75 marketing programs was 1.6%, with the NIR of individual programs ranging from 0.0% to 8.3%.
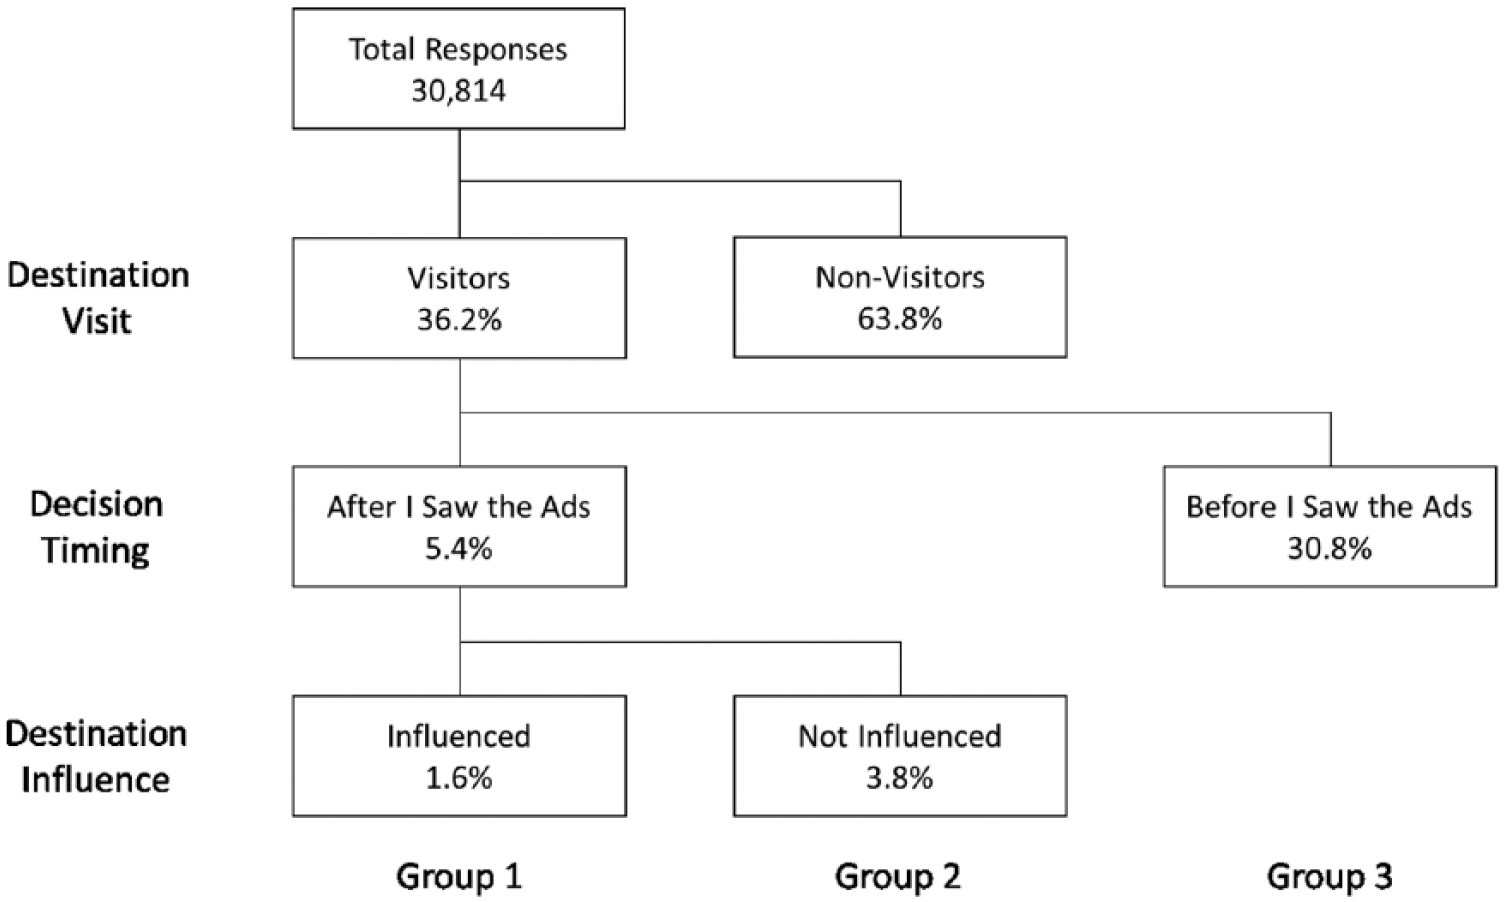
Overall advertising response in terms of decision timing and effects on destination decision.
Following Stienmetz, Maxcy, and Fesenmaier (2015), it is argued that destination advertising has the potential to substantially affect many trip-related facet decisions beyond destination choice that, in turn, increases (or decreases) the amount of money spent while visiting the destination. As such, those visitors in groups 2 and 3 (and their decisions in response to destination advertising) potentially represent a significant level of unaccounted advertising impact. Following this logic, this study used the DAR model as the basis to estimate the average conversion rates for five trip-related decisions (attractions, restaurants, events, shopping, and accommodations) as well as the marginal impact of those facet decisions on average trip spending. Specifically, the DAR-based conversion rates are calculated as the percentage of travelers whose facet decision(s) (i.e., what attractions, restaurants, hotels, events, and shopping places to visit) were influenced by tourism advertising as compared to all travelers who were exposed to tourism advertising. Table 4 shows that attractions (16.5% overall) and restaurants (13.3% overall) are the two trip decision facets that are most often influenced by tourism advertising, while events (9.0% overall) is the least influenced component of a trip. This result is consistent with Stienmetz, Maxcy, and Fesenmaier (2015), indicating that tourism advertising influences each trip decision to varying degrees and that destination advertising is most likely to influence choice of attractions, restaurants, and hotels.
Trip Spending Based on Facet-Based Advertising Response.
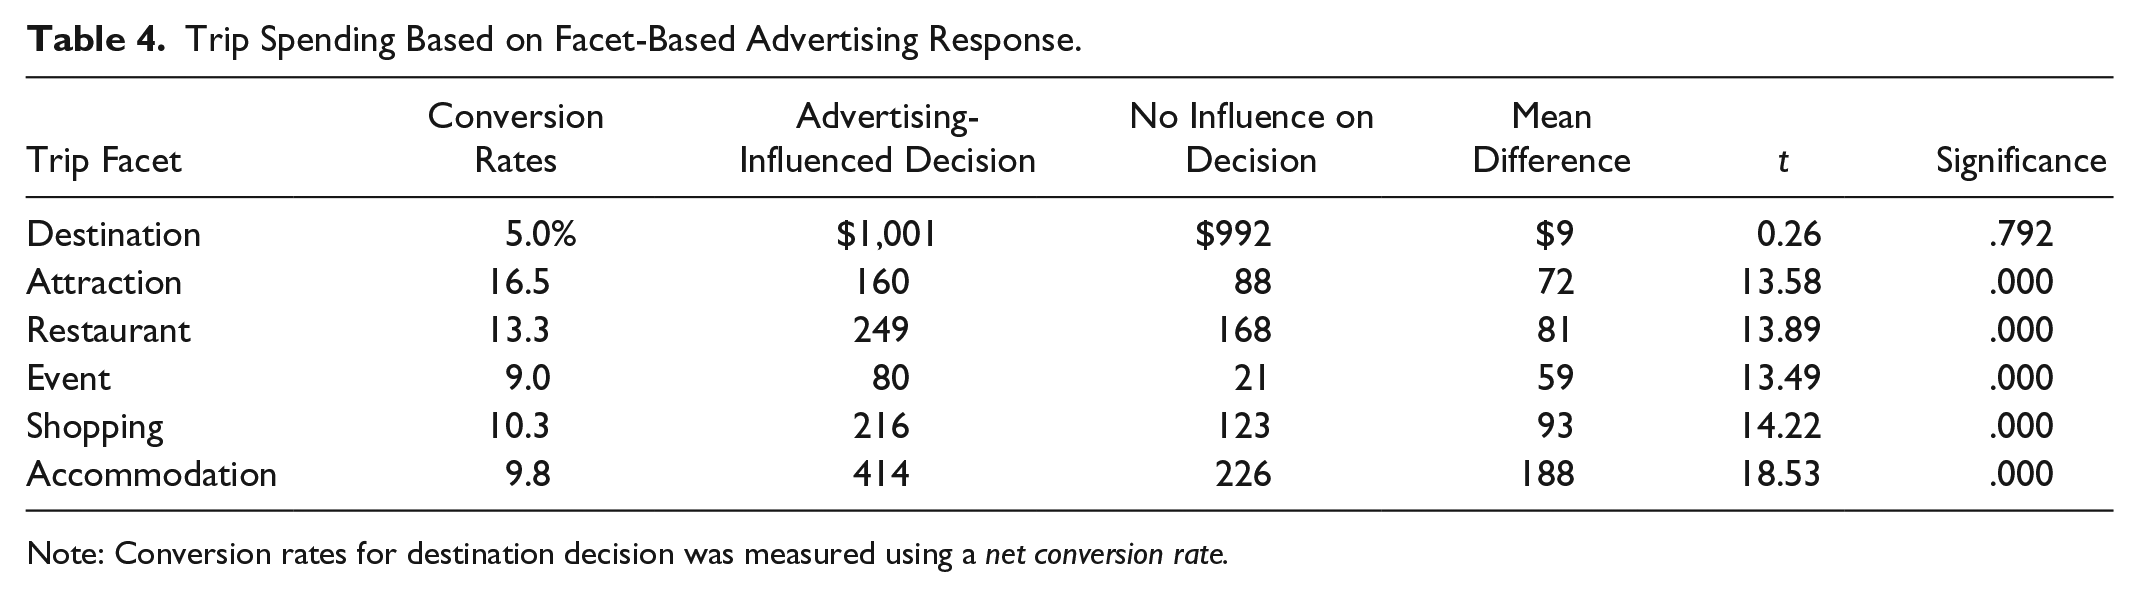
Note: Conversion rates for destination decision was measured using a net conversion rate.
Independent sample t-tests were then conducted to identify differences in trip facet spending between the visitors influenced by each trip facet and those that were not. The largest difference is found in accommodations, with those influenced by advertising to visit featured accommodations spending, on average, $188 more on accommodation than those not influenced by destination advertising (t = 18.53, p = .000). The differences in spending are also notable for decisions related to shopping ($93), restaurants ($81), attractions ($72) and events ($59). Importantly, no significant (α = 0.05) differences were found in total trip expenditures between those that were influenced to visit a particular destination and those that were not (t = 0.26, p = .792).
The range of tourism advertising impact on travel facet decisions among the 75 advertising programs was then identified. As can be seen in Table 5, the facet-level advertising response and average trip spending across the 75 advertising campaigns and aggregated for the 30 tourism destinations throughout the United States show a huge variation. For example, the impact for attractions ranges from 3.7% to 29.8% while the impact for events ranges from 0.0% to 24.1% across the 75 advertising campaigns; and the total visitor expenditures among the 30 destinations range from $460 to $1,980 (see Appendix A for detailed information on each campaign).
Tourism Advertising Response across 75 Advertising Campaigns.
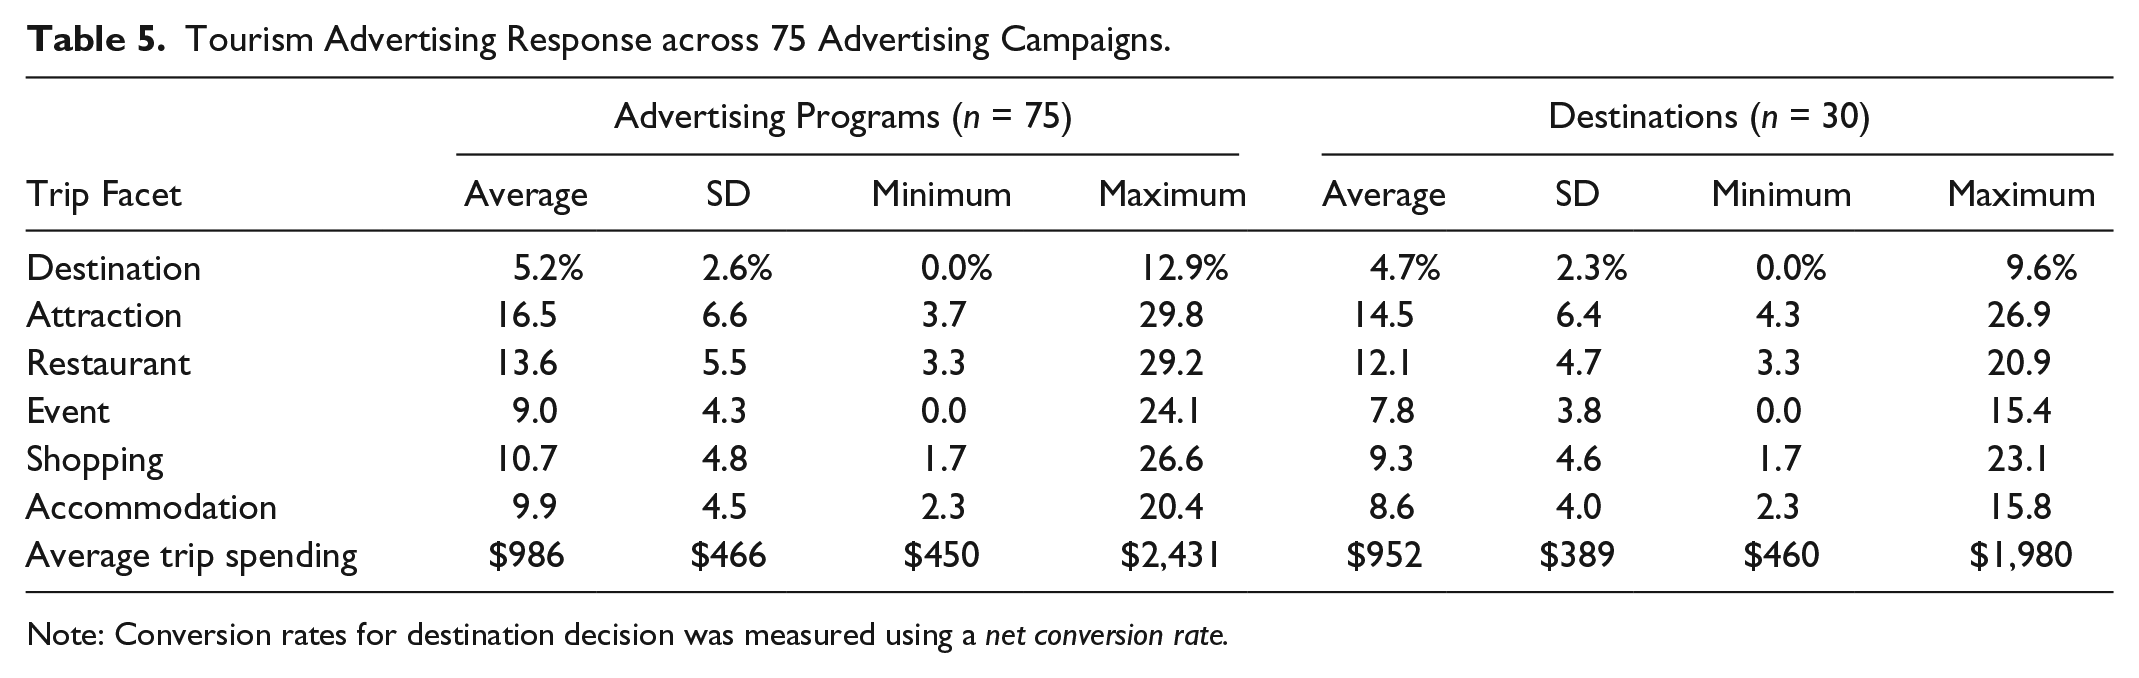
Note: Conversion rates for destination decision was measured using a net conversion rate.
Additional analyses were conducted to gain further insight into the range of facet-level advertising response across the 75 studies. In particular, the results indicate that the frequency of response to advertising and average trip spending differ significantly across the three response groups identified in Figure 1 (see Table 6). In particular, those respondents in group 1 (i.e., visitors indicating destination advertising affected their destination decision) reported the highest advertising response rates for all facets as well as average spending. As expected, the respondents included in group 2 (i.e., visitors indicating destination advertising did not affect their destination decision) were significantly less likely to have their facet-level decisions influenced by destination advertising (as compared to those in group 1), but are more likely to respond to destination advertising than those in group 3 (i.e., visitors deciding to visit the destination before seeing any travel advertising). Also, it is important to note that the choice of accommodations is influenced more often by destination advertising than shopping for group 1 and group 2, but not for group 3.
Advertising Influence and Overall Trip Spending for Each Advertising Response Group.
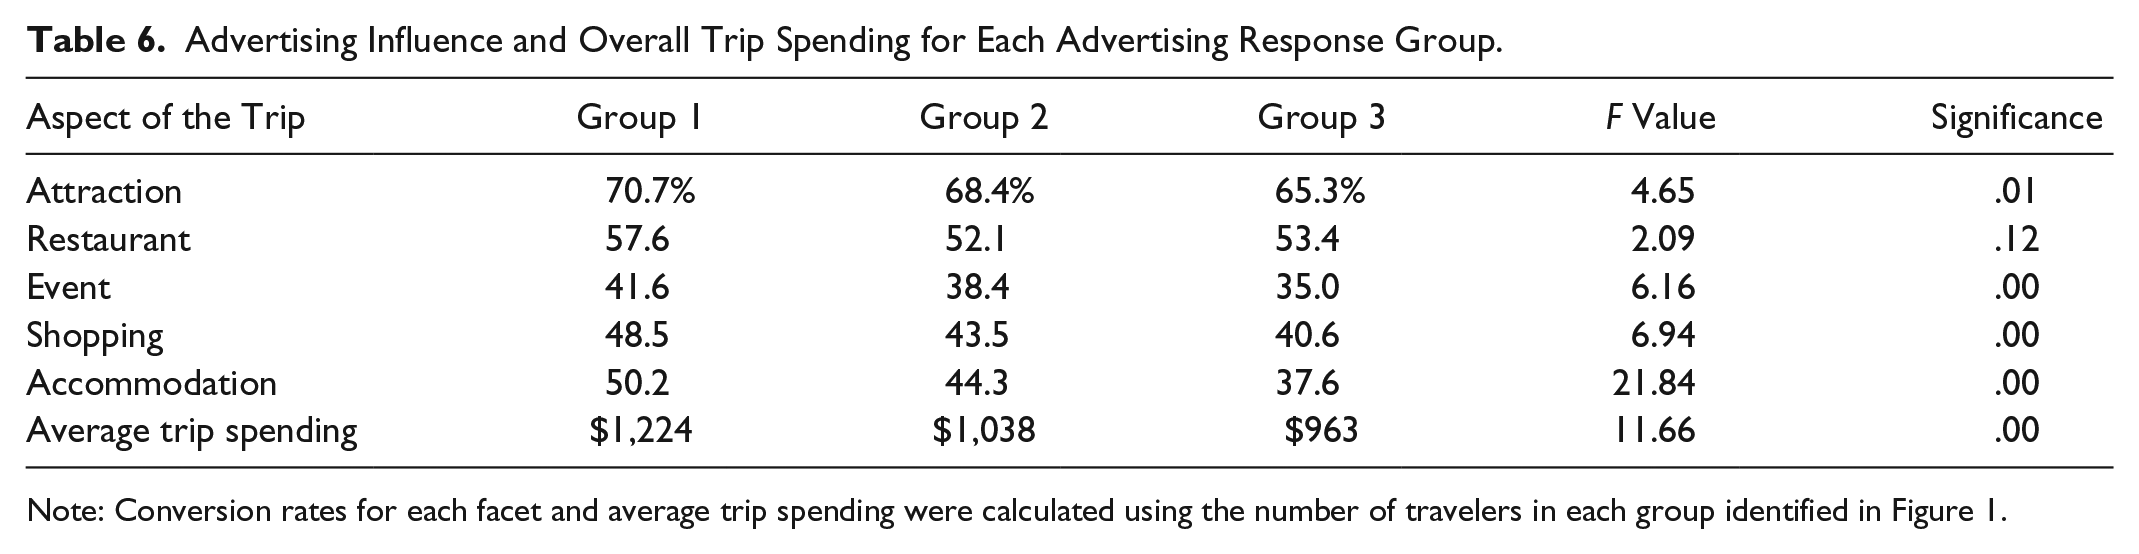
Note: Conversion rates for each facet and average trip spending were calculated using the number of travelers in each group identified in Figure 1.
Next, this study considered the relationship between destination advertising and the extent to which visitors altered (i.e., increased, decreased, or did not change) the number of attractions visited as compared to their original plans. This assessment serves as an indirect validity check for the previous analyses, as one would expect that those visitors who somehow modified their trip in response to destination advertising would also indicate that the advertising actually affected the range of trip-related activities. The results of these analyses confirm these expectations (see Table 7) wherein the respondents who indicated changes in the number of attractions visited as a result of advertising show significantly higher advertising response across every trip facet, as well as higher overall trip spending. Importantly, average visitor expenditures are over $200 higher for those indicating that they increased the number of attractions visited from what they originally planned.
Trip Flexibility (Degree of Change) and Advertising Influence.
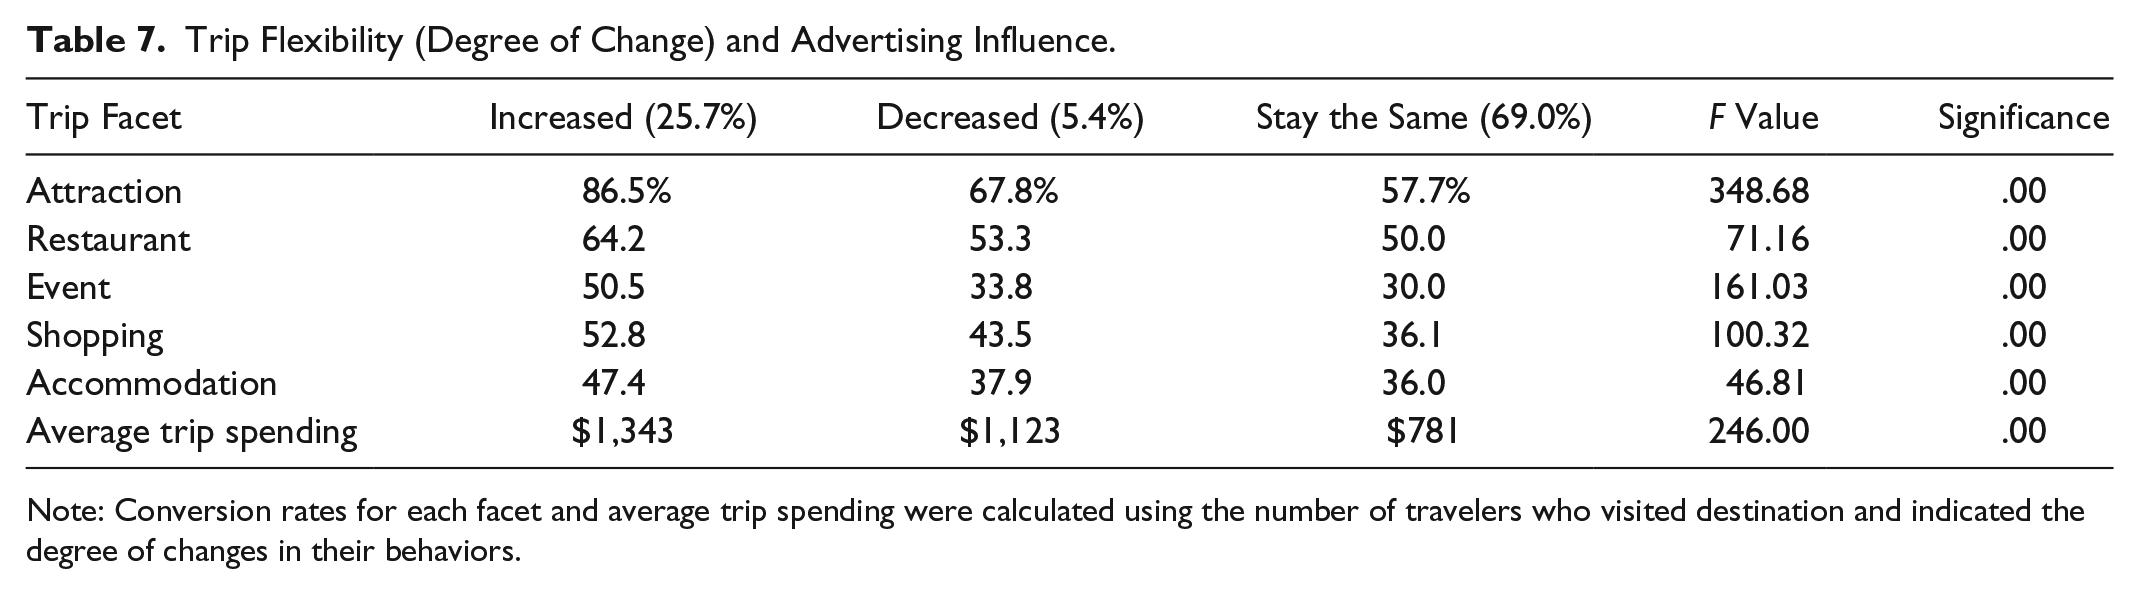
Note: Conversion rates for each facet and average trip spending were calculated using the number of travelers who visited destination and indicated the degree of changes in their behaviors.
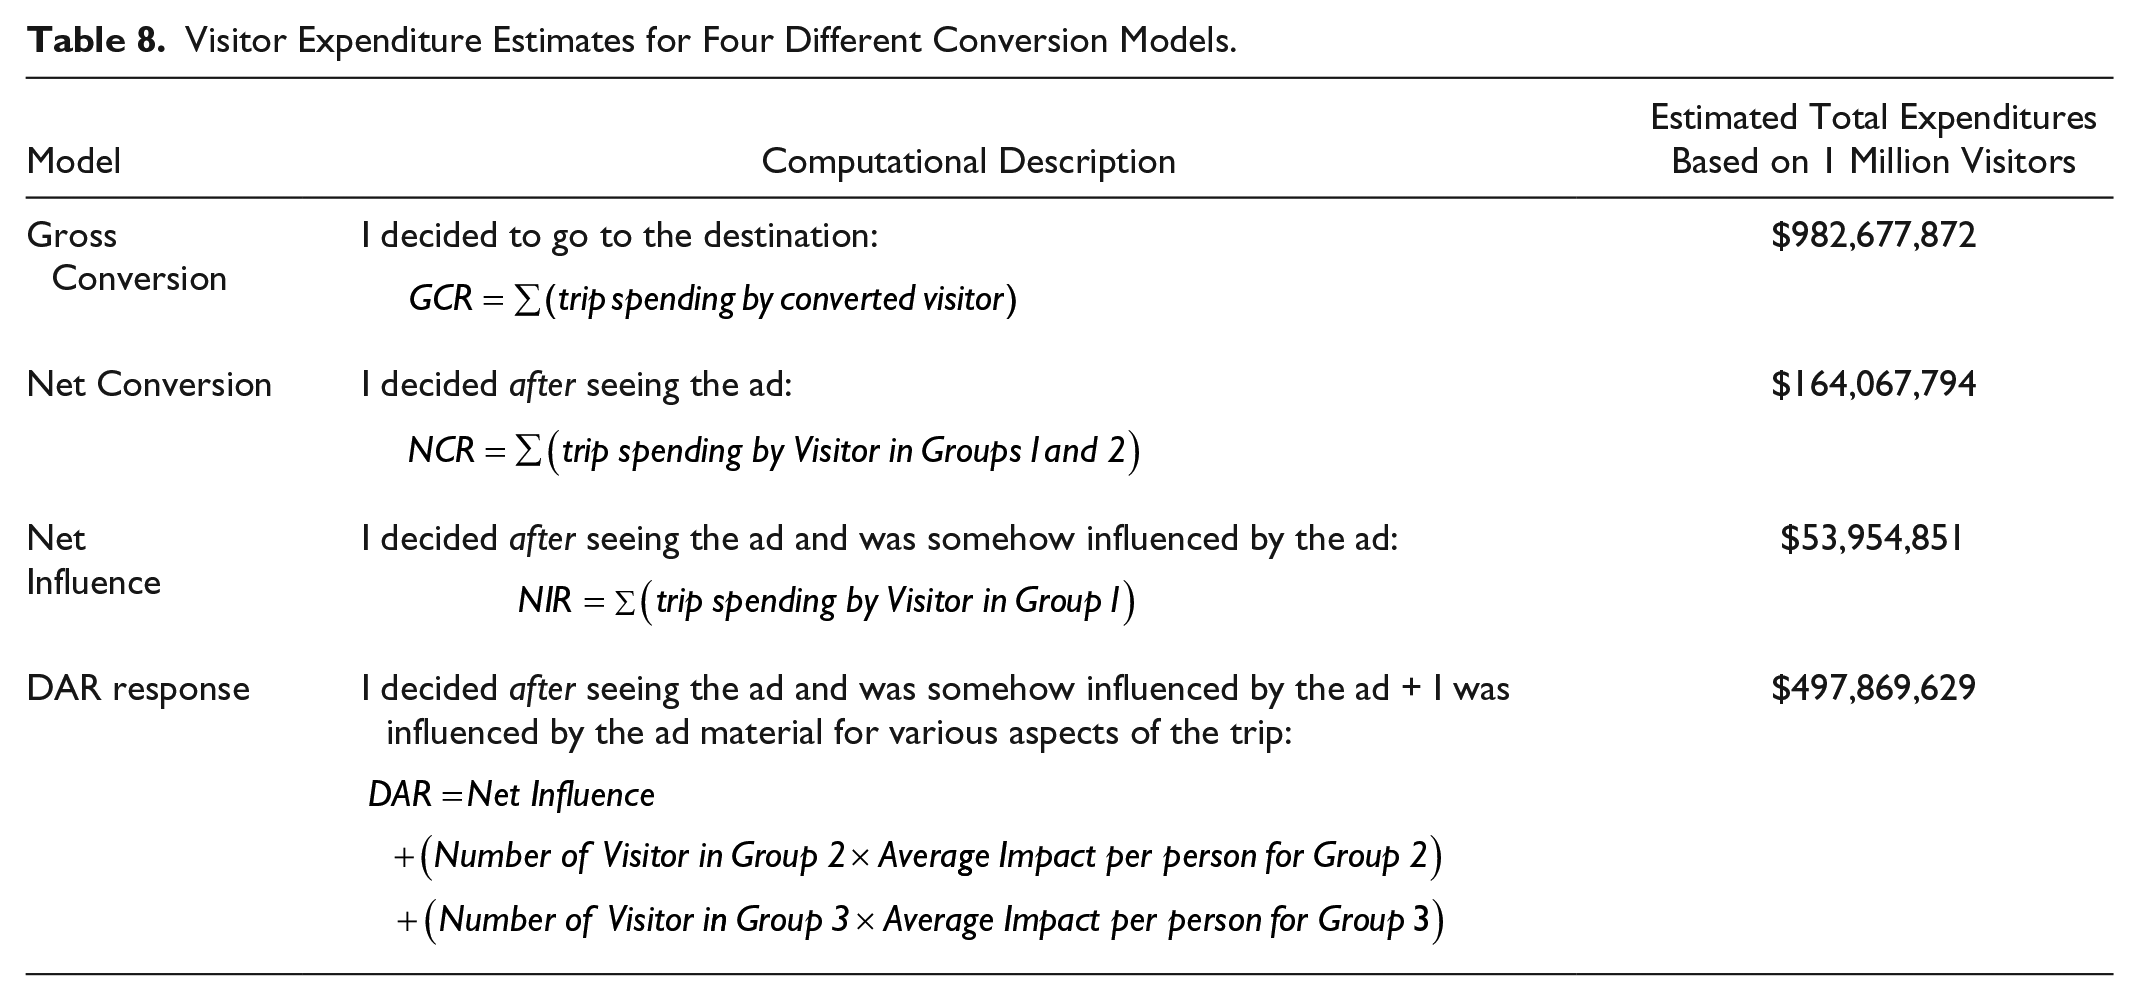
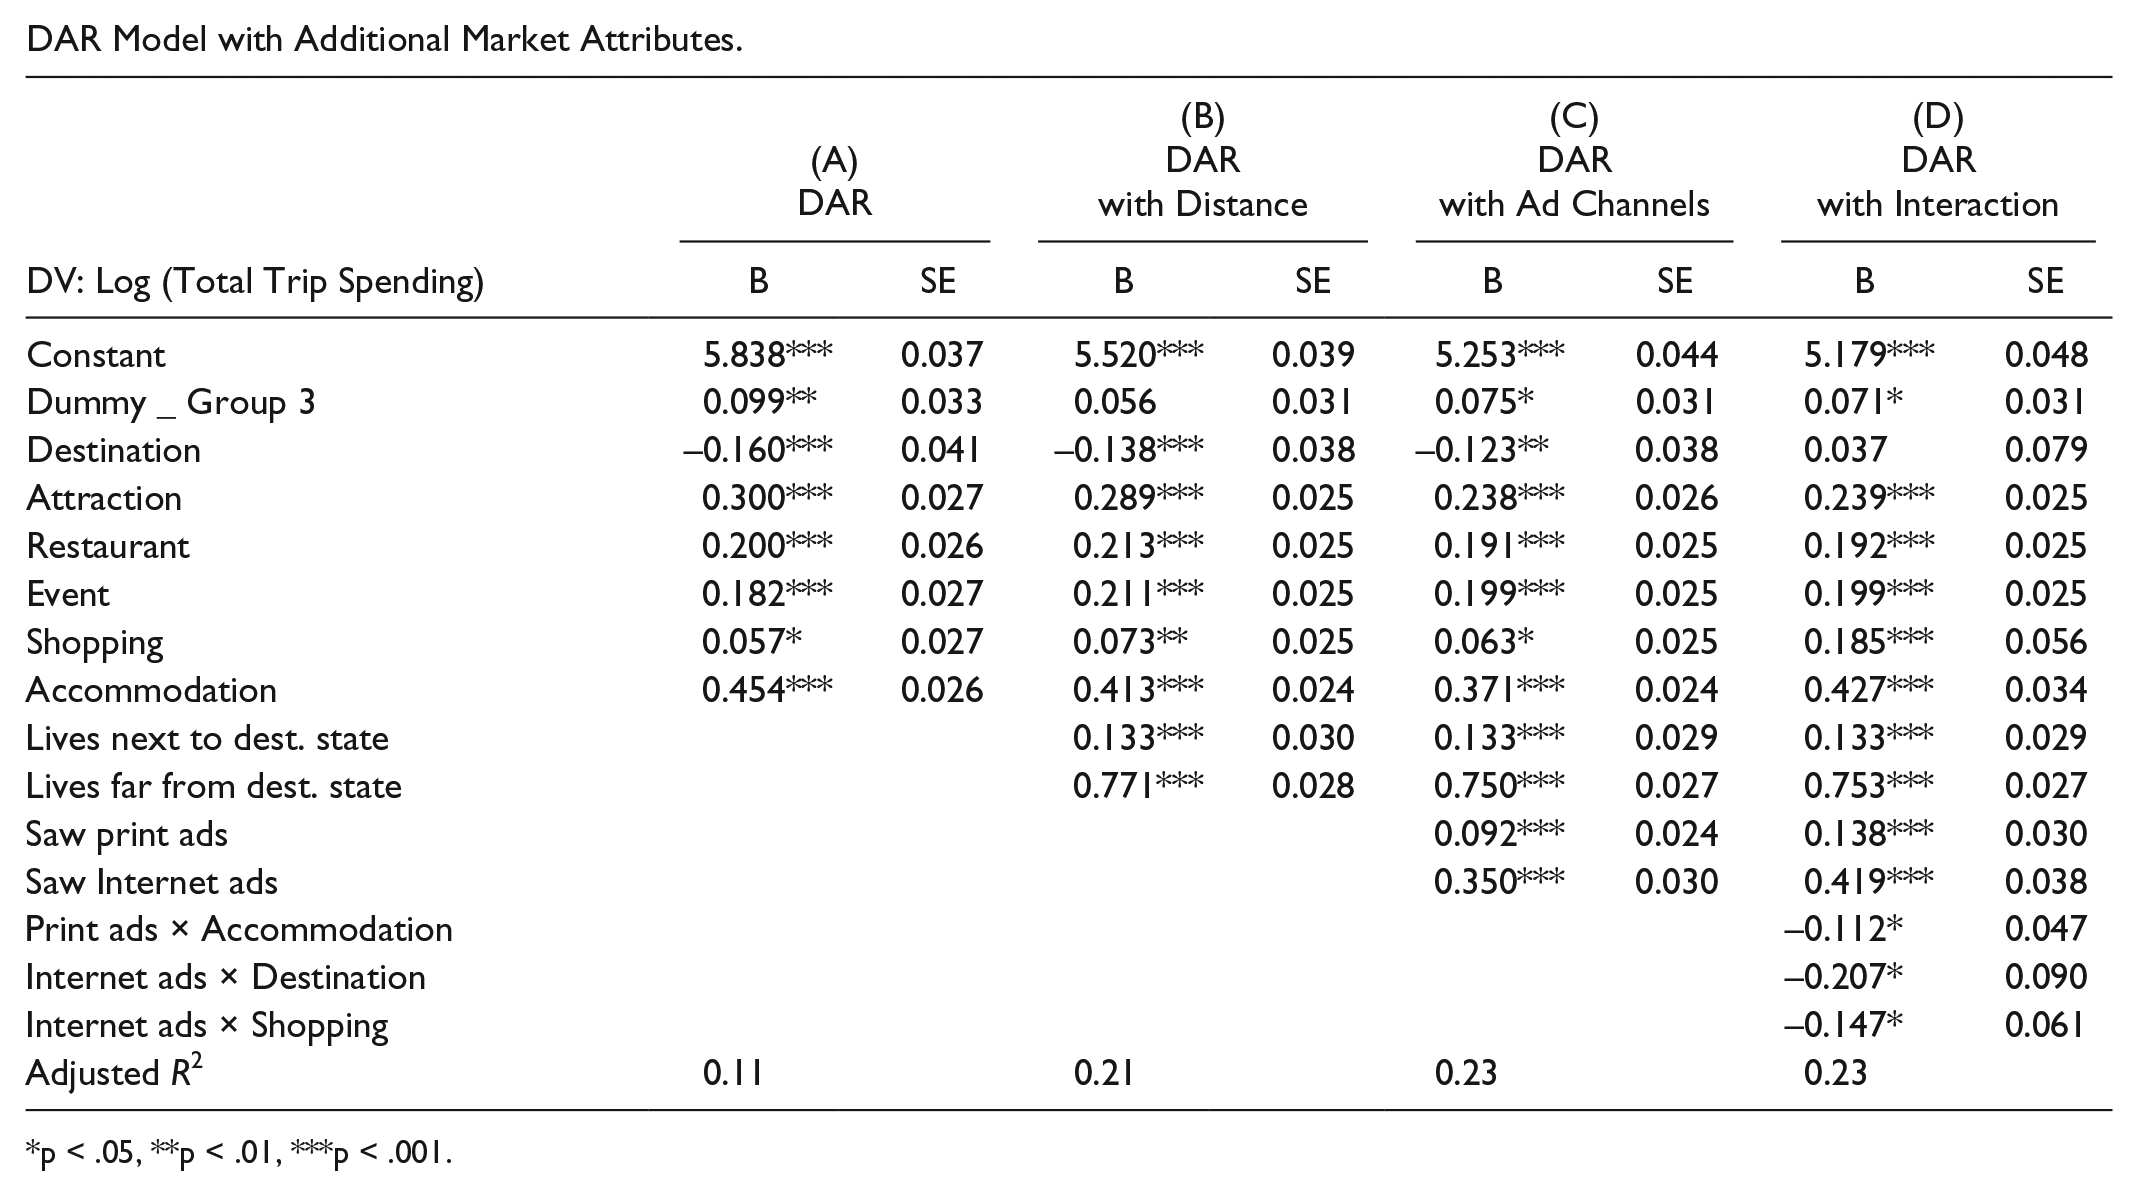
The last phase in the study compared the various methods for estimating advertising influence on visitor expenditures of a hypothetical destination marketing program based on the overall averages obtained from the 75 programs reflected in this study, and where it was assumed that the destination received a total of 1 million visitors. A total of four advertising impact models (GCR, NCR, NIR, and DAR) were calculated for comparison. Based on the definition of each metric, only selected groups and their expenditures were considered to estimate advertising impacts and visitor expenditures. Specifically, GCR-based impact was calculated using all visitors from the survey, and all their expenditures were considered as a result of advertising exposure. NCR-based impact was calculated using those trip expenditures associated with visitors deciding to visit the destination after seeing advertising (i.e., groups 1 and 2 in Figure 1) associated with the destination advertising campaign; NIR-based impact was calculated using only those visitors indicating that they chose the destination after seeing advertising and that that advertising affected their destination decision (i.e., group 1 in Figure 1). Last, impact estimates based upon the DAR model required four separate steps. First, all expenditures associated with those visitors in group 1 were summed as they are considered as a result of advertising impact. Second, following Stienmetz, Maxcy, and Fesenmaier (2015), multiple regression analysis (see Appendix B, Column A) was used to estimate the average marginal increase in expenditure for each influenced trip facet for those visitors that comprise groups 2 and 3. Third, total visitor estimates were calculated by multiplying the average marginal increase in expenditure for each trip facet by the number of visitors indicating that their decision (for that particular facet) was influenced by travel advertising. Finally, the overall DAR impact estimates were calculated by adding the total estimates from group 1 and those facet-based estimates for groups 2 and 3.
As expected, the results (see Table 8) indicate that the GCR impact model, with an estimate of $983 million, is by far the highest as it includes all expenditures associated with visitors to the destination without regard to the influence of the destination advertising campaign. This compares to the estimate of $164 million for the NCR impact model that includes only those expenditures by visitors indicating they actually saw the advertising before choosing the destination. Next, the NIR impact model generates a much smaller estimate of $54 million (approximately 5% of the Gross Conversion estimate) as it includes expenditures from only those visitors indicating that they saw the destination advertising and that it actually influenced their travel planning. However, as posited by Stienmetz, Maxcy, and Fesenmaier (2015), it is argued that while destination advertising may not have influence the core destination decision, it may have the potential to influence various other aspects of the trip journey, and as such has the potential to have substantial economic impact on the local destination. Based on this assumption, DAR-based visitor expenditures are approximately $498 million, and as discussed above, include the expenditures of all visitors in group 1 plus those expenditures by visitors indicating that various trip-related activities (i.e., choice of accommodations, attractions, restaurants, events, and shopping) were influenced by the destination advertising.
Visitor Expenditure Estimates for Four Different Conversion Models.
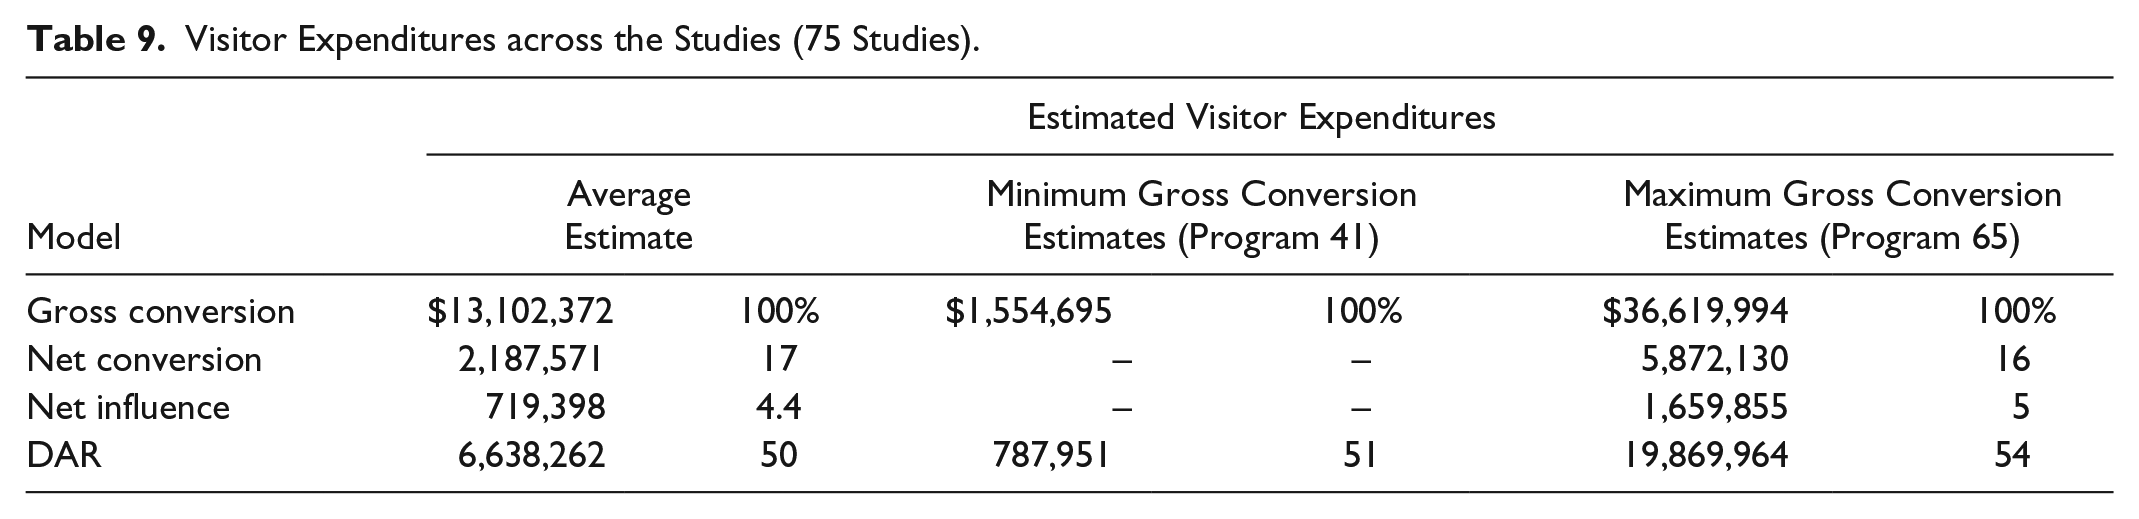
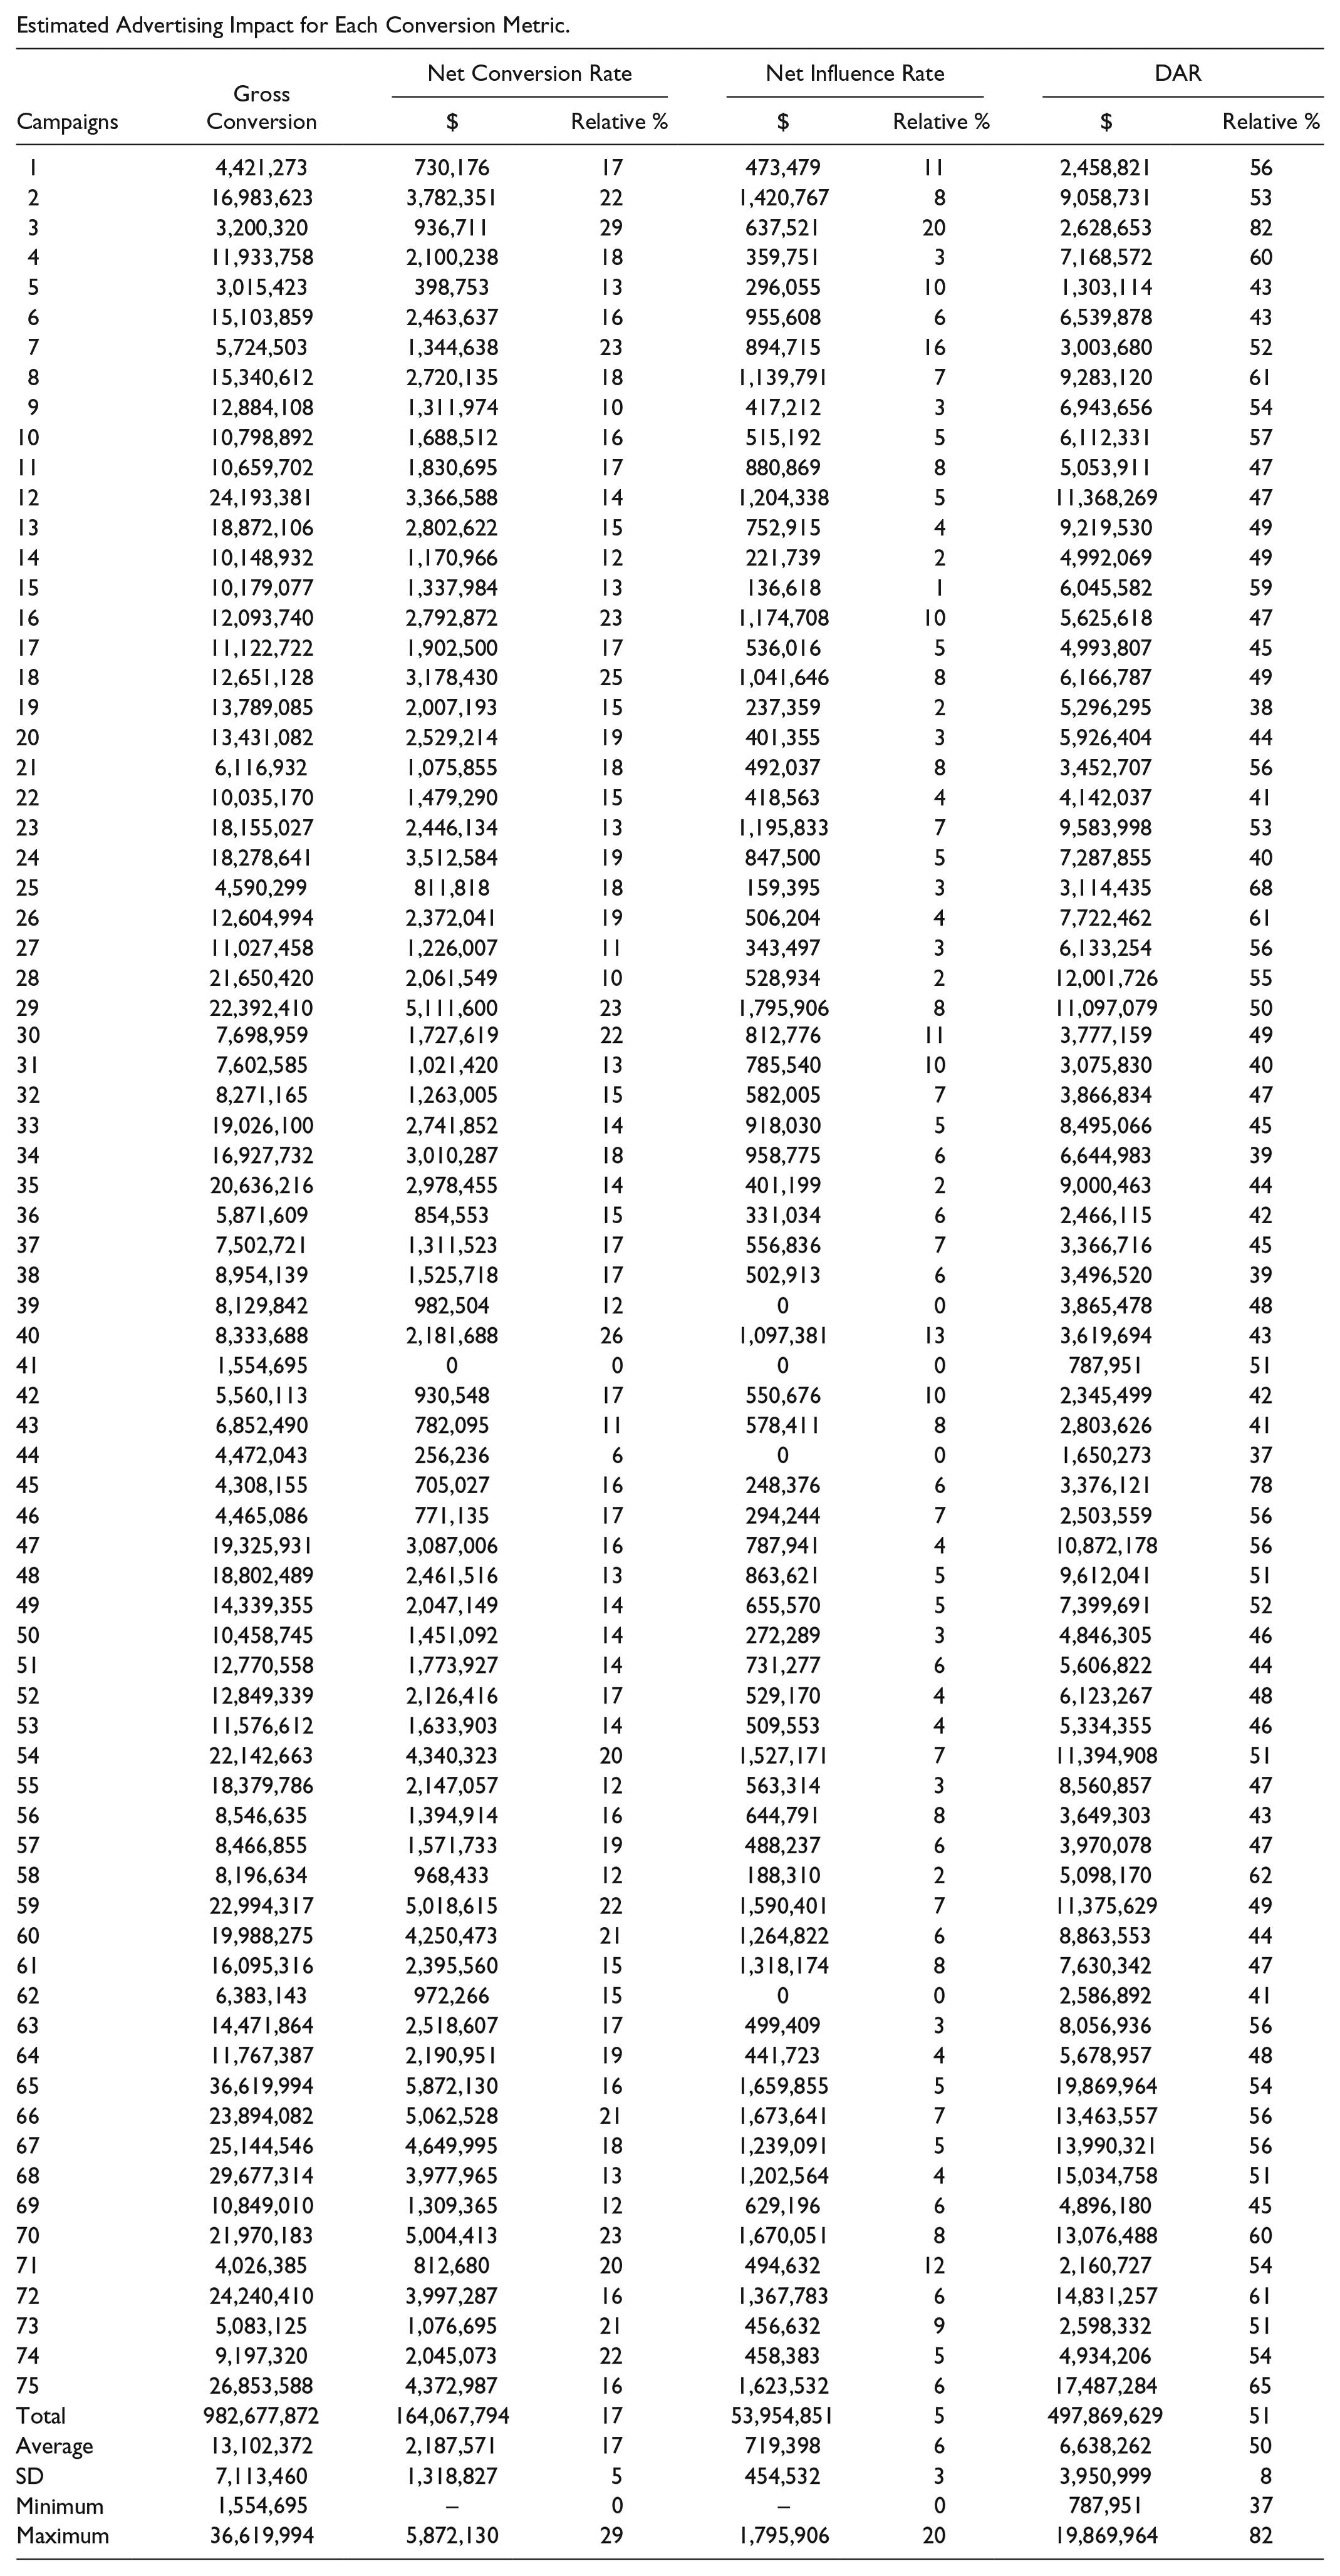
Further, the variation in impact estimates for the 75 different destination advertising campaigns show huge differences in estimated total expenditures and relative percentage when comparing impacts based on the GCR, NCR, NIR, and DAR conversion metrics. As expected, the NIR impact is always the minimum estimate of visitor expenditures whereas the GCR impact is always the maximum estimate of visitor expenditures. On average, DAR-based estimates are approximately 50% of the visitor expenditure impact based on the GCR method and ranged from 37% to 82%. Table 9 is included to illustrate the potential range of findings by contrasting two individual studies, one that has the maximum visitor expenditures based on GCR, and the other, a minimum value. As can be seen, the GCR-based impact estimate for Program 41 (Minimum GCR Estimates) is approximately $1.5 million, but the NCR- and NIR-based impact estimates are $0 as all visitors made their destination choice before seeing the tourism advertising. However, the visitor expenditure impact based on the DAR model is $0.8 million (51% of GCR model), wherein those visitors might be influenced by tourism advertising for various aspects of their trip. At the same time, Program 65 (Maximum Gross Conversion Rate) shows a similar pattern with the combined result, wherein the visitor expenditures of the DAR-based model is approximately 54% of the GCR-based model and is much higher than the NCR (16%) and the NIR (5%) based models.
Visitor Expenditures across the Studies (75 Studies).
Conclusions and Implications
Destination advertising studies provide destination marketers much of the essential information needed to evaluate their marketing efforts. As such, both industry and academia have invested substantial effort toward advancing techniques that provide accurate and reliable estimates of advertising response. To date, 82 scholarly papers have been identified that report on various aspects of tourism advertising using a number of different methods. Among them, the conversion approach is the most popular method for estimating tourism advertising effectiveness followed by some form of quasi-experimental approach (26.8%). In addition, various conversion-based metrics have been published in scholarly journals (31 papers). Among them, Gross Conversion Rate (which assumes all converted visitors are coming as a result of tourism advertising, regardless of their decision making) is reported most often in the tourism literature, while the Net Conversion Rate and Net Influence Rate (which consider the timing of decision and actual advertising influence) and the DAR model approach (which incorporates a facet-based approach) have been applied less frequently. It is generally agreed in the tourism advertising literature that Gross Conversion–based estimates tend to substantially overestimate advertising response while Net Influence–based estimates substantially underestimate advertising response. It is clear from the literature and from this study that these two models of advertising response establish the upper and lower limits of advertising impact. Indeed, this study shows that visitor expenditures based on the Net Influence–based model are approximately 5% of Gross Conversion–based estimates while estimates based upon the Net Conversion model are 17%. However, when taking into account the various trip-related activities and decisions based upon the DAR model, estimates of advertising response increase substantially to approximately 51% of the Gross Conversion estimates. These values, of course, range substantially depending upon location and the nature of the advertising campaign; however, it is expected that the basic relationships between the various models are structurally similar. That is, the Gross Conversion model will always overestimate advertising response, the Net Influence model will always underrepresent advertising response, and the DAR model will always provide estimates somewhere in between depending on the nature (i.e., focus, strength, etc.) of the specific advertising campaign.
Based on these analyses, it is argued that the Gross Conversion Rate and the Net Influence model do not provide realistic estimates of advertising response and, therefore, provide little useful insight into the real impact of destination advertising. In contrast, it is concluded that the DAR model offers, both theoretically and practically, a powerful framework for evaluating advertising response in that it provides estimates of impact that are (1) theoretically defensible in that it incorporates the possibility that destination advertising affects decisions related to a range of trip-related activities and (2) calibrated using robust estimation procedures (i.e., ANOVA, logistic regression analysis, or OLS multiple regression analysis). Further, the DAR model can be extended so as to easily evaluate differences in advertising response based on a number of campaign design features including length of stay (i.e., day visitors, short-stay visitors, and longer stay visitors), travel distance (local, regional vs. more distant travelers), advertising channel, and travel party as well the timing of the various travel-related decisions. To illustrate the use of the DAR model for guiding a particular destination advertising campaign, an additional series of three regression analyses were conducted. The results of three separate multiple regression analyses are shown in Columns B to D in Appendix B and indicate that besides the individual trip facets considered above, those visitors from more distant locations spend (on average) significantly more money than those visitors obtaining information via the Internet. Further, travelers using information obtained from print advertisements spend significantly more (on average) for accommodations, and finally, the Internet is significantly more important for destination and shopping decisions. As such, it is argued that the DAR model represents a “family of models” that can be used for evaluating very specific target marketing programs and therefore enables destination marketing organizations to more easily design target advertising campaigns. Importantly, the huge variation in the advertising impact estimates indicate that marketers should be cautious about using any of the four models of advertising response. As such, practitioners need to first provide a clear definition of advertising response and how it is calculated based on this definition.
This study has some important limitations and offers several opportunities for future research. In particular, the response rate for this study is only 6.3%, and although this study adjusted for nonresponse bias, research needs to be conducted to identify strategies to somehow increase the response rate. Further, the data used in this study includes 75 advertising programs (i.e., between April 2012 and September 2014) within the United States; however, this study does not explicitly take into account variation in the attractiveness of destinations and seasonality while estimating advertising response. Finally, some studies (see Dwyer et al. 2014) argue that the purpose of advertising is not only to increase visitor expenditures but also to attract visitors whose behaviors are socially and environmentally harmonious; as such, it is argued that future research should focus on using the DAR model to evaluate advertising response by those visitor segments that match the “ideal” tourists of the destination.
Footnotes
Appendix A
Estimated Advertising Impact for Each Conversion Metric.
| Campaigns | Gross Conversion | Net Conversion Rate |
Net Influence Rate |
DAR |
|||
|---|---|---|---|---|---|---|---|
| $ | Relative % | $ | Relative % | $ | Relative % | ||
| 1 | 4,421,273 | 730,176 | 17 | 473,479 | 11 | 2,458,821 | 56 |
| 2 | 16,983,623 | 3,782,351 | 22 | 1,420,767 | 8 | 9,058,731 | 53 |
| 3 | 3,200,320 | 936,711 | 29 | 637,521 | 20 | 2,628,653 | 82 |
| 4 | 11,933,758 | 2,100,238 | 18 | 359,751 | 3 | 7,168,572 | 60 |
| 5 | 3,015,423 | 398,753 | 13 | 296,055 | 10 | 1,303,114 | 43 |
| 6 | 15,103,859 | 2,463,637 | 16 | 955,608 | 6 | 6,539,878 | 43 |
| 7 | 5,724,503 | 1,344,638 | 23 | 894,715 | 16 | 3,003,680 | 52 |
| 8 | 15,340,612 | 2,720,135 | 18 | 1,139,791 | 7 | 9,283,120 | 61 |
| 9 | 12,884,108 | 1,311,974 | 10 | 417,212 | 3 | 6,943,656 | 54 |
| 10 | 10,798,892 | 1,688,512 | 16 | 515,192 | 5 | 6,112,331 | 57 |
| 11 | 10,659,702 | 1,830,695 | 17 | 880,869 | 8 | 5,053,911 | 47 |
| 12 | 24,193,381 | 3,366,588 | 14 | 1,204,338 | 5 | 11,368,269 | 47 |
| 13 | 18,872,106 | 2,802,622 | 15 | 752,915 | 4 | 9,219,530 | 49 |
| 14 | 10,148,932 | 1,170,966 | 12 | 221,739 | 2 | 4,992,069 | 49 |
| 15 | 10,179,077 | 1,337,984 | 13 | 136,618 | 1 | 6,045,582 | 59 |
| 16 | 12,093,740 | 2,792,872 | 23 | 1,174,708 | 10 | 5,625,618 | 47 |
| 17 | 11,122,722 | 1,902,500 | 17 | 536,016 | 5 | 4,993,807 | 45 |
| 18 | 12,651,128 | 3,178,430 | 25 | 1,041,646 | 8 | 6,166,787 | 49 |
| 19 | 13,789,085 | 2,007,193 | 15 | 237,359 | 2 | 5,296,295 | 38 |
| 20 | 13,431,082 | 2,529,214 | 19 | 401,355 | 3 | 5,926,404 | 44 |
| 21 | 6,116,932 | 1,075,855 | 18 | 492,037 | 8 | 3,452,707 | 56 |
| 22 | 10,035,170 | 1,479,290 | 15 | 418,563 | 4 | 4,142,037 | 41 |
| 23 | 18,155,027 | 2,446,134 | 13 | 1,195,833 | 7 | 9,583,998 | 53 |
| 24 | 18,278,641 | 3,512,584 | 19 | 847,500 | 5 | 7,287,855 | 40 |
| 25 | 4,590,299 | 811,818 | 18 | 159,395 | 3 | 3,114,435 | 68 |
| 26 | 12,604,994 | 2,372,041 | 19 | 506,204 | 4 | 7,722,462 | 61 |
| 27 | 11,027,458 | 1,226,007 | 11 | 343,497 | 3 | 6,133,254 | 56 |
| 28 | 21,650,420 | 2,061,549 | 10 | 528,934 | 2 | 12,001,726 | 55 |
| 29 | 22,392,410 | 5,111,600 | 23 | 1,795,906 | 8 | 11,097,079 | 50 |
| 30 | 7,698,959 | 1,727,619 | 22 | 812,776 | 11 | 3,777,159 | 49 |
| 31 | 7,602,585 | 1,021,420 | 13 | 785,540 | 10 | 3,075,830 | 40 |
| 32 | 8,271,165 | 1,263,005 | 15 | 582,005 | 7 | 3,866,834 | 47 |
| 33 | 19,026,100 | 2,741,852 | 14 | 918,030 | 5 | 8,495,066 | 45 |
| 34 | 16,927,732 | 3,010,287 | 18 | 958,775 | 6 | 6,644,983 | 39 |
| 35 | 20,636,216 | 2,978,455 | 14 | 401,199 | 2 | 9,000,463 | 44 |
| 36 | 5,871,609 | 854,553 | 15 | 331,034 | 6 | 2,466,115 | 42 |
| 37 | 7,502,721 | 1,311,523 | 17 | 556,836 | 7 | 3,366,716 | 45 |
| 38 | 8,954,139 | 1,525,718 | 17 | 502,913 | 6 | 3,496,520 | 39 |
| 39 | 8,129,842 | 982,504 | 12 | 0 | 0 | 3,865,478 | 48 |
| 40 | 8,333,688 | 2,181,688 | 26 | 1,097,381 | 13 | 3,619,694 | 43 |
| 41 | 1,554,695 | 0 | 0 | 0 | 0 | 787,951 | 51 |
| 42 | 5,560,113 | 930,548 | 17 | 550,676 | 10 | 2,345,499 | 42 |
| 43 | 6,852,490 | 782,095 | 11 | 578,411 | 8 | 2,803,626 | 41 |
| 44 | 4,472,043 | 256,236 | 6 | 0 | 0 | 1,650,273 | 37 |
| 45 | 4,308,155 | 705,027 | 16 | 248,376 | 6 | 3,376,121 | 78 |
| 46 | 4,465,086 | 771,135 | 17 | 294,244 | 7 | 2,503,559 | 56 |
| 47 | 19,325,931 | 3,087,006 | 16 | 787,941 | 4 | 10,872,178 | 56 |
| 48 | 18,802,489 | 2,461,516 | 13 | 863,621 | 5 | 9,612,041 | 51 |
| 49 | 14,339,355 | 2,047,149 | 14 | 655,570 | 5 | 7,399,691 | 52 |
| 50 | 10,458,745 | 1,451,092 | 14 | 272,289 | 3 | 4,846,305 | 46 |
| 51 | 12,770,558 | 1,773,927 | 14 | 731,277 | 6 | 5,606,822 | 44 |
| 52 | 12,849,339 | 2,126,416 | 17 | 529,170 | 4 | 6,123,267 | 48 |
| 53 | 11,576,612 | 1,633,903 | 14 | 509,553 | 4 | 5,334,355 | 46 |
| 54 | 22,142,663 | 4,340,323 | 20 | 1,527,171 | 7 | 11,394,908 | 51 |
| 55 | 18,379,786 | 2,147,057 | 12 | 563,314 | 3 | 8,560,857 | 47 |
| 56 | 8,546,635 | 1,394,914 | 16 | 644,791 | 8 | 3,649,303 | 43 |
| 57 | 8,466,855 | 1,571,733 | 19 | 488,237 | 6 | 3,970,078 | 47 |
| 58 | 8,196,634 | 968,433 | 12 | 188,310 | 2 | 5,098,170 | 62 |
| 59 | 22,994,317 | 5,018,615 | 22 | 1,590,401 | 7 | 11,375,629 | 49 |
| 60 | 19,988,275 | 4,250,473 | 21 | 1,264,822 | 6 | 8,863,553 | 44 |
| 61 | 16,095,316 | 2,395,560 | 15 | 1,318,174 | 8 | 7,630,342 | 47 |
| 62 | 6,383,143 | 972,266 | 15 | 0 | 0 | 2,586,892 | 41 |
| 63 | 14,471,864 | 2,518,607 | 17 | 499,409 | 3 | 8,056,936 | 56 |
| 64 | 11,767,387 | 2,190,951 | 19 | 441,723 | 4 | 5,678,957 | 48 |
| 65 | 36,619,994 | 5,872,130 | 16 | 1,659,855 | 5 | 19,869,964 | 54 |
| 66 | 23,894,082 | 5,062,528 | 21 | 1,673,641 | 7 | 13,463,557 | 56 |
| 67 | 25,144,546 | 4,649,995 | 18 | 1,239,091 | 5 | 13,990,321 | 56 |
| 68 | 29,677,314 | 3,977,965 | 13 | 1,202,564 | 4 | 15,034,758 | 51 |
| 69 | 10,849,010 | 1,309,365 | 12 | 629,196 | 6 | 4,896,180 | 45 |
| 70 | 21,970,183 | 5,004,413 | 23 | 1,670,051 | 8 | 13,076,488 | 60 |
| 71 | 4,026,385 | 812,680 | 20 | 494,632 | 12 | 2,160,727 | 54 |
| 72 | 24,240,410 | 3,997,287 | 16 | 1,367,783 | 6 | 14,831,257 | 61 |
| 73 | 5,083,125 | 1,076,695 | 21 | 456,632 | 9 | 2,598,332 | 51 |
| 74 | 9,197,320 | 2,045,073 | 22 | 458,383 | 5 | 4,934,206 | 54 |
| 75 | 26,853,588 | 4,372,987 | 16 | 1,623,532 | 6 | 17,487,284 | 65 |
| Total | 982,677,872 | 164,067,794 | 17 | 53,954,851 | 5 | 497,869,629 | 51 |
| Average | 13,102,372 | 2,187,571 | 17 | 719,398 | 6 | 6,638,262 | 50 |
| SD | 7,113,460 | 1,318,827 | 5 | 454,532 | 3 | 3,950,999 | 8 |
| Minimum | 1,554,695 | – | 0 | – | 0 | 787,951 | 37 |
| Maximum | 36,619,994 | 5,872,130 | 29 | 1,795,906 | 20 | 19,869,964 | 82 |
Appendix B
DAR Model with Additional Market Attributes.
| DV: Log (Total Trip Spending) | (A) |
(B) |
(C) |
(D) |
||||
|---|---|---|---|---|---|---|---|---|
| B | SE | B | SE | B | SE | B | SE | |
| Constant | 5.838*** | 0.037 | 5.520*** | 0.039 | 5.253*** | 0.044 | 5.179*** | 0.048 |
| Dummy _ Group 3 | 0.099** | 0.033 | 0.056 | 0.031 | 0.075* | 0.031 | 0.071* | 0.031 |
| Destination | −0.160*** | 0.041 | −0.138*** | 0.038 | −0.123** | 0.038 | 0.037 | 0.079 |
| Attraction | 0.300*** | 0.027 | 0.289*** | 0.025 | 0.238*** | 0.026 | 0.239*** | 0.025 |
| Restaurant | 0.200*** | 0.026 | 0.213*** | 0.025 | 0.191*** | 0.025 | 0.192*** | 0.025 |
| Event | 0.182*** | 0.027 | 0.211*** | 0.025 | 0.199*** | 0.025 | 0.199*** | 0.025 |
| Shopping | 0.057* | 0.027 | 0.073** | 0.025 | 0.063* | 0.025 | 0.185*** | 0.056 |
| Accommodation | 0.454*** | 0.026 | 0.413*** | 0.024 | 0.371*** | 0.024 | 0.427*** | 0.034 |
| Lives next to dest. state | 0.133*** | 0.030 | 0.133*** | 0.029 | 0.133*** | 0.029 | ||
| Lives far from dest. state | 0.771*** | 0.028 | 0.750*** | 0.027 | 0.753*** | 0.027 | ||
| Saw print ads | 0.092*** | 0.024 | 0.138*** | 0.030 | ||||
| Saw Internet ads | 0.350*** | 0.030 | 0.419*** | 0.038 | ||||
| Print ads × Accommodation | −0.112* | 0.047 | ||||||
| Internet ads × Destination | −0.207* | 0.090 | ||||||
| Internet ads × Shopping | −0.147* | 0.061 | ||||||
| Adjusted R2 | 0.11 | 0.21 | 0.23 | 0.23 | ||||
p < .05, **p < .01, ***p < .001.
Acknowledgements
We gratefully acknowledge that this research was funded in part by Madden Media Inc. as part of their programs with various U.S. destination marketing organizations.
Declaration of Conflicting Interests
The author(s) declared no potential conflicts of interest with respect to the research, authorship, and/or publication of this article.
Funding
The author(s) disclosed receipt of the following financial support for the research, authorship, and/or publication of this article: The authors wish to recognize Madden Media for their financial support of the initial data collection effort.