




Abstract
Focusing on sporting events as an important segment within the tourism and travel industry, this study establishes that the service quality–delight–loyalty system complements a service quality–satisfaction–loyalty one. The findings highlight that prior consumption experience with a service coincides with lowered service evaluations while it amplifies the impact of customer delight on customer loyalty. In turn, this study provides practical insights into service quality dimensions for managing customer loyalty.
Introduction
Understanding whether improvements in both customer satisfaction and delight affect loyalty and how such improvements can be accomplished managerially is not only crucial to tourism, travel, hospitality, leisure, and event operators but also remains theoretically and empirically ambiguous. Creating customer loyalty is essential to sustain tourist destinations (Prayag and Ryan 2012; Taplin 2013), by securing the necessary revenue bases for travel businesses (Akamavi et al. 2015), hospitality firms like hotels (Martínez and Rodríguez del Bosque 2013) or medical tourism clinics (Han and Hyun 2015), and park operators (Weaver and Lawton 2011). Attractions like heritage sites (Palau-Saumell et al. 2013) or sports venues (Bosnjak et al. 2016; Daniels 2004; Hall, O’Mahony, and Vieceli 2010; Harris and Ogbonna 2008; Kaplanidou et al. 2013; Madrigal 2006; Weed 2009) also can play a crucial role in the success of a travel destination (Leask 2010). This study relies on a general conception of customer loyalty, as reflected in intentions to revisit or recommend to others (Magnini, Crotts, and Zehrer 2011; Taplin 2013), that improves profitability (Han and Hyun 2015).
Customer satisfaction is a critical but not sufficient antecedent of customer loyalty (Dolnicar, Coltman, and Sharma 2015; Kumar, Pozza, and Ganesh 2013; Taplin 2013). A supplementary construct is customer delight (Albayrak and Caber 2015; Magnini, Crotts, and Zehrer 2011; Torres, Fu, and Lehto 2014), which acts separately but in parallel with satisfaction to produce customer loyalty. However, few studies—specifically, four related to tourism or travel-related settings (cf. Kim 2011; Kim, Vogt, and Knutson 2015; Loureiro 2010; Wang 2011)—account for the parallel and separate influences of customer delight and customer satisfaction (cf. Bartl, Gouthier, and Lenker 2013; Finn 2005, 2006). Rather than reflecting “a higher level of customer satisfaction” (cf. Albayrak and Caber 2015, p. 49), delight has generally a positive effect on customer loyalty parallel to that of satisfaction (Finn 2005, 2006; Kim 2011; Kim, Vogt, and Knutson 2015; Loureiro 2010; Oliver, Rust, and Varki 1997; Wang 2011), whereas in some studies it has no effect (Finn 2005, 2006; Oliver, Rust, and Varki 1997). Other studies indicate a positive effect of delight but cannot confirm an effect of satisfaction on customer loyalty (Bartl, Gouthier, and Lenker 2013). To resolve these seemingly inconsistent empirical findings, as its first aim, this study seeks to reassess the simultaneous, parallel, and separate effects of delight and satisfaction on loyalty.
Recent research highlights the importance of identifying service quality attributes that affect customer satisfaction (Dolnicar, Coltman, and Sharma 2015) and/or delight (Albayrak and Caber 2015). Yet the relationships among quality, delight, and loyalty have not been examined sufficiently in tourism and travel settings. Thus and as its second aim, this study seeks to develop a fuller understanding of the service quality attributes that can enhance customer satisfaction and delight. In particular, this study examines whether, parallel to the well-established service quality–satisfaction–loyalty system (Pandža Bajs 2015; Yoon, Lee, and Lee 2010; Žabkar, Brenčič, and Dmitrović 2010), a service quality–delight–loyalty system might be persuasive.
The links among these constructs are complex, and extant research has not considered contextual factors (e.g., familiarity with the service) sufficiently to determine how they influence the relationships (Dolnicar, Coltman, and Sharma 2015). For example, Kumar, Pozza, and Ganesh (2013) reason that customer involvement—which Oliver (2010) describes as a correlate of prior customer experience—should influence the satisfaction–loyalty relationship. In their meta-analysis regarding satisfaction and loyalty intentions, Dolnicar, Coltman, and Sharma (2015) reveal that prior consumption experiences may influence the way tourists develop intentions to return to a destination. Accordingly, as its third aim, this article examines whether the satisfaction–loyalty and delight–loyalty relationships are contingent on prior experience.
To examine the potentially parallel roles of the quality–satisfaction–loyalty and quality–delight–loyalty systems, this study draws on spectator sporting events: the empirical setting in noteworthy prior studies (Harris and Ogbonna 2008; Madrigal 2006; Pons, Mourali, and Nyeck 2006). Regional (Daniels 2004; Gandhi-Arora and Shaw 2002), national (Hall, O’Mahony, and Vieceli 2010), and international (Kaplanidou et al. 2013; Kim et al. 2015) sporting events help reduce the seasonality of tourist flows, improve a destination’s position in the market, and foster destination development (Bosnjak et al. 2016; Chen 2010; Kaplanidou et al. 2013; Weed 2009). Amongst the travel that concerns such sporting events, day trips are a significant element of sports tourism (Weed 2009). Other than a few studies of tourists who travel to attend sporting events (Dong and Siu 2013; Kim et al. 2015; Leask 2010), research into associated visitor intentions and behaviors remains sparse though (Weed 2009). Because the experiences surrounding sporting events are manifold and multidimensional, this setting is suitable for examining whether service quality relates to customer satisfaction and delight, as antecedents of loyalty (cf. Dong and Siu 2013; Humphreys 2010). Finally, sporting events represent an appropriate setting because the industry is “in the early throes of programmatic loyalty” (Oliver 2010, p. 443).
With these research aims and setting, this study offers four main contributions. First, the empirical findings reveal generally similar, strong, separate, positive effects of both satisfaction and delight on loyalty intentions. Second, they substantiate the parallel roles of both the quality–delight–loyalty and the quality–satisfaction–loyalty systems. Third, this study substantiates that while greater prior service consumption experience (PSCE) is associated with lowered service evaluations and reduced satisfaction and delight, it amplifies the relationship between delight and loyalty. These combined insights enhance understanding of the inconsistent prior findings regarding the simultaneous impacts of delight and satisfaction on customer loyalty. Fourth, this study has notable managerial implications: To strengthen loyalty, investing separately in both visitor satisfaction and delight is effective; to enhance visitor loyalty through satisfaction and delight, managers must attend to germane service quality dimensions and associated service attributes; and visitors cannot be treated homogenously but instead should be distinguished, according to their PSCE, to leverage a firm’s investment in delighting visitors.
Conceptual Foundations and Hypotheses Development
Psychological theories of attitude formation and consequences support the simultaneous roles of satisfaction and delight in shaping loyalty intentions and PSCE’s moderating role on these relationships. First, attitudes represent evaluative judgments that summarize cognition and affect experienced in relation to an object (Crano and Prislin 2006). In this study, satisfaction and delight represent such attitudes that are formed in travel and tourism contexts, especially those relating to sporting events. Second, Fishbein and Ajzen’s (1975) expectancy-value model implies that attitudes are a function of beliefs and that these beliefs are a product of the expectancy and value attached to each of the perceived attributes of the attitude object. Through a meta-cognitive process, individuals first evaluate attributes and then form judgments about these evaluations (Jost, Kruglanski, and Nelson 1998), representing multilayered judgments such that quality-related evaluations can yield summative satisfaction and delight attitudes. Third, according to Alba and Hutchinson’s (1987) attribute evaluability theory, experienced customers possess more highly developed conceptual structures and are better equipped to evaluate the meaning of service attributes than novice customers such that, when customers with little or no PSCE are less concerning in evaluating service attributes, they are more likely to heavily weight service quality attributes, especially those that are easy to evaluate (Dagger and O’Brien 2010) when forming satisfaction and delight attitudes. Fourth, Fishbein and Ajzen’s (1975) theory of reasoned action posits that intentions mediate the relationship between attitudes and behavior. Hence, satisfaction and delight should directly affect loyalty intentions. Fifth, while attitudes represent evaluations reflecting some degree of favor or disfavor (Eagly and Chaiken 1993), they are also characterized by their strength (Fazio and Zanna 1981). Associated properties such as prior experience (Regan and Fazio 1977) are antecedents of attitude strength, whereas those such as influence on behavior (Krosnick and Petty 1995) are consequences of attitude strength such that greater strength of an attitude bolsters the impact of that attitude on intentions and behaviors (Armitage and Conner 2000; Bassili 2008). In this way, attitude strength refers to the extent to which an attitude is consequential. Accordingly, as PSCE produces greater attitude strength, the effects of satisfaction and delight on loyalty intentions should increase with greater PSCE.
Service Satisfaction, Delight, and Loyalty
The conceptualization of the parallel roles of customer satisfaction and delight as antecedents of loyalty draws on Oliver, Rust, and Varki (1997). Customer loyalty is “a deeply held commitment to re-buy and re-patronize a preferred product or service constantly in the future” (Oliver 1999, p. 34). Loyal customers are willing to recommend their service provider and spread positive word of mouth (Akamavi et al. 2015; Kumar, Pozza, and Ganesh 2013; Magnini, Crotts, and Zehrer 2011; Taplin 2013; Žabkar, Brenčič, and Dmitrović 2010).
Satisfaction and delight, as determinants of loyalty, arise from an evaluative process, which draws on experience-based beliefs and needs (Oliver, Rust, and Varki 1997). These judgments of overall satisfaction and overall delight, respectively, encapsulate the complete service consumption, accounting for a range of service dimensions that capture distinct service attributes (Albayrak and Caber 2015; Oliver 2010). For example, in a sporting event context, satisfaction and delight reflect a multitude of service consumption episodes, which might not be sequential but rather could occur concomitantly or at various times (Sarstedt et al. 2014). The satisfaction and delight obtained from attending a particular event thus results from aggregated assessments of various service attributes, which might not contribute to the same extent (Albayrak and Caber 2015; Oliver 2010).
Customers’ evaluations of services can be primarily cognitive, primarily affective, or both (cf. Finn 2012), forming attitudes reflecting their satisfaction or delight, or both (Finn 2012; Oliver, Rust, and Varki 1997). Customer satisfaction tends to refer to the end state of a process, during which the customer evaluates subjectively perceived benefits attained from using a service (Oliver 2010; Oliver, Rust, and Varki 1997). Lower-order or utilitarian benefits that provide confidence and security often underlie satisfaction judgments (Augustín and Singh 2005; Chitturi, Raghunathan, and Mahajan 2008), so satisfaction generally represents a “more cognitive” (Finn 2005, 105) evaluation of how well the service delivers, as well as the pleasure or fulfillment obtained through consumption (Oliver, Rust, and Varki 1997; Wang 2011). Satisfaction then exerts a positive effect on loyalty (Akamavi et al. 2015; Yuan and Jang 2008; Žabkar, Brenčič, and Dmitrović 2010).
Hypothesis 1: In a sporting event setting, satisfaction has a positive effect on loyalty intentions.
Although customer satisfaction is a prominent goal for tourism and travel operators, merely satisfied customers might not be loyal (Dolnicar, Coltman, and Sharma 2015; Kumar, Pozza, and Ganesh 2013). Instead, customer delight might be a critical, though not sufficiently investigated, aspect (Albayrak and Caber 2015; Magnini, Crotts, and Zehrer 2011). Plutchik (1980) and Oliver, Rust, and Varki (1997) argue that customers feel delight when they perceive a surprising and positive level of service performance, so it is distinct from satisfaction. Oliver, Rust, and Varki (1997) further explain that a surprisingly positive service performance initiates arousal, prompting positive affect that in turn invokes delight and, separately but parallel to the direct effect of satisfaction, delight also is an antecedent of loyalty intentions. Thus, it would be erroneous to measure customer satisfaction and equate high ratings with delight (Magnini, Crotts, and Zehrer 2011). Instead, delight mainly reflects higher-order and hedonic (i.e., enjoyment-related) benefits (Chitturi, Raghunathan, and Mahajan 2008).
Despite the apparent importance of satisfaction and delight as coinciding determinants of customer loyalty (Oliver 2010), few empirical studies assess their parallel effects, which makes the inconsistent findings particularly noteworthy. Oliver, Rust, and Varki (1997) confirm an effect of delight on loyalty intentions—though weaker than the effect of satisfaction—among symphony visitors but not among theme park visitors, for whom the effect of satisfaction was stronger. Examining website surfing activities, Finn (2005) reveals an effect of delight on loyalty intentions that is conditional on how satisfaction influences loyalty intentions. Finn (2006) also finds strong variations in the impacts of customer delight and satisfaction on loyalty intentions across divergent data (e.g., website services, survey respondents). Investigating unrelated support services for a restaurant visit, Wang (2011) confirms that loyalty depends on both delight and satisfaction, and that the influence of delight is stronger; Kim (2011) presents similar results regarding the loyalty of tourists. However, in a rural tourism context, Loureiro (2010) finds that satisfaction has a stronger influence than delight, and Kim, Vogt, and Knutson (2015) show that satisfaction of tourists relates more strongly to loyalty than delight does. Finally, Bartl, Gouthier, and Lenker (2013) confirm a significant effect of delight on loyalty intentions but an insignificant effect of satisfaction in an online retailing setting.
These divergent findings do not offer a consistent understanding. However, delight, as comprising joy and surprise (Plutchik 1980) because of positive service performance, arousal, and positive affect, is a positively valenced state that creates a desire for recurrent sensations (Oliver 2010) so that it should yield loyalty intentions (Finn 2012; Oliver, Rust, and Varki 1997).
Hypothesis 2: In a sporting event setting, delight has a positive effect on loyalty intentions.
Service Quality
More recent conceptualizations consider perceived performance as a measure of service quality, particularly concerning tourism and travel-related services (Albayrak and Caber 2015; Kelley and Turley 2001; Ko, Zhang, and Cattani 2011; Theodorakis, Alexandris, and Ko 2011). That is, performance judgments relate to a multitude of service attributes (Gudergan and Ellis 2007; Mathies, Gudergan, and Wang 2013; Oliver, Rust, and Varki 1997). Service quality, in turn, refers to a customer’s perception of service performance, based on evaluations of service dimensions and their associated service attributes.
Extensive studies also confirm service quality as an antecedent of customer satisfaction, such that improved service quality leads to enhanced customer satisfaction (Pandža Bajs 2015; Yoon, Lee, and Lee 2010; Yuan and Jang 2008; Žabkar, Brenčič, and Dmitrović 2010). This reasoning mimics Oliver, Rust, and Varki’s (1997) view, in that positive levels of service performance exogenously initiate the mediated effects—through satisfaction and delight—which produce loyalty intentions. Thus, service quality and its respective dimensions should act as an antecedent of satisfaction and delight. Each service quality dimension reflects a composite set of service attributes that customers consider when they evaluate the quality of that service dimension. The assessment of customers’ quality perceptions reflects an attribute-level approach (cf. Albayrak and Caber 2015), to better judge the quality dimensions. Customers could have highly positive views of the performance of an attribute while simultaneously expressing highly negative perceptions of other attributes that relate to the same service quality dimension. Similarly, the quality perceptions of different service dimensions influence overall satisfaction and overall delight (Oliver, Rust, and Varki 1997; Wang 2011).
Hypothesis 3: In a sporting event setting, greater perceived quality of the set of service dimensions leads to greater customer (a) satisfaction and (b) delight.
The Role of Prior Service Consumption Experience
Inconclusive empirical findings pertaining to the simultaneous effects of satisfaction and delight on loyalty intentions have prompted researchers to consider factors that might moderate these relationships. Customer involvement, which Oliver (2010) describes as a correlate of PSCE, is one such moderator (Finn 2005; Oliver, Rust, and Varki 1997). Wang, Gudergan, and Lings (2008) and Kumar, Pozza, and Ganesh (2013) reason that customer involvement should influence the satisfaction–loyalty relationship. Dolnicar, Coltman, and Sharma (2015) also suggest that examinations of the link between satisfaction and behavioral intention should consider the impact of visit history variables, which could affect the way visitors develop intentions to return to a destination.
Despite some suggestions that PSCE (i.e., number of past purchases or visits, see Chandrashekaran et al. 2007; Raju, Lonial, and Mangold 1995) can influence behavioral intentions, our understanding of whether and how PSCE moderates the satisfaction–loyalty and delight–loyalty relationships remains limited. The moderation is plausible, because both satisfaction and delight likely capture experience-dependent reflections (Wang 2011) where greater familiarity and frequency of thought regarding these attitudes increases their strength (Bassili 2008; Krosnick and Petty 1995). Thus, satisfaction and delight likely are more consequential when these attitudes are stronger (Chandrashekaran et al. 2007; Smith et al. 2008), implying a positive moderation role of PSCE. Hence, greater PSCE should increase certainty about satisfaction and delight judgments and amplify their impact on loyalty intentions (Chandrashekaran et al. 2007; Smith et al. 2008). Notwithstanding some inconclusive findings (Palau-Saumell et al. 2013), most empirical studies support this notion for the satisfaction–loyalty relationship (Brakus, Schmitt, and Zarantonello 2009; Homburg, Giering, and Menon 2003; Mittal, Katrichis, and Kumar 2001; v. Wangenheim 2003), yet we lack understanding concerning the delight–loyalty relationship.
Hypothesis 4: In a sporting event setting, increases in PSCE strengthen the impact of (a) satisfaction and (b) delight on loyalty intentions.
In their study, Matzler et al. (2008) suggest that visitor experience (first-time vs. repeat visitors) would not affect how different service performance dimensions relate to satisfaction. Then, Weaver, Weber, and McCleary (2007) suggest that travel experience (e.g., number of countries visited, length of stay) is related to satisfaction judgments. In leaning on Dagger and O’Brien (2010) who draw on attribute evaluability theory (Alba and Hutchinson 1987), experienced customers possess more highly developed conceptual structures and are better equipped to evaluate the meaning of service attributes than novice customers. That is, customers with greater PSCE should be more concerning and better able to critically evaluate services in ways that inexperienced customers may not (Dagger and O’Brien 2010). Even when customers with lesser or greater PSCE base perceptions on the same set of service attributes, it is likely that they will however weight them differently (Alba and Hutchinson 1987). As customers with little or no PSCE are less discerning in judging the value of service attributes, they are less discriminating and more likely to heavily weight service quality attributes, especially those that are easy to evaluate (Dagger and O’Brien 2010) when judging service quality and forming satisfaction and delight attitudes.
Hypothesis 5: In a sporting event setting, lower levels of PSCE are associated with higher levels of (a) perceived service quality, (b) satisfaction, and (c) delight.
Empirical Analysis
Sample
The sample consists of premium customers (i.e., customers who occupy premium and business seats [PCs]) of a German Bundesliga soccer league club. Such clubs have an important role, because their matches often help define the image or stereotypical picture of a tourism destination (Zenker and Beckmann 2012). Premium and business seats also often are available in sporting event–related travel packages (Humphreys 2010), and accounting for Weed’s (2009) considerations of day-trips as a significant element of sports tourism, these PCs represent a important group of tourists. PCs also are important to the long-term performance of event and related tourism operators, because they generate substantial revenues through ticket sales, food sales, and merchandising (Humphreys 2010). To manage spectator sports effectively, it is important to identify aspects that are critical to PCs and explore the service quality dimensions, and their associated attributes, that can satisfy and delight PCs. However, PCs have not been the exclusive focus of prior empirical studies.
This study employs two survey approaches to access PC respondents. First, six market researchers randomly approached PCs after an event, as they were leaving the PC area, and elicited their responses. Second, all PCs from the club’s customer database received e-mail invitations to complete an online version of the survey. To encourage participation, respondents could enter a lottery to win additional PC tickets. Within four weeks, 351 PCs responded. The average duration to complete the questionnaire was 9.3 minutes. The sample includes 85.19% male and 14.81% female respondents, who noted 6.31 PC area visits in the last twelve months (standard deviation = 4.33) on average and an average age of 41.16 years (standard deviation = 11.67).
Several checks served to confirm the suitability of respondents: First, a check for nonresponse bias confirmed that the demographic characteristics of respondents did not differ significantly from those of the total population of the club’s PCs. Second, a comparison of the 275 respondents to the online version with the 76 respondents who interacted with the market researcher in person revealed no significant differences. Then, the model estimates for each of the two groups revealed estimated parameter signs that were consistent with the predictions. However, any conclusions drawn from assessing these estimates should be considered cautiously, because of the limited number of respondents who were interviewed personally (n = 76). Still, because the mean values of the variables characterizing the two groups do not show any statistically significant differences, in terms of demographic characteristics or other measurement items, pooling the data from these two groups is acceptable. Finally, a comparison of the first and last waves of responses revealed no statistically significant differences (α <.01), so nonresponse bias does not appear to be a critical issue.
Construct Measures
The choice of formative or reflected measurement mode follows Jarvis, MacKenzie, and Podsakoff (2003). The response format for most items was a predefined, Likert-type scale, ranging from 1 (strongly disagree) to 5 (strongly agree). Multi-item measurement models ensured the reliable, valid measurement of loyalty, satisfaction, and delight (Appendix, Table A1). The three-item satisfaction scale came from a scale that Wang (2011) adapted from Finn (2005). To measure delight, this study extended Finn’s (2005) three-item delight scale with two items to capture arousal (unforgettable experience) and positive affect (pride) (cf. Oliver, Rust, and Varki 1997). The loyalty (intention) measure used a two-item scale from Finn (2005) (cf. Chitturi, Raghunathan, and Mahajan 2008). Following Chandrashekaran et al. (2007) and Raju, Lonial, and Mangold (1995), the number of prior visits served as the single-item measure of PSCE.
Hierarchical measurement approaches are effective to assess of service quality (e.g., Žabkar, Brenčič, and Dmitrović 2010), but such approaches concerning sporting events are sparse (cf. Theodorakis, Alexandris, and Ko 2011). The dimensions that spectators generally consider during their sporting event service consumption include sportscape characteristics and peripheral services (Table 1), as well as outcome dimensions (e.g., game quality) (Ko, Zhang, and Cattani 2011; Yoshida and James 2010). These prior studies focus on ordinary spectators, rather than on PCs. The specific attributes that PCs consider important may not match those that general spectators emphasize. Particularly, PCs likely value different attributes (Harris and Ogbonna 2008; Madrigal 2006; Pons, Mourali, and Nyeck 2006), and some services offered to PCs differ from those provided to ordinary spectators (e.g., host services). Therefore, the empirical examination of the role of PCs’ quality perceptions requires the development of an appropriate measurement model that captures service quality dimensions relevant to PCs. With a few notable exceptions (Sarstedt et al. 2014; Theodorakis, Alexandris, and Ko 2011), studies have not adopted a formative approach to measure sporting event service quality. More broadly, tourism-related studies that adopt formative measurement approaches are relatively recent (cf. do Valle and Assaker 2015). Yet this approach is appropriate for the hierarchical service quality model adopted here, because it presumes that quality perceptions of the service attributes cause a service quality dimension, not vice versa (Dagger, Sweeney, and Johnson 2007). This formative approach also allows identifying the multitude of attributes that constitute service quality, including specific dimensions that contribute to satisfaction and delight.
Sporting Events Service Encounters.
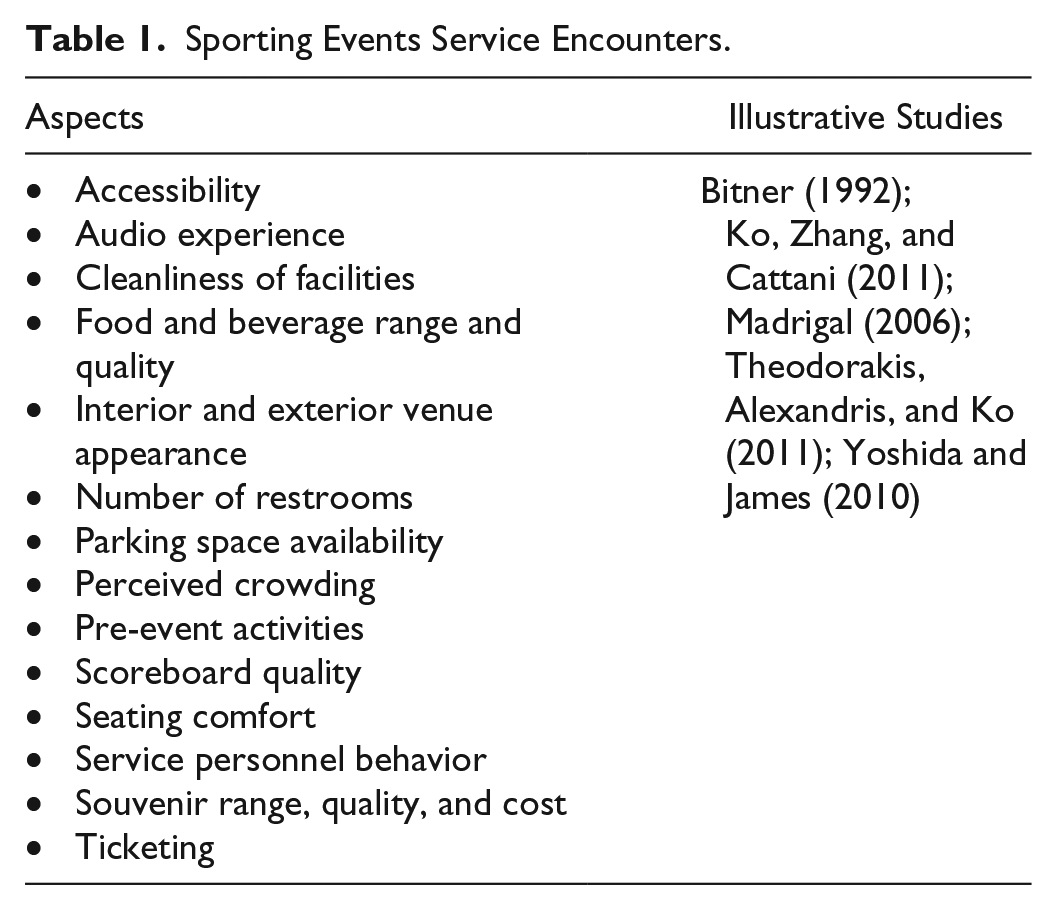
A synthesis of prior studies (Table 1) and managerial insights reported in the business press provided the foundation for defining applicable service attributes. The servicescape affects customer evaluations of service encounters; such tangible evidence should influence PC satisfaction and delight because “the servicescape provides a visual metaphor for an organization’s total offering,” reflecting “the potential usage and relative quality of the service” (Bitner 1992, p. 67). Similarly, peripheral services (e.g., food and beverage quality, service employees) should influence PC satisfaction and delight.
Following Dolnicar, Coltman, and Sharma (2015), we worked with the marketing managers of the German Bundesliga soccer league club to refine the set of service dimensions and attributes. The final validation procedure involved adding, adapting, and redrafting some statements, resulting in 36 formative measurement items that represent the essential elements of six potential PC service quality dimensions (ticketing, accessibility, stadium, PC area functionality, PC area atmosphere, and food and beverage service; 1 see Table 3). The ticketing dimension captures perceived performance when purchasing tickets; accessibility refers to the ease of access to the venue and the seat; and the stadium dimension involves the appearance, cleanliness, and functional character of the stadium. The service quality dimension of PC area functionality focuses on the perceived performance of the basic, genuinely functional character of the PC area; the perceived performance of the aspects that contribute to the atmosphere in these areas is captured by the PC area atmosphere dimension. Finally, a specific construct captures the perceived performance of the food and beverage service in the PC area.
The measures of quality perceptions used five-point Likert-type scales (“not satisfied with the quality” to “extremely satisfied with the quality”) and gauge the perceived performance of each attribute that contributes to a service quality dimension. Capturing quality perceptions in explicit relation to satisfaction reflects Oliver, Rust, and Varki’s (1997) conceptualization of satisfaction and delight.
Finally, single-item measures—as supplements to each formative service quality dimension—support assessments of the validity of the multi-item measurement models. Regressing each of the six formative models on its respective single-item measure reveals high standardized regression coefficients that explain more than 80% of each item that represents one of the formative service quality dimensions. The formative measurement models’ nomological validity is, thus, affirmed (Hair et al. 2017).
Estimation Procedure and Results
Partial least squares structural equation modeling (PLS-SEM) (Hair et al. 2017) is widely used, including in tourism and travel research (do Valle and Assaker 2015), and suitable for the present study. That is, PLS-SEM supports prediction-oriented research (i.e., predictions of loyalty intentions) and facilitates the unrestricted implementation of formative measurement models. Furthermore, PLS-SEM can deal with complex model structures and a large number of indicators, yet it requires a comparatively smaller sample size and does not demand normally distributed data. The software SmartPLS 3.2 (Ringle, Wende, and Becker 2015) provides the model estimates. The settings include a path weighting scheme, a maximum number of 300 iterations, a stop criterion of 10−7, and +1 as an initial value for all outer relationships. Following Hair et al. (2017), the analysis of interaction effects follows a two-stage approach with standardized data to generate product terms to compute interaction effects.
Assessments
Measurement mode
The six service dimensions draw on formative measurement models; the measures of delight, satisfaction, and loyalty instead are reflective. The qualitative criteria provided by Jarvis, MacKenzie, and Podsakoff (2003) support this a priori theoretical conceptualization. The ex post test of the measurement mode draws on confirmatory tetrad analysis (CTA-PLS) (Gudergan et al. 2008). The results imply rejection of the reflective measurement mode for the respective service quality dimensions and, thus, substantiate their formative nature empirically, as theoretically established.
Reflective measurement models
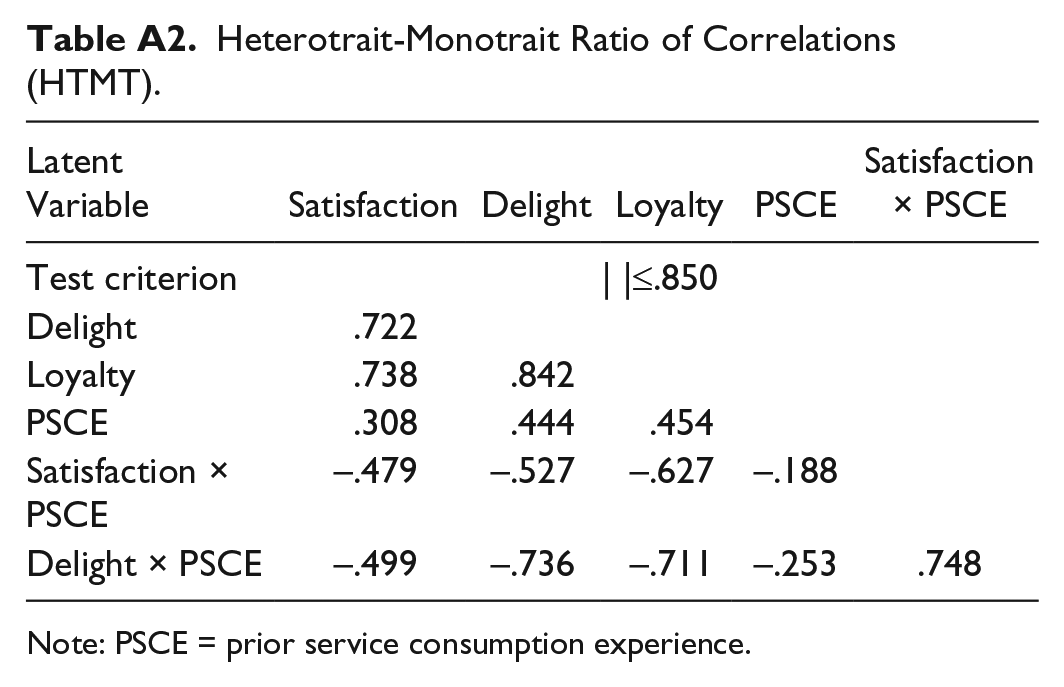
Indicator reliability, average variance extracted [AVE], and internal consistency serve to assess the reliability of reflective measurement models (Hair et al. 2017). All indicators of the reflective measurement models exhibit very high loadings, above the critical value of .70 (Table 2). The internal consistencies are satisfactory; values exceed the threshold of .70, and the AVE for each model is sufficient (Table 2). Finally, discriminant validity is established on the basis of the heterotrait–monotrait ratio of correlations (HTMT), a procedure superior to the commonly considered Fornell–Larker criterion and assessments of cross-loadings (Henseler, Ringle, and Sarstedt 2015). The results (Appendix, Table A2) show that all HTMT85 values of the latent variables are below the critical and conservative value of .85.
Reflective Measurement Model Assessment.
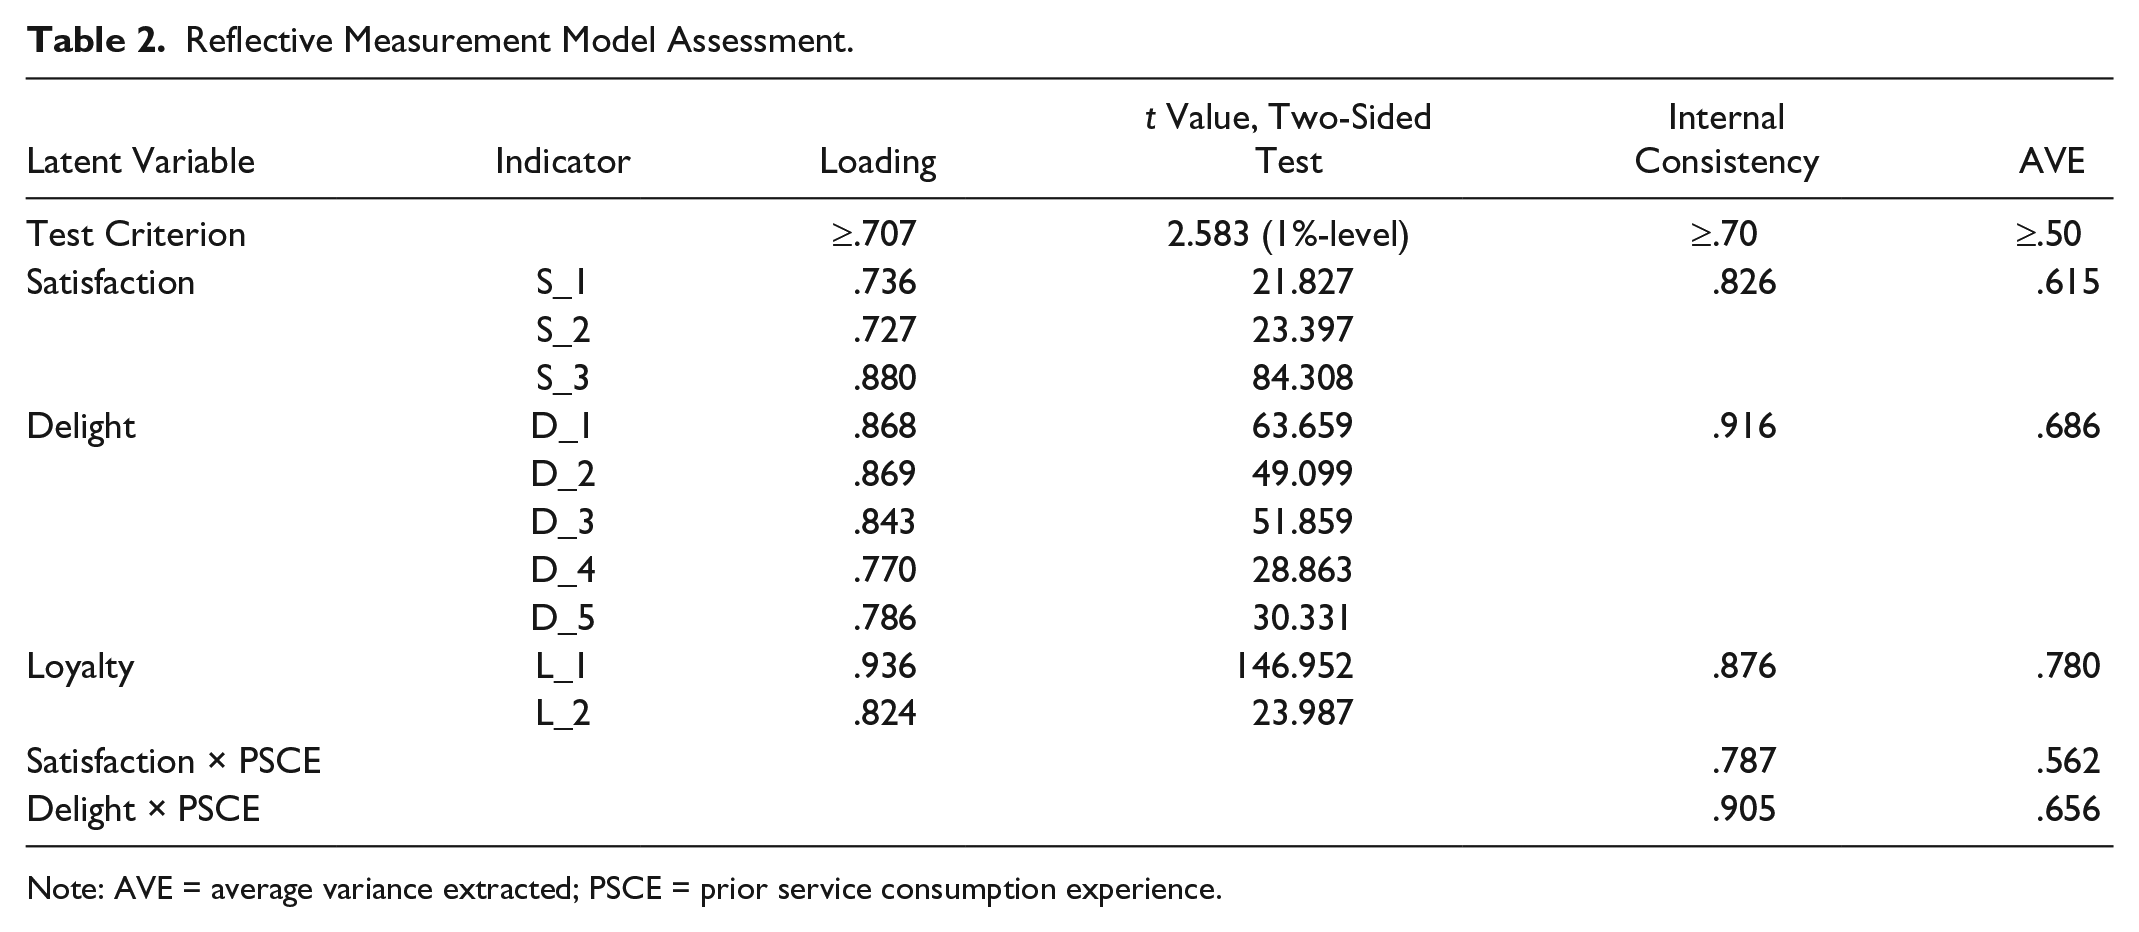
Note: AVE = average variance extracted; PSCE = prior service consumption experience.
Formative measurement models
The assessment of formative measurement models follows Hair et al. (2017). Expert opinions from researchers and practitioners support content and face validity for each of the six formative measurement models that constitute one of the service quality dimensions. Despite the lack of supplementary statistical assessments of conceptually specified formative indicators, the indicators’ weights demonstrate their relative contribution to the measurement model, representing a useful criterion. Table 3 displays the size, algebraic sign, and significance of the weights generated using the bootstrapping procedure with 1,000 subsamples and the “no sign change” option.
Formative Measurement Model Assessment.
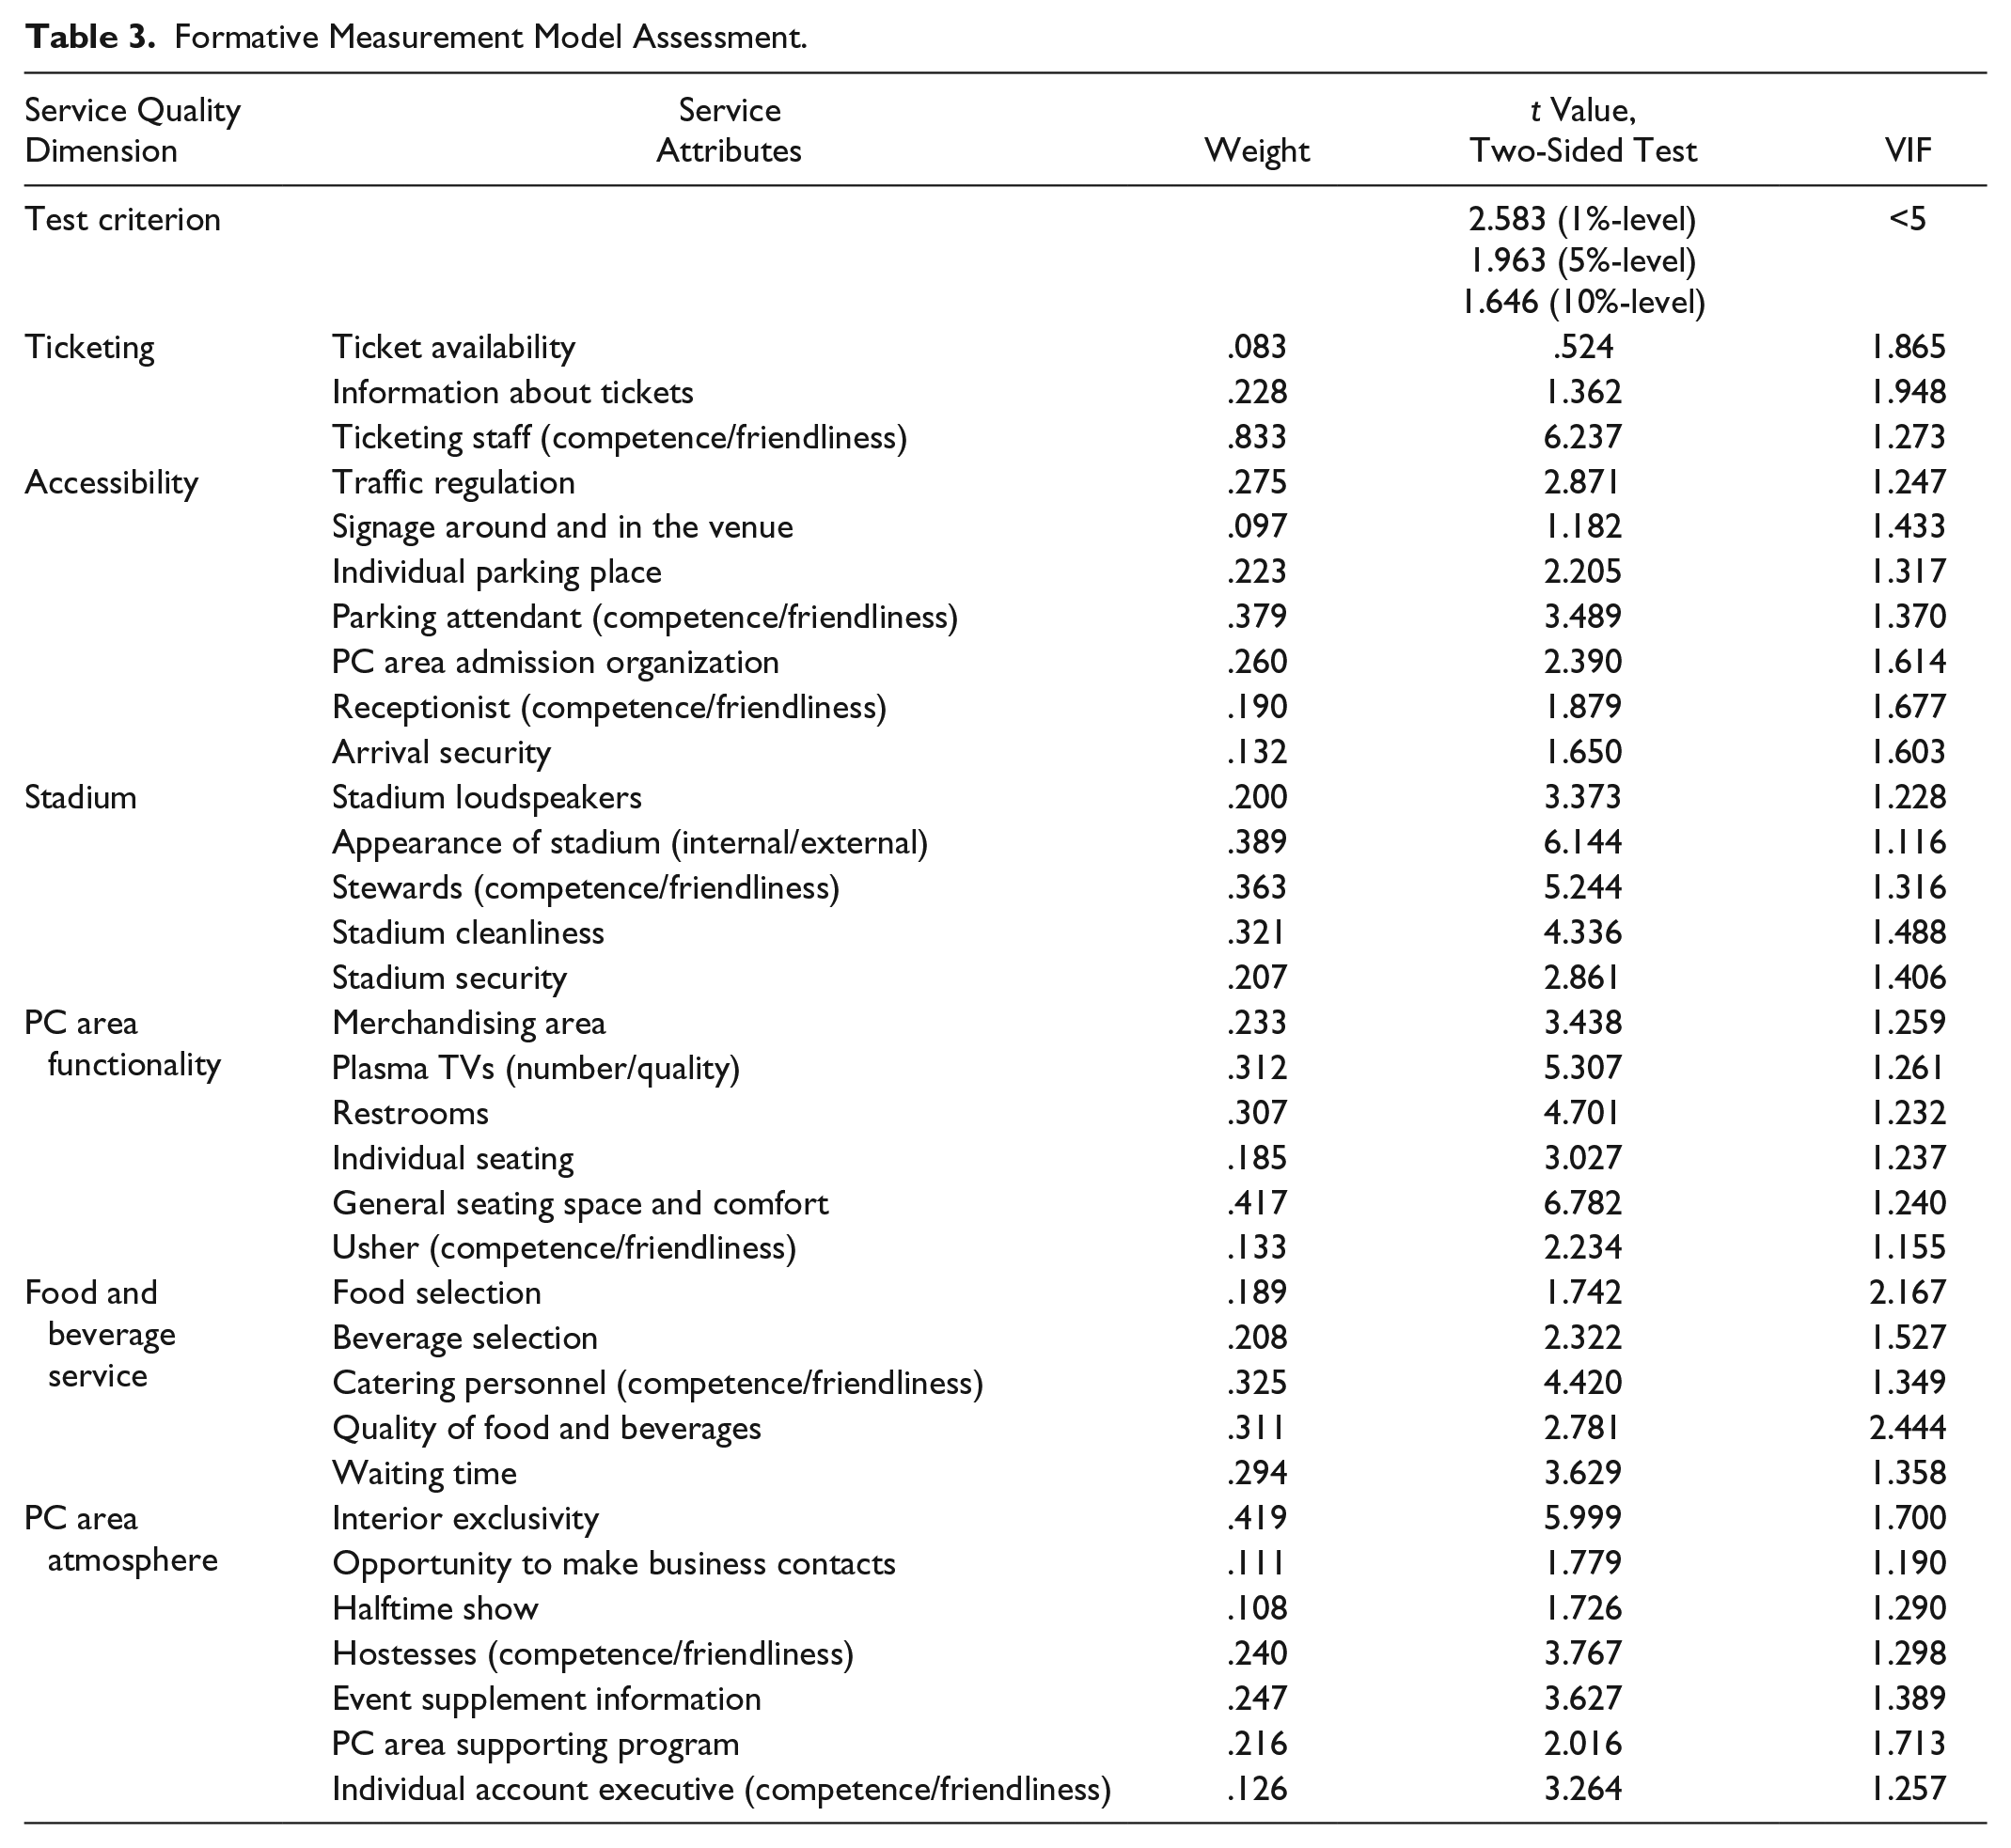
The indicators’ weights on the formative items are significant (α<.10), with the exceptions of signage and the availability of and information about PC tickets (Table 3). These items do not contribute significantly to the respective quality dimension, yet they are retained to avoid any exclusion of conceptually and managerially relevant content. Finally, the variance inflation factors are all below 5.0 (Table 3), so collinearity of the items is not a concern.
Structural model
The variance explained by the model (R²) is 64% for satisfaction, 44% for delight, and 42% for loyalty (Figure 1). The moderating effect of PSCE on the satisfaction–loyalty and the delight–loyalty relationships contributes to the explanatory power of the model by enhancing the R² of loyalty by 1.5 percentage points. Moreover, Stone-Geisser’s Q² criterion is greater than 0 for satisfaction, delight, and loyalty, supporting the exogenous latent variables’ predictive relevance (Hair et al. 2017). Figure 1 also indicates the significance and importance of the path coefficients, through the magnitude of their standardized values. The key structural model relationships are significant, based on bootstrapping results. However, neither the effects of ticketing and stadium on delight, nor the effects of accessibility and the interaction term of satisfaction and PSCE, nor the direct effect of PSCE on loyalty (included to implement the interaction terms), is significant. Notably, PSCE’s direct effect is at the borderline of significance (t value = 1.62), indicating the possibility of the direct effect identified in other studies (cf. Song et al. 2012). The test of the mediating effects of satisfaction and delight integrates the six service quality dimensions’ direct effects on loyalty into the model. None of the direct effects exhibited significant path coefficients. As hypothesized, the exogenous service quality dimensions are fully mediated by satisfaction and delight. Testing for full or partial mediation of delight’s effect on loyalty through satisfaction, as well as full or partial mediation of satisfaction’s effect on loyalty through delight, reveals that the R² values for loyalty decrease substantially (34% in both models) in the full mediation models but remain unchanged in the partial mediation models (42% in both models), confirming the structure of the hypothesized model.
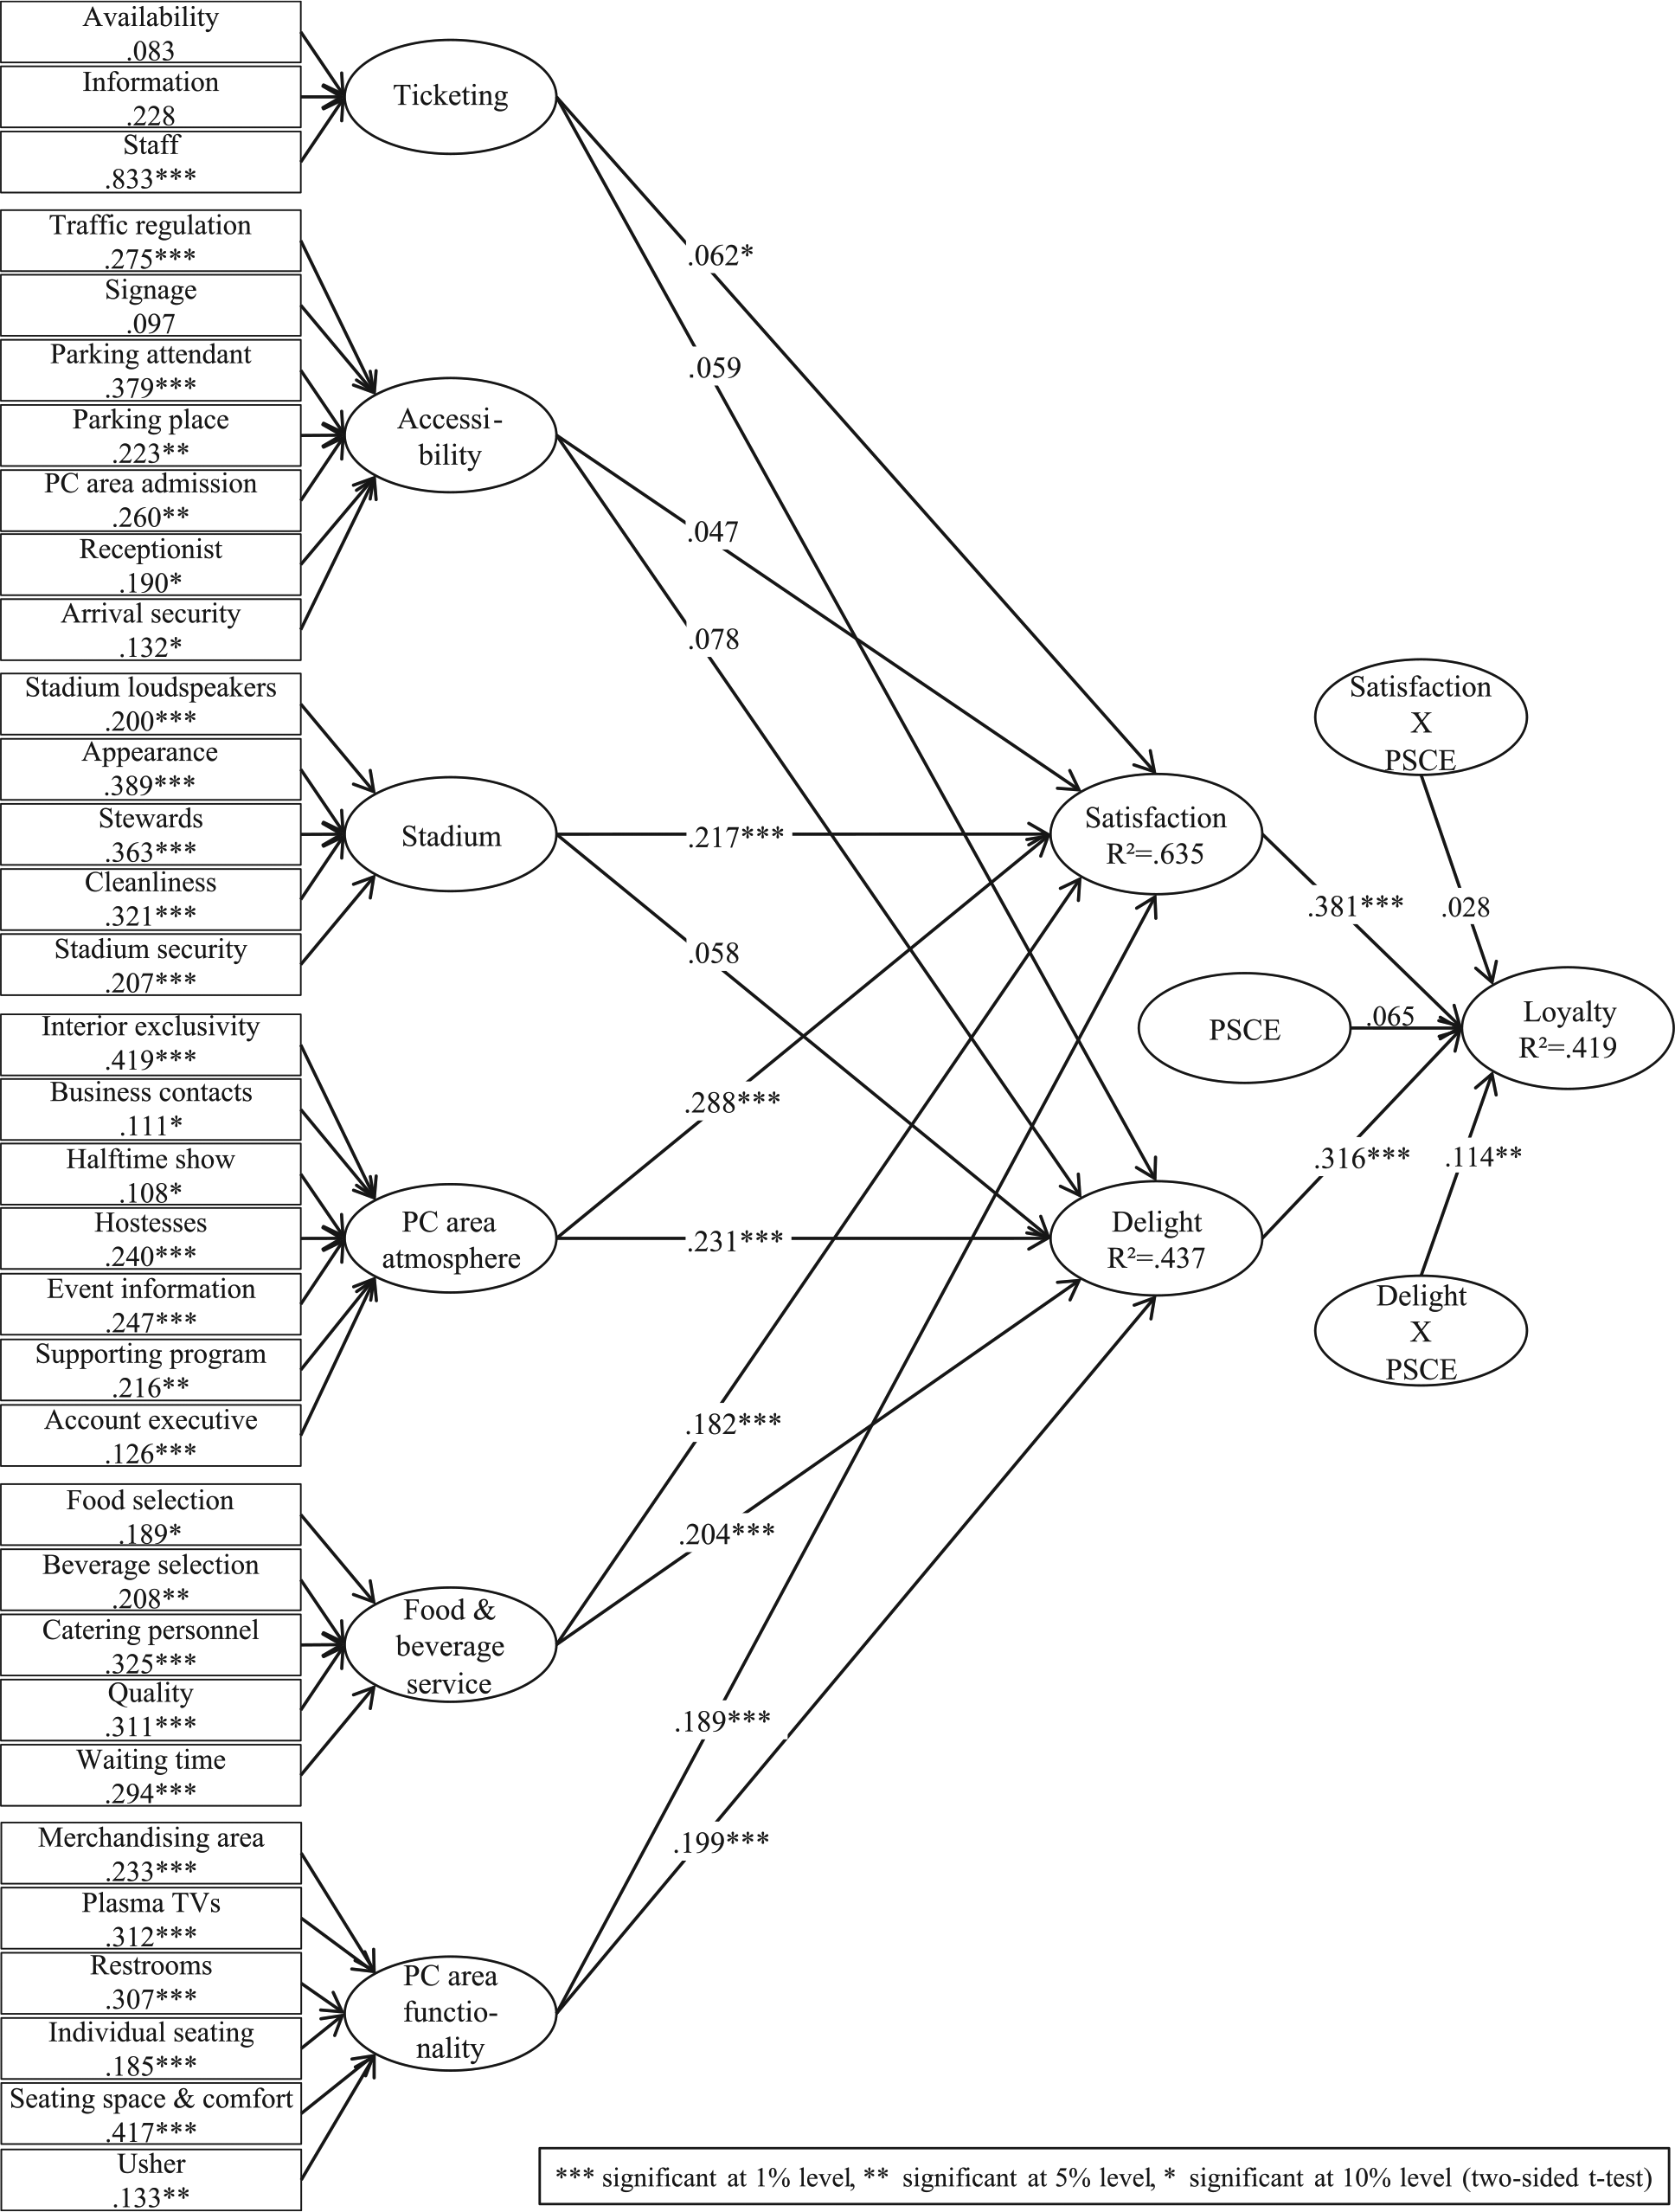
PLS-SEM results.
Assessment of whether PSCE is associated with the levels of service quality, satisfaction, and delight and whether it moderates the impact on loyalty intention draws on multigroup analysis (MGA) and ensuing importance performance analysis (IPA). Model estimations for the hypothesized model (without PSCE’s moderation term) for novice visitors (≤3 visits; n = 143) and experienced ones (≥10 visits; n = 116) serve for this purpose. The performance levels for all service quality dimensions and associated attributes, except for the ticketing dimension, 2 were higher in the novice group compared to the experienced group. Similarly, the performance levels for satisfaction reduced from 73% in the novice group to 62% in the experienced group and for delight from 79% to 65%, indicating that satisfaction and delight performance levels appear lower when PSCE is high. 3 Also, consistent with the moderation analysis, the analyses reveal that satisfaction’s impact (i.e., the path coefficients of satisfaction with loyalty) is similar for customers with high PSCE (0.350) and with low PSCE (0.372) but that delight’s impact is significantly higher for those with high PSCE (0.447) than for those with low PSCE (0.239). Thus, altogether, the additional analyses support the hypothesized model, supporting PSCE’s hypothesized roles—except its moderating effect on the satisfaction–loyalty relationship.
Discussion
Effects of Satisfaction and Delight on Loyalty
The analyses reveal separate positive effects of satisfaction (.381) and delight (.316) on loyalty, in support of hypotheses 1 and 2. The influence of satisfaction on loyalty is consistent with the results of previous studies in related contexts (Akamavi et al. 2015; Palau-Saumell et al. 2013; Taplin 2013; Yoon, Lee, and Lee 2010). Furthermore, the finding of a separate and simultaneous strong influence of delight on loyalty in a sporting event setting confirms Oliver’s (2010) conjecture and, generally, highlights the importance of considering affective states when assessing satisfaction and related tourist attitudes (Lee, Lee, and Choi 2010) and of accounting for delight as a separate loyalty driver in addition to satisfaction. While Magnini, Crotts, and Zehrer (2011) refer to the distinctiveness of delight and satisfaction in travel-related research, other travel-related studies are limited in clarifying the inconsistent findings of only four existent studies related to tourism-related settings (cf. Kim 2011; Kim, Vogt, and Knutson 2015; Loureiro 2010; Wang 2011).
Effects of Service Quality on Satisfaction and Delight
Five of the service quality dimensions shape satisfaction, and three influence delight. In support of hypothesis 3a, ticketing (path coefficient = .062), stadium (path coefficient = .217), PC area functionality (path coefficient = .189), PC area atmosphere (path coefficient = .288), and food and beverage service (path coefficient = .182) relate to satisfaction. Hypothesis 3a has support, confirming that the quality–satisfaction–loyalty system identified in other tourism contexts (e.g., Pandža Bajs 2015; Yuan and Jang 2008) is also persuasive in the sporting event setting studied herein. The data do neither reveal a positive impact of accessibility on satisfaction though, nor positive effects of ticketing, accessibility, or stadium on delight. Therefore, delight is established only by those dimensions that belong to the PC area. The service quality dimension PC area atmosphere is more important (path coefficient = .231) than either PC area functionality (path coefficient = .199) or food and beverage service (path coefficient = .204). These results support hypothesis 3b and imply that the predicted quality–delight–loyalty system is plausible in the sporting event setting. Satisfaction and delight emerge, as hypothesized, as overall evaluations that draw on aggregated quality assessments of the relevant dimensions and associated service attributes.
Service dimensions that exist prior to an actual visit to the sporting event do not appear to influence satisfaction or delight judgments subsequent to experiencing the sporting event (accessibility), or else only influence satisfaction (ticketing) to a minor extent. Therefore, in this empirical setting, service consumption may only begin after PCs enter the sporting event venue. This is different to other settings like tourist shopping where, for example, accessibility appears as one key factor influencing satisfaction with tourist shopping (Wong and Wan 2013). The service consumption episodes that primarily contribute to PC satisfaction, delight, and consequently loyalty intentions refer to quality dimensions related to the stadium, PC area functionality, atmosphere, and food and beverage service.
The Role of Prior Service Consumption Experience
The data also support hypothesis 4b: Delight translates more (less) into loyalty if the sporting event visitors have greater (lower) PSCE (Figure 1). The influence of delight on loyalty intentions, according to the strength of the path coefficient, increases (decreases) by .114 when PSCE increases (decreases) by one standard deviation. This finding sheds light on inconclusive previous findings that failed to confirm an effect of delight, in that delight might not influence novice customers’ loyalty in extreme cases. The hypothesized moderating effect of PSCE on the satisfaction–loyalty relationship showed the assumed positive sign, but was not significant, so hypothesis 4a does not receive statistical substantiation. These insights concerning hypotheses 4a and 4b suggest reexamining Dolnicar, Coltman, and Sharma’s (2015) conclusion, who considered solely satisfaction (without delight) and reasoned that familiarity might influence the effect of satisfaction on loyalty intentions but revealed that instead of satisfaction, experience influences a tourist’s intention to return: disregarding the quality–delight–loyalty system may yield spurious findings regarding the quality–satisfaction–loyalty system.
A speculative explanation of the apparent role of PSCE as amplifying the relationship between delight and loyalty intentions—but not that one involving satisfaction—can draw on Bassili’s (2008) work concerning the properties of attitude strength of which one is attitude importance. Attitude importance refers to “the degree to which a person is passionately concerned about and personally invested in an issue” (Krosnick 1990, p. 60). Boninger, Krosnick, and Berent (1995) identify two aspects that play a role in the importance of an attitude: self-interest capturing an individual’s feeling that the attitude is instrumental to obtaining personally desired benefits and value relevance referring to the individual’s feeling that the object of the attitude is relevant to personal values. In line with the earlier offered definition of attitudes as representing evaluative judgments that summarize cognition and affect experienced in relation to an object (Crano and Prislin 2006) such that satisfaction represents a primarily cognitive-based attitude and delight one which is affect-based, their strength need to be examined in terms of attitude importance. Zajonc (1980) posits that affect-based attitudes involve the self, whereas attitudes that are cognition-based are less directly reflective of the self. Because attitude importance is influenced by self-interest, a strength property (Boninger, Krosnick, and Berent 1995) while in turn influencing attention to the attitude object (Visser, Krosnick, and Simmons 2003), the moderating role of PSCE on the relationship between the relationship of the primarily affect-based delight attitude and loyalty intentions should be more prevailing than that on the relationship involving satisfaction.
Finally, in regard to hypothesis 5, our analyses reveal that lower levels of PSCE are associated with not only greater quality judgments but also higher levels of satisfaction and delight, whereas the reverse is the case for higher levels of PSCE. These insights advance the works of Dagger and O’Brien (2010), who focus on satisfaction but not delight.
Implications and Conclusions
This study provides some clarification by examining the parallel roles of delight and satisfaction in separately and simultaneously influencing loyalty, as well as the role of PSCE as a moderator in the setting of sporting events. Few previous studies investigate the parallel effects of satisfaction and delight on loyalty, and those that do offer inconsistent results. The established presence of a quality–delight–loyalty system, in parallel with that involving satisfaction, and of PSCE’s moderating role allows predicting behavioral intentions more accurately.
Implications for Theory
First, the results substantiate the parallel but separate influences of satisfaction and delight in shaping loyalty intentions. Thus, studies that aim to explain differences in loyalty in tourism and travel settings can benefit from accounting for both satisfaction and delight, in parallel. Second, the confirmation of the quality–delight–loyalty system, operating in parallel with that of the quality–satisfaction–loyalty system, enhances the theoretical understanding that satisfaction and delight represent overall evaluations that draw on aggregated quality assessments of several service quality dimensions, with their distinctive service attributes. Third, the identification of PSCE as a moderator offers a possible theoretical explanation for previous inconsistent results regarding the effects of satisfaction and delight on loyalty. Specifically, explanations that seek to describe how delight influences loyalty could benefit from accounting for PSCE, and attitude importance specifically, so that the extent of this influence can be specified. Fourth, low levels of PSCE are associated with greater quality judgments and higher satisfaction and delight levels than are high levels of PSCE.
In summary, this study is the first to demonstrate that accounting for delight, in parallel to satisfaction, in explaining the formation of loyalty intentions is not only important in itself but that properties of attitude strength, such as attitude importance, matter. Thus, theoretical conceptualizations that seek to explicate loyalty in tourism and travel settings should account for both the direct effects of satisfaction and delight and the indirect effects of service quality dimensions with their associated service attributes, especially those that are germane to a specific travel or tourism setting. Regarding the relationship between delight and loyalty in particular, theoretical arguments should recognize that the link is not independent of prior experiences with the travel or tourism services consumed.
Implications for Practice
For practitioners, the results indicate that (sporting) event service providers can invest in certain service quality dimensions and associated attributes to simultaneously but separately improve overall satisfaction and delight and thereby enhance PCs’ loyalty. However, more experienced travelers may be more discerning in evaluating the services that they consume so that improving satisfaction and delight of experienced customers becomes more challenging. Also, because service quality influences satisfaction and delight, a suitable understanding of what constitutes service quality is beneficial. Using a formative measurement approach for each applicable service quality dimension, managers can recognize which specific service quality dimensions can induce PC loyalty (e.g., PC area atmosphere, PC area functionality, and food and beverage service). When considering the total effects on loyalty, the most important service features that managers must deliver with high quality are interior (design) exclusivity, food and beverages—two features that appear rather unimportant to induce delight in the hotel sector (Magnini, Crotts, and Zehrer 2011)—seating space and comfort (e.g., extra leg room, ergonomic leather seats), and service factors, including individual account executives, hostesses, and catering personnel—all of which require human interactions that should be guided by friendliness and competence. These findings are consistent with other studies that also stress the role of human factors in hotels or tourist information offices (Araña et al. 2015; Magnini, Crotts, and Zehrer 2011). Yet studies regarding alpine ski areas, heritage sites, or tourist shopping rank foremost the tangible physical environment (Matzler et al. 2008; Palau-Saumell et al. 2013; Wong and Wan 2013). Finally, the findings suggest that (sporting) event visitors should not be treated homogenously. The level of PSCE influences the relative impact of delight on loyalty, so segmentation on the basis of PSCE may be beneficial. Services that delight customers should be delivered specifically to frequent visitors.
Practitioners in travel and tourism industries therefore benefit from improving their service quality to improve customers’ satisfaction and delight and, ultimately, their loyalty. Determining the germane set of service dimensions and associated service attributes that matter specifically in a particular travel or tourism industry is essential in this endeavor. They also can benefit from understanding the experience that travelers or tourists have with the particular service, because stimulating loyalty through improving delight is more effective when travelers have more experience with the service.
Limitations and Further Research
First, future longitudinal research could validate the causal nature of the relationships examined in this study. Second, the findings do not confirm hypothesis 4a, but other PSCE-related variables might moderate the relationships or might have direct effects on loyalty’s antecedents. Thus, further research could conduct an extended moderator analysis examining in greater detail different properties of attitude strength. In a similar vein, research could explore whether other sources of (un)observed heterogeneity characterize the strength of the quality–delight–loyalty and quality–satisfaction–loyalty systems (Sarstedt, Ringle, and Gudergan 2016; Ratzmann, Gudergan, and Bouncken, 2016). Fourth, further research could assess the role of nonlinear relationships. Fifth, studies that examine whether game performance matters could yield additional insights.
Footnotes
Appendix
Heterotrait-Monotrait Ratio of Correlations (HTMT).
| Latent Variable | Satisfaction | Delight | Loyalty | PSCE | Satisfaction × PSCE |
|---|---|---|---|---|---|
| Test criterion | | |≤.850 | ||||
| Delight | .722 | ||||
| Loyalty | .738 | .842 | |||
| PSCE | .308 | .444 | .454 | ||
| Satisfaction × PSCE | −.479 | −.527 | −.627 | −.188 | |
| Delight × PSCE | −.499 | −.736 | −.711 | −.253 | .748 |
Note: PSCE = prior service consumption experience.
Acknowledgements
Declaration of Conflicting Interests
The author(s) declared no potential conflicts of interest with respect to the research, authorship, and/or publication of this article.
Funding
The author(s) received no financial support for the research, authorship, and/or publication of this article.
1.
Although sports performance (e.g., results, ensuing game satisfaction) might represent a component of overall service quality (Ko, Zhang, and Cattani 2011; Yoshida and James 2010), Yoshida, Heere, and Gordon (2015) provide empirical evidence that game satisfaction has no significant bearing on behavioral intentions. Therefore, the role of sports performance is not included here.
2.
Contrary to the experienced group, a very high portion of visitors in the novice group was invited by others. Thus, these visitors might not have sufficiently interacted with the ticketing service so that their responses are less meaningful for these attributes.
3.
Because of these findings and to explicate whether prior service consumption experience (PSCE) directly affects satisfaction and delight judgments, further analyses served to estimate these direct effects too. The estimations revealed negative but nonsignificant coefficients for the PSCE–satisfaction relationship (–0.025) and the PSCE–delight relationship (–0.063) whereby the other existing model estimations remained consistent. Furthermore, we examined whether PSCE might moderate any of the twelve relationships between the six quality dimensions and satisfaction or delight. Consistent with  results, the results indicate that PSCE does not moderate these relationships except that it amplifies the relationship between PC area functionality and delight (0.154). These findings further support that, in a sporting event setting, lower levels of PSCE are associated with higher levels of service quality, satisfaction, and delight.