



Abstract
This study investigates which information sources European tourists use when making decisions about their travel/holiday plans. Using survey data based on national representative samples of tourists from 27 member countries of the European Union allows generalizable conclusions to be drawn. The data were analyzed using correspondence analysis of overall country data. The findings indicate that there are systematic differences in how information sources are related to one another and that the various countries within the European Union differ in their tourists’ use of information sources. Six segments of information source behavior are revealed. These segments reflect economic development and the national cultures of European nations. Management implications are highlighted. The findings of this study can be used to segment tourists’ use of information sources according to country, economic development, and national culture.
Keywords
Introduction
The ability to attract tourists is crucial for the success of tourism firms. There is therefore much interest in which information sources tourists use when selecting a destination. Tour operators, tourism providers, and managers of tourist destinations are particularly concerned with which promotional media to use in order to attract tourists. In fact, any marketing strategy designed to attract tourists should include an identification of the information sources used by this market (McGuire, Uysal, and McDonald 1988; Uysal, McDonald, and Reid 1990).
International segmentation may assist tourism firms become more successful in their promotional activities. Being able to identify one or more segments of tourists across countries may help tourism firms find and apply uniform sets of information sources within a group of countries. Such standardization can make it possible for tourism firms to leverage their experiences with promoting their product or services in one country into a segment of countries.
International segmentation can help tourism firms identify which information sources to use across several countries in order to facilitate communication with prospective tourists. Using the same information sources in multiple countries can lead to economies of scale and reduction in the average costs of advertising and marketing communication. When tourists within a targeted segment have the same or a similar pattern of information use, such strategies can be highly effective. International segmentation may then provide both the advantages of standardization in the use of information sources (e.g., lower costs, better communication) as well as the benefits of adaptation (e.g., adapted to the needs of the tourists).
It is not clear what the basis for international segmentation should be (Budeva and Mullen 2014), as this may depend on the type of products and services to be promoted, as well as characteristics of the markets. There are few studies that try to use information source use as a segmentation variable (Gursoy and Umbreit 2004). There is, therefore, a need for more research on international segmentation based on information source behavior (Gursoy and Chen 2000; Money and Crotts 2003; Osti, Turner, and King 2009).
The purpose of this study is to investigate international segments in tourists’ use of information sources when making decisions about their travel/holiday plans. This study tries to shed light on why and to what degree tourists from different countries have similar or varying information source behavior. To provide further understanding about the relationship between country and information source use, we consider economic development and culture as possible explanatory variables (see, e.g., Budeva and Mullen 2014). As there is great variation in economic development and national culture among the countries within the European Union (EU), the EU is well suited for an investigation of the relationship between country and tourists’ information source use, and how this correlates with economic development and national culture. The emphasis here is on information search behavior among tourists from 27 member countries of the EU (data prior to Croatia’s joining as the 28th country are used). This study replicates and extends previous research by explicitly focusing on European tourists.
This study contributes to the literature in four ways. First, by showing similarities and differences in the use of information sources, that is, which information sources go together and which information sources contrast each other. Second, it identifies international segments within the EU with respect to use of information sources. Using representative samples of tourists from the 27 member countries of the EU allows drawing generalizable conclusions about which information sources managers of tourist destinations may use to attract tourists from particular countries or segments of EU countries. Third, it proposes a framework for international segmentation of information search. Fourth, the study also has a methodological contribution by introducing into the tourism literature several innovations in the data analysis and presentation of the results, namely, the use of a variant of correspondence analysis called subset correspondence analysis, which is an approach for dealing with missing responses, the testing for statistical significance of the dimensions resulting from the analysis, and the incorporation of external economic and cultural indicators into the results to support the interpretation.
The remainder of the article is organized as follows. In Section 2 the relevant literature is reviewed and a framework for studying tourists’ use of information sources is provided. The research methodology underlying the empirical study is summarized in Section 3. This is followed by a discussion of the results in Section 4. Finally, in Section 5, conclusions are drawn in the form of theoretical and managerial implications.
Literature Review
Information Source Behavior
The search for information is an early step in the decision-making process of tourists (Gursoy and Umbreit 2004). Information search has been defined as the motivated activation or acquisition of knowledge stored in memory or acquisition of information from the environment (Engel, Blackwell, and Miniard 1995). Information search can be internal and external. Internal search means that tourists’ previous experiences and knowledge are retrieved from memory (Fodness and Murray 1997). If the internal search turns out to be inadequate (Beatty and Smith 1987) or the information is not up-to-date, then tourists will move to an external search for information (Gursoy and Umbreit 2004). External information search implies that information sources outside of personal experience are used as sources of information (Fodness and Murray 1998). Examples of external information sources are family and friends, guidebooks, the Internet, and travel consultants (Korneliussen 2014).
Segmentation of European Information Source Behavior
International markets can be segmented in various ways. Many studies of international segments have used macro-level segmentation based on secondary data (Budeva and Mullen 2014). Such studies are mostly based on economic development or on national culture (for a review, see, e.g., Budeva and Mullen 2014).
Several studies build typologies using, for example, the cultural dimensions of Hofstede (1980, 2001). However, economic development and cultural influences can have different influences depending on the domain studied (Vanderstraeten and Matthyssens 2009). The existing literature of information search among European tourists does not give enough guidance to select any typology to use. We therefore create an empirically based taxonomy (Vanderstraeten and Matthyssens 2009) using multivariate methods to show similarities and differences between countries and find clusters in the data. These clusters will be the basis for the international segmentation.
Europeans’ information source use has previously been used as a basis for international segmentation. Uysal, McDonald, and Reid (1990) investigated the use of information sources by tourists from France, United Kingdom, West Germany, and Japan when visiting U.S. parks and natural areas. The sample consisted of about 1,500 people from each country. Analyzing the rank-ordering of tourists’ use of seven information sources, they found that tourists used multiple information sources and that the relative importance of information sources varied between countries.
Chen and Gursoy (2000) looked at the use of information sources among first-time and repeat tourists from France, Germany, and United Kingdom who were visiting the USA. They used data obtained from in-flight surveys, consisting of tourists’ rank-orderings of 12 information sources. Logit analysis and nonlinear discriminant analysis were used to analyze the data. They further used correspondence analysis to visualize patterns in information source usage, thereby identifying two major dimensions. The first dimension was labeled “proprietary/public” and the second dimension was labeled “unfocused/focused.” They found that first-time travelers had a significantly different information source usage than repeat travelers, and that there were differences in information source behavior based on country of residence and purpose of trip. Four distinct market segments were found.
Gursoy and Chen (2000) examined the external information search behavior of travelers from Germany, United Kingdom, and France, using data from in-flight surveys. Using correspondence analysis, they visualized patterns of information search behavior based on information sources, country of residence and purpose of trip. The first dimension was a “leisure/business” dimension and the second dimension was labeled as a “dependent/independent” dimension. Four distinct segments of information search behavior were identified.
Gursoy and Umbreit (2004) did a cross-cultural comparison of the information source behavior of travelers from the EU member countries. They used data collected from residents of the then 15 member countries of the European Union. Using Kruskal-Wallis tests, they found statistically significant differences between countries with respect to travelers’ external information search. They then used correspondence analysis to visualize patterns in the data. Six market segments emerged. These four studies did not use any conceptual framework. We extend them by suggesting a framework for international segmentation based on information source use.
Toward a Framework for International Segmentation Based on Information Source Use
Building on Budeva and Mullen’s (2014) suggestions, we use economic development and culture as a basis for this framework.
Economic Development and Information Source Use
Economic development is an important predictor of behavior (Budeva and Mullen 2014). Tourists from countries at a similar stage of economic development are more likely to have common demands, lifestyle patterns, and purchasing power (Chung 2005). Such commonalities are likely to make information source use among these tourists more homogeneous. Their information source use can therefore be used as a basis for international segmentation, as a standardization strategy is most practical for markets that are at a similar stage of economic development (Chung 2005).
In less economically developed countries, consumers are often constrained by financial resources. Some consumers in several European countries do not have the necessary financial resources to be able to afford to take their planned vacation. Staying home or visiting friends or relatives are often the most realistic holiday options. Over time this holiday pattern leads to considerable knowledge of the holiday environment. Tourists from less economically developed countries therefore will have both a personal experience with their holiday environment and a good understanding of the travel destination and its culture and language. Being repeat visitors, they can draw on past experience as an information source and also use friends and relatives as a source of information (Hyde 2006).
In more economically developed countries consumers can afford to visit destinations that are further away from the home and thus more costly. These tourists may be interested in new experiences and variety seeking, which is expected to lead to a larger variation in choice of destination. They will therefore more often be destination-naive first-time visitors needing to make decisions about tasks such as selection of destination, travel mode, and lodging (DiPietro et al. 2007). They will need more information as a vacation in an unknown destination appears more risky (Reisinger and Mavondo 2005). Having sufficient information reduces the perceived risk about these decisions (Fodness and Murray 1997). Although experienced with tourism, these travelers may only to a limited degree be able to draw on personal experience. We therefore expect tourists from more economically developed countries to use a larger number of information sources. These tourists are more affluent and will therefore have the ability to use information sources that must be purchased.
More economically developed countries tend to have high labor costs and therefore tend to exchange labor with technology. This makes them more advanced technologically and leads to better access to Internet, faster Internet, and more use of Internet. Tourists from more economically developed countries will therefore tend to use the Internet as a source of information.
All in all, people from more economically developed countries are able to travel far and wide. They are financially secure and have more information resources at their disposal and the choices for nuanced travel destinations are almost endless. However, those seeking a vacation who come from more humble financial backgrounds must often limit their information search to personal experience and friends and relatives.
Culture and Information Source Use
Culture can be defined as “the interactive aggregate of common characteristics that influence a group’s response to its environment” (Hofstede 1980, 19). Culture “is the collective programming of the mind that distinguishes the members of one group or category of people from others” (Hofstede and Hofstede 2005, 4). Culture is reflected in “general tendencies of persistent preference for particular state of affairs over others, persistent preferences for specific social processes over others, and general rules for selective attention, interpretation of environmental cues, and responses” (Tse et al. 1988, 82).
There are several frameworks of culture, the two most rigorous of which are those of Hofstede (1980, 1991) and Schwartz (1994). Many differences in consumption can be understood by investigating how national culture is related to consumption using, for example, Hofstede’s dimensions of national culture (Kumar and Passari 2016). The existing literature on European tourists’ information source use does not, however, give enough guidance to select any typology to use.
The national culture of a country is an important environmental characteristic influencing consumer behavior (Kumar and Passari 2016). A standardized marketing program will only be workable when the cultural environment is similar across countries (Chung 2005).
Researchers agree that culture is an important variable influencing human behavior. Research shows, for example, that national culture influences consumer innovativeness (Stenkamp, Hofstede, and Wedel 1999), word-of-mouth behavior (Money, Gilly, and Graham 1999), and tourists’ buying behavior (Pizam and Reichchelt 1996). It is clear that national culture also influences tourists’ use of information sources. So far there has been almost no research addressing this issue. Any theorizing about how various national cultures influence tourists’ use of information sources would therefore be very speculative. We prefer to contribute by investigating empirically what relationships there are between particular national cultures and tourists’ information search with the hope that our research will support further theorizing on this topic.
Methods
In order to investigate the relationship between country and the use of information sources, this study uses data from national representative samples of the 27 EU countries. The data used came from the Eurobarometer survey “Flash Eurobarometer 258,” which is a comprehensive survey on the attitudes of Europeans toward tourism, including questions about EU citizens’ information search behavior (for details about the survey, see http://ec.europa.eu/public_opinion/flash/fl_258_en.pdf).
Many studies in tourism use country as a unit of analysis. A prerequisite for doing this is that there must be some meaningful degree of within-country communality and between-country difference in culture (Steenkamp 2001), even though countries are not fully homogeneous. Such a within-country communality can be due to the fact that countries “are the source of a considerable amount of common mental programming of their citizens” (Hofstede 1991, 2). The reasons for such “mental programming” may be that tourists from one country have “a relatively similar history, language, political, legal and educational environment, among others” (Steenkamp 2001, 36). In a review of country classification, Vanderstraeten and Matthyssens (2008, 231) show that “within-country differences are deemed less significant than between-country differences” in Europe, although it is possible that some countries could be divided into two or three cultural regions. We follow current practice (e.g., Chen and Gursoy 2000; Gursoy and Chen 2000; Gursoy and Umbreit 2004) and use country as the unit of analysis in our international segmentation.
Sample
More than 27,000 randomly selected citizens aged 15 and over were interviewed in the 27 EU member states. The sample size varied within the EU countries, ranging from 501 in Cyprus to 2000 in Germany, with an average sample size per country of 1004. The interviews were predominantly carried out by telephone. Because of the low fixed-line telephone coverage in Bulgaria, the Czech Republic, Estonia, Latvia, Lithuania, Hungary, Poland, Romania, and Slovakia, face-to-face interviews were also conducted in those countries. The nonresponse rate varied between 3.8% for Ireland and 27.6% for Bulgaria. The overall nonresponse rate was 5.1%.
Measurement
Information source use was measured using the responses to the question “From the following information sources, which one do you consider to be the most important when you make a decision about your travel/holiday plans?” Then followed seven information sources: (a) personal experience, (b) recommendation of friends and colleagues, (c) guidebooks and magazines, (d) catalogs, brochures, (e) the Internet, (f) travel/tourist agencies, (g) media (newspaper, radio, TV).
Country was measured using the respondents’ country of residence. Respondents’ country of residence has previously been used as a measure of nationality by Chen and Gursoy (2000). A possible weakness of this measure of nationality and of national culture is that it does not account for the possibility that the country of residence may not in all cases reflect a particular national culture. This would, for example, be the case if a respondent has recently moved from one country to another. However, we do not expect this to influence the result of the analysis in a substantial way.
Table 1 presents the information sources used by the respondents from the EU countries. Column one includes the 27 countries that are part of this study with their two-letter codes. The following seven columns present each of the seven information sources included in the study and the percentage of respondents within each country that evaluate each of these information sources to be the most important. The “don’t know/non-response” percentages are also included, in the eighth column. Percentages were calculated relative to the country totals (N) after reweighting the data according to the respondent weights that accompanied the Eurobarometer data file—this removes sample bias from the estimates of the percentages for each country. In the last row of Table 1, which shows overall estimates for the EU, we see that “recommendation of friends and colleagues” was, with 29.3% of the cases, the information source most often reported to be the most important. This was followed by the Internet (21.9%) and personal experience (18.8%), travel/ tourist agencies (11.4%), catalogs and brochures (5.5%), guidebooks and magazines (4.8%), and media (3.2%). All in all, Table 1 shows a considerable variation both within and across information sources and countries.
Percentages of Most Important Information Sources for 27 EU Countries.
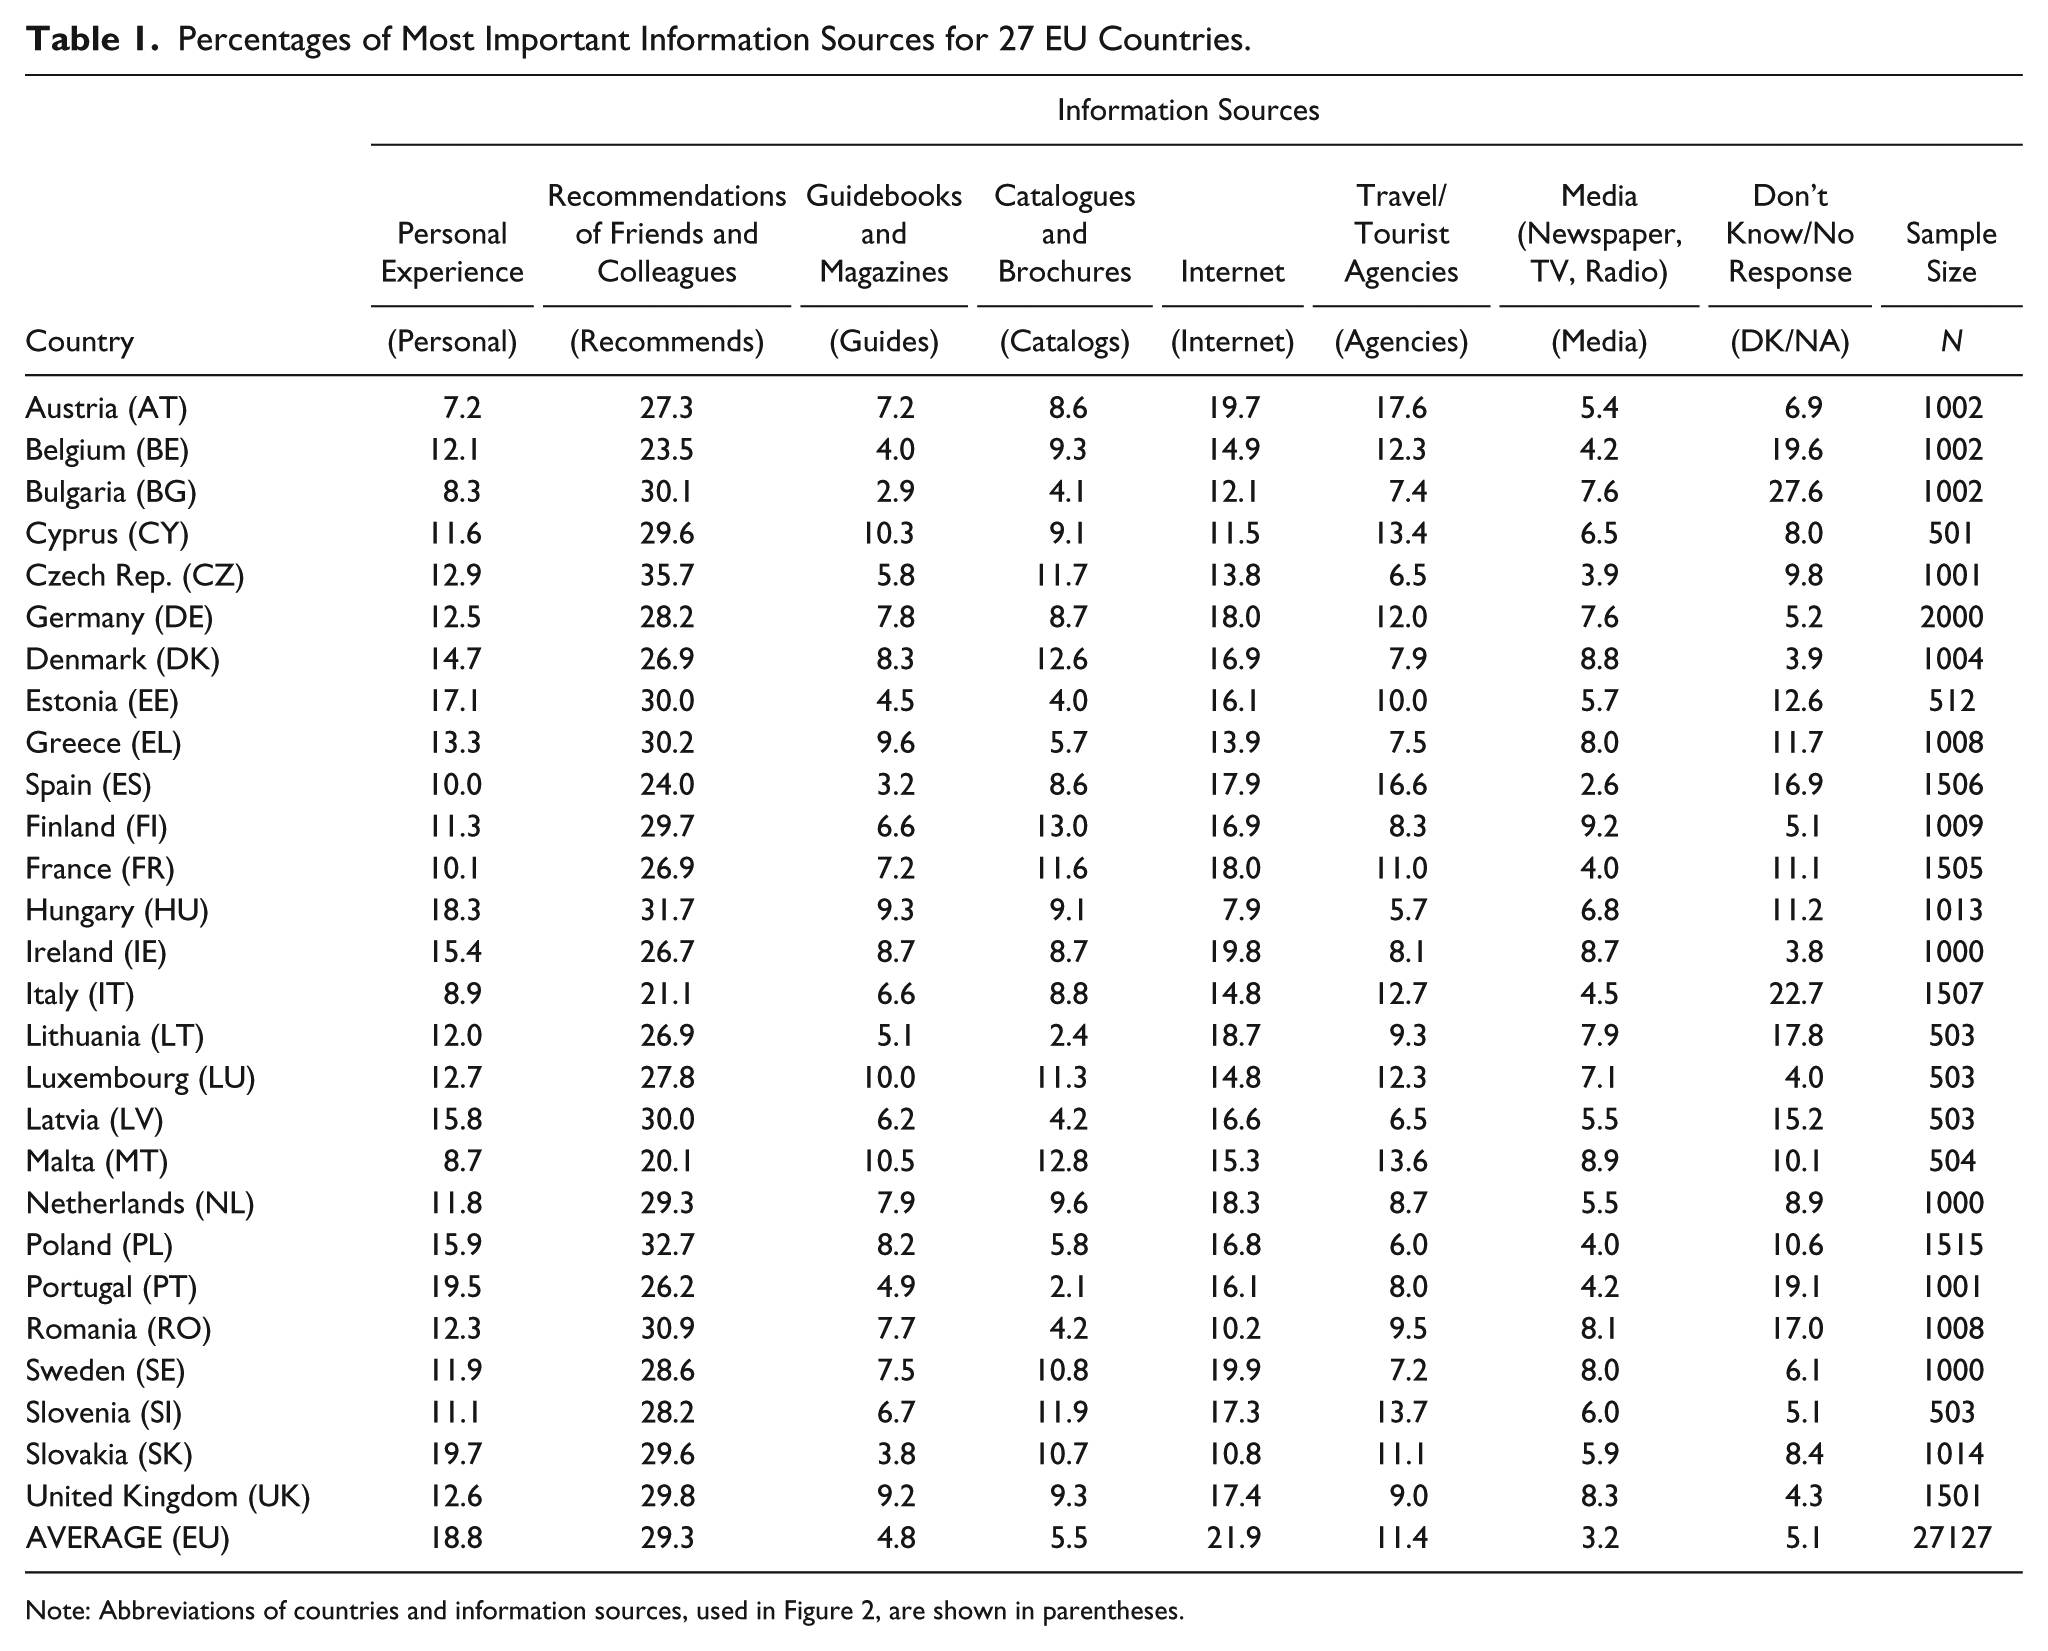
Note: Abbreviations of countries and information sources, used in Figure 2, are shown in parentheses.
Analysis
Correspondence analysis (CA) was performed to show similarities and differences in information source behavior between the respondents from the various countries included in the study. CA may be seen as a special type of principal component analysis of both the rows and/or the columns of a table (Benzécri 1973; Greenacre 1984, 2016). One of the advantages of CA is the possibility to simultaneously visualize the row and column categories of a table. “The visualization is achieved by projecting points that represent the categories in multidimensional space onto a subspace, usually a plane, resulting in an approximate map of the categories” (Le Roux and Rouanet 1998, 208). In this application of CA, we analyze the percentages in Table 1 rather than the raw frequencies, which means that each country receives the same weight. Notice that CA does not require the data to be normally distributed, but is applicable to frequency or percentage data where there exists an increasing, approximately linear, relationship between the variance and the mean, as is the case for the present data. This justifies the use of the chi-square distance as a measure of statistical proximity between the countries (Greenacre 2016, 5). If the missing data column is maintained in the analysis, it usually turns out to be an important feature of the result, which was indeed true for this data set; see, for example, the large percentage of missing data for Bulgaria. Hence, a novelty of our approach is the use of subset CA (Greenacre and Pardo 2006; Greenacre 2016, 21), which allows all data to be analyzed, including the missing data percentages, but uses just the percentages for the subset of seven information sources to determine the solution. A further novelty is the testing of the dimensions of the CA solution for statistical significance, which is generally not done in other literature applications. This can be achieved in two different ways, either by generating replicate tables by a type of Monte Carlo randomization scheme, under the hypothesis of no difference between the countries or by randomly permuting the country labels of the respondents (see Greenacre 2016, chapter 30, for details). Additional indicators for the countries were also added to the CA solution a posteriori, using regression analysis; these are called “supplementary variables” (Greenacre 2016, chapter 12). These indicators are regressed on the dimensions, and the regression coefficients are used as coordinates to indicate directions in the style of a biplot (see, e.g., Greenacre 2010). Computations were performed using the ca package by Nenadić and Greenacre (2016) in the R software platform (R Core Team 2015), as well as R code written specially for the novel aspects of this application.
To segment the countries, we performed a hierarchical cluster analysis based on the chi-square distances between the countries from the subset CA, using the function hclust in R and the cluster-joining option of average linkage.
Results
Figure 1 shows the set of variances, called inertias, for the CA dimensions, in the form of a “scree plot,” showing that the first two dimensions are above the average and well separated from the remaining inertias. These dimensions explain respectively 51.4% and 22.6% of the total inertia, totaling 74.0% for the two-dimensional solution. Either using Monte Carlo random sampling based on the probabilities in the last row of Table 1 or by a permutation test procedure where country labels of respondents are randomly permuted, both these dimensions can be concluded to be highly statistically significant (p < .001 in both cases).
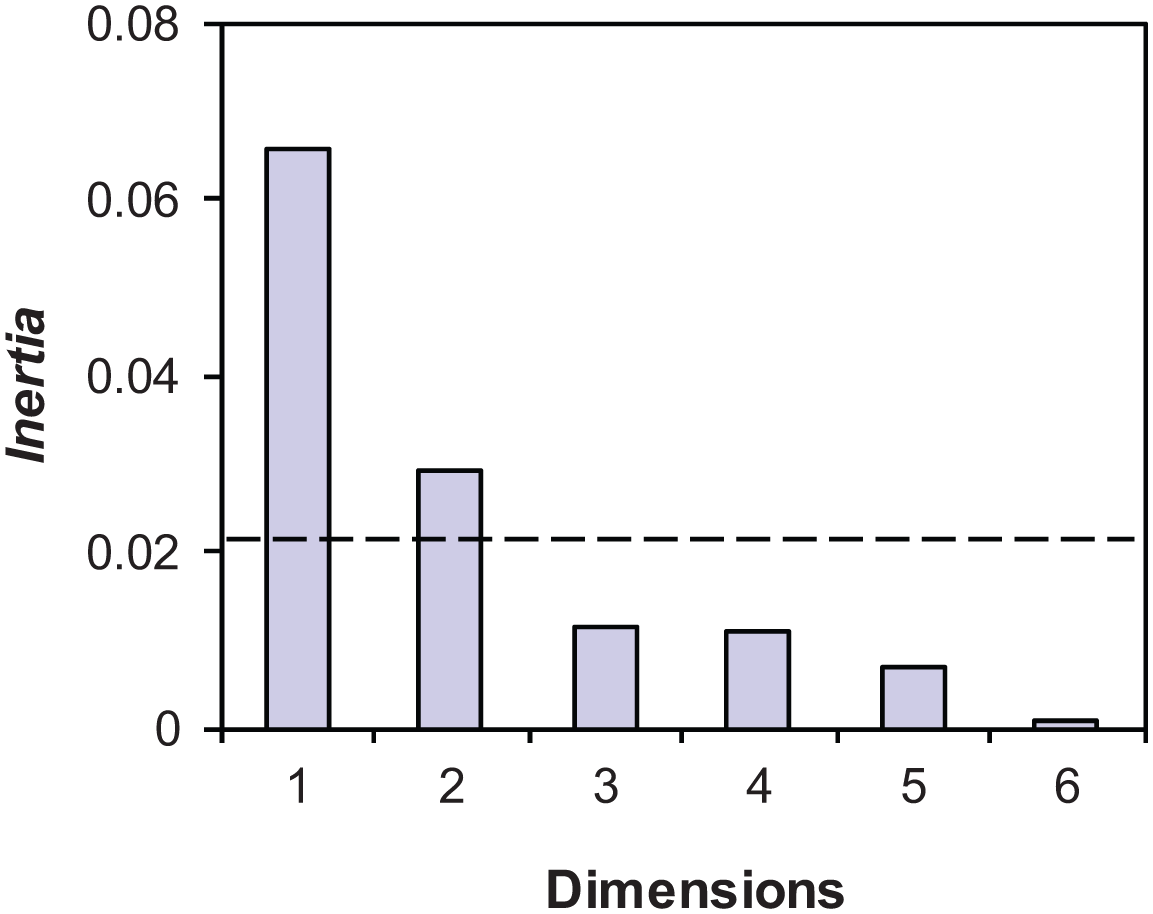
Scree plot of the variances (i.e., inertias) of the subset correspondence analysis of Table 1, excluding the “DK/NA” category, showing the average variance (dashed line).
Information Source Behavior across Countries
A visualization of the two major dimensions presenting the relationship between information source use and country is shown in the CA “map” of Figure 2 (we will explain later the groupings of the countries and the two arrows representing additional variables). These are the optimal two dimensions for interpreting country differences, accounting for 74.0% of the total country variance of 0.1276. The center of the map corresponds to the averages of the seven information sources. Numbers correspond to the clusters in Figure 3 and the countries are color coded according to the various cultures in Table 2, with the average position of each subset of countries according to that cultural classification shown in a box.

Correspondence analysis of use of information sources by countries, onto which the indicators GDP/capita and Internet usage are fitted, as well as the six clusters of countries revealed in Figure 3, enclosed by ellipses. The broad cultural classification of the countries, given in Table 2, is depicted by connecting the groups of countries to their respective average positions, shown in boxes (see online version for additional color coding).

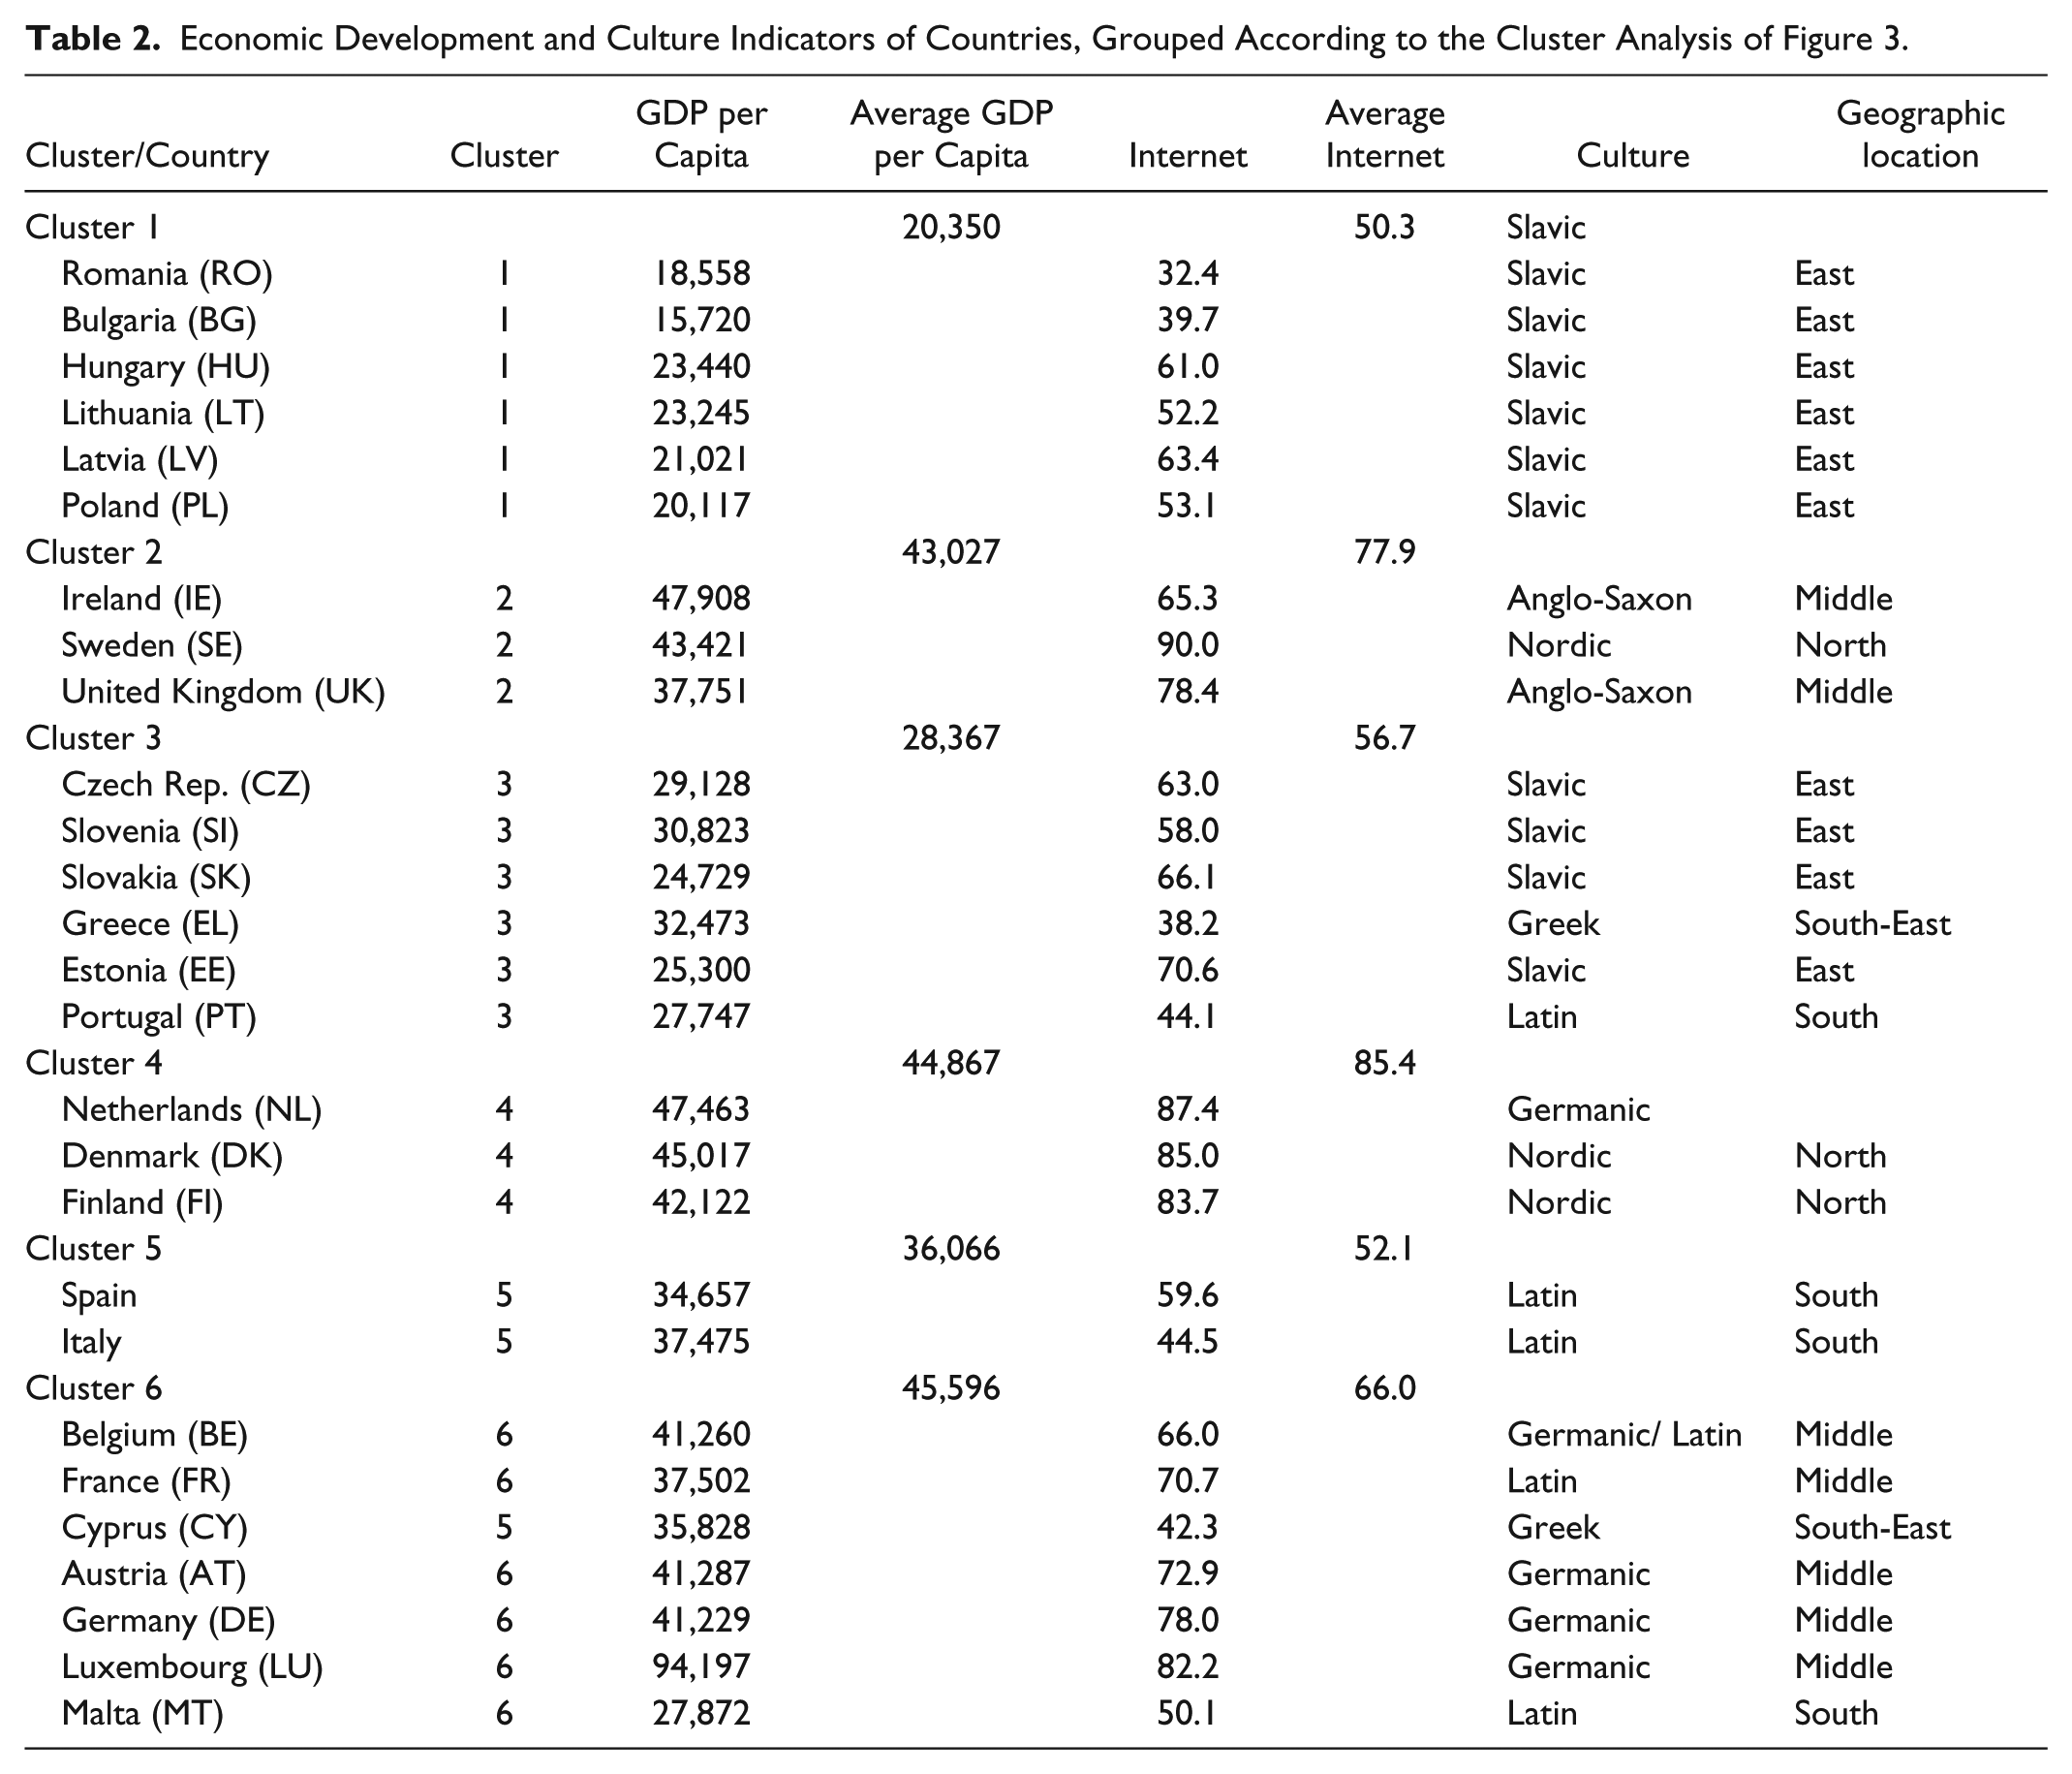
Economic Development and Culture Indicators of Countries, Grouped According to the Cluster Analysis of Figure 3.
The distances between information sources can be interpreted as similarities: the closer two information sources are, the more similar they are across countries. Figure 2 shows, for example, that personal experience and recommendation are close to each other and could effectively be combined. Similarly, guidebooks, Internet, and catalogs are relatively close to one other. The distances between countries can be interpreted in a similar way. For example, Latvia, Lithuania, Bulgaria, Poland, and Hungary are close to one other but far away from the group formed by Germany, Belgium, and Austria.
The map can also be interpreted with respect to the information sources one at a time or with respect to the axes. In the latter case, projecting the information sources perpendicularly onto the two dimensions shows which information sources can be used for describing the dimensions. Variables that are close to the centroid are generally close to average use, but may be associated with higher dimensions (Blasius and Friedrichs 2008).
The first dimension (the horizontal axis) is determined by the opposition of travel/tourist agencies, catalogs, guidebooks, and Internet on the left-hand side, versus personal experience and recommendation of friends and colleagues on the right. Media is located close to the center, suggesting that it has close to uniform use across countries. The first dimension seems to be a dimension contrasting those who tend to use commercial information sources (on the left) versus those that tend to use non-commercial information sources. We label this dimension commercial information sources. The explained variance of this dimension is 51.4%.
The second dimension separates out travel/tourist agencies from all the other information sources, especially catalogs and Internet. This dimension thus contrasts use of nonpersonal information sources versus use of personal information sources within the category of commercial sources identified on the first dimension. This dimension is here termed personal information sources. The explained variance of the second dimension is 22.6%.
From the point of view of countries, the first dimension (commercial information sources) contrasts western European countries (Austria, Belgium, Cyprus, Denmark, Finland, France, Germany, Italy, Luxembourg, Netherlands, and Spain) on the left, which tend toward having a high use of commercial information sources, versus eastern European countries (Bulgaria, Hungary, Latvia, Lithuania, Poland, Romania, Slovakia, Slovenia, and the Czech Republic) on the right, which tend to have a high use of noncommercial sources. Dimension one seems to be mainly an opposition between western and eastern Europe, although Ireland and Portugal are located together with the eastern European countries.
The second dimension opposes northern European countries (Denmark, Finland, Netherlands, and Sweden), which tend to have a high use of nonpersonal information sources, versus southern European countries (Spain, Italy, Portugal, and Cyprus), which tend to have a high use of personal information sources. Middle European countries (United Kingdom, Ireland, Luxembourg, France, Belgium, Malta, Austria, and Germany) are located between northern and southern Europe making this dimension reflect the geographical latitude of the location of each country.
In summary, from an information source point of view, the first dimension contrasts commercial information sources versus noncommercial information sources, whereas the second dimension opposes nonpersonal versus personal information sources. From a country point of view, the first dimension opposes western Europe versus eastern Europe, while the second dimension opposes northern Europe versus southern Europe, with a few exceptions noted above. It seems that use of commercial information sources tend to go together with western Europe, while noncommercial information sources tend to go together with eastern Europe. Nonpersonal information sources tend to go together with northern Europe, while personal information sources tend to go together with southern Europe. One may speculate about possible reasons for this structure. Western Europe is relatively advanced, with relatively high education levels, relatively high average incomes, and good access to various types of external information sources. The countries of eastern Europe are less advanced, have lower average income, and less access to external sources. Northern European countries are slightly richer and with slightly better access to various information sources, while southern Europe appears to be more used to personal contact in their information search behavior.
Segmentation of Countries
We now proceed with a more detailed investigation identifying segments of countries. Figure 3 shows the results of a cluster analysis of the data based on the intercountry chi-square distances between the countries in the subset CA. We have based our interpretation on a six-cluster solution shown by the cutpoint at approximately 0.38 on the vertical “height” scale, which is in terms of average chi-square distance between clusters. The groupings of countries coinciding with these six numbered clusters are shown in Figure 2.
The first cluster is an eastern European cluster consisting of Romania, Bulgaria, Hungary, Lithuania, Latvia, and Poland. Cluster two is created by Ireland, Sweden, and United Kingdom. Cluster three is also mainly an eastern European cluster constituted by Czech Republic, Slovenia, Slovakia, and Estonia. Somewhat surprisingly, Portugal and Greece are clustered together with these eastern European countries. The northern European countries of Netherlands, Denmark, and Finland constitute cluster four. Cluster five is a southern European cluster (Spain and Italy). The middle European sixth cluster is composed of French-speaking and Germanic countries (Belgium, France, Austria, Germany, and Luxembourg) along with Cyprus and Malta.
These six clusters generally coincide with the geographical and cultural location of the countries, with a few exceptions: Portugal and Greece are included in the eastern European cluster three, whereas Cyprus and Malta are included in the middle European cluster six.
Validation of Framework for International Segmentation
Table 2 shows the relationships between countries, clusters, economic development, and cultural classification. The left column in Table 2 shows the various countries included in each of the six clusters. The following columns show World Bank indicators of economic development (http://data.worldbank.org/indicator/NY.GDP.PCAP.PP.KD?page=1): GDP per capita, average GDP per capita per cluster, Internet (per 100 people), average Internet (per 100 people) per cluster. Then follow columns showing the cultural classification of the various countries and their geographical location.
The GDP per capita in dollars for the countries in the first cluster varies between 15,720 for Bulgaria and 23,440 for Hungary. The GDP per capita of countries in clusters one and three (average GDP per capita of 20,350 and 28,367, respectively) are considerably lower than in the four other clusters. These two clusters consisting mostly of eastern European countries are less economically developed than the other four clusters. Our framework for international segmentation suggests that tourists from less economically developed countries would tend to use personal experience and friends and relatives as sources of information use. Inspection of Figure 2 shows that indeed the tourists from these two clusters tend to use—on average more than other countries—personal experience and recommendations from friends and relatives as their most important information source.
The indicators GDP/capita and Internet usage are shown in Figure 2, added as supplementary variables to the CA solution, where the endpoints of the arrows are defined by the regression coefficients of the indicators on the two dimensions. It turns out that both these variables are highly significantly related to dimension 1 (p = 0.0004 for GDP, p = 0.002 for Internet), whereas only Internet is significantly related to dimension 2 (p = 0.26 for GDP, p = 0.0006 for Internet). The relationships between the cultural and geographic categorizations and the clusters in Table 2 is clear as well, and the combined message is that the positions of the countries in Figure 2 have a strong relationship with their economic and cultural indicators.
From a cultural point of view, most of the countries of the first and third clusters are quite homogeneous. The first cluster consists of Slavic countries. Most of the countries in the third cluster are Slavic too. These countries have a shared history of communism and a common culture. It seems likely that they would have a homogeneous use of information sources. The exceptions here are that Portugal and Greece are quite different from the other countries in the third cluster from a cultural point of view. These two countries have respectively a Latin culture and a Greek culture. From a cultural point of view, we could expect them to have a different pattern of information source use than the other countries in this cluster. Previous research has shown that Portugal does not have the same pattern of information source use as the other Latin countries. Gursoy and Umbreit (2004) found that tourists from Portugal do not have any external information search, which fits well with having an emphasis on personal experience as an information source.
The countries in the other four clusters have a higher level of economic development than the countries in the first and third cluster. Our framework suggests that tourists from countries in these four clusters will have other holiday patterns and other patterns of information source use than those in the first and third clusters. We expect these tourists to use, on average, more external information sources, including information sources that must be purchased. This is indeed the case.
The GDP per capita for the countries in cluster two varies between 37,751 for United Kingdom and 47,908 for Ireland. The average GDP per capita for this cluster is 43,027.
The GDP per capita for the countries in cluster four varies between 42,122 for Finland and 47,463 for Netherlands. The average GDP per capita for cluster four is 44,867. The countries in clusters two and four tend to utilize written information sources more than other countries, such as catalogs and brochures, Internet, guidebooks, and magazines.
Table 2 shows that the countries with the highest Internet penetration are Sweden (90.0), Netherlands (87.4), Denmark (85.0), Finland (83.7), Luxembourg (82.2), and United Kingdom (78.4). We see that this is consistent with their placement in the map in Figure 2. Sweden in cluster two is a Nordic county, like Denmark and Finland in cluster four. In Figure 2, we see how Sweden is placed more toward the Nordic countries Denmark and Finland in the map, while the Anglo-Saxon United Kingdom is placed closer toward the Anglo-Saxon Ireland.
The economic development in the Latin countries (Spain and Italy) in cluster five is homogeneous, with the average GDP per capita being 36,066. This gives them the third lowest level of economic development, after the two eastern European clusters (cluster one and cluster three). As shown in Figure 2, this cluster tends to use commercial information sources more than other countries, that is, many information sources, including those that can be purchased. Cluster five has a particularly higher than average use of travel agencies. We do not really know why this is the case, but it may be related to a more traditional orientation along with the low penetration of Internet in these two countries.
Cluster six consists of countries with a large variation in GDP per capita. Malta (27,872) has the lowest GDP per capita, while Luxembourg (94,179) has the highest. The average GDP per capita in this cluster is 45,596. This cluster has a high economic development. As shown in Figure 2, this cluster tends to combine written information sources, such as catalogs and brochures, Internet, guidebooks and magazines, and travel agents. The countries in this cluster have Germanic or Latin culture, with the exception that Cyprus has a Greek culture. All in all, our findings seem to validate our suggested framework using economic development and culture for international segmentation.
Conclusion and Implications
The purpose of this article was to investigate which information sources European tourists use and, in particular, to determine how economic development and the national cultures within the EU are related to information source use. Using data from a Eurobarometer survey on the attitudes of Europeans toward tourism allows us to answer this research question. We use economic development and culture as possible explanatory variables and show that they are highly related to use of information sources. There are important differences in the information source use by the various countries of the EU. Perhaps somewhat surprisingly, these countries form relatively well-defined segments related to geographical location and to cultural heritage.
The segments based on information source behavior are strongly related to the geographical location of the countries: two northern European segments, one middle European segment, a southern European segment, and two eastern European segments. This result is somewhat consistent with previous research (i.e., Chen and Gursoy 2000; Gursoy and Chen 2000; Gursoy and Umbreit 2004), except that the present research finds a clearer structure relating information sources to countries and their geographical regions. One reason for this finding is perhaps that the present research effort is the first that actually spans all 27 member countries of the EU. Using a dataset that has a large variation in use of information sources and in countries allows a clear structure to emerge.
Managerial Implications
This study identifies six segments of information source use across the countries of the EU. Knowledge of these segments can be used to design marketing strategies to attract respondents from selected segments. This can be done by tailoring use of information sources to fit the selected segment(s) based on the results of the correspondence analysis shown in Figure 2 and the results of the cluster analysis shown in Figure 3. It is important that these segments span multiple countries that are neighbors geographically, as this makes it easier and less costly to target them.
Segment two and four tend to more than average use of written information sources, such as catalogs and brochures, Internet, guidebooks, and magazines. Tourism marketers who want to reach these segment should focus on written information sources. This can be done by developing and providing free information catalogs and brochures, and by working with government travel offices to achieve good distribution of these information sources. Using the Internet, by developing good websites, will also be useful for reaching this segment. To secure coverage in guidebooks and magazines, tourism marketers may want to work closely with publishing companies to try to get coverage in guidebooks and magazines.
The sixth segment consists of respondents from middle Europe. This segment is more likely than other countries to utilize a combination of written information sources, such as catalogs and brochures, Internet, guidebooks and magazines, and travel agents. Those who want to reach this segment ought to work with public relations managers to ensure written coverage. Tourism marketers who want to reach travelers in this segment should focus in particular on using the Internet, by developing good websites that contain useful and practical information.
Segment five consists of respondents from southern Europe. This segment is on average more likely to use travel/tourism agencies than other segments. This finding suggests that tourism marketers who want to reach this segment should have a particular focus on travel/tourism agencies as information sources. Gursoy and Umbreit (2004) suggest that by establishing good relationships with travel agencies and agency franchises in target countries, one may be able to increase the number of tourists from those countries.
Segments one and three consist of respondents from eastern Europe. These segments are hard to reach as they tend to use personal experience and recommendations from friends and relatives to a larger degree than other segments and are lower on the use of nonpersonal information sources. Tourism marketers who want to influence this segment may try to encourage positive word-of-mouth through increased customer satisfaction. Satisfied friends and relatives are likely to recommend a destination.
Limitations and Further Research
Although this article contains much information about how the various countries of the EU are related to Europeans’ use of information sources, there is still work to be done. This study finds similarities and differences in information search behavior across countries. Based on the literature on international segmentation, we offer a framework that uses economic development and culture as possible explanations for country-level information source use. We suggest that this may serve as a foundation for further research that develops and tests theoretical models of predicting the relationship between country and information source use. There is a strong association between the geographical location of the segments and their information source use. Is this related to the level of economic and social development? Previous investigations that have used correspondence analysis to increase the understanding of human behavior have shown how economic capital, cultural capital, and social capital (e.g., Bourdieu 1979) are related to behavior. It would be useful to include these concepts in future studies of information source behavior. Further, country was equated with country of residence. Each country may contain subcultures that have their own distinct patterns of information search behavior. This would be interesting to look into.
Demographic factors such as age, gender, and ethnicity are not reflected in the research based on country; neither are personal variables such as education, income, and personal values. Such variables should be included in further research about Europeans’ use of information sources. The relationship between country, economic development, national culture, and tourists’ information search should be investigated in other parts of the world. This study only analyzed seven information sources, and other information sources should be included. Other important areas of research are whether factors, such as type of vacation, prior travel experience, travel motives, stage in the buying process, risk perception, and purchase involvement, have an effect on information search behavior. Furthermore, investigating the relative importance of information sources and how and why information sources are related to one another are important research tasks. Although there has been considerable research on tourists’ information sources, much research is still needed on cross-national information source behavior. Tourism is, after all, often a cross-national phenomenon.
Footnotes
Declaration of Conflicting Interests
The author(s) declared no potential conflicts of interest with respect to the research, authorship, and/or publication of this article.
Funding
The author(s) disclosed receipt of the following financial support for the research, authorship, and/or publication of this article: Tor Korneliussen’s research is part of the project Northern Insight, which has received partial support from the Research Council of Norway. Michael Greenacre’s research has received partial support from the Spanish Ministry of Economy and Competitiveness grant MTM2012-37195.