
Abstract
This article examines the relationship between the level of tourism specialization (TS) and economic growth using a panel dataset covering 31 provinces in mainland China from 1995 to 2013. A quadratic function was introduced following the basic economic law of returns to overcome the weaknesses of constant returns to scale associated with the tourism-led economic growth hypothesis (TLGH). Using tourist arrivals as a percentage of host population (TA) and tourism receipts as a share of real GDP (TR) as the indicators of TS which represent respectively the level/size and the quality/structure dimension of TS, the system generalized method of moments (SYSGMM) regression results suggest that a meaningful inverted-U- or an N-shaped relationship exists between tourism specialization and economic growth. Based on the portfolio of TA and TR in destinations, the effects and characters of tourism on economic growth are discussed regarding the future direction of regional development.
Introduction
Tourism has become one of the world’s largest industries. It is estimated that in 2015, international tourist arrivals reached 1,186 million, with an amount of US$1.5 trillion of tourism export earnings worldwide; tourism value added (including direct, indirect and the induced) in 2015 amounted to 10% of the world’s GDP, and 1 in 11 jobs worldwide was deemed to be created in tourism-related sectors (UNWTO 2016). An increasing number of developing countries have strategically taken international tourism as an economic growth engine to haul the development of other industries and the overall economy in addition to tourism’s direct function in earning foreign exchange and creating jobs (Holzner 2011; Lee and Chang 2008; Sequeira and Macas 2008). This positive effect of tourism on the national economy is often referred as the tourism-led growth hypothesis (TLGH), which was first put forward by Balaguer and Cantavella-Jordà (2002) in their study of the Spanish economy (Tugcu 2014).
The TLGH implies that there is a causal relationship between tourism development and economic growth. A large amount of literature has examined the TLGH using single-country case studies, cross-country, or panel data sets. However, the results were mixed and divergent, and sometimes even contradictory in different studies. Some studies confirmed the validity of the TLGH (e.g., Brida and Risso 2009; Holzner 2011; Tang and Tan 2013; Lee and Chang 2008); some found a positive bidirectional causality between tourism development and economic growth (Durbarry 2004; Cortés-Jiménez and Pulina 2010; Nowak and Sahli 2007; Ridderstaat, Croes, and Nijkamp 2014); some showed a unidirectional causal relationship from economic growth to tourism instead (Oh 2005; Dritsakis 2004; Cortés-Jiménez, Nowak, and Sahli 2011); and some even concluded that tourism expansion may undermine long-term economic growth (Capó, Font, and Nadal 2007; Mieiro and Ramos 2010; Sequeira and Campos 2007). Scholars also tried to explain this inconsistency. They had used different econometric techniques (linear and nonlinear) with different data sets collected in different countries, and had made great attempts to find out the possible determinant factors that might interact on the tourism–economy relationship (De Vita and Kyaw 2016a; Brau, Lanza, and Pigliaru 2007; Tang and Tan 2013; Oh 2005; Paramati, Alam, and Chen 2016). Until now, no consensus has been reached on the validity of TLGH.
The issue of TLGH is actually derived from the export-led growth hypothesis (ELGH) (Adamou and Clerides 2009; Chang, Khamkaew, and McAleer 2009), which are based on the Ricardian trade model. Ricardo (1891) points out that different countries have different comparative advantages in the production of goods. By specializing in the good for which it has a comparative advantage, even a less productive country can improve its productive efficiency, and will increase its overall welfare through international free trade. Therefore, countries should develop industrial division and social division according to their own advantage, to ensure the efficiency of division and specialization. Derived from the Ricardian trade model, tourism, particularly international tourism, can thus be considered as a nontraditional export (Durbarry 2004) to promote economic growth; hence the so-called TLGH is the case.
However, the Ricardian theory is characterized by constant returns to scale. It relies on the different levels of productivity of goods among countries at a time and emphasizes the innate comparative advantages. To test the TLGH, many studies have used the standard production function framework, commonly the Cobb–Douglas function (Brida, Cortes-Jimenez, and Pulina 2016), and assumed a linear correlation between tourism development and economic growth, thereby disregarding the law of returns. In Pablo-Romero and Molina’s (2013) detailed review of the literature that focuses on the relationship of tourism and economic growth, although the nonlinear relationship between tourism and economic growth has been increasingly recognized from different studies, these studies were still descriptive. They just claimed the nonlinear relationship and tested it but had made little effort to base the analysis on sound economic principles. In only a small number of empirical studies (Adamou and Clerides 2009; De Vita and Kyaw 2016b), diminishing returns of tourism specialization to economic growth was put forward and found to exist. However, these studies still took the assumption of demand-driven trade theory and ignored the interplay of demand and supply factors in the process of tourism development. The dynamic process of tourism specialization of a destination and its theoretical linkage to economic growth have not yet been sufficiently addressed.
Furthermore, in the literature, the level of tourism specialization (TS), which has been oftentimes used as the proxy variable of tourism development, has been emphasized as a decisive factor that influences the growth of destination economy (Deng, Ma, and Shao 2014). However, the definitions and measurements of TS were diverse (Perez-Dacal and Pena-Boquete 2013). The typically used measurement in literature is the share of tourism receipts in GDP (TR) and/or the ratio of tourist arrivals to the number of local residents (TA) (Arezki, Cherif, and Piotrowski 2009; Chang, Khamkaew, and McAleer 2009; Bojanic and Lo 2016). Apparently, different indicators have different economic significance. There is a void of research on what dimensions of tourism specialization the two indicators are most suitable to measure.
In view of these interrelated theoretical gaps, this article attempts to shed light on the debate of TLGH by linking the basic economic law of returns with the theory of tourism areas life cycle (TALC; Butler 1980). We will show that the TALC, when used in conjunction with economic laws of returns, can effectively explain the mechanism of the effects of tourism specialization on economic growth, and can offer better interpretations on opposing results in the literature. In studying development of cities and regions, many economic geographers have incorporated industry life cycle theories into their economic models (Potter and Watts 2011). They suggest that whether an industry generates increasing returns or diminishing returns depends on time, especially the evolution of the industry life cycle (Boschma and Lambooy 1999; Essletzbichler and Rigby 2007). In this article, we argue that tourism specialization creates increasing returns and accelerates economic growth during the early stages of TALC, but during the later stages of TALC, a destination would experience diminishing returns and thus have declining economic performance.
Correspondingly, a model including both quadratic and cubic functions was tested with empirical data using instrumental variable regression method to overcome the problem of endogeneity. We assess the empirical validity of the model and examine empirically the inflection point from increasing returns to diminishing returns, namely, the structural breaks of the host economy that could generate significant industry implications. The article adds to this stream of research by advancing the theory-building process, especially by making amendments to the unrealistic assumption of constant returns. It illustrates the interplaying process of demand and supply factors in a destination and thus helps understand the dynamic performances of economies based on the tourism industry.
Literature Review and Theoretical Framework
Literature Review of TLGH
The economic impacts of tourism have been an everlasting topic in tourism research over the past several decades. Tourism represents an additional consumption to the local economy, which may not only bring job opportunities and sources of income but also increase government tax revenue and improve the balance of payments (Archer 1995). In turn, it may further stimulate the expansion of local production because of the total demand changes and, consequently, bring more consumption expenditure and employment. As such, the early studies in this field focused mainly on the estimation of tourism multiplier in demand and income generation in a destination (Sinclair 1998).
Although tourism was considered as an important contributor to destination economy, it was not until the recent decade that the causal relationship between tourism and economic growth attracted due research attention (Kim, Chen, and Jang 2006; Arslanturk, Balcilar, and Ozdemir 2011; Pablo-Romero and Molina 2013). Although some researchers had observed the positive relationship between tourism and economy in small countries highly specialized in tourism (Lanza and Pigliaru 2000), the tourism-led growth hypothesis (TLGH) was only first explicitly raised by Balaguer and Cantavella-Jordà (2002) in their study of the Spanish economy from an econometric perspective. Thereafter, an increasing number of studies emerged aiming to verify this hypothesis, but the results were divergent. Overall, previous studies have presented five different empirical outcomes.
One-way causality
There is a unidirectional causality from tourism development to overall economic growth. Such a one-way causality was substantiated in many countries and regions, including Chile (Brida and Risso 2009), EU member countries (Holzner 2011), Malaysia (Tang and Abosedra 2014; Tang and Tan 2013), OECD member countries (Lee and Chang 2008), Portugal (Proença and Soukiazis 2008), Latin American countries (Eugenio-Martín, Morales, and Scarpa 2004), sub-Saharan African countries (Fayissa, Nsiah, and Tadasse 2008), Southern European countries (Proença and Soukiazis 2008), Spain (Balaguer and Cantavella-Jordà 2002), South Africa (Akinboade and Braimoh 2010), South Tyrol (Kaplan and Çelik 2008), Taiwan and South Korea (Chen and Chiou 2009), Turkey (Katircioglu 2009a), and small islands (Croes 2013; Bojanic and Lo 2016).
Bilateral causality
A positive bidirectional causality was found between tourism development and economic growth. This bilateral causality has been found for developing countries via a panel data analysis (Samimi, Sadeghi, and Sadeghi 2011), and with some countries like Barbados (Lorde, Francis, and Drakes 2011), Malaysia (Lean and Tang 2010), Mauritius (Durbarry 2004), South Korea (Chen and Chiou 2009), Spain (Cortés-Jiménez and Pulina 2010; Nowak and Sahli 2007), and Aruba (Ridderstaat, Croes, and Nijkamp 2014).
Reversed feedback mechanism
There is no support for the TLGH, but a unidirectional causal relationship from economic growth to tourism is the case instead. This mechanism was found in the case of Cyprus (Katircioglu 2009b), Croatia (Payne and Mervar 2010), Korea (Oh 2005), Fiji (Narayan 2004), Greece (Dritsakis 2004), Malaysia (Tang 2011), Sichuan (China) (He and Zheng 2011), Tunisia (Cortés-Jiménez, Nowak, and Sahli 2011), and Taiwan (Kim, Chen, and Jang 2006).
Neutrality
There are mixed results on the relationship between tourism and economic growth. The relationship was found to be sensitive to the level of destination economy (De Vita and Kyaw 2016a), geographic size (Brau, Lanza, and Pigliaru 2007), specific market (Tang and Tan 2013), spatial correlation (Ma, Hong, and Zhang 2015), absorptive capacity (De Vita and Kyaw 2016b), surplus of tourism trade (Chiu and Yeh 2016), and openness (Oh 2005) of the area being examined. Moreover, A nonlinear relationship was also found between tourism development and economic growth (Chang, Khamkaew, and McAleer 2009; Deng, Ma, and Shao 2014; Po and Huang 2008; Chiu and Yeh 2016), which means tourism development does not always support the growth of the overall economy.
Negativity
Some studies found that tourism expansion may undermine long-term economic growth (Capó, Font, and Nadal 2007). This may be caused by tourism’s substitution of the welfare generated in the trade regime dominated by export taxes or import subsidies (Chen and Devereux 1999). For example, in Macau, a symptom of the Dutch disease was found because of a boom in the gaming industry (Mieiro and Ramos 2010; Sheng and Tsui 2009), which reduced the area’s long-term growth sustainability. Some Latin American countries (Sequeira and Campos 2007), and the Balearics and the Canary Islands (Capó, Font, and Nadal 2007) as well, also showed this symptom.
Technically, testing TLGH concerns whether and to what extent tourism specialization (typically measured by TA or TR) causes a corresponding economic growth. In their detailed literature review, Pablo-Romero and Molina (2013) classified the numerous works related to the issue into three major sets, namely, time series, panel data, and cross-sectional studies, according to the methodology adopted. Most of the studies were based on time-series analysis and took a single economy as the showcase (Dritsakis 2004; Durbarry 2004; Katircioglu 2009a; Kim, Chen, and Jang 2006; Brida and Risso 2009; Chen and Chiou 2009; Lean and Tang 2010). The econometric techniques were multifarious, from a simple causality test to the application of exponential bivariate GARCH-in-mean model (Chen and Chiou 2009). Some scholars changed to cross-sectional analyses for regional comparison (Figini and Vici 2010; Brau, Lanza, and Pigliaru 2007; Singh 2008). In recent years, the predominant approach turned to be panel data analysis using either nondynamic or dynamic models. But most studies still followed the linear correlation assumption. Only a small number of studies attempted to use the nonlinear regression approach to find out the threshold effects of the TLGH.
The nonlinear relationship between tourism development and economic growth has somehow been testified by the panel threshold regression technique (Po and Huang 2008; Chang, Khamkaew, and McAleer 2009, 2012; Zhao and Mao 2013; Deng, Ma, and Shao 2014). For instance, using international tourism receipts as a share of GDP as the indicator of TS and employing panel data covering the years 1995–2005 for 88 countries, Po and Huang (2008) found that when the level of TS was below 4.0488% or above 4.7337%, tourism development could greatly improve the economic growth; however, when the TS was above 4.0488% and below 4.7337%, no significant relationship was found between tourism specialization and economic growth. Chang, Khamkaew, and McAleer (2009) also checked the TLGH using the ratio of travel and tourism GDP to national GDP as a threshold variable. Using panel data from 131 countries over 1991–2008, they revealed that when the degree of tourism specialization is lower than 14.97%, or when the degree of tourism specialization locates between 14.97% and 17.50%, a significant positive relationship could be found between economic growth and tourism, but at decreasing rates. When the degree of tourism specialization is higher than 17.50%, no statistically significant relationship exists between economic growth and tourism. Following Adamou and Clerides (2009), De Vita and Kyaw (2016a, 2016b) also investigated the coefficient of squared tourism specialization measure over 129 countries in 1995–2011 by adding the financial system absorptive capacity of destination as a control variable; they found that when tourism specialization reached 10.7%, the economic growth rate reached its maximum in countries with high levels of absorptive capacity. Using net international tourism arrivals and net exports of tourism services as an alternative proxy of tourism specialization, Chiu and Yeh (2016) also found nonlinear threshold effects among tourism trade surplus countries.
In China, the relationship between tourism and economic growth has also been extensively discussed (Liu and Wu 2007; Zuo 2013). Increasing evidence in the Chinese literature has supported the nonlinear relationship hypothesis. For instance, using panel threshold regression technique and employing inbound tourism receipts as the indicator of tourism specialization, Wu and Xie (2010) found that in provinces with high TS, there is a significant positive relationship between tourism and growth, while in provinces with low level of tourism specialization, the relationship becomes not obvious. Following Chang, Khamkaew, and McAleer (2012), Zhao and Mao (2013) employed panel data in mainland China over the period 1999–2009 and found that an N-shape relationship existed between tourism and growth. The three threshold values measured by the ratio of tourism receipts to GDP were 5.5%, 13.1%, and 15.3%, respectively. When the level of tourism specialization exceeds the maximum value of 15.3%, tourism growth no longer supports the growth of overall economy. Based on the Barro-type growth model and using Hansen’s (1999) bootstrap method, Deng, Ma, and Shao (2014) also found the existence of a threshold effect between tourism and growth in 30 Chinese provinces with panel data from 1987 to 2010, with the turning point at 2.04%.
As the level of tourism specialization changes considerably at different stages of TALC, time plays a very important role in the explanation of the tourism–economy relationship (Arslanturk, Balcilar, and Ozdemir 2011). Actually, these nonlinear panel data analyses had depicted a dynamic process of change: as tourism specialization increases over time, economic growth first advances, then reaches a peak and thereafter declines after a threshold level of tourism specialization has been achieved. In other words, it is a developmental trajectory for a single economy that grows through different stages over time. This provides support to linking the TALC and the economic law of returns together in the current study of TLGH.
Theoretical Framework
Economic growth is believed to be based on increasing returns generated by specialization (Smith 1776). Specialization can not only improve labor productivity but also promote technological innovation, and thus lead to a form of increasing returns (Romer 1987). However, when the increased input of a factor yields less and less benefit, diminishing returns occur. In Piketty’s (2014, 215) words, “too much capital kills the rate of return.”
Similar to a firm or an industry, destinations must produce products to satisfy the need of tourists. Tourist arrivals can therefore be seen as the demand indicator to trigger the tourism production in a destination. The process of tourism specialization and its impacts on economic growth, therefore, is embedded in the life cycle of the destination. In the initial stage of TALC, there are only a small number of visitors. Only a few firms provide tourism products and services that did not exist before. The degree of tourism specialization is very low. When tourist arrivals continue to increase, attracted by the greater returns, a growing number of firms begin to emerge. A significant redundant workforce in the destination will be transferred into the tourism industry. This results in the intensification of labor division and the development of a local supply chain and production network. The improved scale of economy yields a higher rate of growth. However, with tourist arrivals and tourism receipts continuing to increase, the scale return declines progressively because of the loss of efficiency, the rise of managerial and labor costs, and the persistence of local negative externalities such as congestion and pollution. The destination is likely to create a negative lock-in effect (Arthur 1989) and generate diminishing returns for the development of the region. Of course, it might rise again when the destination enters into a second life cycle through some rejuvenation efforts such as technology innovation, large amount of investment in upgrading tourism products, and environmental protection.
Figure 1A is the typical TALC curve that illustrates the evolution process of a destination. The horizontal axis denotes the timeline; the vertical axis represents the total output measured by the number of visitors or by tourism receipts. Assuming that the production technique is unchanged, the impacts of tourism specialization on the growth of economy can be divided into two stages, that is, the increasing return stage and the decreasing return stage (see Figure 1B). Metaphorically, we see destination as an enterprise, and the curve of TALC resembles the curve of total product (TP). Under the condition of free mobility of productive factor, the slope of TALC curve corresponds to the marginal productivity (MP) of the destination. Similarly, the slope of the line connecting the origin and the points on the curve of TALC can be regarded as the average productivity (AP) in different stages of a destination (see Figure 1B).
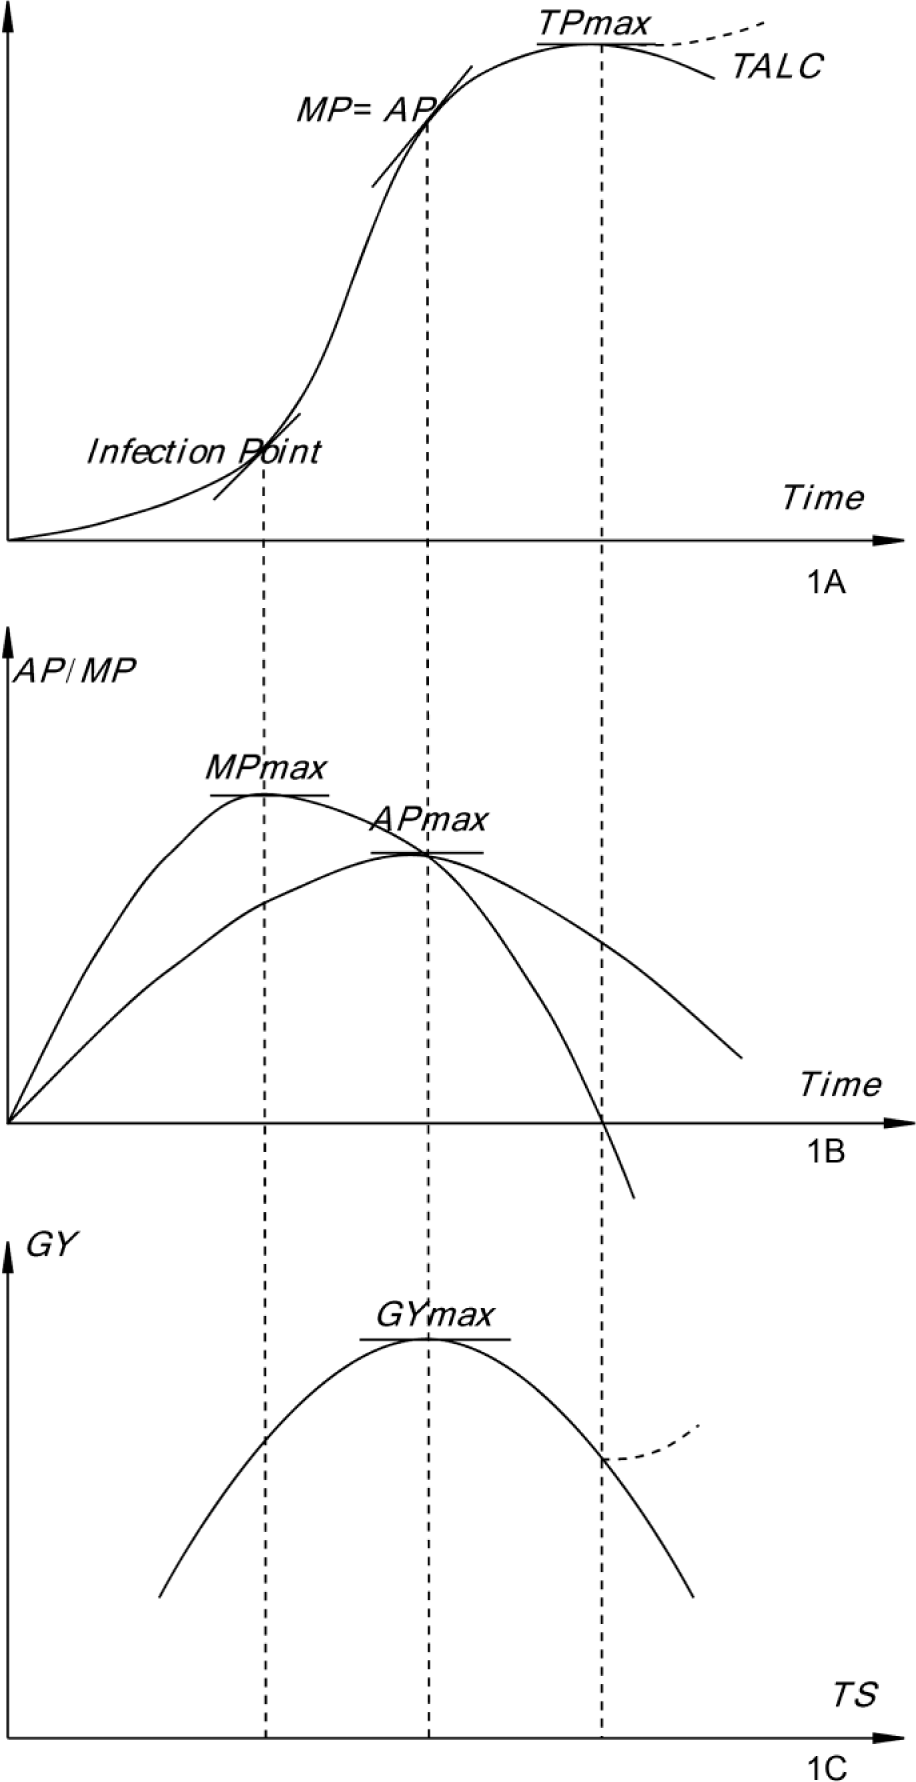
The relationship between tourism specialization (TS) and economic growth (GY).
The fundamental influence of the law of returns on an economy is due to its cost-price systems and the corresponding mobility of production factors. At the beginning, the marginal productivity of factors increases rapidly. Meanwhile, the marginal cost is decreasing. The destination is thus experiencing increasing returns because the tourism development enlarges the market and some overhead costs fall as production increases. After MP grows to its highest level, the economic growth begins to slow down but its absolute size still increases. When AP grows to its highest level, economic growth also gets to its maximum. Since then, the economy enters into the stage of diminishing returns of scale. The influence of tourism specialization on the economy began to recede. Hence, due to the increasing/diminishing returns, economic growth rate caused by tourism specialization cannot be a constant but changes substantially. The hypothesis of a linear correlation between tourism development and economic growth is therefore out of touch with reality and does not hold in theory.
On the basis of the TALC/TP and TS curves in Figure 1A and 1B, an economic growth (GY)—tourism specialization (TS) curve can be drawn to illustrate the relationship between TS and GY (Figure 1C). This curve considers the law of increasing return and diminishing return of tourism development in improving productivity and demonstrates an inverted-U-shaped relationship between TS and GY. The turning point of the GY-TS curve corresponds rightly to the point of maximum AP. It is also the point where MP equals AP. Because different destinations have different types of products, carrying capacity, and thus TALC, the shape of the GY-TS curve will appear steep or flat with higher or lower turning points. For destinations in a revival stage, tourism arrivals may increase again if there is radical technology change. The GY-TS curve may thus take on an irregular N-shape (see Figure 1C).
In summary, it seems that in different TALC stages, TS varies differently in levels and growth rates. Therefore, TS does not always produce substantial contributions to economic growth. Because of the law of returns and the limitation of environmental carrying capacity, the hypothesis of an inverted-U-shaped relationship between TS and GY appears to be meaningful in terms of its underlying theoretical foundations and thus needs to be tested with empirical data.
Models and Data
Model Identification
The relationship between TS and GY is postulated to follow an inverted-U function. To accommodate the possibility of N-shaped relationship as discussed above, a cubic function was considered in the econometric model of this study. However, as every cubic relationship can extend to either positive or negative infinity, this article therefore concentrates on quadratic relationships. The basic model is thus developed as follows:

where GY is the economic growth indicator, which is conventionally measured as the growth rate of real GDP per capita. TS denotes the degree of tourism specialization and Z relates to other variables that influence economic growth. The subscript i represents a certain province (municipality or autonomous region), and t for time; β and γ are the coefficients of the explanatory variables, while α is a constant. Clearly, the relationship between tourism and economic growth is only one of the following possible outcomes of model (1).
As aforementioned, there is no agreement on the best indicator of TS. Each of them measures one particularity of TS. In this study, the level of tourism specialization is proxied by two indicators: (1) tourist arrivals (domestic plus international) as a percentage of the local population (TA) and (2) tourism receipts (domestic plus international) as a share of the real GDP (TR). As Castro-Nuno, Molina-Toucedo, and Pablo-Romero (2013) pointed out, these two proxy measures of TS may have different estimate values of elasticity. Historical economic conditions are generally believed to have important effects on the current economic performance. In this study, the real GDP per capita in the previous year,
Data Collection and Analysis
Annual data for 31 provinces (municipalities or autonomous regions) in mainland China covering the period from 1995 to 2013 were obtained from the China Economic and Social Development Statistical Database (CESDSD). The panel data period is relatively short because relevant domestic tourism data prior to 1995 are not available. Some missing data on domestic tourism in the examination period were replaced with cross-checked figures obtained from provincial government statistical releases.
Following Arezki, Cherif, and Piotrowski (2009) and Chang, Khamkaew, and McAleer (2012), we used the annual number of developed scenic spots per surface area (square kilometers), denoted as ATTR, as the instrumental variable for TS to correct the potential endogeneity, as it affects GY only through tourism activity. The macroeconomic stability of a destination is also supposed to have influences on both investment activities and tourism development. Therefore, the annual consumer price index (CPI) was introduced as relevant instruments in the model.
As an a priori data analysis choice, the logarithmic function is employed for model estimation. In the data analysis, the variable of LAB had to be removed as it failed to pass the unit root test. To choose the optimal model between the fixed- or random-effects estimation, a Hausman test was employed. The test statistics indicated that the fixed-effect estimation should be preferred. A comparison between OLS regression with 2SLS regression was also conducted. The result confirmed the existence of endogeneity in our model. The Hausman test illustrated that the variables of EDU, CPI, and ATTR were exogenous, and the remaining variables all belonged to endogenous variables. The White heteroskedasticity-robust standard errors showed the existence of heteroskedasticity and serial correlativity. Therefore, a system generalized method of moments (SYSGMM) model with Windmeijer (2005) WC-robust estimator was employed for model estimation, as Arellano and Bover (1995) pointed out that lagged levels are poor instruments for first differences when the variables reach a random walk. After the final estimation, a series of weak and overidentification tests were experimented to test the validity of instrumental variables. The test results confirmed that the instruments worked well as good instruments.
Results
The model estimation results are outlined in Table 1. The left half of Table 1 presents the regression results using TA as an indicator of tourism specialization, while the right half reports the estimates using TR as a measurement of tourism specialization. In both cases, the estimation provided evidence to support our theoretical prepositions. The GDP in the previous year (Yt–1) had the expected negative coefficient and investment (INV) and innovation (RD) were found to have significant positive effects on Chinese economic growth, while the influences of EDU were founded to be insignificant in this study. As expected, the coefficients of TA in both linear and squared terms were found to be positive and statistically significant, while the coefficient
SYSGMM Regression Results.

Note: Observed periods or years = 18 (1995–2013); observed provinces = 31; total pooled (balanced) observations = 589; number of instruments = 533. Method: system generalized method of moments with Windmeijer (2005) WC-robust estimator.

The fitted curve of TA-GY. TA = tourist arrivals (domestic plus international) as a percentage of the local population; GY = economic growth.
When using TR as a tourism specialization index, the regression result was slightly different from that of taking TA as the tourism specialization index. The difference was highlighted by the coefficient of the cubed TR (

The fitted curve of TR-GY. TR = tourism receipts (domestic plus international) as a share of real GDP; GY = economic growth.
Table 2 reports the estimates of the turning points calculated from the regression results. The turning point of TA in this study was estimated to be 303.47%, namely, when tourism arrivals are 3.03 times the local permanent resident population. This value is slightly higher than that of Adamou and Clerides’s (2009) study. In their study, a concave curve relationship between TS and GY was found. However, it should be noted that Adamou and Clerides (2009) only used international tourist arrivals as the measurement of TS. If domestic tourist arrivals are added to international tourist arrivals to represent TS, the turning point can be expected to be at a reasonably higher level. It is therefore reasonable to see the difference.
Comparison of Turning Points Estimated.

Calculated by the author.
The turning points for TR (8.25%, 18.33%) have a slightly wider spread compared with those identified by Chang, Khamkaew, and McAleer (2009) and other studies. The turning points for TR estimated in this study are notably higher than those of Po and Huang (2008), Zhao and Mao (2013), and Deng, Ma, and Shao (2014) but lower than the estimate of Adamou and Clerides (2009) and De Vita and Kyaw (2016b). It should be noted that like Adamou and Clerides (2009), both Po and Huang (2008) and Zhao and Mao (2013) excluded domestic tourism figures in calculating the proxy of tourism specialization due to data unavailability. The difference between estimates of turning points for TR can be attributed to the different operationalization of tourism specialization between studies. Although international tourism is a good proxy of the degree of tourism specialization in other countries, it may not be an effective indicator for tourism specialization in China. In China, according to tourism statistics (CNTA 2014), international tourism only accounted for 7.88% of total tourist arrivals and 27.94% of total tourism receipts in 2013. The exclusion of domestic tourism in a large country like China in calculating the proxy of tourism specialization therefore would make the estimation less accurate. Compared to Zhao and Mao (2013), and Deng, Ma, and Shao (2014), the current study somehow has overcome the problem of endogeneity bias and heterogeneity by employing the SYSGMM estimation and used longer-period and more recent time series data for each province, thereby enabling a larger number of observations and hence higher degree of freedom.
Although the estimates of threshold values (turning points) vary in the literature, it has been commonly found that tourism’s contribution to economic growth varies along different levels of tourism specialization. Our result confirms that tourism development supports the growth of overall economy (Chang, Khamkaew, and McAleer 2009; Deng, Ma, and Shao 2014; Po and Huang 2008; Chiu and Yeh 2016) but its influence on economic growth is stage-based. Whether tourism generates economic growth depends on the life cycle of the destination. In the early stage of tourism development, tourism specialization creates increasing returns and accelerates economic growth. However, when TS exceeds its maximum contribution, the contribution of tourism to economic growth declines. When TR reached the valley value of 18.33% (see Table 2), tourism’s contribution to economic growth rose again, indicating a second life cycle for the destination.
Tourism specialization is not merely a process featured by increasing output of tourism products and services, but also a process with economic structural transformation or adaptation characterized by pooled labor, pooled enterprises, and the aggregation of intermediate suppliers and supporting institutions. It should be measured by two aspects: capability and quality. Thus, we argue that the indicator of TA can be used to reflect the size effect or level of tourism specialization. This indicator concerns the capability of a destination to attract visitors by a comparison of its population density. It may reflect both environmental impact and social effects of TS (McElroy 2003). Since the carrying capacity of a destination has its physical limitation and cannot be changed in the short term, TA has an upper bound, for example, only one turning point. If the size of the tourism market exceeds the turning point, the environmental or social costs increase more quickly than the increase of benefit and thus result in the decrease of GDP growth finally. In such a case, tourism cannot be sustainable. Therefore, the curve of TA-GY may only be in an inverted-U shape.
The indicator of TR is able to reflect the structure effect or quality of tourism specialization. It is the key to understanding the degree of economic structural change in a destination caused by tourism expansion. Actually, the relative importance of sectors in terms of production in real GDP is most commonly used to refer to the structure of development of an economy in economic history (Syrquin 1988). For example, a destination with higher TA and lower TR may mean that the destination is oriented toward mass tourism and only provides sightseeing products. The tourism industrial structure is very simple, with a short supply chain of intermediate products. However, a destination with lower TA and higher TR means that the destination offer an eclectic mix of boutique and high quality tourism products and services. The industrial structure is diversified with kinds of intermediate suppliers pooled in the destination. However, when TR exceeds its first turning point, it means the destination goes into a lock-in situation because of the path dependence and brings negative influences such as higher salary and rents, overrunning operational costs, outdated knowledge and technology, on the economic performance. Unless the destination adopts regional innovation strategy to break out the lock-in effect, the recession of the destination is unavoidable. When a destination successfully develops place-based renewal, then it may go into its second life cycle. The curve of TR-GY therefore will present as N-shaped. Tourism in China has undergone nearly 40 years of development, changing from the early inbound-directed sightseeing tourism to the current domestic-dominated leisure tourism. The N-shaped curve of TR-GY may well reflect the transformation trend of tourism in China.
Because the changes of TA and TR are not synchronized as the results show (e.g., the turning point of 303.47% in TA corresponds to 16.57% in TR), using any single indicator may not be able to fully illustrate the nature and reality of tourism specialization in the destination (Castro-Nuno, Molina-Toucedo, and Pablo-Romero 2013), and as a consequence, cannot reflect the real contributions of tourism specialization to economic growth. Therefore, the process of tourism specialization can be further classified into six “regimes” with different characters based on the turning points of TA and TR among different provinces. The impacts of tourism on economic growth in the 31 provinces in mainland China can also be classified to present policy implications regarding tourism development at the regional level (see Table 3).
The Characteristics of Tourism Specialization and Impacts on Economic Growth.

Note: TA* is the turning point threshold value of TA, TRmin is the lower turning point of TR, and TRmax is the higher turning point of TR.
In regime I, the value of TA and TR are both below the turning points, and tourism expansion contributes significantly to economic growth. Destinations in this regime are often in their early stage of life cycle; the tourism industry should be developed strategically to promote economic growth. Policies should be developed on how to exploit potentials and advantages in resource endowment to develop attractive products and services and how to promote sales to foster tourism.
In regime II, TA is below the turning point, but TR is between the first and second turning point values. Destinations in this regime have potentials in tourist arrivals, but a negative relationship exists in tourism development and economic growth due to the negative externalities. There are two possible explanations: crowding out effects and economic leakage. For the first situation, the destination might be going into its maturity. These destinations might belong to an advanced economy. Tourism industry is not an advantage industry compared with competitive manufacture sectors and should be controlled although destinations have surplus capacity of social-cultural and natural environment. For the second situation, destinations are often developing economies. For the development of tourism, tourist activities are congregated in one small geographic area and tourism is dominated by external corporations with weak linkage with local economy. This pattern of enclave tourism repatriates the tourism revenues and earnings outside the region and only leaves a small amount of profits to the host. In this case, destinations should also control the expansion of tourism, while endeavoring to build local supply chains and provide more community-oriented tourism products to avoid the high leakage of enclave tourism.
In regime III, the value of TA is below its turning point while TR exceeds the second turning point. This is the optimal situation, which implies that the destination has entered into its second life cycle with low arrivals; the destination may have a diverse set of tourism activities that can yield greater returns with little environmental impact. However, it seems that very few destinations can reach this stage.
Regime IV represents those destinations in which the value of TA has exceeded the turning point but TR is below its first turning points. Destinations in this regime are often dominated by mass tourism with low quality, but excessive tourist arrivals exert negative impacts on the environment. For destinations in this regime, a strategic development shift is needed to focus on product diversification and sustainable tourism. Recommendable polices include controlling the number of arrivals and adjusting tourism products structure by developing more alternative tourism products and more participatory activities with higher yield, rather than the mass tourism and sightseeing tourism products.
In regime V, the value of TR is between the first and second turning point value while TA exceeds its turning point. Destinations in this regime may be at the late stage of the life cycle. They are facing the diminishing returns of tourism development due to the excessive competition, innovation and institutional inertia (path dependence). Tourism expansion exceeds the carrying capacity and is unable to increase economic growth. These destinations should strictly control the number of arrivals for sustainability considerations and adopt regional innovation strategy to break out the lock-in effects; otherwise, the recession of the destination is unavoidable. Reinvesting in infrastructure, research and development, and education could help facilitate product innovation and improve productivity. Polices should guide the allocation of key resources for new technology and encourage the structural reformation.
In regime VI, tourism specialization in arrivals and receipts both exceed the turning points. Destinations in this regime have entered into a second life cycle by introducing new technology in tourism production or investment in new tourism products. Although tourism propels economic growth to some extent, the expansion of tourist arrivals has exceeded the carrying capacity and thus should be strictly controlled. Strategies should move from expanding the size of the tourist market to improving the quality of the market.
Table 3 shows that the effects of tourism on economic growth vary among destinations. Also, it is found that the effects depend on the level and quality of TS in the destinations (Adamou and Clerides 2009; Castro-Nuno, Molina-Toucedo, and Pablo-Romero et al. 2013; Holzner 2011) and are not clearly related to the population, geographic features, and levels of income of the destinations. For example, the relatively developed areas of Guangdong, Shanghai, Zhejiang, and Beijing were located in different regimes, and some Western provinces, such as Qinghai, Xizang (Tibet) , Yunnan, and Guizhou, were also found in different regimes. Provinces like Henan, Chongqing , and Guangdong that have dense populations also belonged to different regimes.
It should be noted that there are only two provinces, namely Beijing and Guizhou, in which TR exceeds the second turning point; for most provinces, TR is below the first turning point. It seemed that the quality of tourism development in most provinces in China is yet to be further improved despite the country’s significant status in international tourism. Chinese government should control the number of tourist arrivals while adjusting tourism products and production structure according to its levels of TA and TS as aforementioned.
Conclusion
The relationship between tourism development and economic growth has been a subject of academic enquiry and debate for a long time. The argument that tourism development is ultimately beneficial to economic growth, however, is controversial both theoretically and empirically from competing research findings. This study employed an evolutionary view to examine the relationship between tourism development and economic growth. Linking the basic economic law of returns with the theory of TALC, it outlines a dynamical process of tourism specialization acting on the economic growth, which can be depicted as an inverted-U- or N-shaped curve. During the early stages of TALC, tourism specialization creates increasing returns and accelerates economic growth, while at the later stages of TALC, destinations would experience diminishing returns and thus declining economic performance. Our model demonstrates how the relationship of TS-GY evolves over time in accordance with the evolution of destination life cycle (Figure 1) and accommodates effectively the diverse results of former studies on TLGH.
Using an econometric approach of IV regression, we identified the inflection point from increasing returns to diminishing returns, namely, the structural breaks of the host economy, which derive significant management implications for the development of destination tourism industry. Taking tourist arrivals as a percentage of the host population (TA) and tourism receipts as a share of the real GDP (TR) as two measurements of TS, our empirical study further confirms the nonlinear hypothesis on the relationship between tourism development and economic growth in China. It was found that the relationship follows a typical inverted-U curve with a turning point of 303.47% in TA (e.g., the point that tourist arrival is 3.03 times the local permanent resident population), while the form of relationship between TR and economic growth takes on an N-shaped curve with two infection points at 8.25% and 18.33%, respectively.
Importantly, we argue that tourism development is not merely a process with increasing numbers of tourist arrivals but also a driving force that incurs huge structural transformation in the destination economy. Thus, TS should be measured by the portfolio of TA and TR. The former reflects the size or level of tourism specialization. Because of the limitation of land, physical resources, and other sociocultural factors, the capacity of a destination will eventually restrain the growth of tourism specialization in arrivals. Therefore, the turning point of TA is suggested to be the maximum carrying capacity of a destination, a warning threshold in tourism expansion, considering the slow technological progress in tourism production. The latter indicator of TR concerns the tourism production structure dimension or quality of tourism specialization. It is the key to understanding the degree of economic structural change in a destination caused by tourism expansion. Thus, the different portfolio of TA and TR not only reflects the life cycle of a destination but also determines conjointly the impacts of tourism expansion on the economy. The importance of the portfolio of TA and TR is thus a matter-of-course from the perspective of policy making.
The TALC plays a pivotal role in explaining the mechanism between tourism expansion and economic growth. However, this theory is insufficient alone because destinations may have different economic performance even at the same stage of life cycle, because of the different economic structure and natural resource endowment. By extension, this study integrates the functions of both Diminishing and Increasing Returns conjointly into the TALC. As such, it not only accommodates but also interprets effectively the different outcomes of previous studies on the TLGH. The results reveal that the variables of population, geographic features, and levels of economic development of the destinations are not important explanatory variables of the rise and fall of destination economy in general. Instead, patterns of tourism specialization (mass tourism, community-based tourism, enclave tourism, etc.), types of tourism products (sightseeing or vocational), and economic structure of the destination are suggested to be important factors that determine the growth throughout the destination life cycle. Further research should pay more attention to the structural issues in TLGH, for example, how patterns of tourism specialization influence economic growth generally. Besides, the impacts of tourism boom on a destination’s economic structure adjustment should also be further investigated.
Footnotes
Declaration of Conflicting Interests
The author(s) declared no potential conflicts of interest with respect to the research, authorship, and/or publication of this article.
Funding
The author(s) disclosed receipt of the following financial support for the research, authorship, and/or publication of this article: This study was supported by the National Social Science Foundation of China (NSSFC; grant number 16BJY139).