



Abstract
Tourists bite off more than they can chew at hotel breakfast buffets. Food waste from hotel buffets means unnecessary food cost for hotels as well as an unnecessary burden on the environment. The present study measured food waste at a hotel breakfast buffet and identified the following guest and breakfast characteristics as being significantly associated with higher plate waste: more children in the guest mix, more Russians and less Austrians or Germans, fewer hotel guests in the breakfast buffet area as well as more buffet stations being set up. These insights contribute to knowledge on environmental sustainability in tourism, pointing to interesting market segments for targeting in high demand periods as well as promising target segments for interventions (e.g., families) and indicate that simple measures such as rearrangements of the breakfast room may reduce food waste.
Introduction
The tourism industry is interested in both long-term survival and short-term profits. Long-term survival is closely linked to the protection of the natural resources that make a destination attractive to tourists. Short-term profits are driven by both the ability to charge a high price and by keeping the operating cost low. The tourism industry frequently finds itself in the position that actions required to ensure long-term survival stand in direct opposition to those required to maximize short-term profits (Moeller, Dolnicar, and Leisch 2011). For example, capacity restrictions reduce the environmental burden of tourism, but are not welcomed by the tourism industry because they have an immediate negative effect on profit.
In other areas, however, tourism businesses can take actions that achieve both goals simultaneously. Best known is the example of towel reuse in hotels. If guests use their towels more than once, they reduce their environmental footprint and, at the same time, reduce the hotel’s operating cost. A second such case, which stands at the center of the present study, is the reduction of food wasted at breakfast buffets in hotels.
Food waste has negative environmental and financial consequences. Food consumption and production are considered “key issues for climate change mitigation” (Gössling et al. 2011, 535). Food waste is also significantly associated with the use of natural resources, such as water and land (Gössling and Peeters 2015). BIO Intelligence Services (2010) estimates that, on average, one kilo of food waste produces almost two kilos of CO2 equivalent (CO2e) emissions and leads to a depletion of 2.9 tons of natural resources (e.g., species extinction, loss of biodiversity). Food that is not consumed typically ends up in landfill where it uses land and creates methane, a gas that is 25 times more harmful than CO2 (EPA 2016).
In terms of the financial dimension, the value of food waste generated by the UK hospitality sector is estimated at 2.5 billion pounds per annum (WRAP 2013). Sodexo (2011), one of the largest catering companies in the world, reports that, by reducing food waste by 47%, Sodexo lowered overall food costs by 53% or by nearly 5% per meal. A survey of members of the Sustainable Restaurant Association (2010) suggests that, by reducing food waste, a restaurant turning over 10,000 pounds a week could save more than 2000 pounds annually.
In light of food waste being a major driver of the tourism industry’s negative environmental impacts (Gössling et al. 2011) and given the lack of research into food waste in tourism (Gössling and Peeters 2015), the present study makes two key contributions: (1) it is the first to test differences in food waste generated by different types of tourists. All current statistics about food waste in tourism are available only at a highly aggregate level. The present study adds insights by identifying key characteristics of the guest mix that are associated with higher or lower food waste. This is new knowledge that is primarily of academic interest. (2) The longer-term value of pinpointing which guests leave particularly much uneaten food behind lies in being able to develop measures that can target specific segments among hotel guests; segments with the highest potential of reducing food waste. This second aim is primarily of practical value as it forms the basis for the development and testing of food waste reduction measures for hotel buffets.
Literature Review
Food waste is unconsumed food. Food waste occurs at all stages, from food production to consumption. At the consumption stage, the term plate waste is used to describe food served but not eaten (Kuo and Shih 2016). Plate waste consists of three categories: edible, inedible, possibly edible food (Stenmarck et al. 2016). Edible food waste—which represents a significant portion of the total food waste (Marthinsen et al. 2012)—could have been eaten but was not (Cox and Downing 2007; WRAP 2013). Possible reasons include poor quality, personal preferences, and overestimation of the amount of food one will consume (Cox and Downing 2007; BIO Intelligence Services 2010; Lam 2010; Kuo and Shih 2016). Inedible food waste consists of parts of food that cannot be consumed (e.g., peels, bones, egg shells); possibly edible food consists of food parts that some people eat and others do not (e.g., potato skins, cartilage, chicken feet).
The exact amount of food waste generated in tourism and hospitality is unknown, but it is estimated that hotels, restaurants, and the catering sector are responsible for about 14% (BIO Intelligence Services 2010) of the total food waste generated in the European Union. In absolute numbers, the 14% translate to about 12 million tons of food waste per annum, or between 12 and 28 kilograms of food waste per capita per annum for the 27 member states of the European Union. The food service industry produces more food waste than the wholesale, retail, and production sectors, respectively (BSR 2012; Stenmarck et al. 2016). Food waste represents 46% of the total waste produced in US hotels (Alexander 2002). A more recent estimate is that restaurants generate 33% of the total food waste in the United States (BSR 2012). A waste study in a hotel in Bangkok demonstrates an astonishing 1.3 tons of edible food waste in one single week (Lephilibert 2016).
Food waste from the hospitality sector in the European Union ranges from six kilos per person per annum in Slovenia to 50 kilos in the UK (BIO Intelligence Services 2010). The food service industry in the European Union produces 21 kilos of food waste per person per annum (Stenmarck et al. 2016). Scandinavian hotels produce about 120 grams of food waste per meal (Marthinsen et al. 2012), which can be compared to the food waste in restaurants and bars not located in hotels ranging between 1 and 500 grams per meal. Of course, the hospitality sector does not only cater to tourists, although “tourists provide a significant proportion of the market for restaurants and cafes around the world” (Mitchell and Hall 2003, 62).
Tourists consume more food than at home and eat more imported food than at home (Gössling 2015), thus increasing the tourism-related environmental impact on the destinations (Hunter and Shaw 2007). Given that food consumption is a key tourist experience (Mitchel and Hall 2003), it is likely that tourists try different kinds of food and do not like some of them. This leads to more food being wasted than at home. It is currently not known, however, which fraction of the hospitality-generated food waste is caused by tourism. One reason for this information not being available is that tourism related food consumption and its environmental implications have not been extensively researched to date (Gössling and Peeters 2015).
Buffets are a form of meal service where guests typically pick and self-serve food in an all-you-can-eat manner. Buffet-style meal serving is a very popular method of serving food in the hospitality industry and an important part of the service quality in hotels (Wilkins, Merrilees, and Herington 2007). Buffets typically contain one or several stations with a variety of dishes completing a full meal course; typically starters, main courses, deserts, salads, cheeses, and fruits. Buffet-style meals increase hotel performance directly through guests’ spending (Tanford and Suh 2011) and indirectly through higher guest satisfaction and reduced service staff costs. Buffets allow easier and quicker meal service and offer guests choices (Cohen and Avieli 2004). Such self-controlled serving influences guests’ expectations (Yen-Soon, Bergman, and Raab 2010) and leads to higher levels of satisfaction (Wilkins, Merrilees, and Herington 2007) with the hotel service.
However, buffets can also increase food service cost because more food is consumed (Kuo and Shih 2016) and more food is taken, but not eaten (Wansink and Ittersum 2013). At buffets, people tend to overload their plates due to the wide variety and abundance of displayed food available to them, at no extra costs (Kuo and Shih 2016). In tourism, overloading plates leads to more food waste because tourists tend to experiment with unknown dishes (Quan and Wang 2004), which they may not enjoy once they try them.
Higher demand for food and increased plate waste negatively impact the environment. More food needs to be produced, transported, stored, and processed. Producing 1 kilo of vegetables, for example, causes between 0.036 (carrots) and 28.5 (tomatoes) kilos of CO2e. Transportation adds between 0.015 (tomatoes) and 0.725 (grapes) kilos of CO2e (Gössling et al. 2011). These figures increase as food is prepared and then disposed into landfill, where food waste releases various greenhouse gases, including methane, which is 25 times more harmful than CO2 (EPA 2016) and “one of the largest sources of greenhouse gas emissions from the waste sector” (UNEP 2013). Other environmental impacts of food demand in tourism include water and land use. Negative social impacts of providing buffet-style meal service include food obesity (Duerksen et al. 2007; Wansink and Payne 2008) and overconsumption (Kuo and Shih 2016).
It can be concluded that buffets, as a style of food service, are concerning for at least two reasons: buffets increase food consumption and consequently food production, and buffets increase food waste. Both, greater production and more food waste cause environmental problems. Food waste is a major contributor to the overall environmental impacts of tourism (Gössling et al. 2011).
Sociodemographic Characteristics and Food Waste
The UK hospitality and food service sector produced nearly three million tons of food waste in 2011, of which 34% is plate waste (WRAP 2013)—food that is served but not eaten by a customer. Similar estimates are provided by the UK-based Sustainable Restaurant Association (2010) stating that about one third of food waste comes from customers’ plates. In academic studies, findings about plate waste per person vary substantially. Wansink and Payne (2008) estimate that 6% of the food served on the plate is not eaten, Gunders (2012) reports 17%, Freedman and Brochado (2010) 20%, and Just and Wansink (2011) 37%. Students eating in university dining areas waste 30% of all the food they take from the buffet for a single meal (Lam 2010). Children emerge as the worst culprits, leaving about 40% of the food they are served uneaten (Wansink and Johnson 2015).
A number of other personal characteristics potentially associated with food waste emerge from studies into food waste in the home context. Koivupuro et al. (2012) investigated the influence of individual characteristics of household members on the amount of food waste. Results of the survey among 380 Finnish households show that single-women households produce more food waste per person than the single-men households, households with children younger than 18 years, and households with two or more children older than 17 years. Moreover, households with women primarily responsible for shopping also produce more food waste than families where men are in charge of shopping. Households affected heavily by price in their food purchase decision waste significantly less food. Surprisingly, households stating that the amount of food waste is in their control generated more food waste.
Shopping at supermarkets, shopping less frequently, and spending more than 100 Euros per shopping occasion is associated with more food waste (Marangon et al. 2014). In addition, food waste per person was found to be positively associated with more people living in the household and higher levels of education, but negatively associated with age. A study among nearly 2,000 UK residents concludes that food waste was higher among people under 45, from a low social class, employed full time, and young families with children under 16 years of age (Cox and Downing 2007). Overall, this study also finds that preparing too much food and dissatisfaction with the taste of the food, especially among children, are the key drivers of food waste at home. The authors also suggest that very few people make efforts to reduce their food waste. No association exists between gender and food waste behavior in the home environment according to Wansink and Johnson (2015).
A number of other personal characteristics potentially associated with food waste emerge from studies into food waste in the home context. But the results of these studies do not allow drawing clear conclusions because of incomparable study designs and contradictory results.
Although the body of work on plate waste does not agree on the associations of all sociodemographic characteristics with plate waste, one finding emerges consistently: the key role children play. We formulate two hypotheses based on this body of work:
Hypothesis 1: Children generate more food waste than adults.
People eat because they are hungry (metabolic reason) and because they enjoy food (hedonic reason) (Burgess et al. 2014; Mitchel and Hall 2003). Hedonic eating is positively associated with food intake, body weight, and food waste (Wansink and Payne 2008). When hungry, people overserve their plates, leading to more plate waste. The first breakfast at a hotel may be affected by both hedonic and metabolic reasons, both increasing plate waste. For example, guests who arrive late at night may not have an opportunity to eat before breakfast, thus arriving at the buffet very hungry. Also, when visiting the buffet for the first time, guests—driven by hedonic motives—may wish to explore a wide spectrum of dishes on offer, only to find what they like and what they do not like; the not-liked food is left uneaten. The second time guests come to the same buffet, they already know to avoid the items they did not like, becoming more focused in their food choice.
Hypothesis 2: Hotel guests generate more food waste at the first breakfast after arrival.
Country of Residence and Food Waste
Environmental beliefs have been theoretically postulated (Stern 2000) and empirically demonstrated (Bamberg and Möser 2007; Klöckner 2013) to be associated with environmentally sustainable behavior in general and food waste–related behaviors in specific (BIO Intelligence Services 2010; Aschemann-Witzel et al. 2015). Different countries are known to vary both in terms of infrastructure provided to residents, enabling them to engage in environmentally sustainable behavior, and pro-environmental beliefs held by residents. Empirical evidence for this fact has been provided in numerous studies that have shown differences in environmental beliefs, environmental knowledge, or behaviors with environmental consequences between Asian and Western countries (Aoyagi-Usui, Vinken and Kuribayashi 2003) and between students from different countries (McKercher, Pang and Prideaux 2011).
Aoyagi-Usui, Vinken, and Kuribayashi (2003) demonstrate that in Western-countries, environmental values are linked to altruistic but not to traditional values. In Asian countries, however, environmental values are linked to both traditional and altruistic values. In Japan, postmaterialist, biospheric and altruistic values, household income, education, age, and gender are associated with energy-saving behavior, pro-environmental political behavior, and green consumer behavior. In Japan, women are more positive about energy saving and green consumer behavior than men. In Western countries (e.g., the Netherlands), people with more traditional values do not practice pro-environmental political behavior but engage in energy saving and green consumer behavior. Dutch women are more positive about energy-saving behavior than men, but share similar views as men about green consumer behavior.
Asian students have the strongest pro-environmental beliefs and express most concerns about the potential impacts of climate change. British and Irish students emerge as the least concerned about the environment. Students from the United States were the least concerned about climate change (McKercher et al. 2011).
A recent survey study in Europe (European Commission 2014) confirms these differences. For example, while 96% of respondents from Malta, Ireland, and Netherlands believe they can help to protect the environment, only 70% of Czechs, Hungarians, Finnish, Estonians, and Austrians feel the same way. Recycling is being practiced by around 90% of respondents from Slovenia, Luxemburg, Sweden, Ireland, and France, but only by a quarter of respondents from Bulgaria, Romania, Latvia, and Croatia. Similar differences are being reported also for energy- and water-saving behavior as well as for reducing waste and choosing environmentally sustainable ways of traveling. Although these studies were conducted in the home context, the differences across people from different countries may well also manifest in the tourism context. Note, however, that the available statistics are at aggregate level only; it is possible that a segment of the population travels for which the environmental behavior is not typical of their home nation. Irrespective of such effects occurring, based on differences in aggregate statistics, it is plausible to formulate a hypothesis about country of origin.
Hypothesis 3: Hotel guests from different countries of origin differ in the amount of food waste they generate.
Weather and Food Waste
Weather affects different aspects of human behavior, including what and how much people eat. Little has been published in the academic literature on this topic, but reports of associations between weather and eating are abundant on food- and health-related webpages. Aubrey, one of the many online bloggers about healthy life, says that “it seems like the minute the weather turns colder, we crave more to eat” (2011). An online forum on diet and nutrition (Sparkpeople 2010) also offers a few interesting statements: “when it’s oppressively hot in the summer, all I can handle is salads and fresh fruit. In the fall and winter, I want warm, filling foods, so I go for soups, stews, and comfort foods”; “cold weather makes me really crave hot, fatty foods. Stuff like beef stew, meatloaf & mashed potatoes, and wing dip straight out of the crockpot!”; “The weather is getting cooler now and I am finding myself desiring more food.”
Although scientific explanations about the correlation between weather conditions and eating behavior are scarce, suggestions are that the lack of sunlight, typical for winter and rainy days, makes people seek more food and eat faster. It seems that less light “prompts us to seek food and eat it faster” (Aubrey 2011). Another explanation could be seasonal affective disorder, typical for winter and rainy days. Short and rainy days make people depressed and they often seek comfort in food (NHS 2015). De Castro (1991) investigated eating behavior of 315 individuals over a six-year period revealing strong seasonal variations in eating behavior. More specifically, nutrition intake is 14% higher in fall than in other seasons of the year. On average, per day, people eat 222 calories more in fall than in spring. In addition, people eat larger meals in fall than in other seasons. People also report to be significantly less hungry after a meal during summer than winter.
Weather also affects tourist behavior. Some tourists select vacation activities to suit weather conditions (de Freitas 2003) or even change vacation plans before departure and during their trip (Lohmann and Hübner 2013; Becken and Wilson 2013; McKercher et al. 2015). Because people perceive actual weather conditions differently, the perceptions of weather may be more important than the actual weather in affecting behavior (McKercher et al. 2015). Differences in perceptions can be due to different climate conditions in the country of origin or due to tourists’ travel motivations (Lohmann and Hübner 2013).
The effect of weather on tourist behavior also depends on the type of destination visited. Activities offered at different destinations are not equally dependent on weather conditions. For example, weather conditions have little effect on tourist behavior in Hong Kong (McKercher et al. 2015) whereas the weather strongly influences tourist behavior on the Caribbean island of La Martinique (Lohmann and Hübner 2013) and in New Zealand (Becken and Wilson 2013).
Associations between weather and tourists’ eating behavior have not been studied yet. However, based on prior work on the effect of weather on tourists’ engagement in vacation activities as well as the effect of weather on eating, it can be assumed that the weather at a seaside hotel will affect tourist behavior at the breakfast buffet. Expecting tourists to stay at breakfast buffets longer when the weather is bad, we hypothesize as follows:
Hypothesis 4: Bad weather causes more food waste at breakfast buffets.
Perceived Abundance of Food and Food Waste
A number of studies demonstrate that larger plates lead to more food waste (Freedman and Brochado 2010; Wansink and van Ittersum 2013; Kallbekken and Sælen 2013). Freedman and Brochado (2010) suggest reducing portion sizes to reduce plate waste. They prove the effectiveness of this strategy in an experiment where they reduce the portion size for French fries at a university self-serving buffet-style restaurant. Interestingly, regardless of the plate size, people did not eat about 20% of what was on the plate originally. Because of the smaller serving, 20% of that smaller serving is effectively less absolute food waste.
In the hotel context, Kallbekken and Sælen (2013) demonstrate that decreasing plate size reduces food waste: reducing the plate size by 3 cm reduces plate waste by 22%; 1cm smaller plates reduce the waste by 7%. In another study, guests using smaller plates (24 cm) on average produced 5.2 grams less food waste compared to guests using standard 27cm plates (Hansen, Jespersen, and Skov 2015). Wansink and van Ittersum (2013) demonstrate that people eat 45% more food and waste 135% more food at buffets with large plates than at buffets with smaller plates. An explanation is offered by van Ittersum and Wansink (2012): the Delbeouf illusion suggests that people tend to overserve on larger plates and underserve on smaller plates because people perceive the same portions on larger plate as not enough while perceiving it as too much on smaller plates. In addition, people using larger plates believe they have eaten less than people using smaller plates. External factors such as ease of food accessibility and food visibility have a stronger impact on higher food serving than internal cues (Benton 2015). Because more buffets in the breakfast area increase the visibility, availability, and accessibility of food being offered to hotel guests, we hypothesize as follows:
Hypothesis 5: More food waste is generated when more buffets are set up.
Perceived Anonymity and Food Waste
Theoretical (Stern 2000) and empirical evidence (Klöckner 2013) suggests that social norms are a good predictor of pro-environmental behavior. Social norms are beliefs about appropriate behavior of referent others. Being exposed to referent others who support a certain behavior will therefore motivate people to behave in a similar way. A number of studies have successfully harvested this effect in experimental interventions aiming at reducing towel use in hotels (e.g., Goldstein, Cialdini, and Griskevicius 2008; Shultz, Khazian, and Zaleski 2008; Baca-Motes et al. 2013).
An experimental study conducted specifically in the context of food waste was conducted by Kallbekken and Sælen (2013). Before any intervention the 52 Finnish hotels where the study was conducted produced between 34 and 38 kilograms of food waste per day. The authors tested the effectiveness of two interventions: the use of smaller plates and the use of a table sign encouraging hotel guests with the following word: “Welcome back! Again! And again! Visit our buffet many times. That’s better than taking a lot once.” The aim of this sign is to prevent people from feeling embarrassed by serving themselves multiple times. The intervention uses social norms and tries to make it socially acceptable to go back to the buffet many times. The results show that reducing plate size reduces food waste by nearly 20%. The social norms intervention reduces food waste by 21%. Findings also show that none of the treatments have a negative effect on guest satisfaction.
If kept in anonymity, thus not being exposed to referent others, people will keep practicing their typical food waste behavior. The level of anonymity in a hotel setting varies, especially because of the number of guests staying in a hotel and with the average length of stay. Both factors influence whether people will have the opportunity and time to get acquainted to other guests and serving staff. Having become acquainted with other guests and staff, it is very likely that guests will change their food behavior to be less wasteful.
A study by Bucciol, Montinari, and Piovesan (2014) demonstrates that in case of increased anonymity, when more than two households share the same waste bin, the volume of unsorted waste is significantly higher than when one or two households use the waste bin. Because a larger number of people being in the breakfast area at the same time is likely to lead to increased perceived anonymity, we hypothesize as follows:
Hypothesis 6: Hotel guests generate more food waste if there are more people in the breakfast area.
Methodology
Data were collected at a four star–rated hotel at the Slovenian coast between June 11 and September 11, 2015. The hotel is part of a larger hotel resort located on the Slovenian coast and consisting of three hotels in total, each with a separate in-house dining area. The hotel offers 516 hotel rooms and accommodates up to 1,200 guests. The guest mix contains all demographic groups who mainly visit the resort to enjoy typical sun–sea–sand holidays. About 75% of hotel guests are international, mainly from neighboring countries (such as Italy and Austria) but also from distant countries (such as Russia and the United States). The hotel offers a private beach, an indoor swimming pool area, a wellness center, and a number of other tourist activities, for example, bike renting, boat renting, music, and cultural entertainment animation. Breakfast is included in the room rate.
The following information was collected for a period of 92 days.
Data collection was approved by The University of Queensland Ethics Committee under approval number 2015001101.
Data were first analyzed using descriptive statistics to gain insight into the distribution of the variables based on mean and standard deviation as well as the minimum and maximum values, the 25th percentile, the median, and the 75th percentile to account for skewness and the bounded nature of the support of some variables. Next, a linear regression model with waste per person and day in grams as dependent variable was fitted. Buffet size, temperature, rainfall (yes or no), percentage of country origin of guests, number of guests (in hundreds), percentage of guests who arrived the day before and who are departing on this day, and age group served as explanatory variables in the regression model. Variable selection was performed with a backward stepwise procedure using the Akaike information criterion (AIC) as performance criterion starting with the full model. For the final model, regression coefficient estimates along with standard errors are determined. In addition, standardized regression coefficients and variance inflation factors (VIF) to give insights into multicollinearity are provided. t tests are performed to check the significance of the regression coefficients ignoring that the same data were already used to select a suitable model.
Results
Sample Characteristics
Sample characteristics are provided in Table 1. As can be seen in the first row of the table, the average food waste per person per day caused by food taken from the buffet but not eaten is 15.2 grams. The third row labeled “Austria” indicates that on average 25.4% of guests in the hotel are Austrians. The following rows provide information on the distribution of the percentage of guests from the other countries. Then information on the age distribution of guests is provided.
Sample Characteristics.
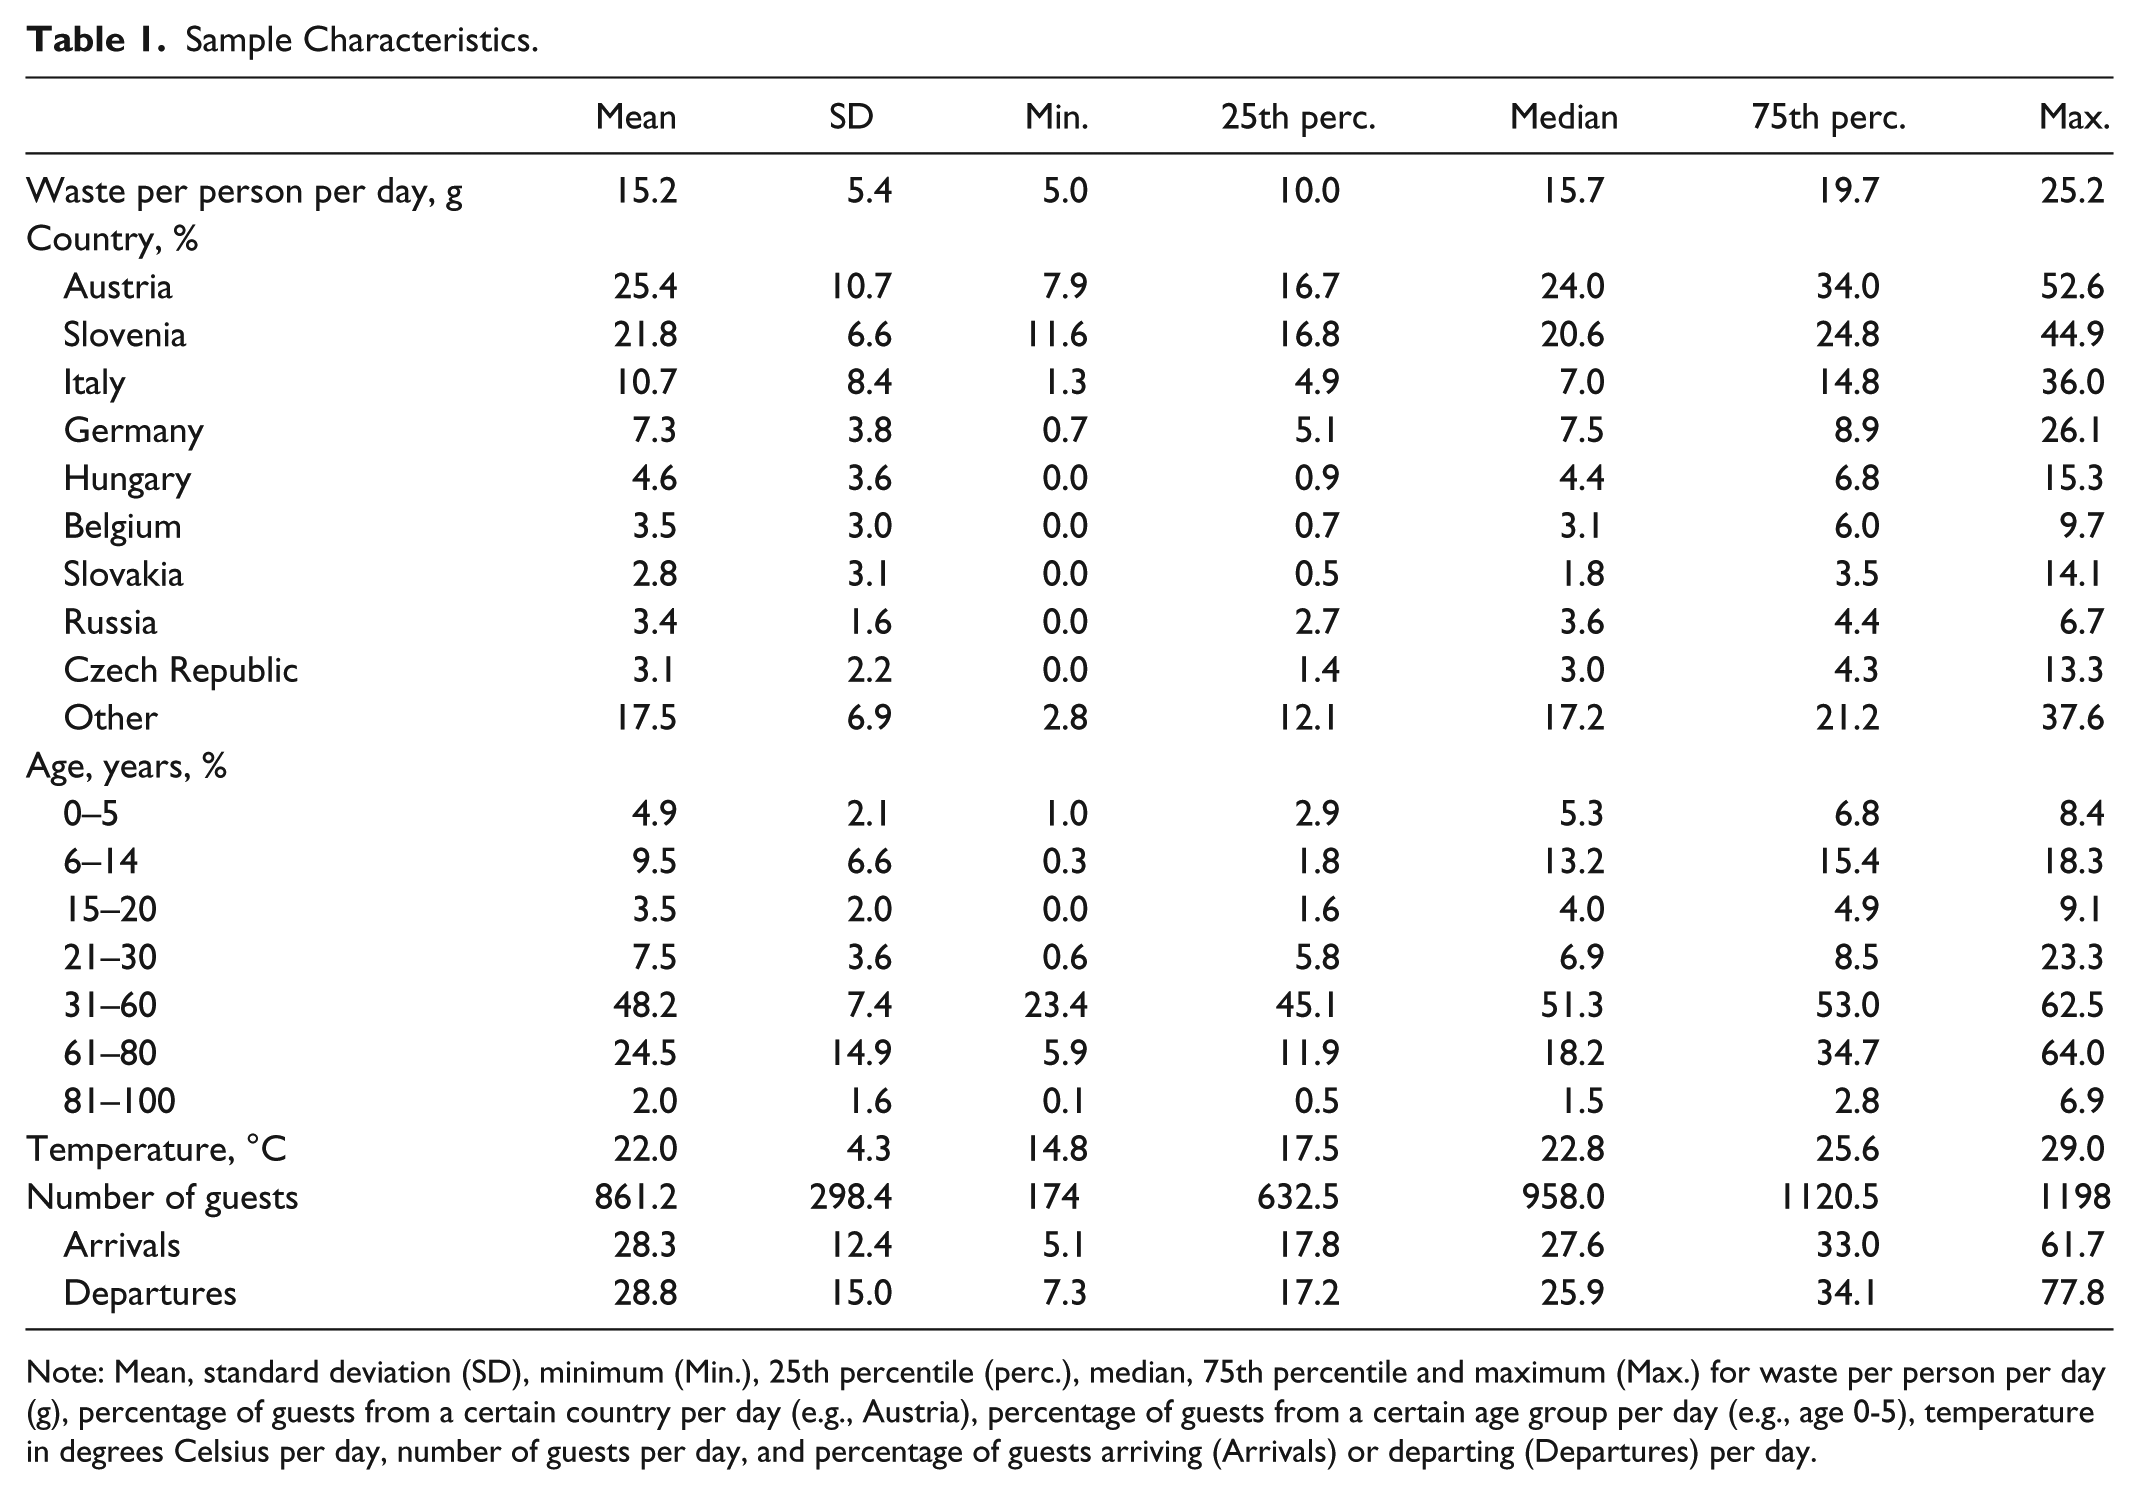
Note: Mean, standard deviation (SD), minimum (Min.), 25th percentile (perc.), median, 75th percentile and maximum (Max.) for waste per person per day (g), percentage of guests from a certain country per day (e.g., Austria), percentage of guests from a certain age group per day (e.g., age 0-5), temperature in degrees Celsius per day, number of guests per day, and percentage of guests arriving (Arrivals) or departing (Departures) per day.
Across the 92-day data collection period, the average number of guests in the hotel was 861. As a consequence of the fluctuation of the number of guests with a minimum of only 174 and a maximum of 1,198, the smaller buffet size was set up on 40 days and the larger buffet size on 52 days.
Of the guests staying at the hotel during those 92 days, about a quarter came from Austria; 22% from Slovenia; 11% from Italy; 7% from Germany; 5% from Hungary; 4% from Belgium; 3% each from Russia, the Czech Republic, and Slovakia; and 18% from all other countries that are not separately entered in the hotel database.
Most hotel guests (48%) were, on average across the 92 days, between 31 and 60 years old, followed by a quarter of the guests aged between 61 and 80. Fifteen percent of guests were children under 15. During data collection, 28 guests arrived in the hotel per day on average and 29 departed. This discrepancy between the average number of guests arriving and departing is due to the fact that the observation period started during a period where the hotel was fully booked and ended on a day when it was not fully occupied. Therefore, during the observation period, fewer guests arrived than departed.
In terms of weather, the average temperature at the destination during the time of data collection was 22°C; it rained on 25 days and did not rain on 67 days.
Testing of Hypotheses
Table 2 provides the coefficients of the regression analysis as well as their standard errors, the standardized coefficients, the p values of the two-sided t-tests if the coefficient is equal to zero, and the variance inflation factors (VIFs). The coefficient estimates given in Table 2 can be interpreted in the following ways. The coefficient estimate for “3 Buffets,” for example, indicates that the observed average food waste (grams) is 5.954 g higher if three instead of two buffets are set up while all other variables are kept at the same level. The coefficient for “Austria” indicates that if the percentage of Austrians staying at the hotel is 1 percentage point higher, the average food waste observed is 0.1 g lower. The estimate for “Younger guests” indicates that on days when the guest mix includes more young guests, the average food waste is 3.4 g higher compared with days when the share of older guests is higher. The standardized coefficients in Table 2 indicate that the importance of the coefficients for variables measured in percentage is in fact higher than their unstandardized coefficients would suggest. Furthermore, the dependence between the number of buffets set up and the number of guests staying at the hotel as well as the age distribution of guests changing with the occupancy level in the hotel leads to higher VIF values for these variables. Figure 1 illustrates the relative association of each of the predictor variables on the dependent variable (food waste). For each predictor variable selected by the stepwise procedure, a bar is added where the length is proportional to its size and they are ordered by absolute value. The direction of the bar depends on its sign. For each bar the standard errors of the estimated coefficients are indicated by the lines. The gray bars indicate that the t-tests have a p value smaller than 0.05, indicating a significant effect, while white bars are used otherwise.
Regression Coefficients (Backward Variable Selection Using AIC).

Note: AIC = Akaike information criterion; Coef. = coefficient; Std. Error = standard error; Std. Coef. = standardized coefficient; VIF = variance inflation factor.

Ordered regression coefficients.
Table 2 is the basis for hypothesis testing. As can be seen, hypothesis 1, which postulates that children generate more food waste than adults, is supported by the regression analysis results. On days with more young guests staying at the hotel, especially children under the age of 14, significantly more food waste is generated than on days when more adults are staying at the hotel.
Hypothesis 2 postulates that hotel guests generate more food waste at the first breakfast after arrival. The reason for this hypothesis is that people who come to the buffet the first time may try a few different food items but find that they do not like some of them. The unwanted items are left behind. The next day, the guests already know which items not to put on the plate, thus avoiding the plate waste of the first day. Hypothesis 2 is not confirmed by the analysis. As can be seen in Table 2, the variable capturing arrival has been eliminated during the backward stepwise selection procedure using the AIC as criterion.
A significant country of origin effect is detected in the data. This means that hypothesis 3 (which states that hotel guests from different countries of origin differ in the amount of plate waste they generate) is supported. More specifically, among all the countries of origin included in the data set, Austrian guests are found to produce significantly less food waste than guests of other nationalities. Russian guests produce significantly more food waste. In particular, the effect of a one percentage point increase in Russians in the guest mix on food waste would be quite substantial, as can be seen in Figure 1.
The proposition that bad weather increases food waste as a consequence of tourists changing their behavior from undertaking activities to spending more time at the breakfast buffet is not supported by the data. Hypothesis 4, therefore, is not confirmed.
Hypotheses 5 and 6 cannot be tested separately because an increase in the number of people in the breakfast area over a certain threshold always implies automatically that the hotel sets up a third buffet station. This third buffet station has the same food items but increases the overall amount of food in the breakfast area and reduces the distances guests need to walk to get to the buffet. Hypothesis 5 postulates that perceived abundance of food as a consequence of the third buffet leads to more food waste. Hypothesis 6 postulates that the increased anonymity caused by more people being present in the room reduces the effects of social norms and thus increases plate waste. The regression analysis results support these two hypotheses. The number of buffets set up is highly associated with more food waste. The third buffet is set up as soon as there are 800 guests in the hotel. In fact, as can be seen in Figure 1, increasing from two to three buffet stations in the breakfast restaurant area has a substantial effect on food waste. Within the same number of buffets, however, the number of guests is associated with decreased food waste. If, for example, two buffets are set up and the number of guests using these two buffets increases, the perception of food abundance decreases (less food per person at the buffet) and, with it, food waste. Once the third buffet is set up, the available amount of food per person suddenly increases rapidly, giving the impression of significant food abundance. In that situation, food waste increases quite dramatically.
Conclusion
Plate waste is a problem. It causes restaurants, hotels, and catering businesses unnecessary cost in food purchasing and production. It also harms the environment because both food production and disposal of uneaten food cause substantial greenhouse emissions and are associated with greater use of land and water resources.
The present study identifies a number of factors that are associated with higher food waste at hotel breakfast buffets: children pile more on their breakfast plates than they eat, guests from different counties of origin have different food waste habits, with some countries of origin wasting significantly less food than others, and the combination of more food being available in the breakfast area and more people being in attendance increases food waste. Because these latter two factors are inseparable in the analysis given that the hotel sets up a third breakfast island as soon as a certain threshold of guests is reached, it cannot be concluded with certainty from this study whether it is the perceived abundance of food or whether it is the increased anonymity that causes this effect.
These insights contribute to knowledge because, to date, drivers of plate waste in tourism have not been explored. Rather, prior research offers only aggregate estimates of plate waste, which do not lend themselves as a basis for hypothesis generation, and ultimately the development of a framework of theory that aims at offering a comprehensive explanation of plate waste. The present study is the first step in this direction, uncovering a number of key associations.
These key associations can be used to develop and test measures to reduce plate waste. For example, parents could be asked to serve their children or tasting plates could be offered at the buffet, allowing everyone—but most critically children—to taste small portions of food items because serving larger portions untested on the plate leads to more plate waste. Another simple measure would be to modify the setup of the buffet room. For example, decorative screens could be put up in a way that would deliberately make the breakfast areas look smaller and would only make one of the buffet stations visible to guests. Such a simple measure may achieve two things: reduce perceived anonymity of guests as well as reduce perceived food abundance. Both or one of those factors, based on findings from this study, are likely to reduce plate waste.
The study also provides insights into which market segments of hotel guests are the most promising groups to aim measures at. For example, children emerge as the obvious market segment with high plate waste reduction potential.
The present study has a number of limitations: data was not collected at individual level for two reasons: (1) it is practically not possible to collect plate waste per hotel guest, and (2) human ethics approval could not be obtained for such a procedure. The analysis was based on aggregate data, not on individual level guests data from the hotel data base. Using aggregate data reduces statistical power, but the variability in the aggregate guest mix was sufficient to identify significant associations between guest characteristics and food waste. The aggregate approach had the advantage that the identity of the guests staying at the hotel is not revealed to the researchers at any point. Optimally, this study would have been conducted across a range of hotels, further increasing the variability of the guest mix and the buffet characteristics. Such a design was not affordable because of the high labor cost associated with daily manual weighting of plate waste, but would be a valuable extension of this present study. The hypothesis of abundance and anonymity could not be separated in the present analysis because setting up a third breakfast station is a procedural consequence of more guests. This is an important area of future work. If the perception of abundance drives plate waste, a third buffet should never be set up, irrespective of the number of guests. Finally, this study does not develop a theory or framework of plate waste. Rather, it serves as an initial exploratory study into factors that are significantly associated with plate waste. More exploratory work is required to inform a framework or theory of plate waste in future. Such a framework or theory would represent the best possible basis for the development of measures aimed specifically at reducing plate waste.
Footnotes
Declaration of Conflicting Interests
The author(s) declared no potential conflicts of interest with respect to the research, authorship, and/or publication of this article.
Funding
The author(s) disclosed receipt of the following financial support for the research, authorship, and/or publication of this article: We thank the Australian Research Council for financial support of this project under grant DP110101347. We thank Hoteli Bernardin d.d. for allowing us to run this field study on their premises and our research assistants Vanda Kunst, Robin Ulaga, Gašper Čuk, Katarina Morato and Jurij Blaslov for helping to collect food waste measures.