




Abstract
Because of the inefficiency in analyzing the comprehensive travel data, tourism managers are facing the challenge of gaining insights into travelers’ behavior and preferences. In most cases, existing techniques are incapable of capturing the sequential patterns hidden in travel data. To address these issues, this article proposes to analyze the travelers’ behavior through geotagged photos and sequential rule mining. Travel diaries, constructed from the photo sequences, can capture comprehensive travel information, and then sequential patterns can be discovered to infer the potential destinations. The effectiveness of the proposed framework is demonstrated in a case study of Australian outbound tourism, using a data set of more than 890,000 photos from 3,623 travelers. The introduced framework has the potential to benefit tourism researchers and practitioners from capturing and understanding the behaviors and preferences of travelers. The findings can support destination-marketing organizations (DMOs) in promoting appropriate destinations to prospective travelers.
Introduction
Tourism plays an important role in the growth of the global economy. In 2013, international tourism generated a total of US$1,075 billion (ATTF 2013). Among this amount, US$102 billion were received from the expenditure of Chinese travelers, making China the number one source market. Germany and the United States both ranked second, with US$84 billion. Australian tourists’ expenditure overseas ranked ninth globally, with US$28 billion (ATTF 2013). An accurate and insightful understanding of travel behavior is thus vital to utilize the great economic benefits of the tourism industry (Edwards et al. 2009). By better understanding travel behavior, tourism practitioners can formulate more appropriate business strategies and travel service/products to meet travelers’ needs, which in turn make a remarkable return on business investment.
Tourism researchers and managers have been pursuing insights into travel behavior to support strategic planning and decision-making in product development and destination management (Li, Meng, and Uysal 2008). Knowledge about travelers’ location preferences helps tourism managers refine existing attractions, planning new ones, and proposing effective marketing strategies (Lew and McKercher 2006). Understanding the movement patterns of travelers is valuable for tourism organizations in identifying bottlenecks and unnecessary barriers in the flow among tourism destinations (Prideaux 2000), or in segmenting the tourism market to identify suitable travel packages that well align with the characteristic of travelers (Xia et al. 2010).
An analysis of travel patterns is usually performed based on the travel history recorded by travelers during their trips, which are referred to as travel diary (Leung et al. 2012; Sheng and Chen 2013; Vu et al. 2015). Spatial information and temporal information are important components of travel diaries for describing the travel events, so that their behavioral patterns can be inferred. Because of the complex nature of travel behavior, efforts have been made to develop techniques to analyze travel diaries to extract useful patterns. For instance, a method based on dominant movement patterns was introduced for segmenting the tourism market of Phillip Island in Australia (Xia et al. 2010). An anisotropic dynamic spatial lag panel Origin–Destination travel flow model was proposed to analyze Australian domestic and international travel patterns (Deng and Athanasopoulos 2011). Both spatial and temporal dynamics were incorporated for tourism demand modeling from the perspective of origin–destination travel flows to the discovery of useful temporal and spatial patterns. To demonstrate, content and social network analyses were carried out to examine the travel diaries and map movement patterns of travelers during the Beijing Olympics (Leung et al. 2012). Other works adopted the Geographic Information System to facilitate the analysis of the movement patterns of travelers (Li, Meng, and Uysal 2008; Zakrisson and Zillinger 2012; Orellana et al. 2012). Since traditional data collection methods, such as surveys, opinion polls, and questionnaires, usually require direct contact with travelers, the collected data are limited in the number of responses and the scale of geographical area included (Zheng, Zha, and Chua 2012). Vu et al. (2015) overcome this limitation by utilizing the geotagged photos taken by travelers to capture the spatial and temporal information effectively.
Despite the efforts from researchers, tourism managers are still facing challenges in gaining insights into the complex travel behavior of tourists. Travel diaries usually comprise multiple travel events to different locations/destinations (Leung et al. 2012). The sequential association of the visited locations can reflect travel behaviors and preferences, especially in case of international travel. For instance, some travelers who visited France in their trips to Europe had also visited Italy, whereas other travelers would visit the United States after their visit to Canada during their trips to North America. Such sequential associations are useful for agencies in creating more appropriate and promising travel packages. Special offers to visit both the United States and Canada can then be presented to travelers, especially those who want to visit Canada. Such sequential associations are often embedded in the complex sequential travel data, but the existing methods in travel behavior analysis are incapable of accounting for these multiple sequential travel events simultaneously. Traditional approaches using descriptive statistics focus on identifying popular destinations (TRA 2014b). A travel sequence has been considered but is limited to a few subsequent travel events (Leung et al. 2012; Barchiesi et al. 2015; Vu et al. 2015). Prior works were unable to discover sequential association in travel diary data for insightful understanding of travelers’ behavior.
Recently, a branch of data mining specifically for sequential patterns has emerged because of the increasing availability of sequential databases (Mabroukeh and Ezeife 2010). Sequential patterns and subsequences that appear frequently in sequential data sets can be effectively discovered. For instance, Shie et al. (2012) mined user behavior patterns in mobile environments for planning mobile commerce environments and managing online shopping websites. Aloysius and Binu (2013) mined user buying patterns to improve shelving of products based on order of purchasing patterns. Lately, Zheng et al. (2016) attempted to extract sequential behavioral patterns between compliant and noncompliant taxpayers in the financial service industry. Cheng et al. (2016) mined sequential risk patterns from diagnostic clinical records to provide potential clues for physicians for early detection of diseases. Since the travel events in travel diaries can be treated as sequential patterns in a temporal order, it is therefore beneficial to adopt techniques for mining sequential data to analyze the travel diaries.
Aiming to address the limitations in prior works, this article attempts to incorporate data-mining techniques for sequential patterns into travel behavior analysis. A method named sequential rules mining (SRM) is introduced to extract the sequential patterns from travel diaries. SRM is able to reveal the complex travel behavior of travelers and infer the potential associated travel destinations (Cheng et al. 2016). The advantage of the proposed method is demonstrated in a case study of international travel patterns of Australians. We utilize geotagged travel photos available on social media sites as a data source as they are available on a large scale and are effective in capturing the travel behavior of tourists (Barchiesi et al. 2015; Vu et al. 2015). The geotagged photos are taken by travelers during their trips through digital photo-capturing devices, such as smartphones, smart cameras, and tablets. These devices have a built-in global positioning system (GPS) to record geographical information automatically. The travel history of tourists can be extracted from the sequence of posted photos as travel diaries. The study reveals sequential travel patterns of Australian travelers to popular destinations in Asia, Europe, and America, to offer insights to tourism managers for destination marketing and travel package development. It is important to mention that the focus of this article is on the sequential travel patterns of travelers to demonstrate the capability of the travel diary and SRM; other influencing factors of travel behavior are beyond this study’s scope of coverage. The introduced framework with the SRM technique has the potential to benefit tourism researchers and practitioners from capturing and understanding the complex travel behaviors and preferences of travelers.
The rest of the article is organized as follows. The second section provides the background on travel diary for travel research and methods for sequential pattern analysis, which is followed by a recap of pattern mining techniques for sequential data. The third section presents our framework to process geotagged photos for travel diary construction, which is followed by a description of the SRM technique. The fourth section describes case study and result analysis for Australian travelers, and discusses the practical implications of the research outcome. The final section concludes the article and envisages some future research directions.
Literature Review
Travel Diary for Travel Research
Breakwell and Wood (1995, 294) defined diary as “a record of information in relation to the passage of time.” Early attempts in tourism have made use of diaries to record and analyze traveler behavior and expenditure on entertainment, food, and shopping (Breen, Bull, and Walo 2001) and to explore their experiences, emotions, and satisfaction (Coghlan and Pearce 2010). Travel diaries were used to capture the movement of travelers (Ian, Shane, and Jillian 2011) or to address transportation problems at tourism destinations (McKercher and Lau 2008).
Travel diaries can be recorded in various forms, such as handwriting on paper (McKercher and Lau 2008), video recording (Pocock and McIntosh 2013), and online blog posts (Leung et al. 2012). Recently, GPS-enabled handheld devices, such as GPS loggers, have been employed by researchers to analyze activities of travelers because of the development and widespread use of GPS technology (Orellana et al. 2012; Birenboim et al. 2013). In these works, direct contact with participants is required to obtain their travel diaries. The collected data are, thus, limited in terms of the number of responses or the scale of the included geographical areas.
Several forms of location data have been utilized to passively capture the travel pattern of travelers. For instance, Sobolevsky et al. (2014, 2015) used bankcard transaction data, which are captured via bankcard terminals, to model the spatial and temporal mobility pattern of travelers. Further, Versichele et al. (2014) adopted Bluetooth tracking of data to determine the visiting patterns of travelers to attractions. Raun, Ahas, and Tiru (2016) measured the visitor flows for destination management using mobile tracking data. Although these data effectively capture the mobility patterns of travelers, they are not freely available for public use. Researchers have resorted to data that are available online, such as the geotagged travel photos (Vu et al. 2015) and geotagged tweets (Chua et al. 2016). The photos were captured by travelers’ GPS-enabled photo capturing devices, and then shared publicly on photo-sharing sites, such as Flickr (www.flickr.com) and Panoramio (www.panoramio.com). Geotagged tweets are short messages in a social media platform known as Twitter (https://twitter.com) that are generated by users through their mobile devices with built-in GPS function.
Tourism researchers have used geotagged travel photos to analyze travel behavior at destination. For instance, Kádár (2014) used geotagged photos to study tourist activities in several European cities. Onder, Koerbitz, and Hubmann-Haidvogel (2014) analyzed Flickr photos in Austria to determine their usefulness in indicating tourism demand. Vu et al. (2015) utilized geotagged photos to discover the travel behavior and preference of inbound tourists to Hong Kong. Recently, the capability of geotagged photos in modeling international travel behavior has received increasing attention. Barchiesi et al. (2015) used large-scale geotagged photos to quantify international travel. Yuan and Medel (2016) focused on the interactions among countries in tourism economics by modeling international travel behavior and intercountry travel flows. Social media strongly influence the tourism industry as people today are becoming heavily dependent on virtual communities in searching for and sharing travel information (Xiang and Gretzel 2010) given that social media are available at large volumes and have up-to-date content for most locations worldwide. Social media data are significant in studying the movement of tourists as well as in understanding their travel preferences (Chua et al. 2016).
Travel Pattern Analysis
In the context of tourism, travel patterns are referred to as the movements or travel flows from one tourism attraction to another. A popular approach to study travel patterns is to present the flows in the form of Origin-Destination matrix (Hwang and Fesenmaier 2003). The values in the matrix can be the actual count of the transitions (Leung et al. 2012), or the proportions of movements from one destination to another, which were computed by Markov-chain technique (Hwang and Fesenmaier 2003). The matrix was also used to represent the changes in the probability of visiting a destination given the changes of attraction at other destinations (Yang, Fik, and Zhang 2013). Vu et al. (2015) used Markov chain to examine the flows of tourists in the Hong Kong metropolitan area. The Origin-Destination matrix was also visualized using a network graph to facilitate the travel analysis for many tourism destinations (Leung et al. 2012; Zach and Gretzel 2012). In these works, the flows are usually represented for two locations at a time, the origin and the destination.
Travel sequences with more than two locations were considered in the work of Xia et al. (2010) for mining dominant movement patterns. The patterns were identified manually from a visitor survey of a small-scale tourism attraction with nine destinations within the attraction. The proposed approach is not practical for a large-scale study, especially international travel with many possible destinations. Orellana et al. (2012) used an automatic method named generalized sequential patterns to examine visitor movement in natural recreational areas. Their method can extract sequential patterns in a relative rather than absolute order. However, generalized sequential patterns were focused on identifying popular travel paths from sequential data rather than assessing the sequential association between visited destinations.
A set of techniques for processing sequential pattern discovery has been used in tourism literature, which includes time-series analysis, associate distance measure method, sequence alignment method, and high-frequency pattern methods (Shao and Gretzel 2010). Among them, sequence alignment is frequently used for determining the movement pattern of tourists in different destinations. They are unable to represent the sequential associations between events in sequential data.
Mining Pattern from Sequential Data
Discovering a temporal relationship from data is important because it enhances our understanding of the data and provides a basis for making predictions. In data mining, various techniques have been proposed to mine different types of sequential patterns, such as closed sequential patterns (Yan, Han, and Afshar 2003), maximal sequential patterns (Fournier-Viger, Wu, and Tseng 2013), compressing sequential patterns (Chang et al. 2006), and sequential generator patterns (Fournier-Viger et al. 2014a). Although these approaches can discover frequent sequences in the travel data set, they are insufficient to make meaningful predictions (Fournier-Viger et al. 2012). For instance, a travel event c may appear frequently after travel events a and b, but there are cases that events a and b are not followed by event c. Predicting that c will occur after
A sequential rule is represented in the form
Summary
Travel diary is an effective form to capture comprehensive information on the behavior of travelers (Ian, Shane, and Jillian 2011). The key component of the travel diary is the spatial-temporal information, which is usually captured using GPS enabling devices. Existing travel diary construction approaches are time consuming and with limited information. Recently, researchers have shifted their attention to user-generated data on social media sites considering its large volume and availability for public use. However, an issue with geotagged photo data is noise. For instance, many geotagged photos were taken in transit rather than at the destinations (Vu et al. 2015). It is also possible that many photos were taken in a tourist destination. Similar issues exist in other types of geotagged social media content available on popular platforms, such as Twitter, Facebook, and Instagram, given that travelers can post content on social media via their mobile devices while traveling. In the application of sequential travel behavior, especially for international travel, the sequences of visited destinations such as cities in the world are of interest, rather than the raw spatial and temporal information embedded in the social media content. Prior works have not presented an effective approach to transform the geotagged social media content into travel diaries for efficient analysis of travel sequential pattern (Kádár and Gede 2013; Onder, Koerbitz, and Hubmann-Haidvogel 2014; Vu et al. 2015; Garcia-Palomares, Gutierrez, and Minguez 2015).
In existing attempts for analyzing travel patterns, the flow is usually limited to two locations at a time (Leung et al. 2012; Zach and Gretzel 2012; Vu et al. 2015), which is inadequate to extract complex sequential patterns from travel. Other works used sequential pattern mining techniques but they focused on identifying popular travel paths (Xia et al. 2010; Orellana et al. 2012), rather than the sequential association between destinations. If DMOs know that travelers are likely to travel to a destination c after visiting destinations a and b, they can design travel packages that promote travelers to visit destinations a, b, and special offer for visiting c. However, prior approaches in the tourism literature have not been able to identify such sequential associations.
This article aims to address the aforementioned shortcomings through the following specific objectives:
present a processing framework for geotagged social media content to construct travel diaries that capture the international travels in the form of sequences;
introduce SRM into the analysis of travel diaries to identify complex sequential association between destinations; and
demonstrate the effect of the proposed method for travel behavior analysis by using a case study of Australian outbound travelers.
Methodology
This section presents our method for sequential travel behavior analysis that involves geotagged photos that are available from online databases such as Flickr. The main advantage of Flickr over other popular social media platforms is that photo databases are publicly available. The retrieval of all available photos is convenient at any given point in time, whereas it is not the case for Twitter, Facebook, or Instagram because either a quota limit or a fee applies. Moreover, Flickr is known for its reliable data source that can provide useful indicators for tourism demand (Barchiesi et al. 2015). Therefore, we use geotagged photos as a representative geotagged social media content to demonstrate our method. Our framework consists of three stages: (1) travel data extraction from geotagged photos, (2) travel diary construction, and (3) sequential rule mining.
Travel Data Extraction from Geotagged Photos
The geotagged photos can be retrieved from the Flickr server through its application programming interface (API). Full documentation is available at www.flickr.com/services/api. One challenge of data extraction is the identification of users whose photos should be analyzed. For example, we would like to retrieve photos posted by people living in Melbourne, but none of the API functions directly supports this operation. We propose to retrieve lists of users and their location of residence initially through specific Flickr groups using the Group Search function. Flickr allows users to create or actively associate with a group. For example, we search for groups whose names contain the keyword Melbourne. Some group members are possibly Melbourne local residents. This approach allows for a quick access to many users who likely belong to our group of interest.
Let us use
Travel Diary Construction
This stage converts the photo collections of users into sequences of visited destinations, which we call outbound travel diaries. The issue with the geotagged photo data is that the geographical information is in the form of raw GPS data (latitude and longitude). The data must be converted into a suitable format, presenting sequences of visited destinations. We propose to process the data by adopting Geocoding API service provided by Google Map, where the GPS data of each photo are mapped to its corresponding location or region. Documentation of Geocoding API is available at http://developers.google.com/maps. The labels of the mapped locations can be at multiple levels such as city or country to represent tourism destinations. It should be noted that the photos collected for each user could be taken during multiple outbound trips. The taken time between the photos is examined to determine their corresponding outbound trips.
The next step is to convert the travel diaries into sequences of destinations. Let
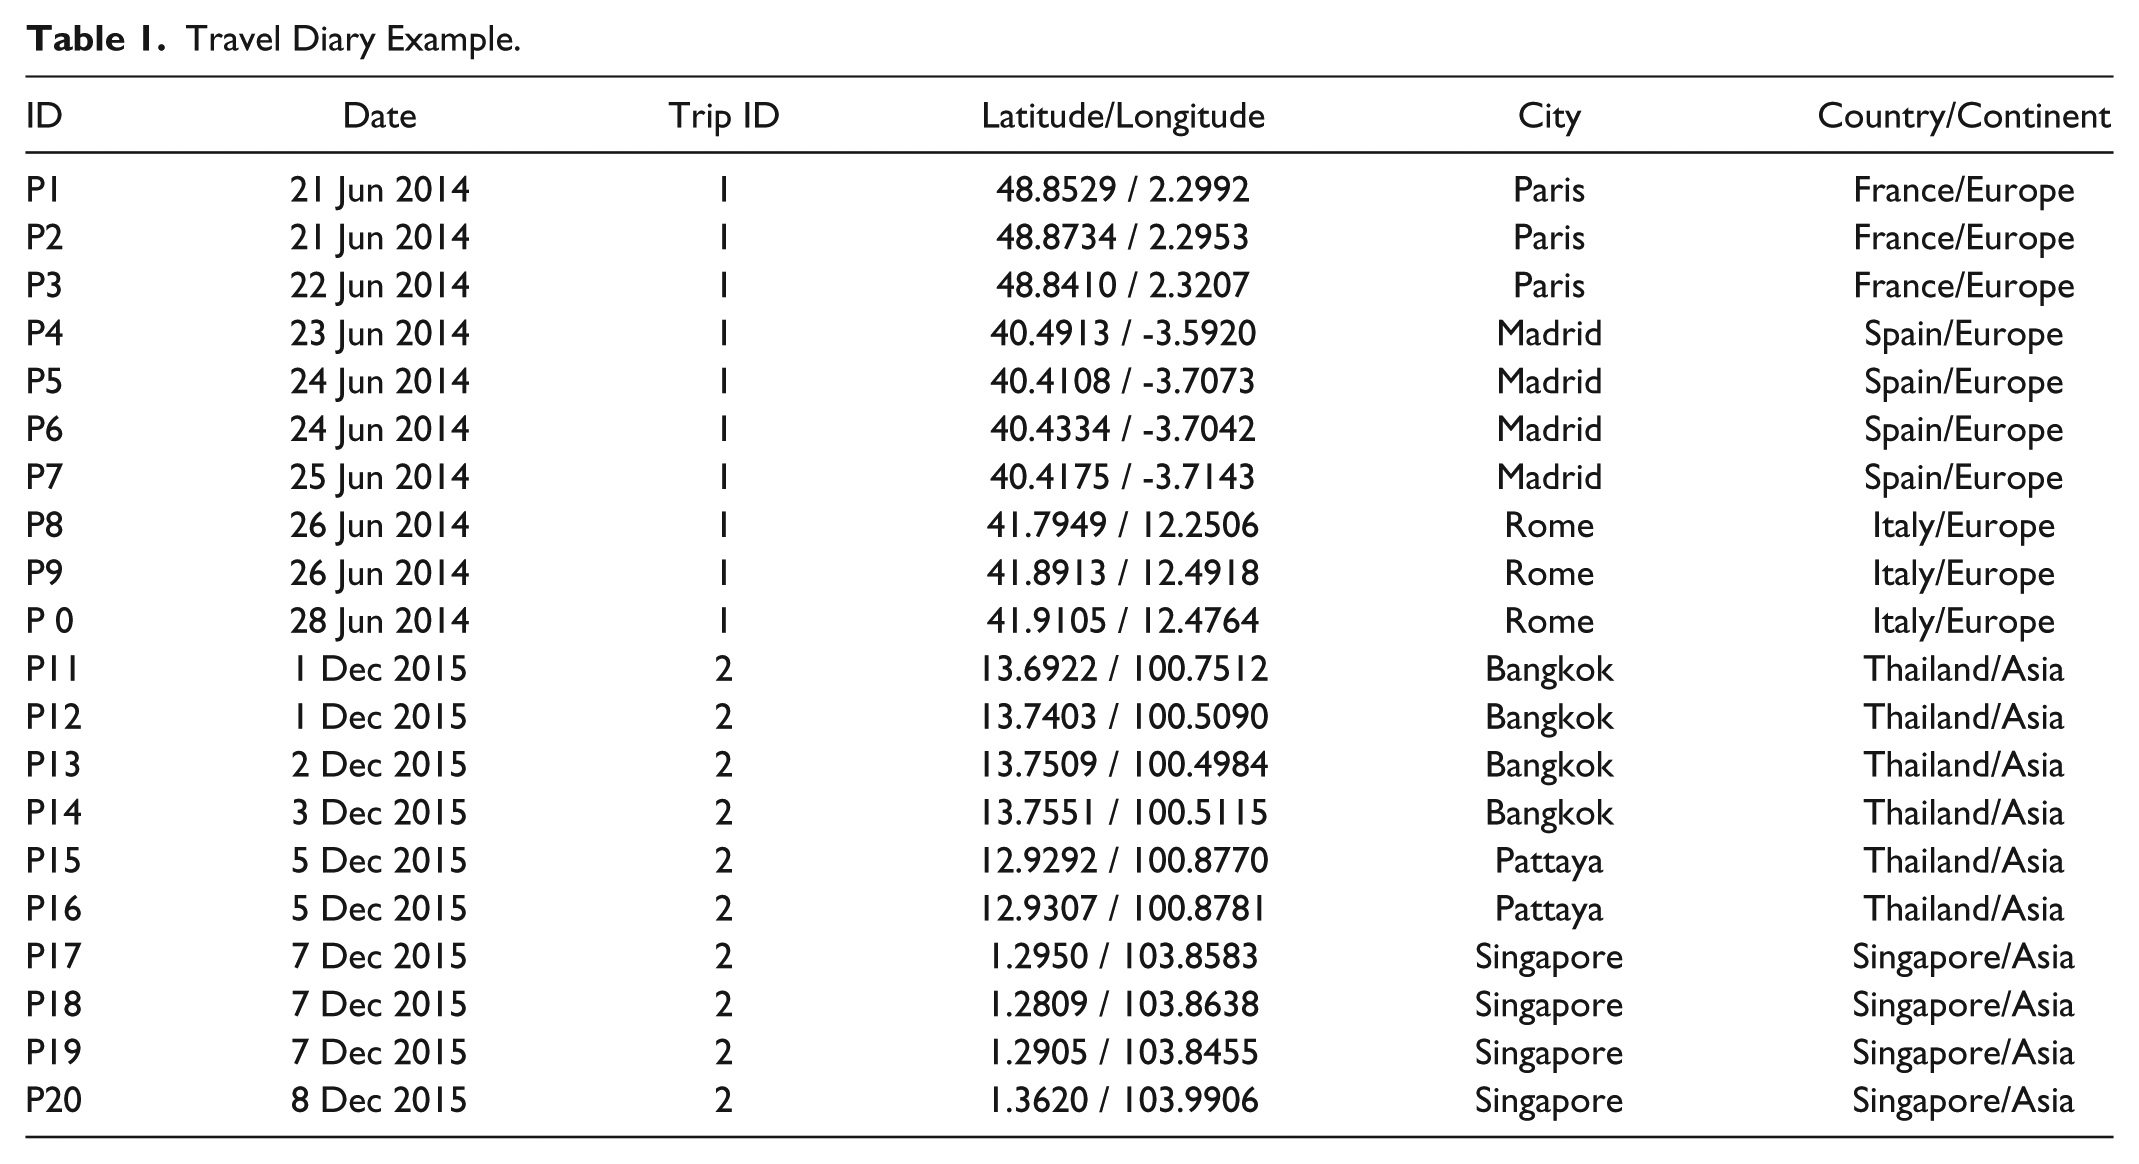
Example 1: Table 1 shows a sample travel diaries of a traveler during two outbound trips. One trip is to Europe and the other is to Asia as indicated by the Trip ID. The GPS information was mapped to its corresponding city and country using Geocoding API. The traveler may take many photos in each location. We only show the information of several photos here for demonstration purpose, but it still preserves the sequential information of visited destinations. Table 2 shows the travel sequences generated from the travel diary at both country and city levels. It is important to note that the sequence for the trip to Asia shows two destinations at the country level, Thailand and Singapore. The sequence at the city level, containing three items, which provides greater details on the visited cities. As such, detailed insights can be obtained. Travel sequence can also be constructed at a more detailed level such as district or street based on Geocoding API. In this article, we only consider the city and country levels for analyzing international travel patterns.
Travel Diary Example.
Travel Sequences.

Sequential Rule Mining
Given a sequential data set
Sequential rule r:
A rule r:
Example 2: The rule
Sequential rule is defined based on two metrics: support, denoted as


Traditionally, the process of mining sequential rules starts by finding all frequent sequences in
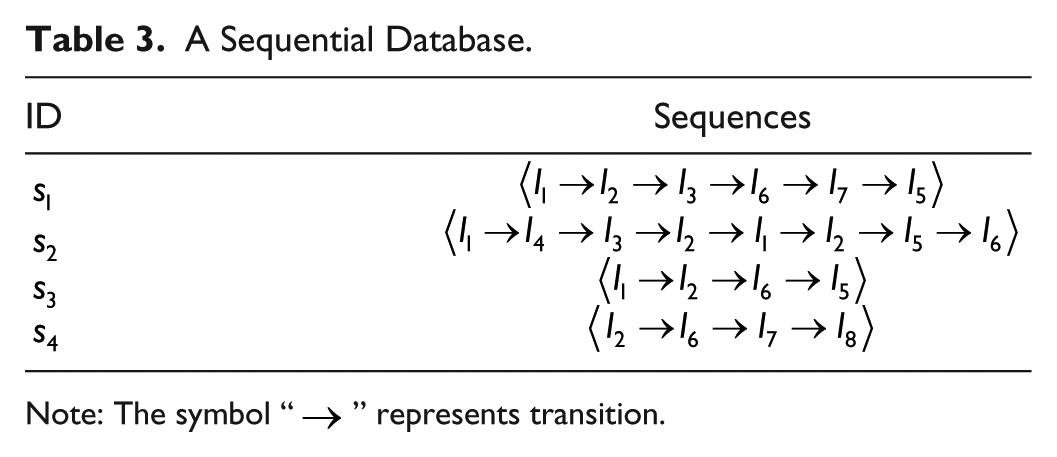
Example 3: Suppose we have a sequential database as shown in Table 3. SRM is applied to this data set, with
A Sequential Database.
Note: The symbol “
Sequential Rules.

Note: The symbol “
In practice, setting
A Case Study
This section presents a case study of travel diary analysis for Australian outbound tourism. The data collection process is initially presented, which is followed by the construction of travel diary. SRM is then applied to identify sequentially associated destinations. The capability of the travel diary in capturing travel behavior is further demonstrated through an analysis of sequential patterns. A discussion of the results is provided with practical implications.
Data Collection
The data set used in this study was collected from Flickr through the method described the previous section. A list of user IDs was first retrieved from Flickr’s group together with their locations of residence. Users of interests were identified, and their entire photo collections were retrieved subsequently. Our study focused on users residing in Sydney, Melbourne, Brisbane, Perth, and Adelaide, the top five most populated cities in Australia (ABS 2015). A bounding box covering the entire geographical area of Australia was specified, with coordinates
Geotagged Photo Data Collection.

Sydney has the highest number, with 1,435 users. Melbourne places second with more than 1,000 users. Brisbane and Perth have fewer users. Adelaide has the least number, with 213 users. This order is similar to the popularity ranking for these cities (ABS 2015); Sydney is the most populated city, and Adelaide places fifth. The number of photos taken per user is similar across the groups. The average time span for photo collections of Melbourne travelers is the highest, with an average of around three years, while the photo collections of the Sydney travel group has the least time span. The time span of the photo collection is not a major factor in our study, because our analysis focuses on the sequential travel pattern for each outbound trip rather than the travel history of travelers. In addition, Australia is located far away from countries in other continents; the travel patterns from different Australian cities to other continents would be relatively similar given the limited number of air routes. Therefore, we treat users from different cities as the same group to represent Australian travelers in the subsequent analysis.
We acknowledge the variety of travel styles and preferences among the travelers, such as for businesses, holiday, or family visits. This study, however, does not consider such differences because of the scope of coverage. Instead, this study presents an approach that focuses on extracting patterns reflecting sequential associations among visited destinations, embedded in the travel photo sequences.
Travel Diary Construction
The geographical information of photos was mapped to their corresponding cities and countries using Geocoding API, as described earlier. We made an assumption that photos taken more than 30 days apart were likely in different outbound trips. The photo collection of each user was sorted in a temporal order and separated into different trips. In total, 17,188 travel diaries were constructed from the collected data set. The travel diaries were then converted into sequences of visited destinations. The number of travel diaries in this study was much more than the travel diary data set used in prior studies (Xia et al. 2010; Orellana et al. 2012; Vu et al. 2015).
Among the travel diaries, we noticed that 12,819 travel diaries corresponded to a single country and 4,369 travel diaries involve two or more countries. Table 6 shows the proportions of visited continents, single-country trips versus trips to two or more countries. Please note that destinations in Oceania refer to countries other than Australia, as the collected data are for the outbound trips of Australian residents. We can see that the majority of trips within a single country was in Asia, with 33.72%. Travelers were more likely to travel to Europe in trips spanning two or more countries, with 43.16%, significantly higher than trips to a single country. Z-tests with p value ≤0.05 verified statistical significance. Little difference was noticed for trips to Africa, America, and Asia. Travelers were less likely to travel to two different countries in Oceania.
Destinations of Outbound Trips.

Italic type indicates significance (p ≤ 0.05).
We further examine the capability of the geotagged photo in capturing travel behavior of Australian travelers via Table 7, which shows the top 20 visited as identified from the collected data set. The top countries in our list are among the top 10 destinations according to a national outbound survey by Tourism Research Australia (TRA 2014a). The most popular countries in both lists are United States, United Kingdom, and New Zealand. In particular, travelers are likely to visit the United States and the United Kingdom multiple times as shown by the high values for average numbers of trip per travelers. These destinations are in fact the home countries of many Australian residents (TRA 2014a), where they probably visited frequently. We also noticed that our list does not include Fiji, a popular destination of Australian travelers (TRA 2014a). Fiji ranked 22nd in our data set; as a result, Fiji was not listed in Table 7. Nevertheless, the geotagged photos can still capture the general travel behavior of the travelers. Table 7 presents and examines the popular destinations; we included all of the destinations to construct the travel sequences in the subsequent analysis.
Popularly Visited Countries.

Among the top 10 destinations according to a national outbound survey by Tourism Research Australia (TRA 2014a).
Travel Sequence Analysis
Sequential rules of visited countries
The data sets of the constructed travel sequence at country level were input into the Top-K SRM algorithm (see earlier), whose implementation is available as an open-source data mining library (Fournier-Viger et al. 2014b). Only those 4,369 travel diaries involving two countries were considered in this analysis, as there is no sequence in the travel diaries to a single country. The minimum confidence was set to
Australian travelers have a high chance of traveling to the United States (USA) if they plan to visit Canada (CDN) or Mexico (MEX), as indicated by rules
For destinations in Asia, a relatively strong sequential association was found between Lao (LAO) and Thailand (THA) as in rule
Quite a number of rules were found for destinations in Europe. Namely, if travelers visited Czech Republic (CZE), France (FRA), and/or Austria (AUT), they have a high possibility of visiting Germany (DEU) as well, as indicated by rules
Sequential Rules by Country.

Table 8 shows that most countries in the identified sequential rules are the most visited destinations by travelers considering that Top-K SRM returns sequential rules with high supports also indicate the frequent items. In the next section, we examined the sequential pattern between cities for more insights into the travel patterns.
Sequential rules of visited cities
This section focuses on demonstrating the capability of travel diaries in capturing the travel patterns at the micro level between cities. We examine the multi-city trips to destinations in America, Asia and Europe in this analysis. Only those travel sequences with two or more cities in each continent are input into the SRM algorithm. We notice that some rules at the city level are redundant to rules at country level as reported in Table 8. For example, the rule
Sequential Rules by City.
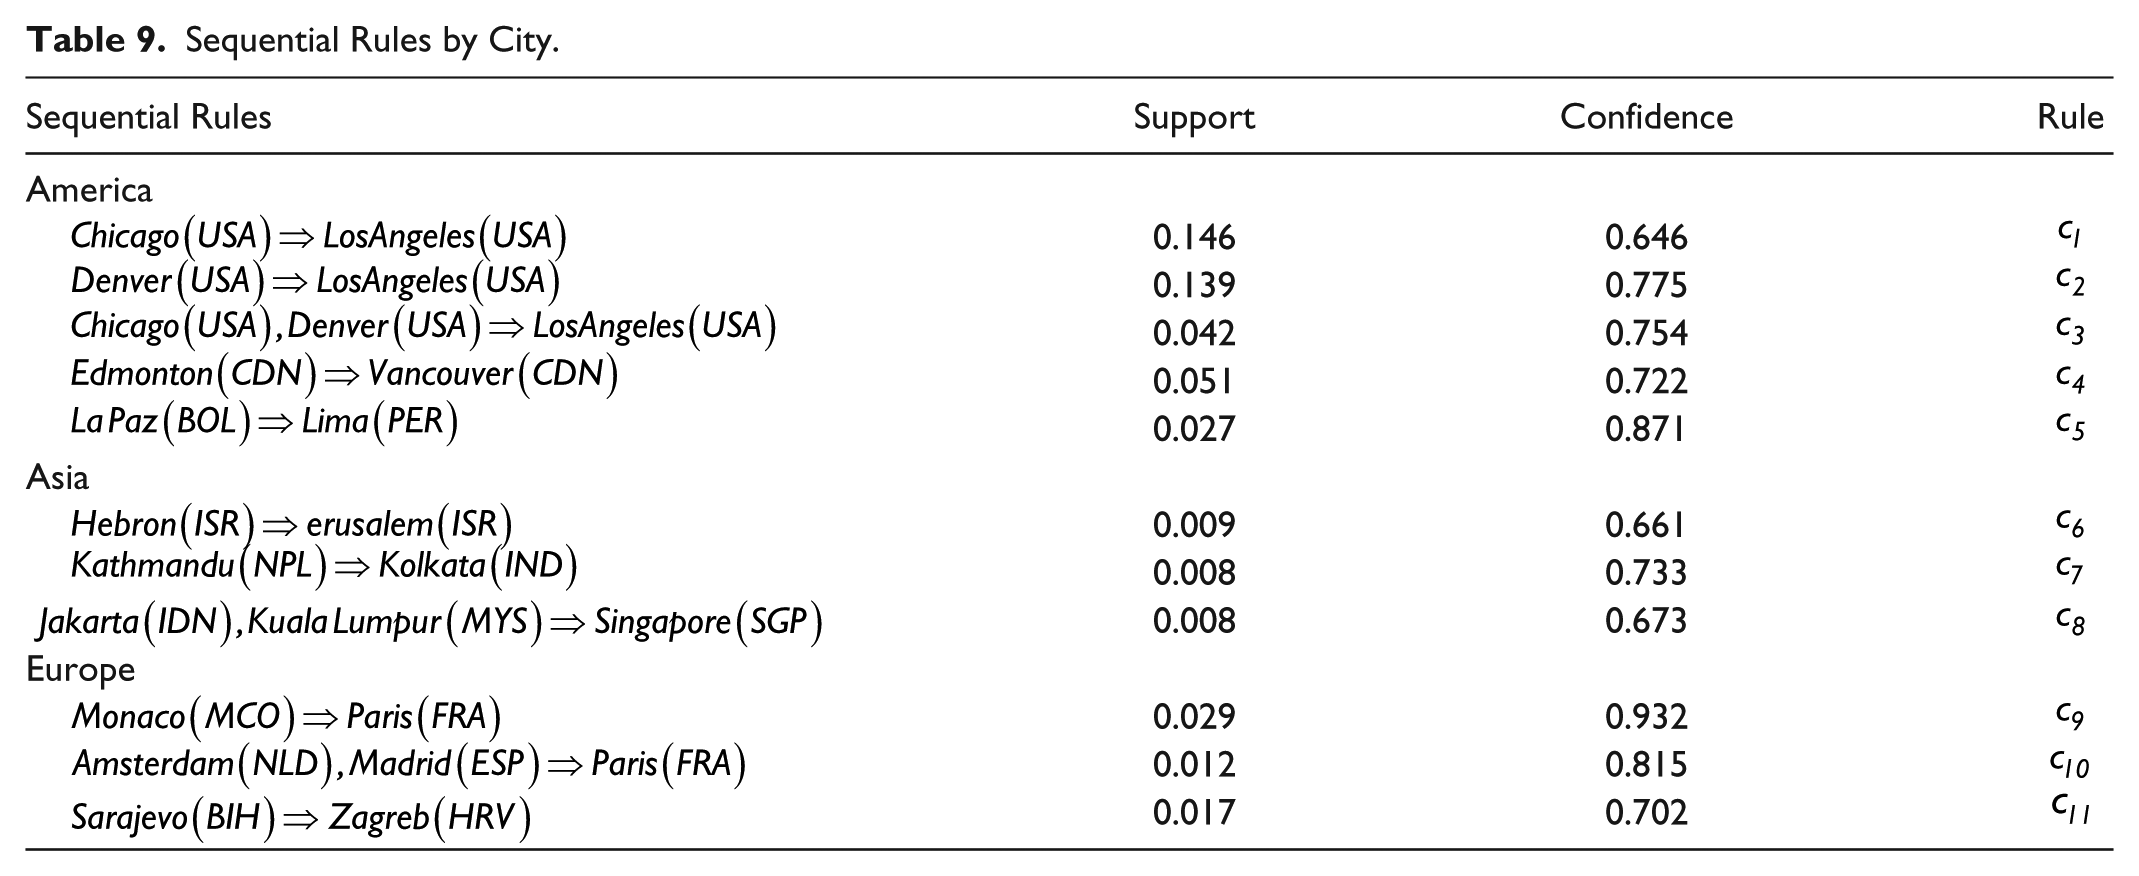
Some sequential associations are found between cities in American countries. For instance, travelers are likely to visit Los Angeles if they visited Chicago and/or Denver (rules
Although quite a number of rules are found for European cities, many of them provide redundant information. The rules
Aside from the well-known tourism destinations listed in Table 9, DMOs would be interested in the travel patterns of travelers between second- and third-tier destinations to gain more insight. As a demonstration, we examine the sequential rules between cities in the United Kingdom, except for London. Table 10 shows the top 10 sequential rules with 0.6 or more confidence.
Sequential Rules by City in the United Kingdom.

Rules
The SRM aims to assess how certain it is for a destination to be visited after other destinations based on the confidence. For example, people may travel frequently between Los Angeles, Chicago, and Denver. If DMOs are certain that Los Angeles will be the next destination after Chicago using SRM, more focused travel packages can be developed to promote those who visit Chicago to travel to Los Angeles. Nevertheless, travel diaries constructed from the geotagged photos can be used to identify popular sequential patterns to support for the construction of travel itinerary. We demonstrate such capability in the next section.
Travel itinerary analysis
This section demonstrates the capability of travel diaries in capturing popular travel pattern through an analysis of sequential travel pattern among Asian cities. Only travel sequences with two cities or more in Asia are considered. We applied Top-k sequential pattern mining algorithm to extract the frequent patterns (Fournier-Viger and Tseng 2011). Top 50 patterns with high support are returned, and patterns with similar items are removed as they provide redundant information. We are left with 24 frequent patterns as shown in Table 11.
Sequential Patterns for Destinations in Asia.

We can see that the identified patterns contain major tourism cities in Asia such as Bangkok, Ho Chi Minh City, Hong Kong, Kuala Lumpur, and Singapore. For instance, sequential patterns
As a result of the long distance between Australia and other continents, Australian travelers often travel to Europe or America via Asian cities because of more options of airlines. It is beneficial for DMOs to identify the hub destinations in Asia for better development of the travel itinerary for long-haul travel. We examine the travel diaries and identify any transition from a city in Asia to the next city in Europe and America. The transition frequency is visualized using a heat map (Krentzman et al. 2011), as shown in Figure 1. Asian cities are on the vertical axis. European and America cities are listed on the horizontal axis; the prefix of the city names indicates the corresponding continent. Because of the large number of cities, only cities visited by at least 1% of the travelers are included in the figure. A darker cell indicates high frequency, and a lighter cell indicates otherwise.

Transition from Asia to Europe and America.
We can see that Dubai, Hong Kong, and Singapore are the most popular destinations for Australians to travel to London, as indicated by the dark cell in the figure. This is consistent with the fact that those cities are major hub destinations, with large airports and major airlines. Hong Kong is also a popular destination for traveling to Paris. Travelers are likely to travel to Paris via Hong Kong. Shanghai is a popular hub destination for traveling to Berlin. Few direct transitions from Asia to America are shown in Figure 1, which is consistent with the fact that direct routes from Australia to America are more convenient. Tokyo to Los Angeles is a commonly used path from Asia to America by Australian travelers. We further examined the travel diaries and found that around 70% of Australian travelers spent more than one day in Tokyo before traveling to Los Angeles. This result suggests that Tokyo is usually visited for other purposes rather than simply for connecting flights.
Discussion
The analysis using SRM has identified some strong sequential associations between visited destinations of Australian outbound travelers. DMOs can advertise specific travel packages that promote travelers to visit multiple destinations in their trips. For instance, special offers to visit the United Kingdom can be created if the travelers also visit Germany, Italy, and Spain (rule
The analysis in the previous section shows that the travel diaries constructed from geotagged photos can effectively capture the international travel behavior for the case of Australia. The travel diaries have captured popular travel sequences between Asian cities, as shown Table 11. Bangkok, Ho Chi Minh City, and Kuala Lumpur are major base destinations to travel to other places in Southeast Asia, while travelers usually travel from Hong Kong to cities in Northern Asia such as Shanghai and Tokyo. It is interesting to see that Singapore is frequently visited after other cities despite being a major destination in Asia. DMOs can then advertise suitable travel itineraries for Australian travelers following such frequent patterns. The heat map of the transition in Figure 1 confirmed that the travel diaries could capture the popular travel paths from Asia to Europe via some major hub destinations. Researchers can adopt the proposed travel diary construction approach in further analysis of travel behavior.
It should be noted that the sequential rules are different from traditional approaches of sequential pattern analysis as SRM aims to identify strong sequential association between the visited destinations based on the confidence. The approaches used in prior works (Xia et al. 2010; Orellana et al. 2012) may be able to identify some frequent sequential patterns as shown above, but they are incapable of extracting the sequential association as in case of SRM shown in the present study.
This study is not without limitations. Although some sequential rules have been identified that reflect certain travel patterns of Australians, other factors influencing the travel decision was not considered in this study. These findings should be considered as a demonstration of how sequential patterns can be extracted from travel diaries. The travel pattern should be considered together with other factors, such as user demographic profile or travel motivation, in practical applications. Besides, gaps may exist between the findings and the actual travel behaviors. A combination of multiple data sources of geotagged photos is suggested for a specific practical application. Demographic factors were not considered to explain specific travel patterns. Besides, travel patterns of first-time and repeat visitors will likely differ, as examined in prior studies (Hwang, Gretzel, and Fesenmaier 2002; Kempermann, Joh, and Timmermans 2004). The travel diaries constructed from the geotagged photos can capture the travel sequences, but it is uncertain if the first trip in the travel diaries is the actual first trip of the travelers, and the first trip might be prior to the data collection period. Therefore, we were unable to investigate the difference between the first and the repeated trips. The analysis of travel patterns was based on the observed behavior of travelers through the geotagged photo data. Given the limited scope of this study, we were unable to investigate the relationship between the observed travel patterns and the availability of airlines, which had shown significant influence on travel connections (Hwang, Gretzel, and Fesenmaier 2006). Apart from the travel patterns, the actual photos taken can provide comprehensive information about the activities of travelers in a destination, which has not been considered in this study.
Conclusions
Insight into sequential travel patterns of travelers is important to identify preferred destinations and future travel intentions. This understanding is crucial for tourism managers and industry practitioners to design suitable travel packages and make appropriate offers. Unfortunately, such knowledge has not been fully obtained given the difficulty of capturing the complex travel behavior. Travel events usually occur over a long period, especially in the case of international travel, which makes collecting sequential travel information difficult. Traditional approaches to travel pattern analysis were unable to capture sequential association between visited destinations. To address these shortcomings, this article presented an approach to travel diaries construction from geotagged photos and introduced the SRM technique to extract the sequential association of destinations from travel sequences.
The effectiveness of the proposed approach was demonstrated in a case study of Australian outbound tourism, using a large data set of more than 890,000 photos from 3,623 outbound travelers. Travel diaries are constructed from geotagged photos, which contain comprehensive past travel information of travelers. The case study confirmed that the travel diaries constructed from geotagged photos are effective in capturing travel patterns. The analysis of travel diaries reveals interesting sequential association that can assist DMOs in developing better travel packages. DMOs can promote proper destinations to prospective travelers to achieve a high purchasing rate. The introduced framework with SRM technique has the potential to benefit tourism researchers worldwide from improving their understanding of travel behaviors.
One potential extension of this work is to incorporate other information reflecting the context of the travel into the analysis, in addition to the spatial and temporal information. For example, the textual meta-data and the visual content of the actual photos taken at destinations can be examined for additional insights into the activities of tourists. Other influencing factors, such as travel styles, preferences, and travel purposes, can be incorporated for more detailed insight into travelers’ behavior. Photo-taking behavior is important in understanding the geotagged photo data and thus should be the focus of future research. The construction of the travel diary presented can be applied to other geotagged social media content such as those on Twitter, Facebook, and Instagram, which we shall investigate in future studies. SRM is a general-purpose approach for mining sequential associations. Aside from social media, SRM is beneficial to investigating its applicability in analyzing travel diaries constructed from other data sources, such as GPS loggers, bank transactions, and mobile tracking data. Airline availability is one of the influencing factors of travel connections. Indeed, future studies can incorporate airline network data into the analysis of sequential association for more detailed insight.
Footnotes
Declaration of Conflicting Interests
The author(s) declared no potential conflicts of interest with respect to the research, authorship, and/or publication of this article.
Funding
The author(s) disclosed receipt of the following financial support for the research, authorship, and/or publication of this article: The work described in this article was supported by a grant funded by the Research Grants Council of the Hong Kong Special Administrative Region, China (GRF Project Number: 15503814). We also acknowledge the funding support provided by the Hong Kong Polytechnic University.