




Abstract
Hyperlinks critically impact the online visibility of a tourism destination and the effectiveness of information flow between tourism organizations and enterprises on the Internet. This study investigates the hyperlink network of the tourism industry in Western Australia. Network analysis is applied to explore, analyze, and visualize this network of 1,515 tourism websites. Several dimensions of network structure are examined, and the results indicate that the hyperlink network of this destination has a very sparse, centralized and hierarchical structure, and that the websites tend to form communities based on their geographical locations. Public tourism organizations and information services play a central and significant role in the destination network. The key implication for organizations and the industry as a whole is that education about the instrumental importance of hyperlinks could increase interconnectivity and therefore industry performance.
Keywords
Introduction
Tourism, like many other industries, has been profoundly impacted by the Internet (Xiang, Woeber, and Fesenmaier 2008; Baggio and Del Chiappa 2013). Tourism is an information-intensive industry (Buhalis 1996; Pan and Fesenmaier 2006), within which travelers’ decisions are strongly mediated by the information they acquire (Miguéns and Corfu 2008). Tourists mainly use the Internet to find information about destinations and to plan their travel (Kaplanidou and Vogt 2006; Xiang, Woeber, and Fesenmaier 2008; Pan and Fesenmaier 2006). On the supply side, destinations try to use the web environment to provide information, thereby attracting more tourists. However, being seen and chosen by tourists is not an easy task, as the competition is intense and there are a vast array of websites offering information and promoting different destinations. Therefore, it is essential to a destination and its products to be visible and easily findable on the Internet.
Visibility leads to higher web traffic (Wolk and Theysohn 2007; Ennew et al. 2005), which in return can increase business performance (Vaughan 2004a, 2004b; Vaughan and Yang 2013). Users generally find a website through search engines or by following links from other websites (Wang and Vaughan 2014). The position of a website on the resulting display of search engines is crucial in its visibility. In addition to the internal factors such as the content, structure, and design of a website, external issues such as the number and importance of hyperlinks on a website are also very important in the ranking of a website by search engines. Web search engines use link analysis techniques in their ranking algorithms (Battelle 2005; Romero-Frías 2009; Brain and Page 1998). A hyperlink is an embedded link in a webpage that points to another webpage. Hyperlinks, therefore, form the hidden but basic structure of the web (Romero-Frías 2009; Park 2003), and according to Yi and Jin (2008, 325), they “are an essential resource for organizing, retrieving and accessing digital resources on the web.”
In this research, we study the hyperlinks between tourism organizations and businesses in Western Australia as a tourism destination. A tourism destination is an amalgam of different tourism products, services, and stakeholders providing an integrated experience to tourists (Buhalis 2000; Murphy, Pritchard, and Smith 2000). On the Internet, a tourism destination is a collection of websites representing the associated organizations and businesses. It is similar to what Miguéns and Corfu (2008) have termed as an “e-destination.”
As previously mentioned, the visibility of tourism websites is critical. This is especially true for the tourism industry as it abounds with small and medium enterprises that often lack understanding of the importance and potential benefits of visibility on the Internet (Lin, Huang, and Stockdale 2011). Moreover, from the tourism destination level perspective, hyperlinks are not only crucial for the visibility of individual enterprises but also for the visibility of the destination as a whole (Baggio and Corigliano 2009).
In addition to the significance of hyperlinks for the visibility of a destination, hyperlinks can also represent other phenomena and meanings. Previous studies have indicated that they can convey meaning such as authority (Rogers 2002, 2010; Kleinberg 1999), trust (Davenport and Cronin 2000; Palmer, Bailey, and Faraj 2000), credibility (Park, Barnett, and Nam 2002; Borah 2014), patterns of alliance building (Rogers and Marres 2000), and extension of offline collective action behavior (Pilny and Shumate 2012).
In a tourism destination, hyperlinks can be considered as channels of information flow between the websites. In fact, leading users to other web pages is leading them to additional sources of information. Hyperlinks therefore connect information sources together, creating a complex network. The characteristics of this unique network are instrumental in determining how effectively information flows within the tourism destination. Hyperlinks can also reflect the offline relationships between enterprises (Pilny and Shumate 2012; Diani 2000; Yang 2013). Therefore, studying the hyperlink network can provide an understanding of the overall relationships and collaborations between the organizations in the destination.
To sum up, the importance of studying hyperlinks in this article is based on three premises: hyperlinks are crucial to the visibility of tourism businesses and the whole destination; hyperlinks comprise the information flow structure of the destination on the web; also, hyperlinks can represent the actual offline collaborations of the destination. Thus, if a destination functions effectively on the Internet, it will be more visible, have more effective information flow between its components, and increase industry viability and growth.
Western Australia (WA) is the selected destination for this study. Tourism in Western Australia is a significant industry and employment sector. There were 10.3 million overnight visitors to WA who spent $9.6 billion in the year ending September 2016 (Tourism WA 2016). Tourism also generates more than 94,000 jobs in WA (Prendiville 2015). Tourism has been emphasized as one of the main sectors for economic development of the state in the State Planning Strategy for 2050 (Department of Planning 2014), and the state aims to double the value of the tourism industry by 2020 (Tourism WA 2012). However, because WA is vast and geographically isolated, especially from the main tourism destinations in Australia, it needs to be highly competitive if it is to compensate for the negative effects of long distances. Efficient visibility on the Internet is thus a critically important consideration for WA tourism competitiveness.
Having discussed the importance of hyperlinks in a tourism destination, the main aim of this research is to present a comprehensive understanding of tourism industry website connectivity in WA. More specifically, the research questions driving this study are as follows:
- What are the structural properties of the Western Australian tourism industry hyperlink network?
- What structural patterns does this network present?
We begin the rest of the paper with a literature review on hyperlink network analysis studies, as well as specific tourism applications. We then describe the data collection and methodology followed by the results and analysis of the study. We close with a discussion section, linking the evidence of this study to existing academic concepts and studies.
Hyperlink Network Analysis
The term hyperlink was first coined by Nelson (1965) and was later used in the creation of the web by Tim Berners-Lee in the early 1990s (Yi and Jin 2008). The first study on hyperlink networks was conducted by Albert, Jeong, and Barabási (1999). Since then, hyperlinks have been studied across multiple academic and practitioner areas, including political science (Park, Thelwall, and Kluver 2005; Ackland and Gibson 2013; Ackland and O’Neil 2011; Park and Thelwall 2008; Kim, Barnett, and Park 2010; Romero-Frías and Vaughan 2010; Park 2012); the academic domain (Thelwall 2001; Vaughan and Thelwall 2005; Barjak and Thelwall 2008; Vaughan and Hysen 2002; Smith 2002; Aguillo et al. 2006; Vaughan and Thelwall 2003); environmental activism (Sullivan and Xie 2009); social movements (Garrido and Halavais 2003; Earl and Kimport 2011); international information flows (Park and Thelwall 2003); climate change (Elgin 2015; Rogers and Marres 2000); nanotechnology (Hyun Kim 2012; Ackland et al. 2010); and collective action (Pilny and Shumate 2012; O’Neil and Ackland 2006). Some researchers have studied the relationships among patterns of hyperlinks between websites and their geographical locations (Park and Thelwall 2003; Schulman 2008; Halavais 2000; Brunn and Dodge 2001); others have examined the relationships between hyperlink and business performance (Vaughan 2004a, 2004b; Vaughan and Romero-Frías 2010; Romero-Frías and Vaughan 2010; Vaughan and Yang 2013; Vaughan, Kipp, and Gao 2007).
Generally, two main approaches can be identified in hyperlink studies. The first is network science that aims to identify and explain the underlying architecture of the hyperlink networks through developing and using complex statistical models (Ackland 2009). This tradition of research, mainly developed by physicists and mathematicians, focuses on the structure and topology of the Web (Fragoso 2011) and is “generally not concerned with attributing theoretical or behavioral meaning to hyperlinks” (Ackland 2009, 484). These researchers have identified some properties of the web, such as scale-free, small-world, and disassortative mixing, and these properties will be discussed in the results section of this paper.
It is the tradition of social science, through using sets of methods identified as social network analysis that enriches the former purely structural analysis, by adding an interpretation layer. From this perspective, hyperlinks are not created randomly, but embody a meaning (Jackson 1997; De Maeyer 2013; Rogers and Marres 2000). “From this perspective, an actor is a website belonging to a person, private company, public organization, city, or nation-state. These nodes are linked by their hyperlinks” (Park 2003, 53). Wellman (2001) argued that computer networks are social networks and computers are social beings. “Hyperlinks are highly loaded with symbols and social power” (Schulman 2008, 737). They have information side-effects and can act as indicators of other phenomena with certain sociological meanings (De Maeyer 2013). According to Ackland et al. (2010), hyperlinks can perform five functions: information provision, network building or strengthening, identity/image building or branding, audience sharing, and message amplification or force multiplication. Some authors view hyperlinks as communication networks; according to Park (2003, 51), a hyperlink network is “an extension of traditional communication networks in that it focuses on the structure of a social system based on the shared hyperlinks among websites.”
The second approach to the study of hyperlinks is webmetrics (also called webometrics and cybermetrics). This is a subfield of library and information science (Ackland 2009); “originally developed for measuring scholarly or scientific activity using web data” (Lusher and Ackland 2011, 1). It was defined by Björneborn and Ingwersen (2004) as, “the study of web-based phenomena using quantitative techniques and drawing upon informetric methods.” Thelwall (2009, 6), with the aim of freeing webmetrics from informatics and therefore widening audience, redefined it as “the study of web-based content with primarily quantitative methods for social science research goals using techniques that are not specific to one field of study.” Webmetrics researchers usually use link counts and content analysis (Yi and Jin 2008).
The approach taken in this study more closely mirrors the network science approach, and the analyses and terms used are more congruent with those used in network science studies. To gain a greater understanding of the implications of the analysis, the network science approach is supported by certain outcomes adhering to the social science field. This approach was chosen because the units of study are organizations and businesses whose hyperlinks can have interpretations beyond their technical meanings.
Despite the large number of studies on general WWW networks, very few have been completed on the hyperlink networks in tourism. Ying, Norman, and Zhou (2014) explored and analyzed the structural properties of the hyperlink network of tourism stakeholders and their behaviors on the web in Charleston, South Carolina. They also validated the use of hyperlink data as a complementary source for research on tourism networks. However, in addition to the scale of the study, Ying, Norman, and Zhou’s (2014) research is different from the present study, primarily in terms of the approaches taken. The approach used by Ying, Norman, and Zhou (2014) was webometrics, which differentiates two studies in the data collection method, type, variety, and depth of the analyses as well as interpretations of the results.
Among other tourism research, Miguéns and Corfu (2008) have examined the connectivity of tourism attractions on the web using network analysis. In another study, Li, Yang, and Pan (2015) used network analysis to investigate the navigation paths of Chinese trip planners on the web. As part of a larger piece of research, Baggio, Corigliano, and Tallinucci (2007) and Baggio (2007) examined the structural and topological properties of an island destination (Elba). Piazzi et al. (2011) applied network analysis methods to study and compare the networks of two destinations in web space. Baggio and Del Chiappa (2013) analyzed and compared the virtual and physical networks of two destinations in Italy, indicating that the virtual and physical worlds are tightly related and both “need to be addressed when assessing interorganizational relationships” (14). Thus, prior research in this domain validates the development of further tourism hyperlink investigations. This study therefore brings a valid and unique analytical perspective to tourism research in the Australian context.
Methods
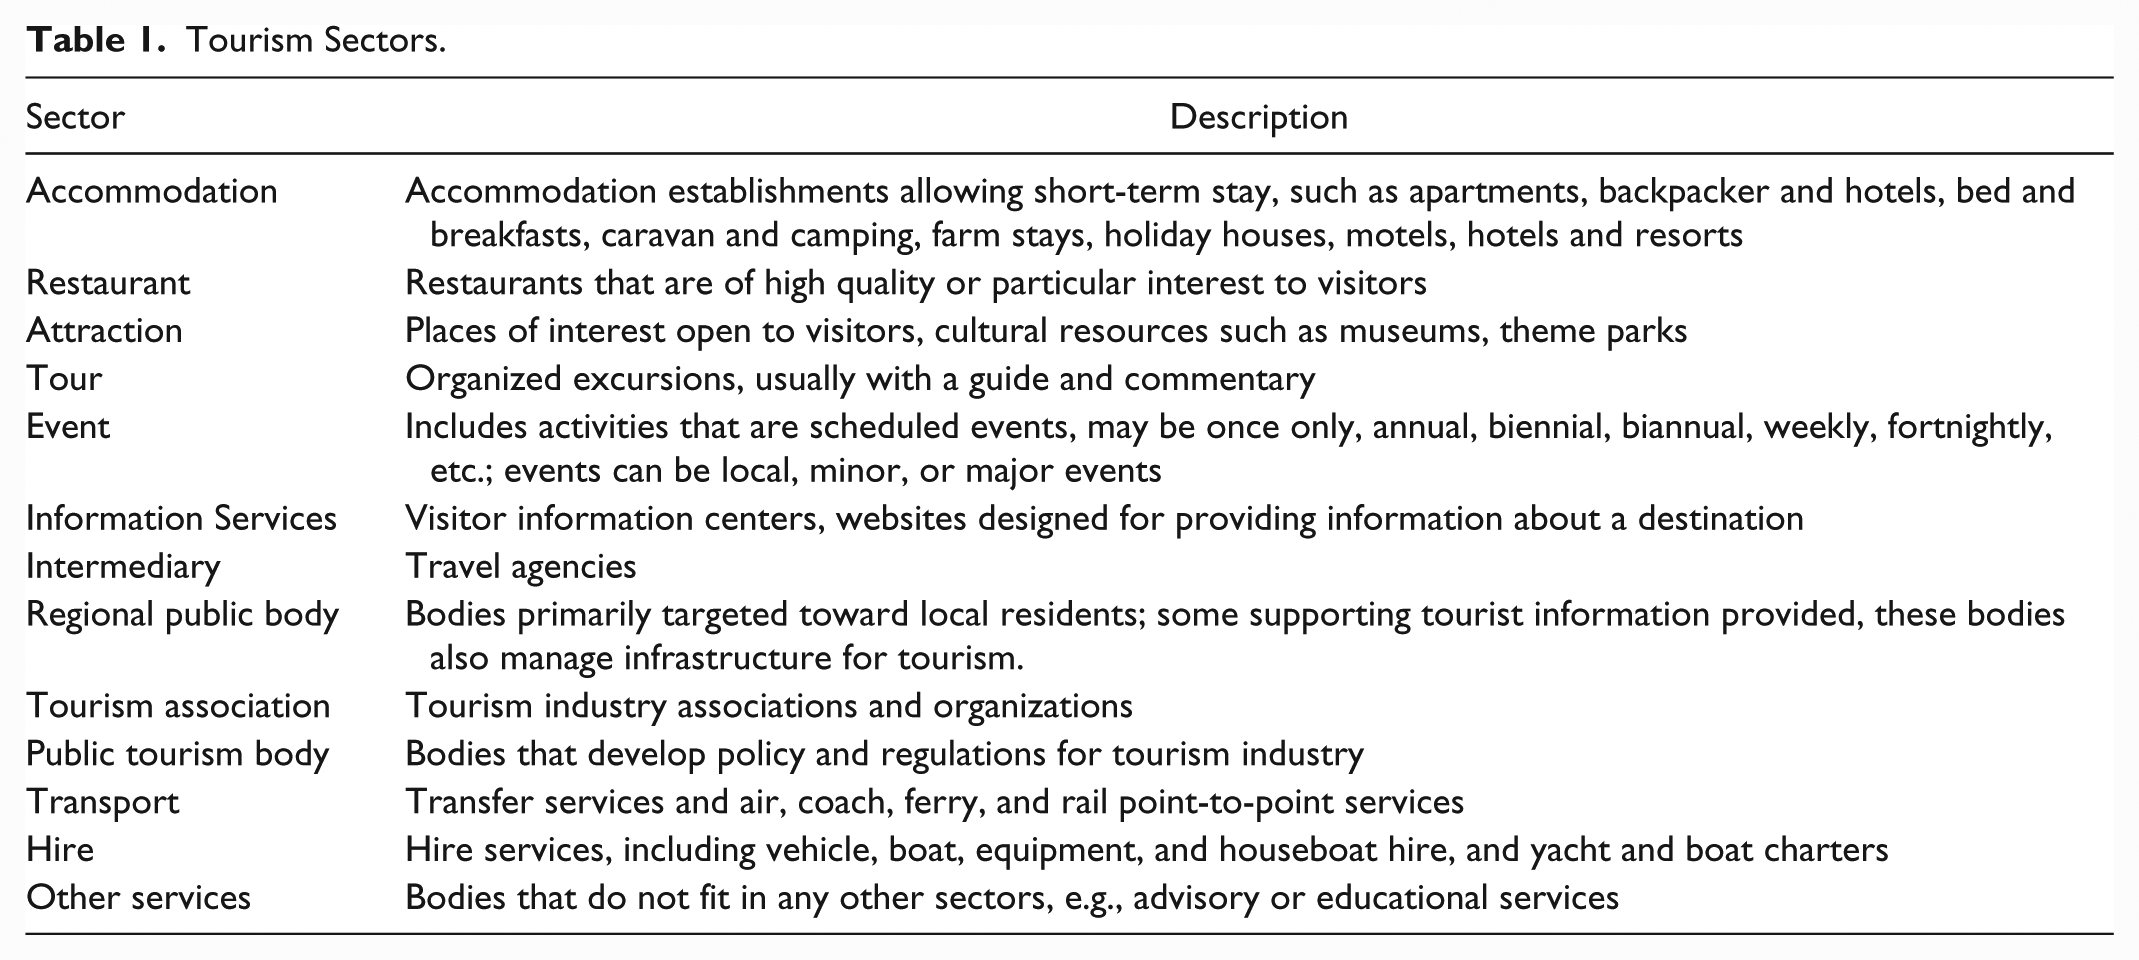
Data were collected from tourism-related organizations and businesses working in the state of Western Australia. To collect the data, a primary list of tourism organizations and businesses in WA was obtained from the Australian Tourism Data Warehouse (ATDW). The list was updated by finding and adding organizations’ websites, region, and sector. WA is divided into five tourism regions: Experience Perth, Australia’s Coral Coast, Australia’s Golden Outback, Australia’s North West, and Australia’s South West (Tourism Western Australia 2009). The organizations were also grouped under 12 sectors as in Table 1, which are primarily based on sectors defined by ATDW, with minor modifications. Data for the intermediary sector (not covered by ATDW) were obtained from the Australian Federation of Travel Agents (AFTA). In the next stage, the websites were “crawled” using VOSON (Ackland 2010), a web-based tool designed for hyperlink data collection and analysis. The prepared primary list of websites was given to VOSON as the seed websites for the crawl. After the crawl, the irrelevant discovered websites, those not included in the primary list, were removed. The resulting network comprised 1,515 nodes (websites) and 6,059 directed links (hyperlinks between websites). UCINET (Borgatti, Everett, and Freeman 2002), Gephi (Bastian, Heymann, and Jacomy 2009), and Pajek (Batagelj and Mrvar 1998) were used for the network visualization, measuring basic network properties and conducting some general analyses. For more sophisticated analyses not available in the mentioned tools, we used Networkx (Schult and Swart 2008), which is a Python language library package. To analyze the network from different perspectives, several network metrics are used in this study such as reciprocity, homophily, modularity, and assortativity, plus topological analyses including scale-free, hierarchical, small world, and bow-tie structures. For the sake of clarity, these measurements and analyses will be explained along with the results in the next section.
Tourism Sectors.
Results
The primary aim of this research is to gain a comprehensive understanding of the hyperlink network. To this end, several analyses are conducted to describe and explain the emerging network structure. The network is analyzed at three levels—global, sectoral, and individual—to characterize the properties of the network more precisely at each level. At the global level, the general structure and topology of the network is examined; at the sector level, the analysis focuses on the properties of tourism sectors and regions in the network; and at the individual level, the analysis concentrates on the node-level properties of individual websites. This section begins with a general description of the network at the global level, then moves on to explore which structural properties characterizes the network such as scale-free, hierarchical, assortative, or bow-tie structure. Finally, this section describes the network at the sector and individual level.
Global Level
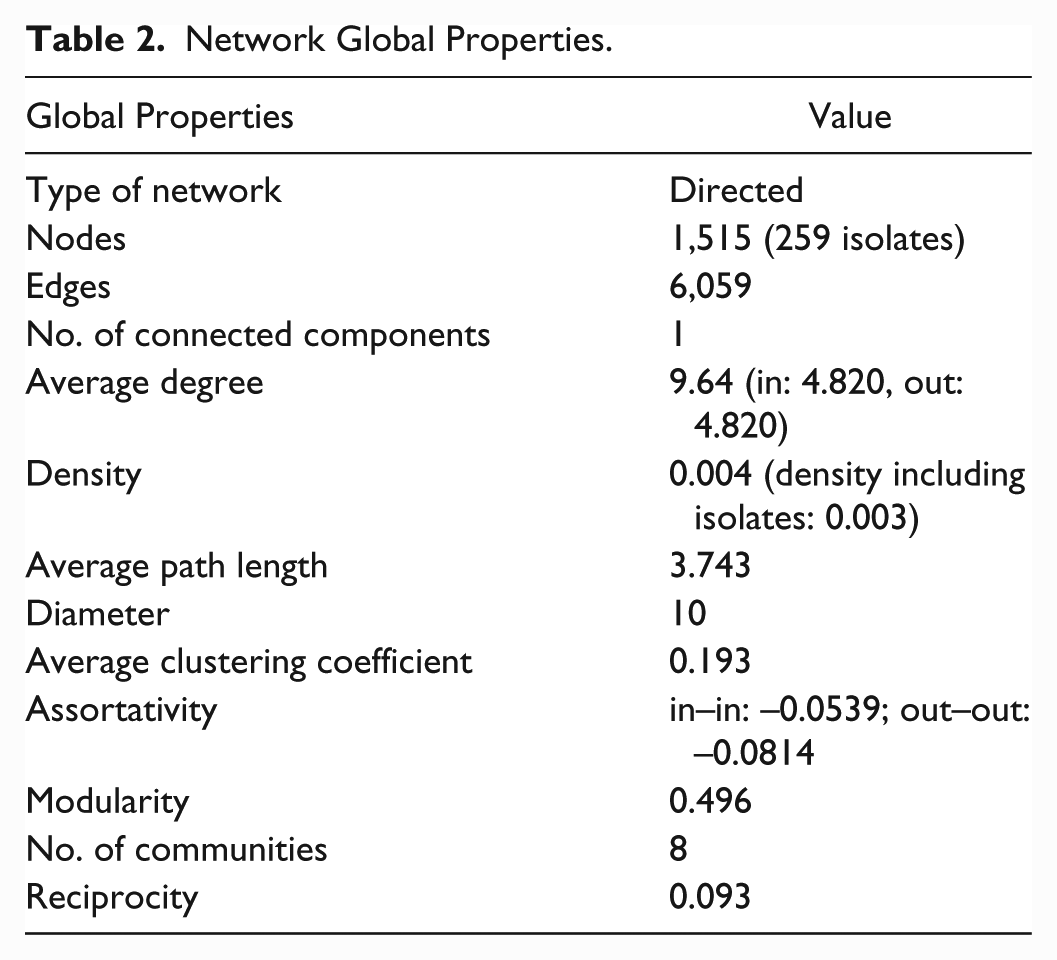
The network is directed and unweighted with 1,515 nodes (websites) and 6,059 links. The number of isolated websites having no links with others is 259 (17%). Isolated nodes will be excluded from analyses and visualizations, unless stated otherwise. Table 2 summarizes these properties and figure 1 shows the network visualization.
Network Global Properties.
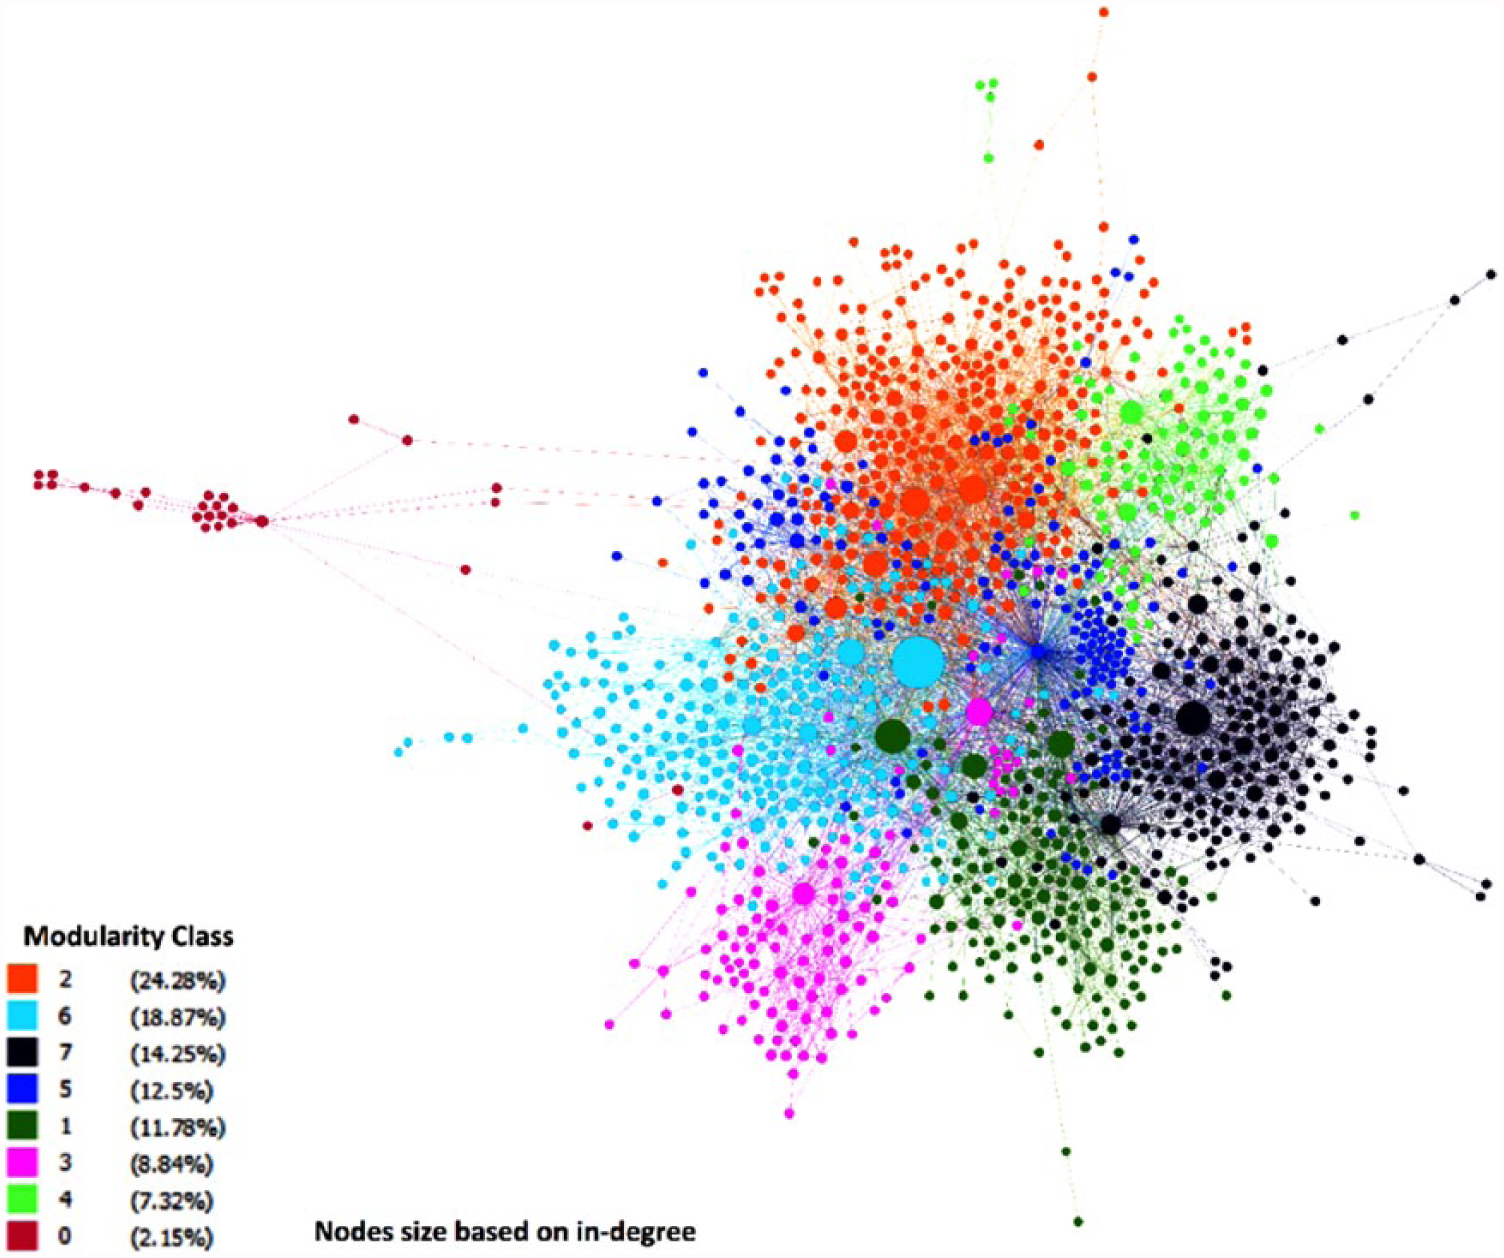
Network visualization.
The network is extremely sparse with a density of 0.004, which means that out of 1000 possible links, only four of them actually exist in the network. The average node degree is 9.64, which in a directed network is divided into average in-degree and out-degree. Not considering the isolates, all websites are connected together directly or indirectly in one connected component. The average path length is 3.743, which means that on average each node is 3.743 links away from another node. The maximum shortest distance between two nodes (diameter) is 10. The other properties in Table 2 will be explored further in the following paragraphs.
Degree Distribution and Scale-Free Structure
The statistical distribution of the degrees can reveal some of the defining characteristics of the network structure. A distribution with a significant tail means that a small portion of nodes have very high degrees and the majority of nodes have low degrees. This is called a power-law distribution, which is the main indicator of scale-free networks. “Networks whose degree distribution follows a power law are called scalefree networks” (Barabási 2016). In scale-free networks, some nodes act as hubs connecting to low-degree nodes. A good example of a scale-free network is the air traffic network where some airports act as the hubs (Barabási 2016).
Figures 2 and 3 show the degree distribution of the network. The log–log plot of cumulative distribution (Figure 3) can show the power-law property more clearly. Power-law is stronger when the log–log plot of the distribution is closer to a straight line. However, determining power-law cannot only rely on the visualization of the degree distribution. By using maximum-likelihood fitting methods with goodness-of-fit tests (Clauset, Shalizi, and Newman 2009), our results confirm the power-law distribution (Table 3). The distribution exponent (alpha) for the data is close to three, which indicates that network structure shows the properties of preferential attachment phenomena (Barabási and Albert 1999).
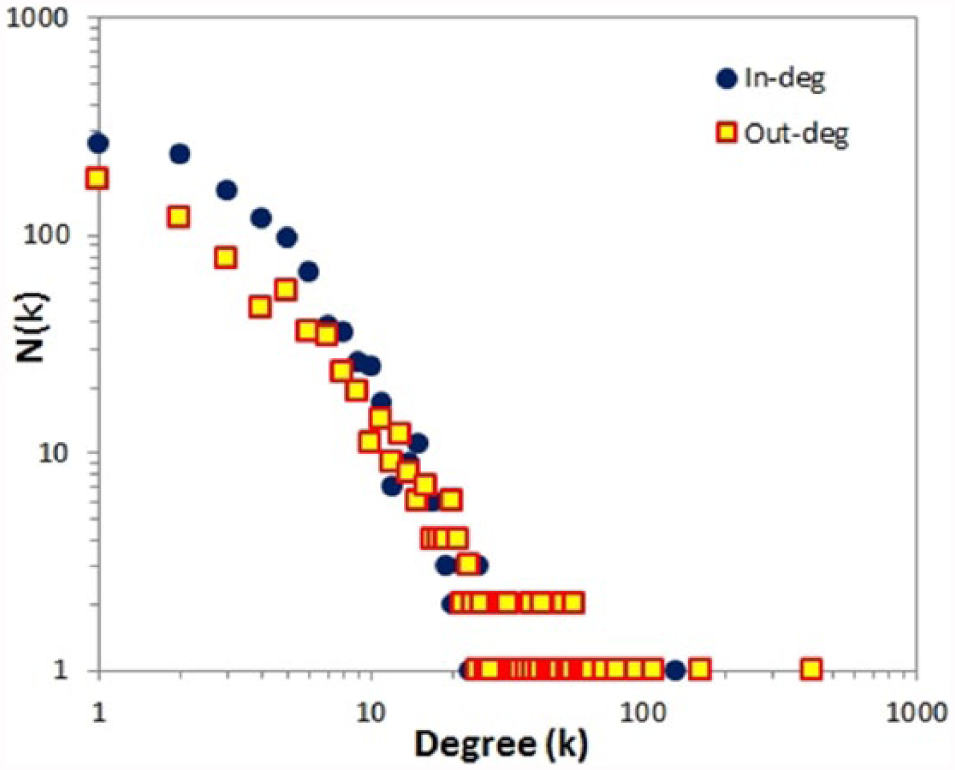
Log–log degree distribution.

Log–log cumulative degree distribution.
Power-Law Results.

Clustering Coefficient
The clustering coefficient is a measure of the tendency of nodes to cluster together. The local clustering coefficient is the density of ties in the neighborhood of a node. The coefficient ranges from 0, where there is no link between the neighbors of the node, to 1, where the neighbors form a complete network.
This network’s average clustering coefficient is 0.193 (including nodes with one tie; and it is 0.229 excluding the nodes with one tie). This means that on average about 19% of possible ties between a node’s immediate neighbors are present. This result is relatively high compared with the clustering coefficient of an equivalent random graph that would be 0.004.
Hierarchical Structure
The results thus far indicate that this network is scale-free and has a relatively high degree of clustering. Ravasz and Barabási (2003) bring these two properties together by showing that they are the consequence of a hierarchical structure. Thus, when a network is scale-free and has high-degree hubs, as well as a high clustering coefficient, it probably has a hierarchical structure. In a hierarchical network, the higher a node’s degree, the smaller its clustering coefficient. Thus, the distribution of the clustering coefficient as a function of nodes’ degrees can indicate the hierarchical structure of the network. It is hierarchical when the distribution of the average clustering coefficient with respect to the degrees shows a power-law functional form. Figure 4 shows the distribution plot in a logarithmic view that is very close to a straight line, indicating it is power-law. Therefore, the hyperlink network of WA tourism has a hierarchical structure.
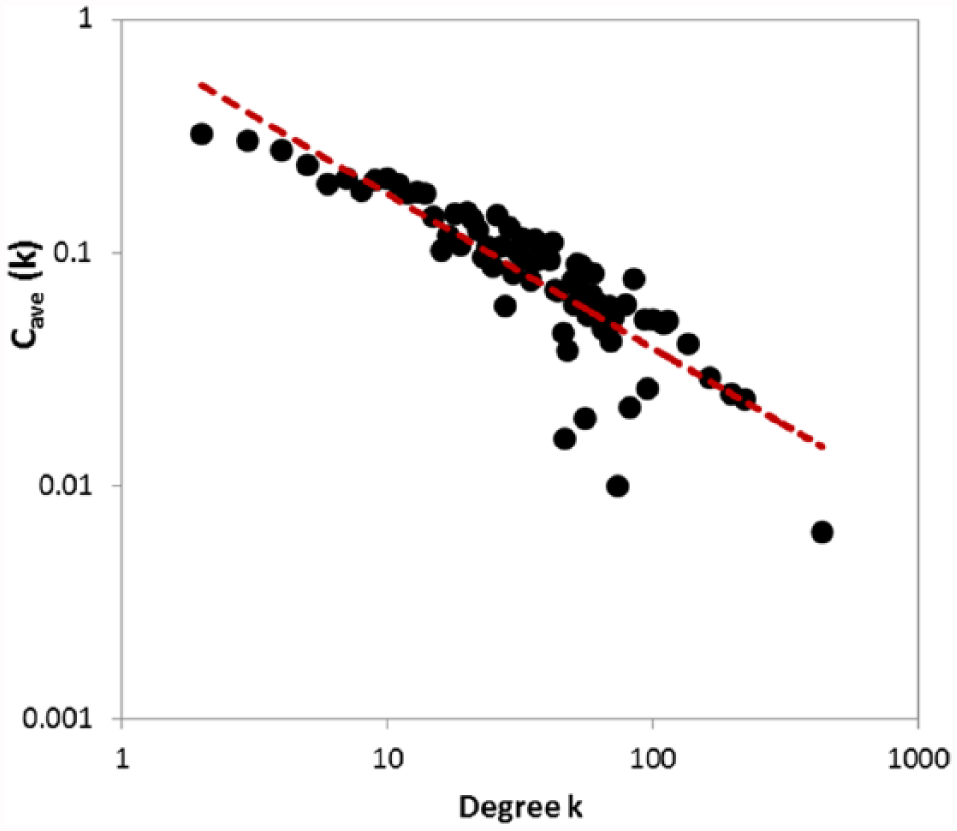
Log–log clustering coefficient distribution by degree.
Small World Structure
In addition to scale-free and hierarchical properties discussed above, networks can also show small-world properties. Small-world networks are “highly clustered, like regular lattices, yet have small characteristic path lengths, like random graphs” (Watts and Strogatz 1998, 440). Telesford et al. (2011) introduced a measurement for identifying the small-world networks called ω in which the clustering coefficient of the network is compared with that of an equivalent lattice network, and its average path length is compared with that of an equivalent random graph network:
Bow-Tie Structure
The general topological structure of the World Wide Web has been studied by many researchers. The bow-tie structure model, first proposed by Broder et al. (2000), shows that a general WWW network has six components:
- SCC: strongly connected component, the core of the network whose pages can all reach one another with directed links
- IN: contains the web pages that can reach the SCC, but cannot be reached from the SCC
- OUT: includes the web pages that have links from the SCC but do not have links back to the SCC
- TENDRILS: pages that can be reached from, or can reach IN and OUT, but have no links to the SCC
- TUBES: web pages linking IN to OUT without crossing the SCC
- DCC: disconnected component
The rationale for conducting a bow-tie analysis was twofold; first, to provide a clearer view of the network structure connectivity as a whole; second, to investigate whether the resulting network did provide evidence that such a network feature was emerging. As the results in Table 4 and Figure 5 indicate, this WA tourism network shows a clear bow-tie structure. The largest component is SSC followed closely by OUT. The portion of IN and TENDRILS is small, but the size of the disconnected component (isolated nodes) is relatively large.
Bow-Tie Structure Properties.

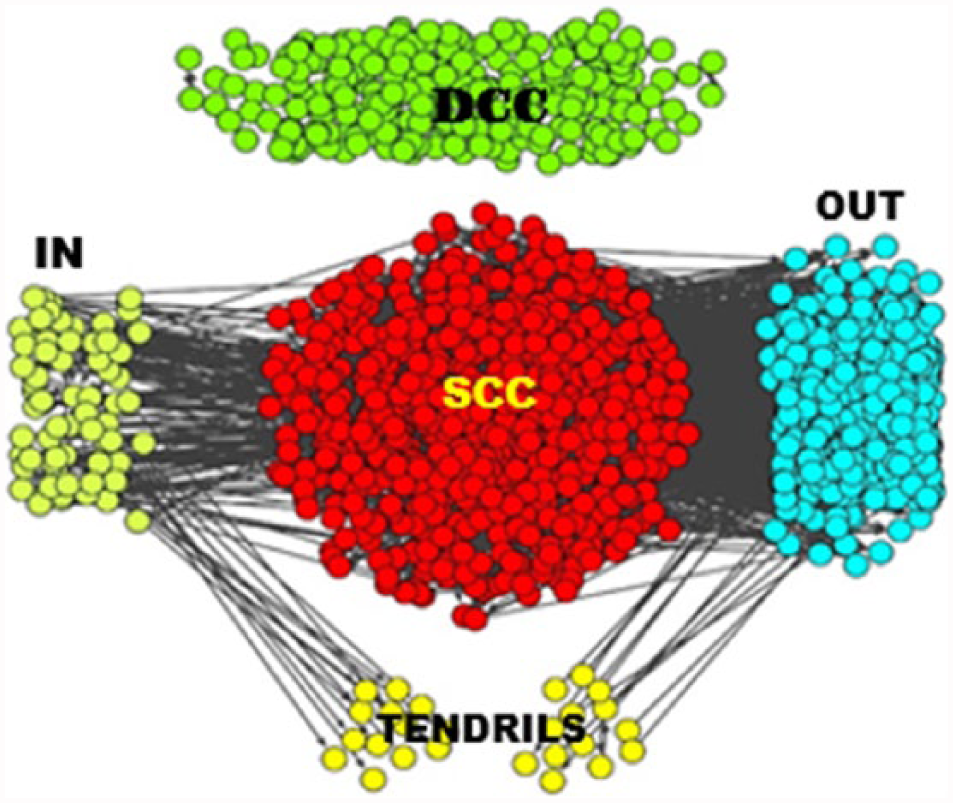
Bow-tie structure.
Modularity
Clusters or communities are underlying features of networks, and detecting them helps to understand the intermediate structure of the network. “The goal of community detection is to find the natural fault lines along which a network separates” (Newman 2010, 357). There are different methods and algorithms for detecting communities in the network of which modularity is one of the most widely used. “The modularity is, up to a multiplicative constant, the number of edges falling within groups minus the expected number in an equivalent network with edges placed at random” (Newman 2006, 8578). Modularity ranges from 0 to 1, with the values close to 1 indicating that the network is made of completely separated communities.
The modularity for this network is 0.49, which is relatively high, and eight communities were detected. The algorithm by Blondel et al. (2008) was used to detect the communities. Since the modularity analysis does not go beyond giving a value and finding the communities, we used the Rand index (Hubert and Arabie 1985) to examine the communities’ internal membership and determine whether there are any relationships between nodes’ communities and their other grouping attributes, that is, sector, region, and subregion (17 official subregions in WA). The Rand index ranges from 0 to 1, where 1 shows a maximum agreement in a relationship. As the results in Table 5 show, organizations do not tend to form communities based on their tourism sector, but rather based on their geographical position, although the relationship detected is not yet very strong.
Rand Index Results.

Homophily
Homophily (McPherson, Smith-Lovin, and Cook 2001; Kandel 1978; Kossinets and Watts 2009), as implied in the famous saying of “Birds of a feather flock together,” indicates the tendency or preference of nodes (people, organizations etc.) to connect to others that are similar to them in some ways.
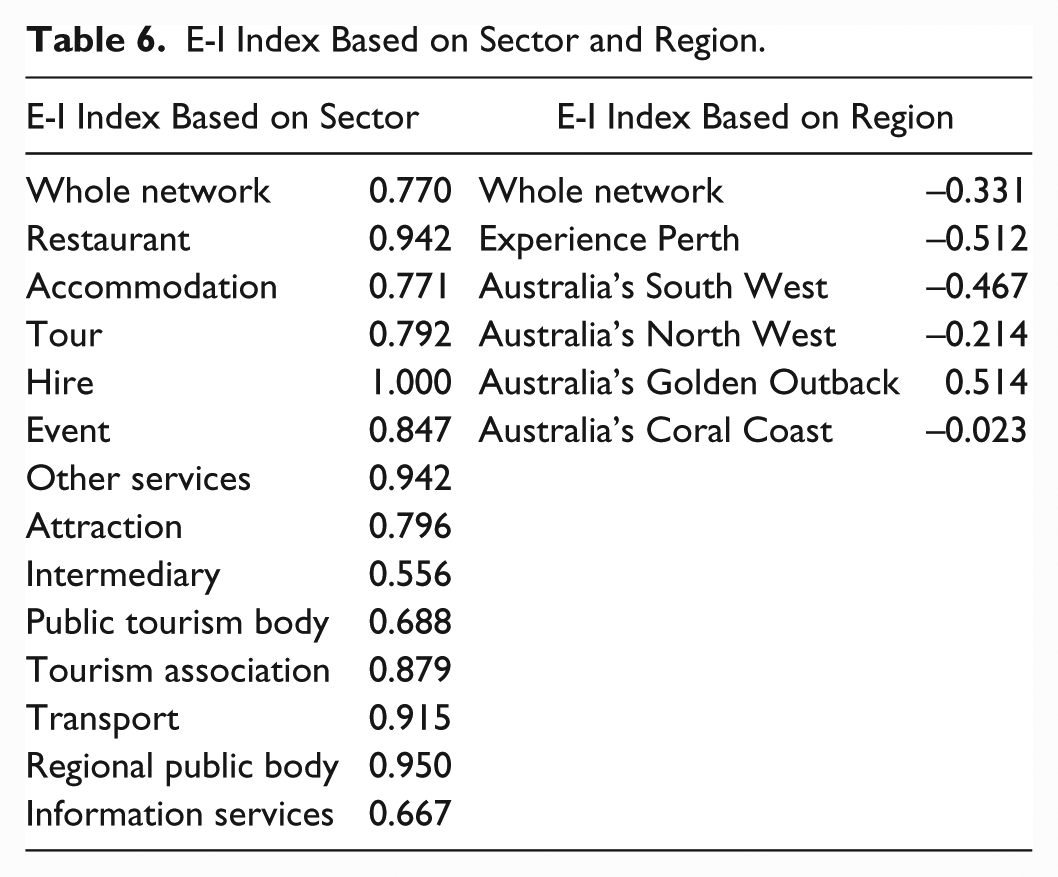
We examined homophily based on two attributes of nodes: sector and region (degrees are discussed under assortativity). It is calculated by the E-I (external – internal) index (Krackhardt and Stern 1988), which measures the ratios between external ties and internal ties (E-I index =
Table 6 shows the E-I index for the two examined attributes. According to the results, the network shows some degree of homophily based on region but no homophily based on industry sector, which means that most websites link to websites working in a different sector, but often to those in the same region. The least heterophilous sector is Intermediary whose E-I index is still high (0.556). However, apart from websites working in Australia’s Golden Outback, which are mostly linked to sites outside their region, other websites are mainly linked to websites in their own region.
E-I Index Based on Sector and Region.
Assortativity
Assortativity is the measure of nodes’ similarity based on their degree. In an assortative network, similar degree nodes connect together, high-degree nodes connect to each other forming hubs, and low-degree nodes link together creating peripheral sections. By contrast, in disassortative networks, high-degree nodes link to low-degree nodes creating a hub and spoke structure (Barabási 2016). In terms of connectivity of the network, assortativity and robustness are directly related; assortative networks are more resilient and robust to attacks (Noldus and Van Mieghem 2015).
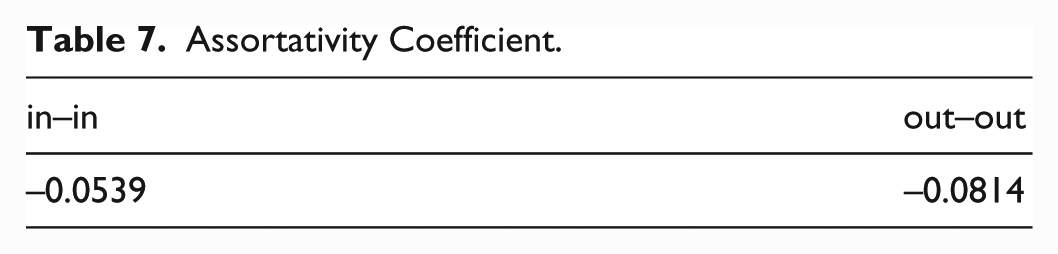
The assortativity coefficient r ranges between −1 (disassortative) and 1 (assortative), and in essence, is the correlation coefficient between a node’s degree and the degrees of its neighbors. For a directed network, it is more logical to measure the assortativity based on the correlation between the nodes’ respective in-degree or out-degree, because in-degree and out-degree are characteristics of the nodes, and in measuring the correlation coefficient, characteristics should be comparable (Noldus and Van Mieghem 2015). For the WA tourism network, the assortativity index is shown in Table 7. Both values are very close to 0, indicating the network is almost nonassortative, meaning that there is no evidence of similar degree nodes connecting together.
Assortativity Coefficient.
Reciprocity
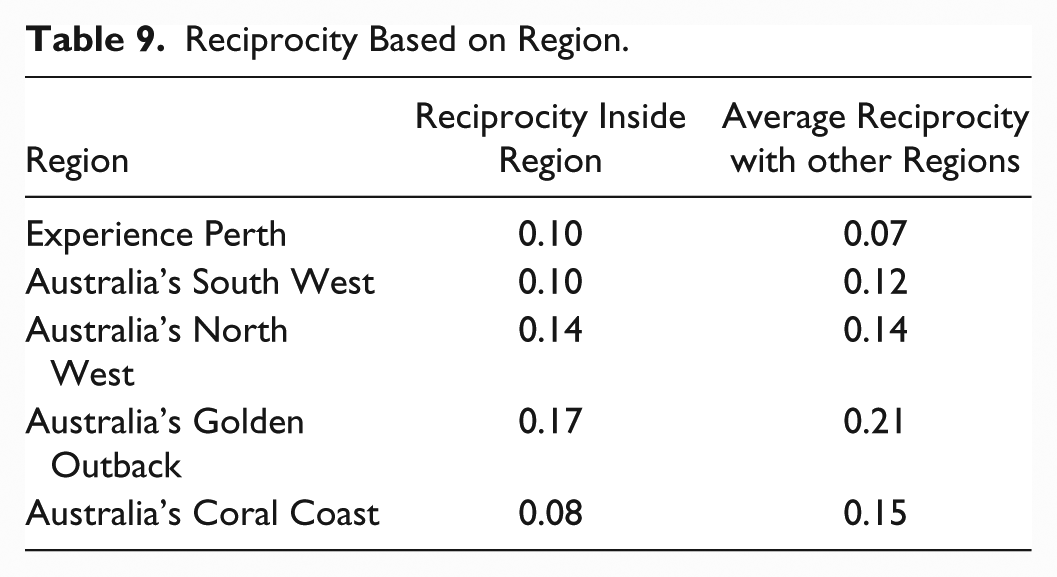
In directed networks, not all links are bidirectional; reciprocity indicates the tendency of node pairs to form mutual connections between each other (Wasserman and Faust 1994; Garlaschelli and Loffredo 2004). Directed networks can range from completely reciprocal, to completely unreciprocal, such as citation networks where a paper can only cite its predecessors and cannot cite its successors (Garlaschelli and Loffredo 2004). In this network, 9% of pairs have reciprocated ties. Table 8 and 9 show the reciprocity values based on tourism regions and sectors. Reciprocity between websites inside a sector or a region is often less than reciprocity between websites of different sectors and regions. Tourism associations are fully reciprocal in their sector, while tour, hire, intermediary, transport, and regional public body sectors have no reciprocated ties within their sector.
Reciprocity Based on Sector.

Reciprocity Based on Region.
Sector Level
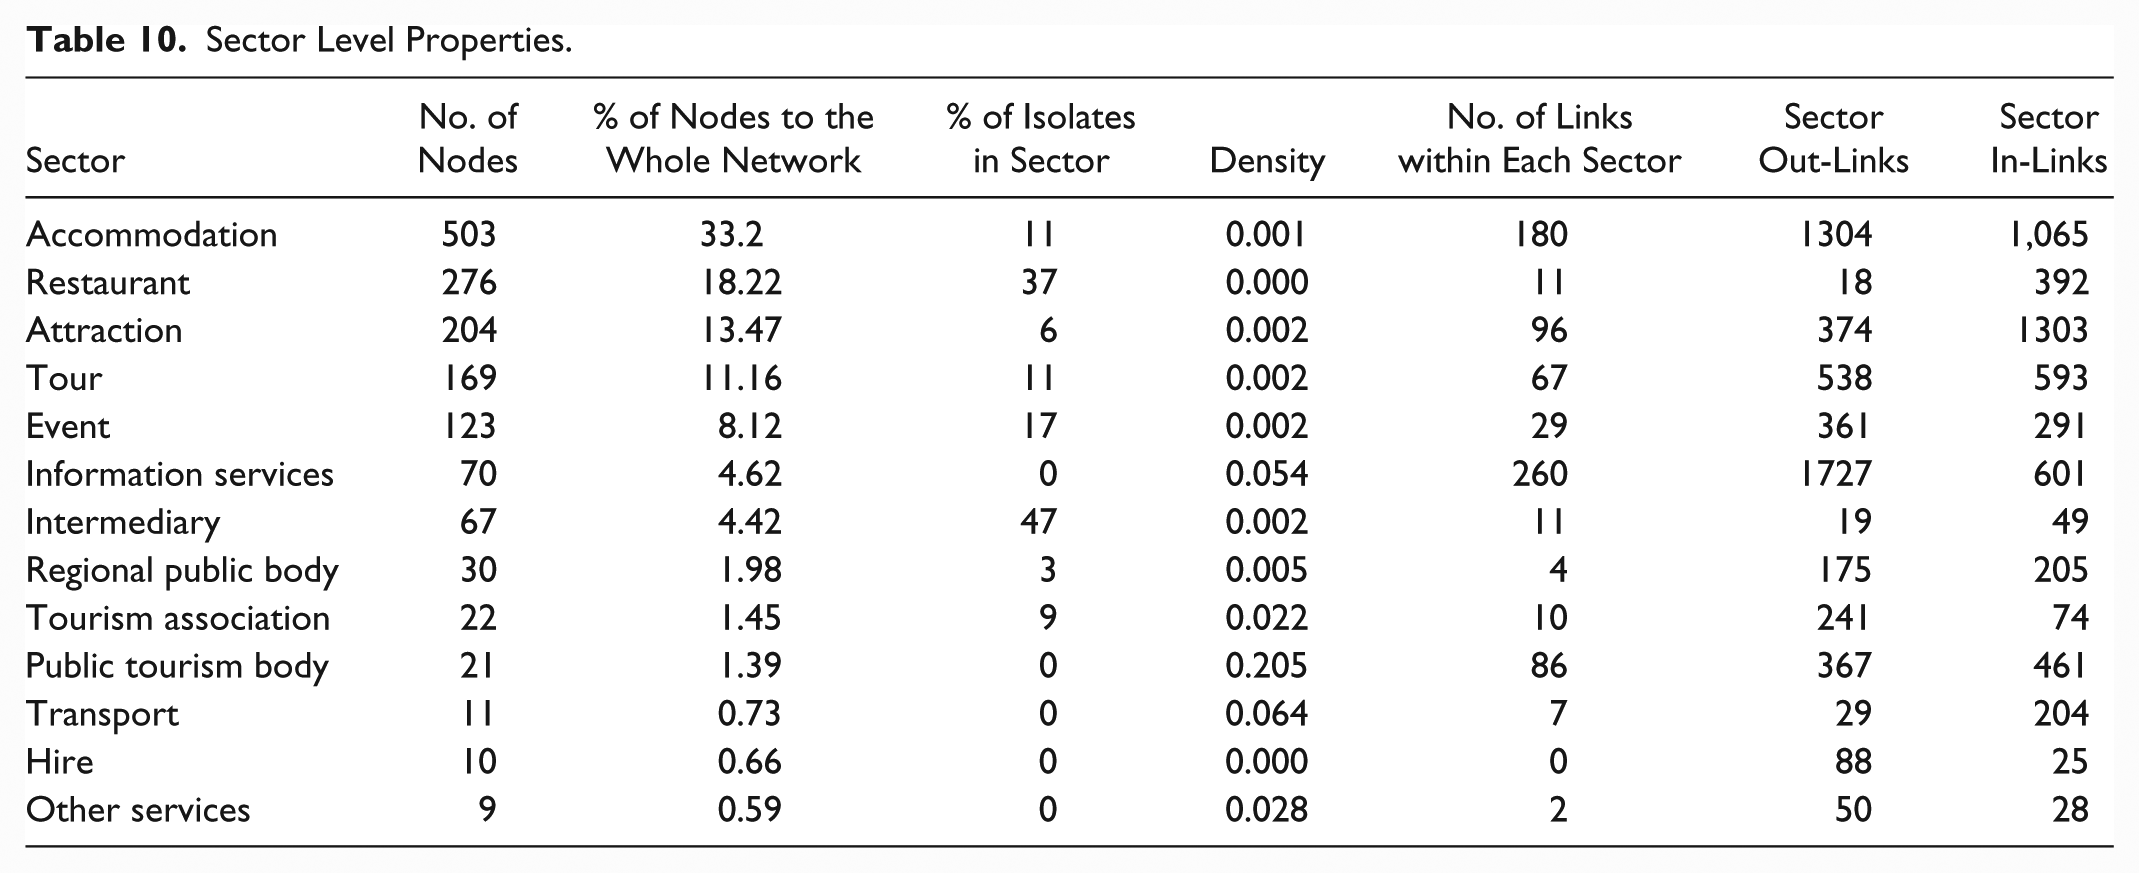
In this section, the network is described by the industry sector and region levels. Some properties and visualization of sectors and regions are presented in Tables 10 and 11 and Figure 6. Isolated nodes are also included in this section.
Sector Level Properties.
Region Level Properties.

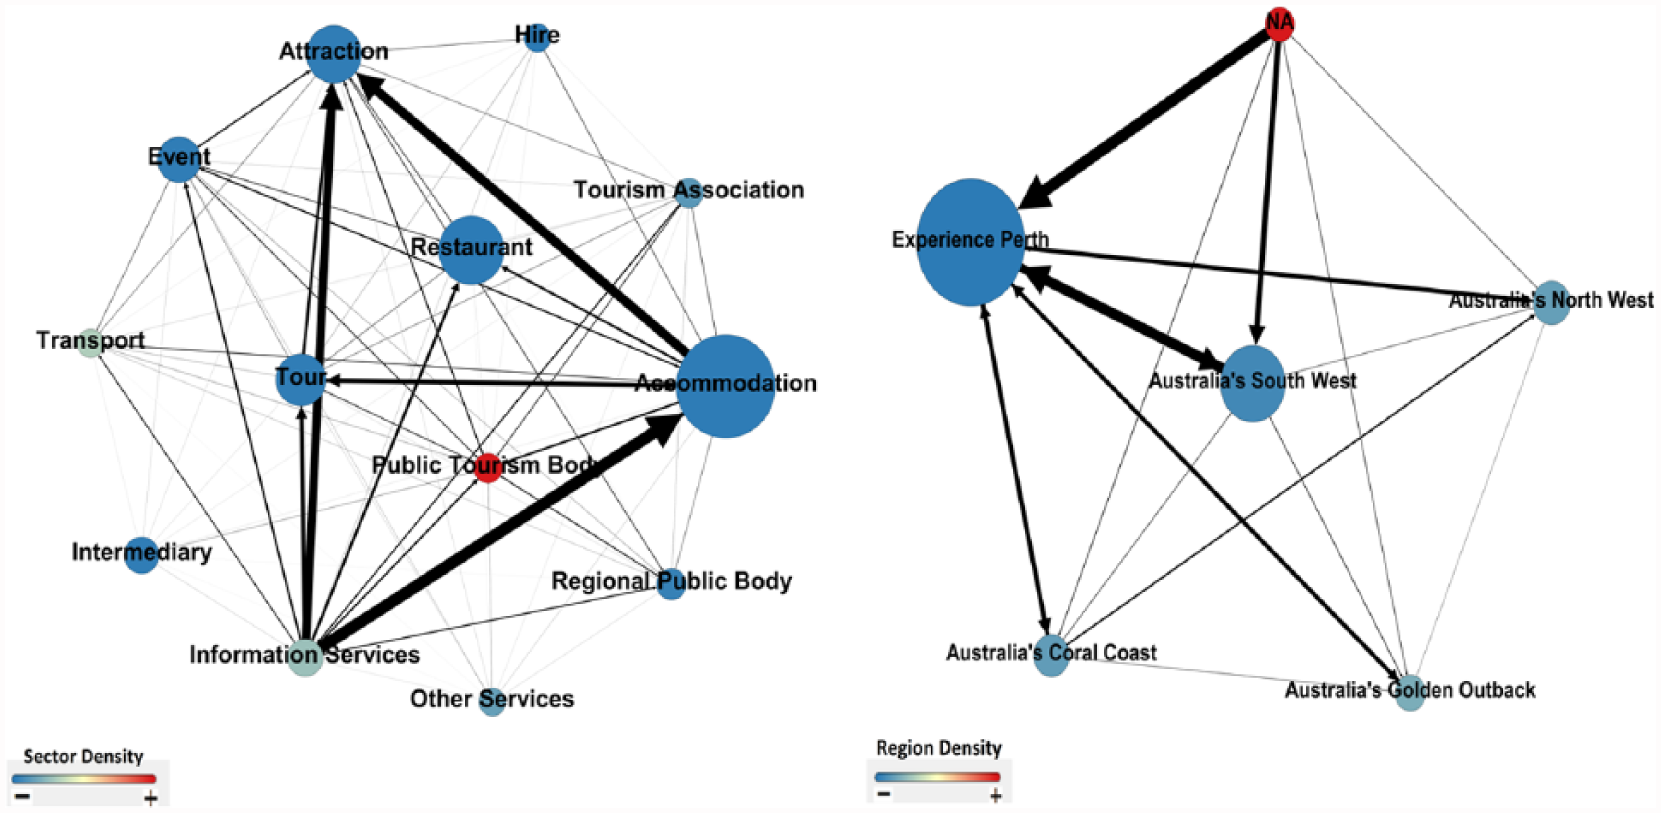
Sector and region networks.
The results show that accommodation websites have the largest numbers of websites (33.2%) followed by restaurants (18.2%) that together comprise 51% of the total nodes in the network. However, 64% of isolate nodes also belong to these two sectors. Intermediary has the highest rate of isolate websites in its sector (47%) followed by restaurants (37%). Comparing the last three columns of Table 10, the data indicate that for all sectors, the number of links inside a sector between its websites is less than links to other sectors, which shows websites’ tendency to link to businesses of other types rather than their own types. This tendency was also illuminated by the homophily analysis. Sectors of accommodation, events, information services, tourism association, and hire, have more out-links than in-links, with a more significant difference for the information services, tourism associations, and hire service sectors. Information services have the largest number of out-links, which is understandable because of their role of introducing and providing information for other services and businesses. The accommodation sector has both large out-links and in-links, which is mainly because of its large size.
Restaurants, attractions, tours, intermediaries, regional public bodies, public tourism bodies, and transport organizations have more links to their sectors than out-links. This difference is even greater for restaurants, attractions, and transport organizations. The sector with the largest in-links is the attractions sector.
In terms of regions, Experience Perth is the largest region in the network, holding more than half of the nodes alone (54%), though 21% of them are isolates. The next largest region is South West but is only half the size of Experience Perth. In contrast to tourism sectors, tourism regions mostly prefer to link to websites in their own region. The exception is the Golden Outback. Experience Perth has the largest number of out-links and in-links among the regions.
Individual Level
At the individual level, the analysis of the network is concentrated on each node. Structural properties of nodes, which depend on their position in the network, can be described and analyzed. Different measures can be used at the individual level analysis, amongst which are the centrality measures. Centrality measures identify the most important or prominent actors in the network. The important actors are usually situated in strategic locations in the network (Wasserman and Faust 1994).
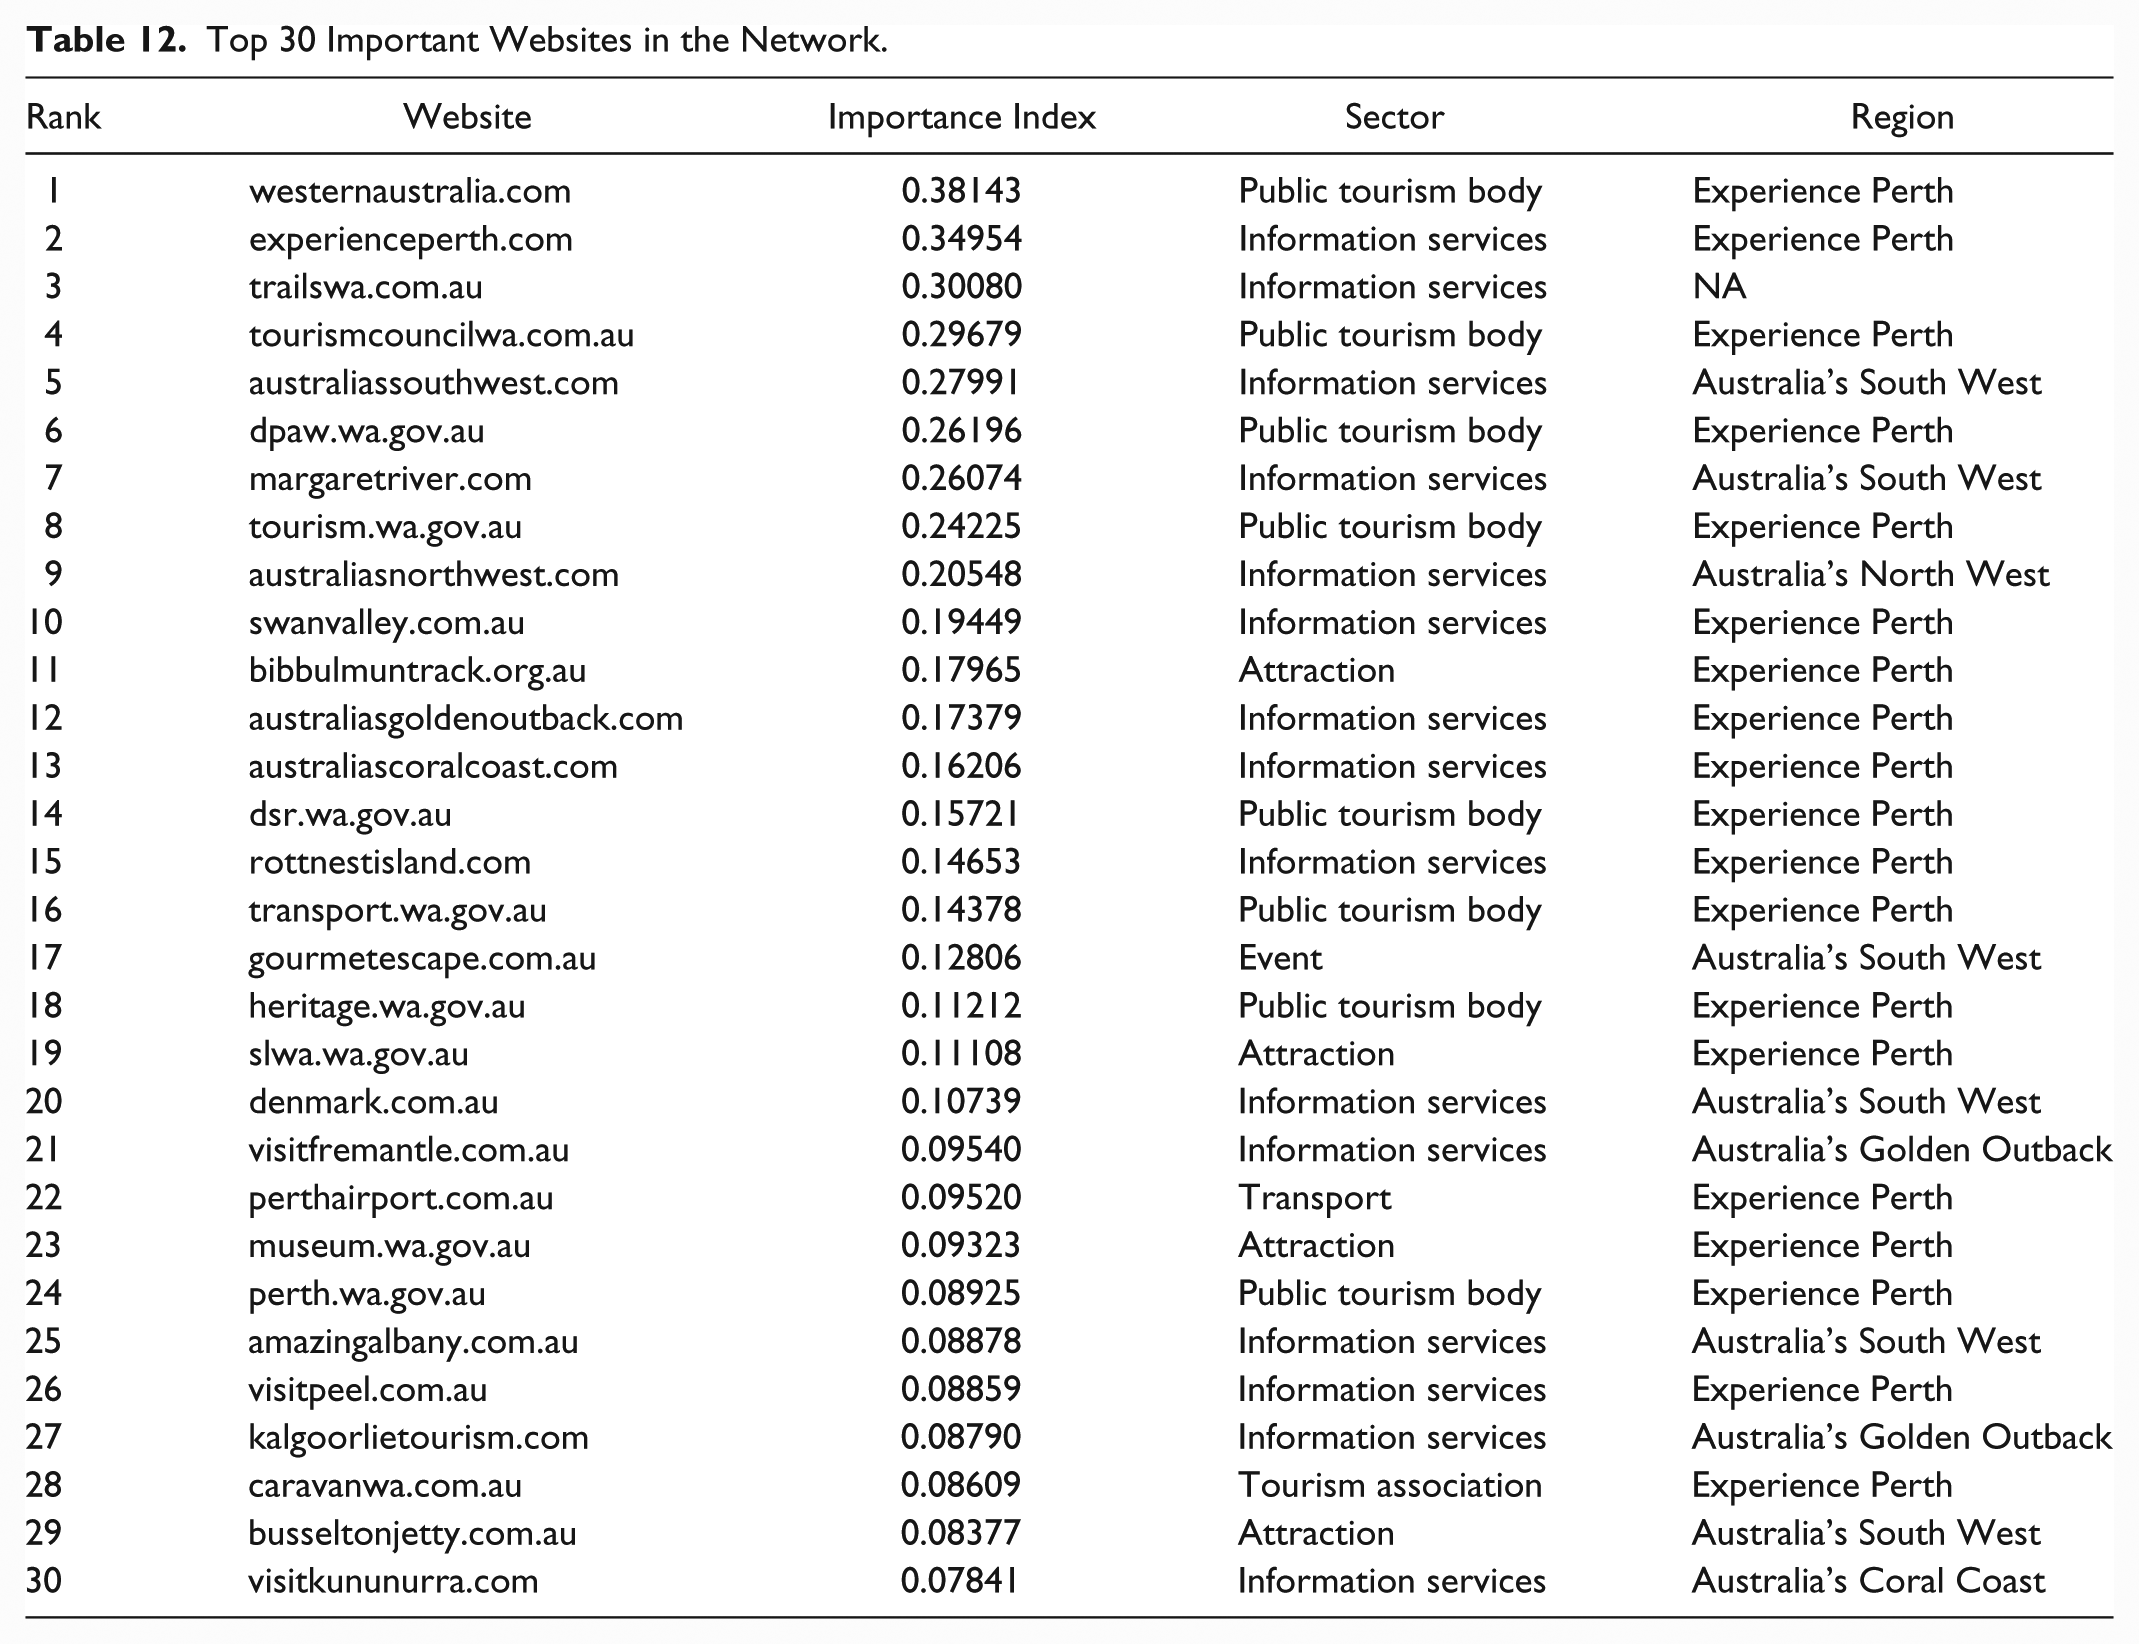
We calculated an importance index for each node based on the geometric mean of normalized values of in-degree, out-degree, betweenness, and closeness centrality and PageRank. Degree centrality is the number of ties linked to the node (node’s degree), which in directed networks can be separated into in-degree and out-degree centrality. Closeness centrality measures how close an actor is to all other actors in the network. An actor is central if its distance to all other actors is short (Wasserman and Faust 1994; Hanneman and Riddle 2005). Betweenness centrality is “the number of times an actor connects pairs of other actors, who otherwise would not be able to reach one another” (Hawe, Webster, and Shiell 2004). This measure is based on the intermediary role of an actor in the network, where the central actor acts as a gatekeeper, and has control of the flow of resources between other actors (Hawe, Webster, and Shiell 2004, 974). PageRank (Brain and Page 1998) is an algorithm used by Google to measure the importance of the webpages. It is a variant of eigenvector centrality, and rests on the idea that highly ranked pages are linked to other highly ranked pages.
Table 12 ranks the 30 most important websites in the network with their region and sector. The result clearly shows the importance of information services and public tourism bodies in the network. Half of the top websites are information services, eight of them are public tourism bodies, and four are attractions. There is one for each sector of transport, events, and tourism associations. Most of the important websites are located in the Experience Perth region (19 websites), followed by Australia’s South West (6 websites).
Top 30 Important Websites in the Network.
Discussion and Conclusion
In this study, we examined different structural properties of the tourism hyperlink network in Western Australia to determine current defining characteristics and to propose ways in which the network might be enhanced. The first noticeable characteristic of the network is its low connectivity. This is not surprising because similar low density has been reported in previous general WWW networks and specific tourism studies (Baggio, Scott, and Cooper 2010; Miguéns and Corfu 2008; Piazzi et al. 2011; Ying, Norman, and Zhou 2014). This low connectivity indicates that tourism businesses in WA are either not interested in, or do not understand the relevance of linking to each other on their websites. Seventeen percent of businesses have no links at all to other websites in the network. This is likely because those businesses have focused their online presence solely on connecting with their customers. Networking with other websites may be a strategy they have not considered, or of which they are yet unaware.
While displaying low connectivity, the network’s average path length and diameter values are not so small, and are close to values of the equivalent random graph. This indicates a more average status for the network in terms of information sharing. The results of the small-world analysis also confirm this, as the network’s small-worldness is discernible, though not excessive. The small distances between the nodes could result in quicker and easier flow of information within the network.
The results of the bow-tie structure analysis added more clarity to understanding the connectivity of the network. About 40% of websites are located in the main connected component of the network and all have access to each other. However, about the same number of websites are in the OUT component (plus 2% of TENDRILS) that only receive links from other websites. These websites have no links out to the rest of network, which means that users or search engine crawlers are unable to reach the rest of the network by following the links from these websites. Moreover, the large component of isolated websites substantially adds to the disconnectivity of the network. Therefore, in order to increase the visibility of the destination and improve the information sharing, the connectivity of the network would need to be improved substantially by creating more hyperlinks between these websites.
Despite the sparseness of the network, we found that the existing links were not distributed randomly or evenly throughout the network. The network’s topological properties were far from random, and demonstrated some defined structures that are well-described and discussed in network science. It is a significant finding, since it highlights the importance of studying hyperlinks, because they show some patterns of link formation that can be indicators of offline relationships and collaborations.
One of the main structural properties found was the hierarchical structure of the network, which is a combination of two properties: the network being scale-free, and the network being highly clustered. The scale-free structure indicated that the network is composed of a small number of highly central hubs and a large number of peripheral websites. These hubs were found to be predominantly information services and public tourism bodies, with small private businesses occupying more peripheral positions in the network. The existence of these central hubs can lead to the faster diffusion of information through the network. Hubs can also improve searchability by leading users to sources of information (Ackland 2008). On the other hand, scale-free networks are vulnerable to targeted attacks (Crucitti et al. 2004; Albert, Jeong, and Barabási 2000), because if a few hubs are removed, the functioning of a network can be severely disrupted. When the scale-free network is assortative and hubs are connected together, they can act as backups if one or more are removed, and this contributes to the robustness of the network. However, our analysis indicated that there is no evidence that this network is assortative (or disassortative). This is in contrast to the findings of Miguéns and Corfu (2008) that indicate that tourism attractions tend to connect to attractions with dissimilar degrees. However, their study was limited to data concerning tourist attractions rather than a complete destination as in this study.
A high clustering coefficient and modularity are other important structural properties of this network, and provide evidence of the tendency of websites to form dense neighborhoods. A high clustering coefficient can be an indicator of local specialization in tourism organizations. In addition, the pattern of connectivity has led to the formation of eight structural communities within the network. A reasonably strong relationship between the formation of these communities and the geographical location of organizations can be seen, which indicates that tourism organizations prefer to link to websites working in their physical proximity, rather than to their own service sector. This pattern may be a sign of local collaboration between tourism organizations and also an indication of high competition between similar businesses.
Another important finding of the study shows that 9% of website pairs have mutual links to each other. This reciprocity can be interpreted as mutual acknowledgement or trust, and can improve visibility (Rogers and Marres 2000; Shumate and Dewitt 2008). Reciprocity of 9%, although much higher than the reciprocity of an equivalent random graph (0.002), indicates that, generally, tourism organizations in WA are not particularly interested in acknowledging each other. In addition to competition, a possible reason for low reciprocity is that most high-degree central websites are public organizations and information services that link many other businesses as a way of promoting and introducing them, whereas small businesses do not often link back to those public and information services. Thus, the highly central websites should consider requesting those small businesses they link to, to link back to them. This would be a simple, easy, and speedy action that could considerably increase the connectivity of the whole network.
A further detailed analysis focused on individual websites showed that information services and public tourism organizations play the most critical role in the destination WWW network. This was an expected result, since these types of organizations are charged with the role of providing information, introducing and promoting the other services in the destination; thus, they possess a privileged position in the network because of links. This paper has provided an importance index and identified the 30 most important websites within the West Australian tourism industry. This can assist key policy makers and managing bodies of the destination to have a better understanding of important hubs, where they are located in the network, and how their structural powers can be used for the better management of the network. Moreover, it can help hubs to better understand their position, and more strategically plan their networking on the Internet.
Overall, the hyperlink network of tourism in WA presents a similar characteristics to other hyperlink networks that have been studied. The WA network is a sparse, centralized, and hierarchical network, within which websites have formed communities based mainly on their geographical locations. The main implication of this study for the destination managers and policy makers within the network is that the connectivity of tourism websites in WA is currently limited and therefore not very efficient; hence, there is scope for improvement. Generally, the destination management organizations and similar public websites are discharging their roles effectively in providing information and linking to other services’ websites. However, they should try to increase the connectivity of the network by adopting some policies and actions to educate the industry businesses on the importance of hyperlinks and to encourage them to create more links to other tourism websites in the destination. Creating hyperlinks is simple and easy, and the benefits can be considerable for the individual businesses and for the whole destination. The impact and results of increasing the connectivity of a destination’s hyperlink network may not be immediate and direct, but greater connectivity will gradually increase the visibility of Western Australia as a tourism destination on the Internet and contribute to industry growth.
Moreover, this research can help destination management organizations to more strategically, and more precisely, pinpoint the weak points and bottlenecks of the network and focus on the websites residing at those locations.
As the network is centralized and hierarchical with central hubs, policy makers can focus on utilizing the hubs to manage and improve the network. Policy makers might also engage in debate about maintaining and developing the current centralized nature of the network and consolidating the position of the hubs, or whether there are advantages in decentralizing the network. The other potential contribution of this study to the tourism industry is that it provides a model of a research design that can be used to assess the connectivity of a tourism destination network on the Internet, which can be applied in any other destination to evaluate, describe, and diagnose the efficiency of its hyperlink network. Indeed, this study now stands as a baseline exploration that can be revisited in future research to chart the development of the destination online.
This article, as the first part of a larger study, has presented a detailed analysis of the current hyperlink structure of the Western Australian tourism industry. A deeper qualitative or quantitative investigation would considerably enrich understandings about the creation and meanings of the hyperlinks in this tourism destination. Another limitation of this study is that it only focuses on one destination, and it captures a snapshot without considering the dynamics of the network. Networks are constantly changing and evolving, and capturing the dynamics of a network over a period of few years can provide a better understanding of the destination network. Taking into account these limitations, we believe that this is the largest hyperlink study to have been completed in the tourism industry so far. Considering the detailed and diverse analyses applied in this investigation, this study makes a significant contribution to advancing the application of network analysis within the tourism field, and also demonstrates the validity of this approach to the empirical investigation of tourism destinations. The large sample size used in this study, provides very reliable and robust results for WA destination management organizations to explore and determine what actions they may take to illuminate the instrumentality of hyperlinks within the sector so businesses are educated about how to increase online visibility to enhance future performance. Developing a strategy to increase the connectivity, and consequently visibility, will enhance the prosperity of the destination.
Footnotes
Declaration of Conflicting Interests
The author(s) declared no potential conflicts of interest with respect to the research, authorship, and/or publication of this article.
Funding
The author(s) received no financial support for the research, authorship, and/or publication of this article.