
Abstract
This article analyzes cruise tourism seasonality in Southern Europe, assessing the seasonal concentration levels by means of the Gini index. The additive decomposition of this index is used to evaluate the contribution of each port to the global seasonal concentration in the regions where they are located. It also allows the estimation of marginal relative effects to identify the most propitious ports for reducing seasonality within the Mediterranean regions. The analysis is complemented by estimating the seasonal patterns of each port. Given the significant heterogeneity revealed in the regions analyzed, a bootstrapped bagged clustering is applied to classify the ports into homogeneous groups according to their seasonal patterns. The techniques used form a methodological framework that serves as a control and monitoring tool for measuring seasonal concentration levels in cruise tourism, allowing for policies against seasonality to be tailored for this segment.
Introduction
The cruise tourism industry has been growing considerably in recent years on the shores of the Mediterranean. According to the Cruise Lines International Association–Europe (CLIA Europe), 164 cruise ships were active in the Mediterranean in 2015, potentially carrying 3.71 million passengers on 2,692 cruises (CLIA Europe 2016). The Association of Mediterranean Cruise Ports (MedCruise) estimated that approximately 80% of the total number of cruise passenger arrivals registered in the 226 Mediterranean ports took place in 72 of their member ports. With an average annual growth rate of 7.56%, the number of cruise passengers visiting a MedCruise port member increased from 8.6 million in 2000 to 27.4 million in 2016 (MedCruise 2017). Although the recent growth in cruise tourism is considerable, there is a lack of research in this sector (Gibson and Papathanassis 2010; Scantlebury 2007).
As in other tourism sectors, cruise tourism is affected by the phenomenon of seasonality that manifests itself in those ports or destinations where it takes place. However, most studies on cruise tourism are usually focused on the different impacts that this sector has on the destinations: (1) economic impact (Brida, Bukstein, and Tealde 2015; Chase and McKee 2003; Douglas and Douglas 2004; Dwyer and Forsyth 1996, 1998; Dwyer, Douglas, and Livaic 2004; Fernández Guerrero, Martí Selva, and Puertas Medina 2008), (2) social impact (Gibson and Bentley 2006), and (3) environmental impact (Butt 2007; Johnson 2002; Wright 2008); or (4) they are based on the three impacts mentioned (Brida and Zapata-Aguirre 2010). These impacts have also been studied in relation to seasonality in the tourism literature, as in the case of Martín, Aguilera, and Moreno (2014), who have recently investigated the main impacts of high concentrations of visitors at certain times of the year (i.e., high tourism seasonality).
Even though cruise tourism is one of the segments that has been gaining considerable attention in recent years because of its sustained growth (Pranić, Marušić, and Sever 2013), cruise tourism seasonality is a phenomenon that has received very little attention in academia. Indeed, while academic research on various aspects of cruise tourism is currently a growing body of literature, seasonality in this sector has been recently analyzed only in a few works (Andriotis and Agiomirgianakis 2010; Bardolet and Sheldon 2008; Charlier and McCalla 2006; Lee and Ramdeen 2013; Luković and Božić 2011; Marušić, Sever, and Ivandić 2012; Rodrigue and Notteboom 2013; Seidl, Giuliano, and Pratt 2007). Most of these works simply study the seasonal patterns of the cruise tourism demand along the year, and only few recent studies use indexes of yearly seasonal concentration like the Gini index or the coefficient of variation (Fernández-Morales and Mayorga-Toledano 2015; Esteve-Pérez and Garcia-Sanchez 2017).
The current article develops a novel methodology for measuring the extent and effects of seasonality in the cruise tourism industry, using and adapting some statistical tools that have separately proven their relevance in other tourism segments. The combination of these techniques forms a more powerful methodology that helps fill the existing gap in the literature on seasonality analysis of the cruise tourism segment, which has only been analyzed from a limited and simplistic analytical perspective, despite the great interest that the phenomenon arouses.
The proposed methodology allows to estimate the seasonal patterns of cruise tourism demand in ports and regions, as well as annual indexes of seasonal concentration. But, in addition, it also provides a decomposition technique to estimate the contribution of each port’s demand to the overall seasonal concentration level of the region where it is located. This is one of the main contributions of this study to the existing literature on seasonality of cruise tourism, in which there are not attempts to measure these kind of effects, as far as we know. Closely related with this fact, this study goes beyond the regional classification of ports, as it finds significant evidence of seasonal heterogeneity within the ports of each Mediterranean region. Therefore, it proposes the clustering of ports regarding the similarity of their seasonal patterns and investigates the relevance of these clusters on the decomposition analysis, this being the other main contribution of this study to the literature on seasonality of cruise tourism. Thus, the application of the proposed methodological framework provides important new evidence in a sector of the industry for which little economic analysis exists to identify the ports that are more suitable for reducing seasonality in the regions where they are located. It is of great interest to have this information available, as a better redistribution of cruise passenger flows throughout the year would reduce the impacts produced by seasonality.
Literature Review
Theoretical Framework
Tourism seasonality is defined as the trend of tourist flows to concentrate on relatively short periods of the year (Allcock 1994). This phenomenon can affect many activities in the industry, especially in coastal tourist destinations (Cisneros-Martínez and Fernández Morales 2015). Therefore, the analysis of seasonality in cruise tourism is of great relevance. Seasonality causes imbalances between costs and income structure, which translates into difficulties in reinvesting business assets due to the variability of benefits during different months of the year. These economic effects largely result in inefficiencies and losing profitability from resources (Manning and Powers 1984; Rosselló Nadal, Riera Font, and Sansó Rosselló 2004).
Baron (1976) argues that the two main causes of seasonality are either natural, that is, due to climatic variation, or institutional, meaning it is due to social, ethnic, and cultural factors. As to the natural causes of seasonality, cruise tourism has a great ability to alter the level of seasonality in tourist destinations due to its intrinsic characteristic of geographical mobility, which is why these causes can either be reduced or avoided based on the itineraries that are programmed. As Brida and Risso (2010) noted, cruise ships represent the paradigm of globalization as they produce passenger and capital mobility without international regulations. For this reason, knowing the levels of seasonal concentration in the ports where cruise passengers arrive is crucial to balance seasonality. Accordingly, cruise itineraries can be established between different ports with different seasonal profiles to contribute to the reduction of seasonality in each region. Although there are some studies that have investigated the economic impact of cruise itineraries, as far as we know, there is not any research that analyzes the possible deseasonalizing impact that they can have in the regions where the ports are located. Recently, Lee and Ramdeen (2013) investigated the effect of cruise itineraries on cruise occupancy rates; from this work, one could deduce results on seasonality within cruise ships, which is useful information for cruise companies. Nevertheless, the seasonality produced by these ships in the ports and regions remains unknown, and this is crucial information for tourism and port managers.
As Lekakou, Pallis, and Vaggelas (2009) noted, cruise companies tend to select itineraries that include attractive destinations because passengers’ satisfaction is one of the main criterion cruise companies have when choosing homeports in Europe. According to Sanz Blas and Carvajal-Trujillo (2014), satisfaction is a very important factor because it is an antecedent to loyalty, in other words, the passengers’ intent of either returning or recommending to friends and relatives the destination where the port is located. However, a factor that is going unnoticed by cruise lines during the process of choosing ports for their itineraries is the seasonality within the ports. High levels of seasonal concentration can affect the satisfaction and loyalty of cruise passengers, who usually flee from the masses. The cruise market in the Mediterranean is favored for developing itineraries that can contribute to reduce seasonality in the regions since this zone allows innovative itineraries to be establish within a relatively small area (McCarthy 2003).
Seasonality Measurement in Cruise Tourism
Despite the interest in cruise tourism and the implications that the phenomenon of seasonality can have in planning and management, there are not many significant methodological advances in the use of specific analytical tools for studying seasonality in cruise tourism. Although this segment is subject to significant seasonal variations affecting both supply and demand (Charlier and McCalla 2006), its study is frequently limited to a description of the distribution of demand in some reports (see MedCruise 2017). Concerning the urban planning and the revitalization of port destinations, McCarthy and Romein (2012) analyzed the advantages and drawbacks generated by the recent increase of cruise passengers in the cities of Amsterdam and Rotterdam. More recently, De Cantis et al. (2016) in their work carried out a segmentation of cruise passengers with the objective of identifying the behavioral and mobility pattern of passengers in the port of Palermo by using GPS technology along with traditional techniques such as surveys.
From a methodological viewpoint, traditionally, most of the studies analyzing the seasonality in tourism used techniques based on a description of the seasonal patterns by applying seasonal factors (Fernández-Morales 2003), without evaluating the annual level of seasonal concentration with some measure, such as the Gini and Theil indexes, or the coefficient of variation. This still happens in some current research (see Ridderstaat et al. 2014). Having available annual indicators of the degree of seasonal concentration can be a helpful tool for monitoring policies against seasonality by analyzing the evolution of this phenomenon in specific segments and destinations. However, an annual seasonal concentration indicator, such as the Gini index, has had a very limited impact on the cruise industry. Wanhill (1980) was the first author to use the Gini index in the field of tourism. Since then, this index has been the annual concentration measure most used in the analysis of the seasonal concentration of tourism demand; for example, it is worth highlighting the recent works of Coshall, Charlesworth, and Page (2015), Fernández-Morales and Cisneros-Martínez (2015), and De Cantis, Ferrante, and Vaccina (2011). One of the main advantages of the Gini index is that it is a measure that takes into account the skewness of the distribution, and it is less influenced by extreme values than other concentration values (Yacoumis 1980). However, just a few authors have used in their works one of the annual concentration measures to evaluate seasonality in cruise tourism. For instance, in the work of Fernández-Morales and Martín-Carrasco (2015), the Gini index was used to evaluate the seasonal impact of cruise tourism in the hotel sector of the city of Málaga. Esteve-Pérez (2014) also used the Gini index and the coefficient of variation to analyze the evolution of the interannual seasonality of cruise traffic in the ports of the Mediterranean and Atlantic Coast of Andalusia.
Recently, more complete methodologies to analyze seasonality in cruise tourism have been proposed, combining different multivariate techniques with annual seasonal concentration measures. The first time a combination of these techniques was used in this field is found in the work of Fernández-Morales and Mayorga-Toledano (2015) that analyzes the seasonality of cruise tourism in Spanish ports. These authors used the Gini index and seasonal variation indexes along with multivariate techniques, such as principal components factor analysis and cluster analysis. In the same vein, in the work of Esteve-Pérez and Garcia-Sanchez (2017), the coefficient of variation was added to the combination of techniques and indexes mentioned to identify the interannual changes in the seasonality of Spanish Mediterranean ports.
The situation described above suggests that new and more complex methods are still required in this field to capture the particularities of the cruise tourism sector.
Methodology
Data Sources and Variables
CLIA Europe has traditionally been the greatest information source for the European cruise market. This association provides quantitative information on the movement of cruise passengers by producing reports on the economic impact the cruise industry has in Europe. However, the data provided in these reports are on an annual basis and, therefore, insufficient for studying seasonality, since to analyze this phenomenon, data series with periodicity less than a year (quarterly, monthly, etc.) are required. Fortunately, MedCruise (created in 1996) has pioneered an initiative to elaborate reports that quantify the movement of cruise passengers in the Mediterranean regions since 2011 using quarterly data, thus resolving the data issue. These reports (known as Cruise Activities in MedCruise Ports) are very useful for research on cruise tourism seasonality since they include quarterly series of cruise passengers’ arrivals to most ports in Southern Europe. The information sources that comprise these series are port authorities who oversee cruise passenger arrivals in each port.
This research analyzes the seasonality of cruise tourism in the Mediterranean, an area characterized by high seasonality in the summer months. The variable used in the analysis was the number of cruise passengers (by trimester) in each port, which come from the data published by MedCruise in their Statistics Reports corresponding to the period 2010–2016 (MedCruise 2011, 2012, 2013, 2014, 2015, 2016, 2017). The year was divided into four quarters: March–May, June–August, September–November, and December–February.
The geographical classification of the ports used in this study was elaborated by MedCruise 1 :
■ Western Mediterranean: Alicante, Almería, Azores, Balearic Islands, Barcelona, Bastia/North Corsica, Cagliari, Cartagena, Civitavecchia, French Rivera Ports, Genoa, Gibraltar, La Spezia, Lisbon, Livorno, Madeira Ports, Málaga, Marseille, Messina, Monaco, Motril, Naples, North Sardinian Ports, Palamós, Palermo, Portimao, Portoferraio, Portofino, Savona, Sète, Tenerife Ports, Toulon-Var Provence, Tunisian Ports, Valencia, and Valletta.
■ Adriatic Sea: Ancona, Bari, Brindisi, Corfu, Dubrovnik, Koper, Kotor, Ravenna, Rijeka, Sibenik, Split, Trieste, Venice, and Zadar.
■ Eastern Mediterranean: Alanya, Cyprus Ports, Egyptian Ports, Heraklion, Istanbul, Kusadasi/Bodrum/Antalya, Piraeus, Souda/Chania, Thessaloniki, and Volos.
■ Black Sea: Constantza, Odessa, and Sochi.
Analytical Techniques
The seasonality analysis in this article was performed in two steps: (1) by estimating the seasonal patterns of cruise tourism and classifying the ports into homogeneous groups using a cluster analysis technique, bootstrapped bagged clustering; and (2) by assessing the seasonal concentration levels by ports and regions, obtaining the elements of the Gini index decomposition by regions, and using a data visualization technique, the biplot, to ease the interpretation. Below we briefly describe the techniques used in each step.
Step 1: Seasonal patterns estimation and classification of ports by bootstrapped bagged clustering
To identify the seasonal patterns of each port, the estimation of the seasonal factors was performed using the moving average ratios procedure within the multiplicative decomposition approach, one of the most used techniques in classical time series analysis (Makridakis, Weeelwright, and Hyndman 1998). If the Yt series could be decomposed into the product of four components: trend, cycle, seasonal, and residual, respectively, Yt = Tt · Ct · St · Rt, then the seasonal components St are obtained as ratios for each value in the series with respect to the corresponding moving average, and they are averaged to obtain a seasonal variation index for each quarter, Ft, t = 1, 2, …, 4.
These indexes represent the intensity of the seasonal phenomenon in each quarter and are interpreted as the proportional deviation, expressed as a decimal, of the observed cycle trend (Makridakis, Weeelwright, and Hyndman 1998; Cuccia and Rizzo 2011; Lo Magno, Ferrante, and De Cantis 2017). In this article, the equivalence of the seasonal factors with the seasons of the year is as follows: F1 = spring (March, April, and May), F2 = summer (June, July, and August), F3 = autumn (September, October, and November), and F4 = winter (December, January, and February). In addition, to make the interpretation of the results easier, the following classification was chosen: low season (F < 1), medium season (1 ⩽ F <1.5), and peak season (F ⩾ 1.5).
Once the seasonal patterns for each of the ports analyzed were obtained, a cluster analysis was applied; the aim was to group the ports with a similar seasonal behavior. Cluster analysis techniques have been traditionally applied in tourism analysis to classify individuals in order to obtain market segmentation. In this field, there have been abundant contributions mentioned in the reviews of Dolnicar (2002), Ernst and Dolnicar (2018), and Zins (2008). However, these techniques can be of great interest in tourism research to obtain classifications of other elements such as hotels or other types of accommodation (Claver-Cortés, Molina-Azorín, and Pereira-Moliner 2007; Albaladejo Pina and Díaz Delfa 2005), tourist attractions (Shoval and Raveh 2004; Kim, Cheng, and O’Leary 2007), or even counties (Spotts 1997), islands (McElroy and Albuquerque 1998), or countries (Ferrante, Lo Magno, and De Cantis 2018; Kayar and Kozak 2007). In this sense, cluster analysis techniques may also be suitable for one of the objectives of this work: obtaining homogeneous groups of cruise ports according to the seasonal characteristics of their demand.
Traditionally, cluster analysis techniques are divided into hierarchical and nonhierarchical, or partitioning ones (Fernández-Morales 2015). Partitioning methods in general, and in particular k-means—the most widely used non-hierarchical technique in tourism studies—require the number of groups to be established in advance (Prayag et al. 2015); these are based on subjective preferences or because of a previous hierarchical clustering. This is the main disadvantage of partitioning methods. In addition, although there are several validity measures available, there is not a method generally accepted for selecting the optimal number of clusters (Brida, Disegna, and Osti 2012). In contrast, hierarchical methods iteratively create clusters by joining the closest (most similar) elements or clusters until the entire population is classified by using an agglomerative algorithm (or splitting the population into groups by using a divisive algorithm). In the field of tourism research, Ward’s method is the most commonly used (Masiero and Nicolau 2012). Several of the disadvantages and limitations of hierarchical clustering methods have been mentioned in the literature: presupposing a hierarchical structure, difficulties to handle large data amounts, or high sensibility to the presence of outliers.
More recently, new clustering techniques that combine these two types have been proposed, among which stands out the bagged clustering. When compared to the traditional clustering algorithms, the main advantage of bagged clustering is that it is less dependent on the initial conditions of the classification algorithm, and thus, its results are more stable because of the resampling method used (Dolnicar et al. 2008; Dolnicar and Leisch 2004; Leisch 1999). Furthermore, Prayag et al. (2015) state that it is not necessary to impose the number of clusters in advance, and that this method is more flexible and performs better with large data sets than the hierarchical methods, which is another advantage.
Bagged clustering has been used by some authors in tourism research; for example, Dolnicar and Leisch (2000, 2003, 2004) used it to identify behavioral market segments on the basis of vacation activity information in Austria, and Dolnicar et al. (2008) to obtain consumer segments based on the holiday activity according to consumers’ budget on several expenditure categories including tourism-related ones; Brida, Disegna, and Scuderi (2013) used bagged clustering to segment Christmas markets visitors in Italy, and Prayag et al. (2015) to segment Chinese travelers to Europe. These authors mention that with the bagged clustering method it is easier to identify niche segments than with classical algorithms such as k-means. Considering the studies carried out in the field of tourism and the advantages offered by the bagged clustering method, we have used this technique to obtain homogeneous classifications of the ports according to the seasonal behavior of their demand of cruise passengers, which is one of the objectives of this work. Furthermore, one also has to take into account the fact that in the present study, the number of groups was not available in advance and that the bagged clustering offered a more stable classification than other classical techniques.
The bagged clustering method begins by bootstrapping the original sample (of size N) to obtain a set of B training samples. The bootstrap training samples (each one of size N) are constructed using sampling with replacement from the original sample. The partitioning algorithm or base method is then applied to these training samples to obtain stable centers, if they exist. The partition algorithm divides each training sample in K groups, calculating their respective centers so K × B centers are obtained. After this stage, a hierarchical algorithm is applied to the set composed of all the centers to obtain a dendrogram. Finally, the original data are classified according to their distance from the centers on the dendrogram at the desired level. In this work, we used the k-means algorithm as base method, with 20 centers and 50 training sets (as Dolnicar and Leisch 2000). Hence, 1000 centers were hierarchically clustered in the following stage. For this stage, the Ward method was used with the Euclidean distance as a dissimilarity measure. The choice on the number of clusters is based on the changes in the relative distance at which each split occurs in the hierarchical algorithm, and on two measures of internal validity: the silhouette and Calinski-Harabasz indexes (Rousseeuw 1987; Calinski and Harabasz 1974). In accordance with these criteria, a classification with 5 clusters was obtained.
Step 2. Decomposition of the Gini index of seasonal concentration and visualization with biplots
The Gini index is obtained as the single annual measure of the seasonal concentration in each port and region. The main reason for choosing the Gini index to analyze the seasonality in this study is that unlike other annual concentration measures, its additive decomposition allows the estimation of marginal relative effects, which makes it possible to identify the most propitious ports for reducing seasonality within the regions analyzed.
Although there are several calculation formulas for the Gini index as a measure of seasonal concentration, we used the covariance formula already applied by several authors, such as Pyatt, Chen, and Fei (1980) or Lerman and Yitzhaki (1985). The greater this index is (which ranges from 0 to 1), the more important is the degree of concentration of the variable in a reduced number of temporary units, quarters in the case of this study.
The Gini index made it possible to quantify the degree of seasonal concentration of cruise tourism demand in each given year. More specifically, it allowed to identify those years in which seasonality had increased or decreased, and it could provide important and interesting information to evaluate the effectiveness of policies against seasonality.
The Gini index admits different decomposition possibilities from the ones developed by Shorrocks (1982) or Dagum (1997). In this work, we used the decomposition developed by Lerman and Yitzhaki (1985), originally used in the field of economic inequality, which is one of the most frequently used in tourism seasonality research. In this field, it was first used by Fernández-Morales and Mayorga-Toledano (2008), who decomposed the hotel demand in the Costa del Sol (Spain) and identified the seasonal effect of visitors by nationalities. The decomposition has afterwards been used by other authors to identify the seasonal effects of certain tourist segments such as cultural tourism on the coast of Andalusia (Cisneros-Martínez and Fernández-Morales 2015) and social tourism on the Spanish Mediterranean coast and islands (Cisneros-Martínez, McCabe, and Fernández-Morales 2018). In addition, it has been used to decompose tourism demand in the main provinces of Spain (Duro 2016), the United Kingdom, and England (Fernández-Morales, Cisneros-Martínez, and McCabe 2016) and to decompose passenger demand at Spain’s main airports (Halpern 2011). Recently, Lau, Koo, and Dwyer (2017) developed a different Gini decomposition to analyze the geographic dispersion of tourism activity.
The main advantage of the decomposition proposed by Lerman and Yitzhaki, aside from providing an easier interpretation of the Gini index components, is that it facilitates the estimation of the Relative Marginal Effect for each port k (RMEk). By obtaining the RMEk, it is possible to identify the most propitious ports for reducing seasonality within the regions analyzed. This decomposition could be a very useful tool for tourism and port managers when establishing measures to reduce seasonality since the estimation of the RMEk will allow them to know how the proportional changes that occur in the number of passengers for each port will influence in the total concentration level of each region.
For each quarterly series Y with K additive components (Y = X1 + X2 + · · · + Xk), the decomposition of the Gini index of Y, G, proposed by Lerman and Yitzhaki (1985), is used in this article:
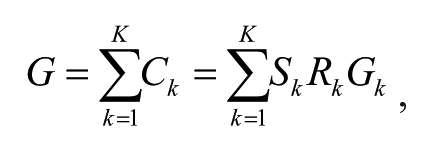
where Gk is the annual Gini index of the component Yk, Sk is the annual share of Yk in the annual value of Y, and Rk represents the Gini correlation index between Yk and Y (Rk = cov(Yk, F)/(Yk, Fk), Fk being the distribution function of Yk). As the Gini index generally ranges from 0 to 1, a Gk value close to 1 indicates a higher seasonality of component Yk, and a value close to 0 points to a lower seasonality. On the other hand, the Gini correlation Rk ranges from −1 to +1. Rk values close to 1 indicate a seasonal distribution of Yk, very similar to that of Y, while negative Rk values close to −1 are obtained when the seasonal distribution of Yk is almost the contrary. Therefore, each component Yk contributes to the total Gini index, G, with the product of Sk, Rk, and Gk, which is often referred to as the contribution of Yk to G, Ck. Furthermore, since Sk and Gk are always greater than 0, the sign of the contribution of each element Yk to the total Gini index G depends on the sign of Rk.
Among the most interesting advantages of this decomposition is the fact that it makes the estimation of the RMEk, easy to calculate following:
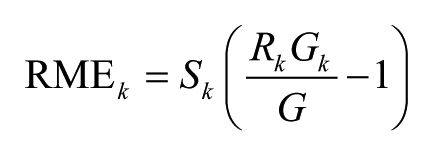
The RMEk quantifies in relative terms how the overall Gini index increases or decreases when a small relative increase occurs in the demand of a given port. More specifically, the RMEk can be interpreted as the percentage variation of the overall Gini index for a given region when the number of passengers from a port increases by 1%, keeping constant their distribution and the distribution of the rest of the cruise passengers. The sum of the RMEk must be equal to 0.
To help have a better understanding of the results, a threshold value was considered in each of the three elements of the Gini index decomposition (Gk, Sk, and Rk). The threshold value for Gk is 0.25, so the level of concentration of port k is high when Gk ⩾ 0.25 and low when Gk < 0.25. The threshold values for the rest of elements are 0.25 for port k market share (Sk) and 0.50 for the Gini correlation between port k and the total region demand (Rk). Likewise, the propitious ports for reducing seasonality are those with RMEk < 0 and the unpropitious ones, those with RMEk ⩾ 0.
To graphically display the Gini index decomposition components, along with the RMEk, a multivariate graphical technique—the biplot—was used, in order to help classify the different ports with similar characteristics. With this technique, both the observations and the variables can be represented in a set and in a two-dimensional space, maintaining the approximate distance between the observations (Rencher and Christensen 2012, 580).
Results
Seasonality of Cruise Tourism Demand in Mediterranean Regions
Before proceeding with the analysis by ports, the seasonal concentration of the Mediterranean regions was studied. Figure 1 shows the number of cruise ship arrivals along with the seasonal factors, the Gini index, and the RMEk calculated for each region.

Cruise tourism demand: Absolute values, seasonal factors, Gini index; and RME.
Most of the cruise passenger demand (70%) is concentrated in the Western Mediterranean region, with more than 17 million cruise passengers in all the years analyzed, largely because it is the region with the highest number/set of ports. However, the Western Mediterranean is the region with the lowest seasonal concentration with a medium season (1 ⩽ F < 1.5) that runs from spring to fall. In this region, as in all the other regions, the low season is in the winter months. The rest of the demand is distributed in the ports of the Adriatic Sea (17.5%), the Eastern Mediterranean (12.1%), and the Black Sea (0.4%). Regarding the seasonal distribution, as can be seen in the seasonal factors graph in Figure 1, the Adriatic and Black Sea regions are the ones with the highest seasonal concentration, showing an accentuated peak season in the summer and autumn seasons. Meanwhile, the Eastern Mediterranean presents a smoother peak season in those seasons.
As for the annual seasonal concentration, the Western Mediterranean is also the region with the lowest seasonal concentration and Gini index values over the period analyzed (G ≈ 0.20), as shown in the evolution of the Gini indexes in Figure 1. The remaining regions present an average annual concentration at the beginning of the period until 2014 when a point of inflection takes place. The Black Sea had a high concentration in 2015 and 2016, and the Eastern Mediterranean gradually descended towards a low concentration in those years. Finally, according to the relative marginal effects over the total Gini index shown in the RMEk graph in Figure 1, the regions more propitious for reducing seasonal concentration in the Mediterranean, with negative RMEk in the set of regions analyzed, are the Western Mediterranean, the Eastern Mediterranean, and the Adriatic Sea, respectively.
Seasonality of Cruise Tourism Demand in Mediterranean Ports by Clusters
The ports were grouped according to their seasonal patterns given the significant heterogeneity revealed in the major regions of the Mediterranean. Each of the ports analyzed was classified using the bagged clustering technique according to the average relative distribution of cruise passengers in each quarter across the whole period. Figure 2 shows the dendrogram resulting from the application of the described algorithm of bagged clustering (the higher part of the figure) and the relative distance to which the first 20 clusters join (the lower part). In this last one, the first difference in distances, which are represented in black, has been added in gray. The number of clusters was selected according to (1) the relative peak in the plot of the first differences in the relative distance at which each cluster is joined in the hierarchical algorithm (lower part of Figure 2), which occurs at 5 in the horizontal axis, and (2) the silhouette and Calinski-Harabasz indexes, both showing a relative maximum for 5 clusters (0.4008 and 41.74891, respectively). As a result, five clusters containing several ports located in different regions but with similar seasonal patterns were identified; these clusters do not coincide with the usual regional division made of the Mediterranean (Figure 2).

Dendrogram and relative distance by number of clusters (2-20). 2
The application of this methodology reveals that there are some homogeneous groups of ports (clusters) with similar stable seasonal patterns. To understand better the seasonal particularities of each cluster, Figure 3 shows the seasonal factors (F) for ports grouped by cluster by indicating the region in which each of the ports are located.
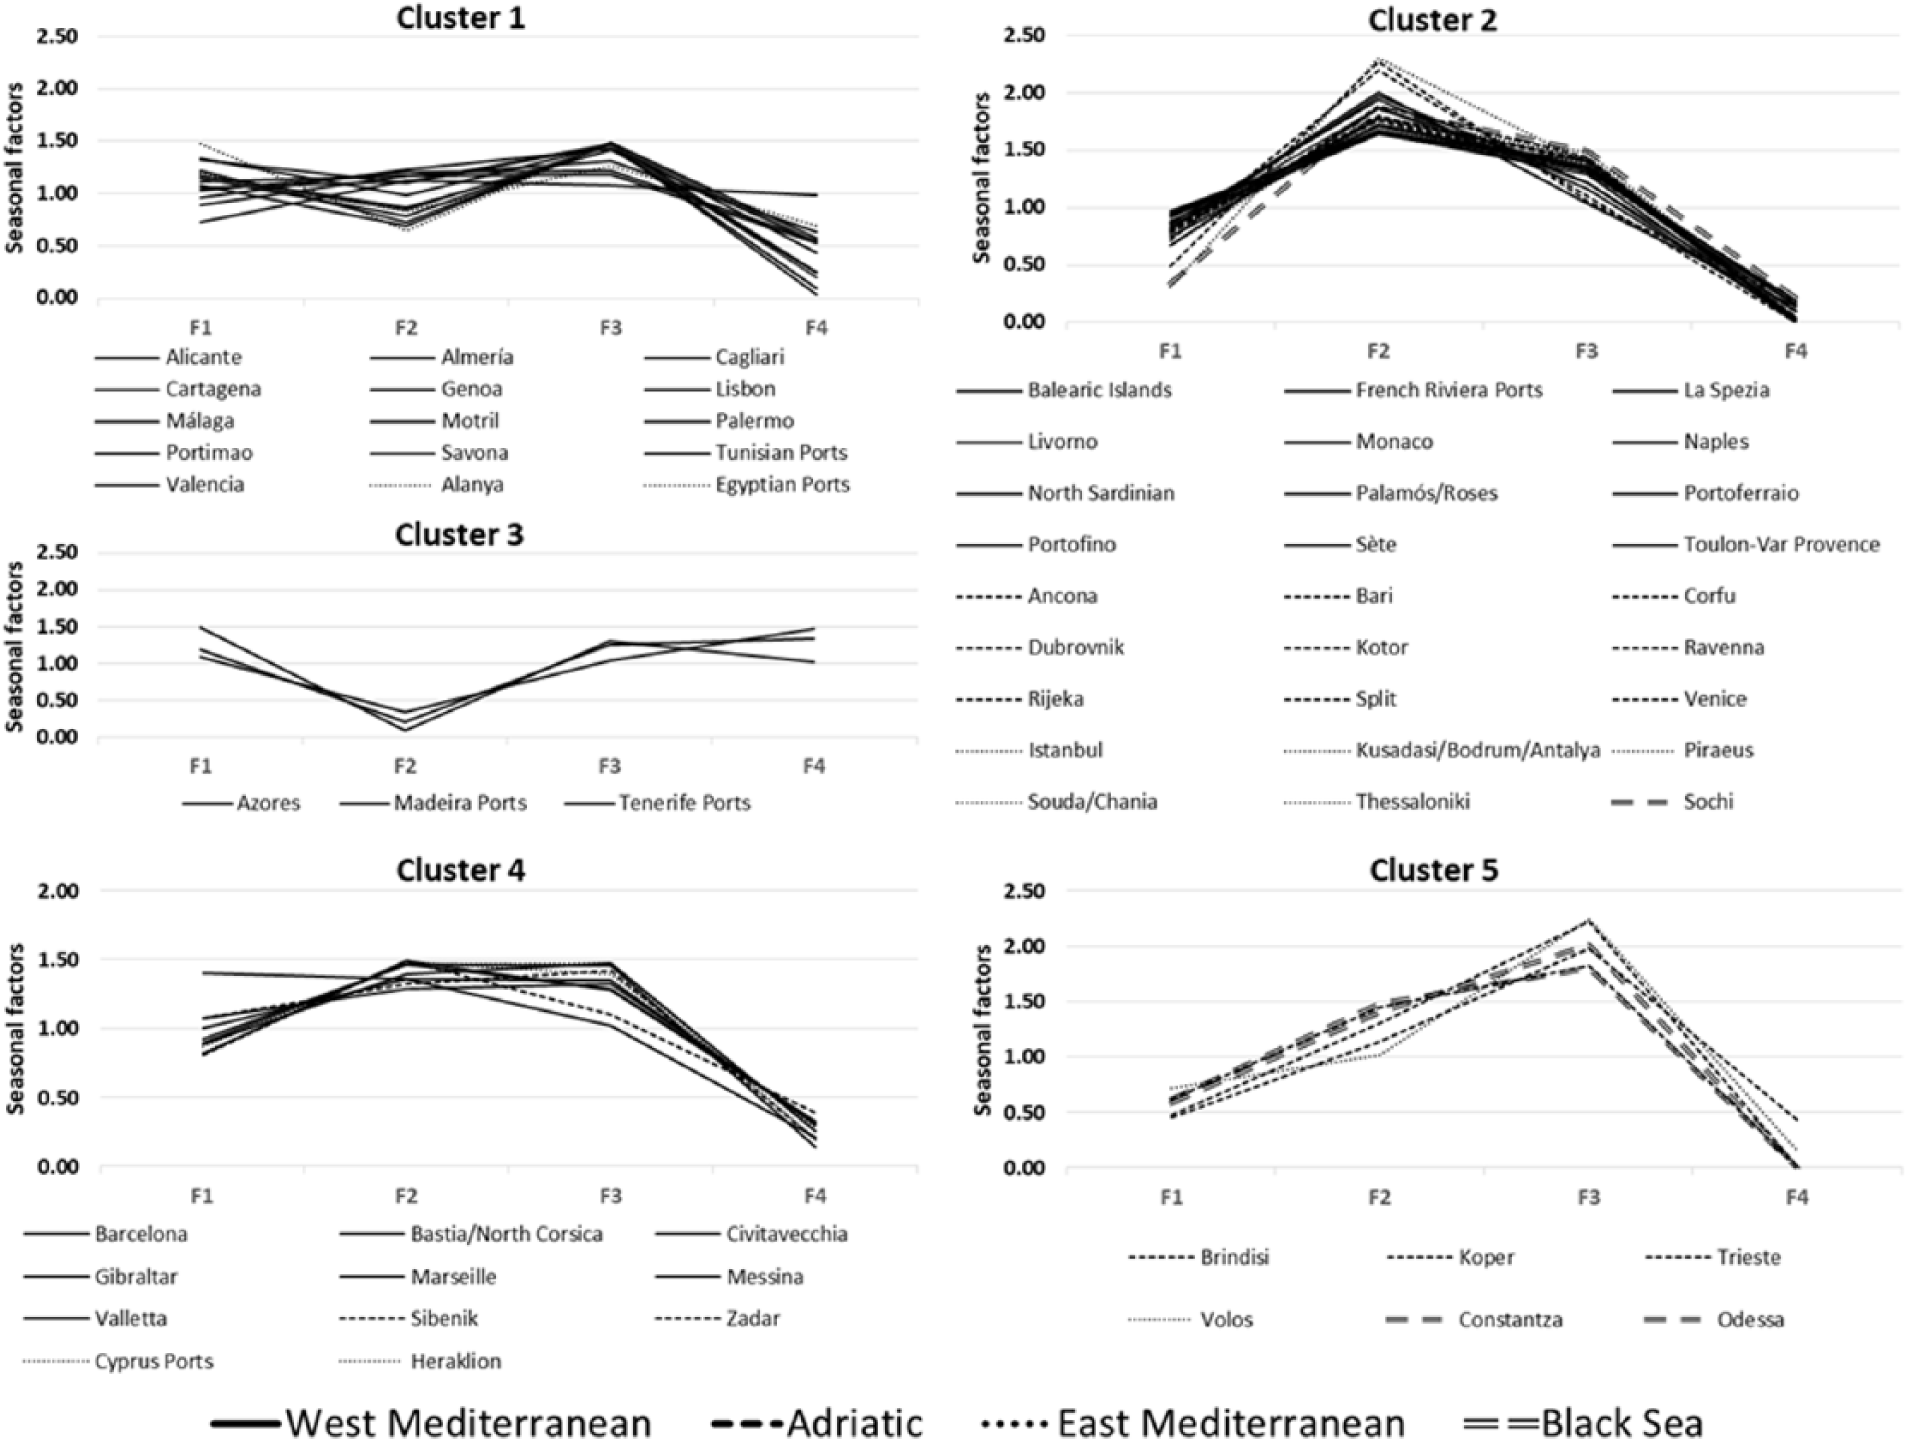
Seasonal factors of ports by cluster.
In general terms, the ports present some similarities with regard to the seasons. The low season is in winter (F4) in all ports, except for the ports in cluster 3. Moreover, a medium season is observed in autumn (F3) in all the ports analyzed, except for the ports in cluster 3, whose medium season is in winter. And there is a high season only in cluster 2 in summer and cluster 5 in autumn.
In order to provide useful information for reducing seasonality, we have also identified the seasons with lower demand in each cluster. These are the low seasons in clusters 1, 3, and 4 and the low and medium seasons in clusters 2 and 5. Therefore, to synthesize this information by cluster, the lower demand is observed in the following seasons:
Cluster 1: Spring (low season only in the cases of Almería, Tunisian Ports, and Valencia), summer (low season only in the cases of Alicante, Cagliari, Lisbon, Málaga, Savona, Alanya, and Egyptian Ports), and winter (low season).
Cluster 2: Spring and winter (low season), and fall (medium season).
Cluster 3: Summer (low season).
Cluster 4: Spring (low season only in the cases of Barcelona, Civitavecchia, Messina, Valletta, Sibenik, Cyprus Ports, and Heraklion), and winter (low season).
Cluster 5: Spring and winter (low season), and summer (medium season).
To contextualize the seasonal patterns of the clusters studied based on the geographical location of their ports, Figure 4 has been elaborated. The map on this figure allows us to obtain some very interesting results. Although the Mediterranean regions are distributed from west to east (the Western Mediterranean, the Adriatic Sea, the Eastern Mediterranean, and the Black Sea), the clusters identified are generally located from north to south (cluster 5, cluster 2, cluster 4, cluster 1, and cluster 3). The ports in cluster 5, with a peak season in autumn, are those located further north to the Adriatic Sea (Trieste and Koper) and the Black Sea (Odessa and Constanza). The ports of Volos and Brindisi, located at an intermediate latitude, also belong to this cluster. Cluster 2 contains the largest number of ports, covering ports in all the Mediterranean regions. Most of these ports, with a high seasonality, are located at an intermediate latitude. The ports classified in cluster 4 are in two different latitudes: a superior one (Palamós, Barcelona, Marseille, Bastia/North Corsica Ports, Civitavecchia, Zadar, and Sibenik) and a lower one (Gibraltar, Messina, Valletta, Heraklion, and Cyprus Ports). Aside from Gibraltar, all the ports located at a lower Mediterranean latitude are in cluster 1, where all ports have a medium and peak season in autumn and (in most of them) a low season in summer. Finally, the ports classified in cluster 3 (located in the Macaronesian islands) have the lowest seasonality of all the ports analyzed in the summer months.
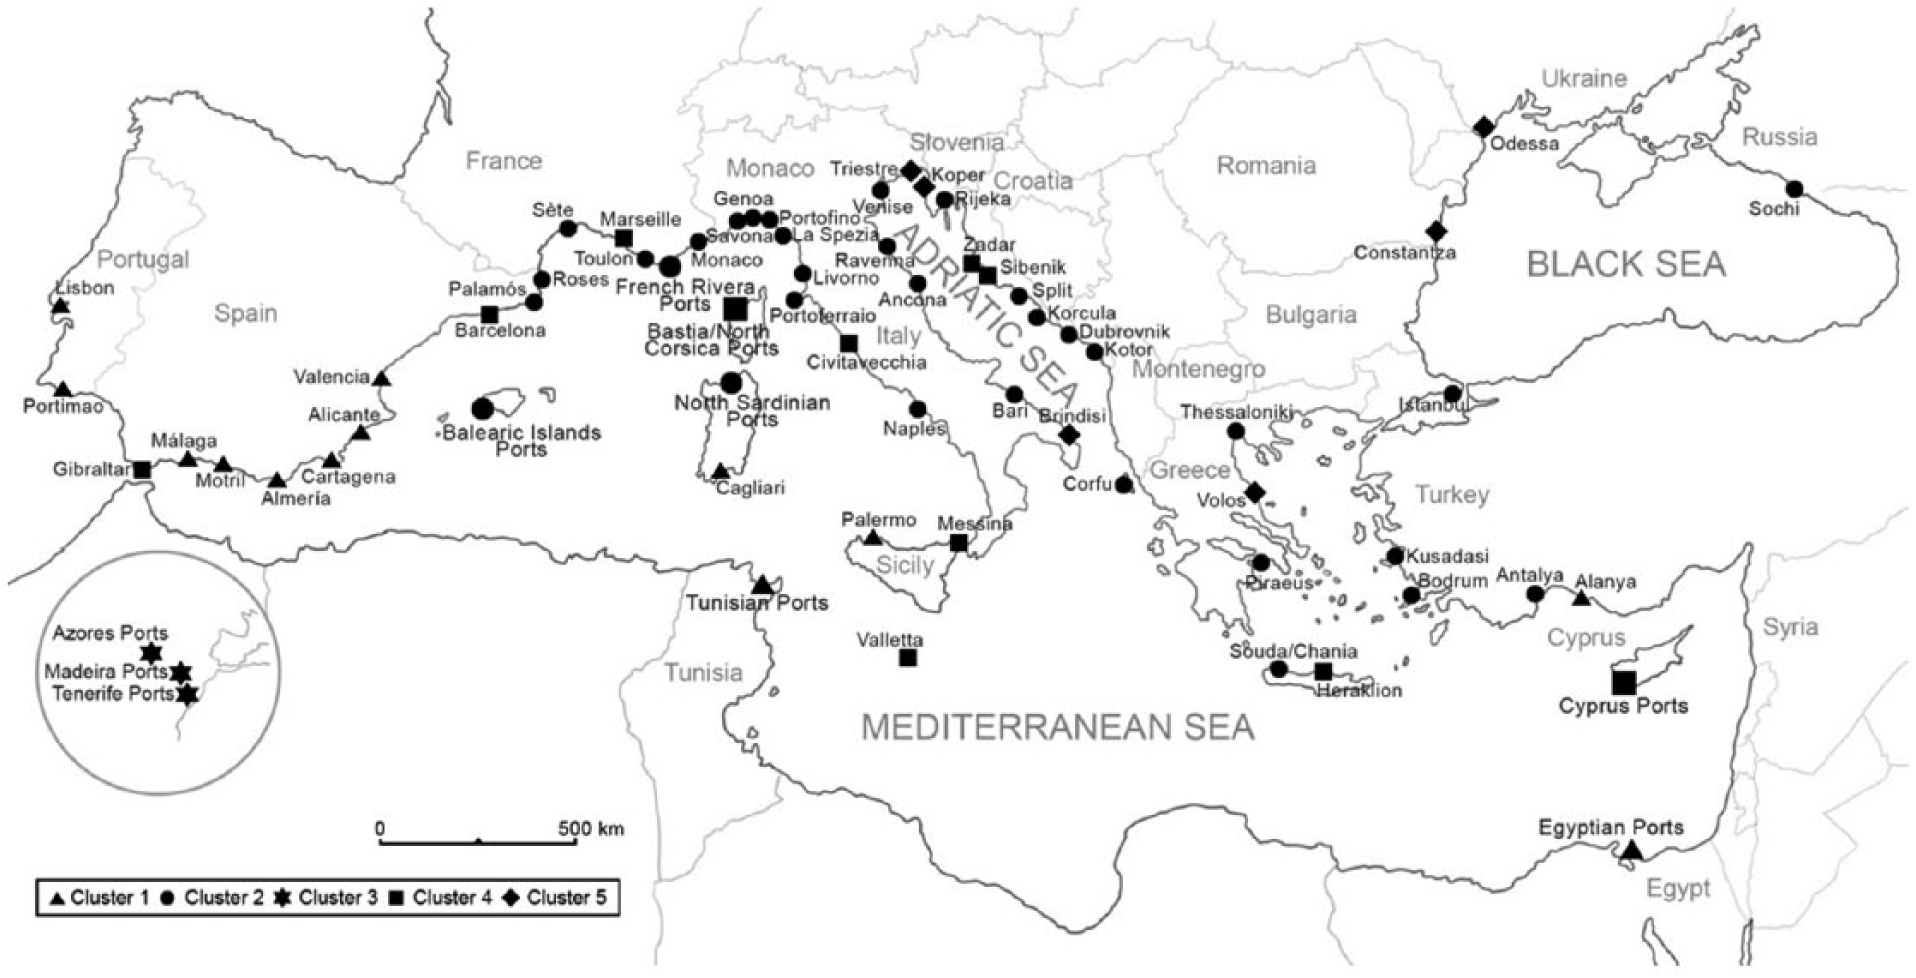
Map of Southern Europe showing the location of the ports analyzed.
The general tourist demand on the Mediterranean coasts is usually concentrated in the summer months, as confirmed by numerous studies. Thus, in the ports grouped in cluster 2, the high season of cruise tourism is superimposed on the general tourist high season that takes place on the areas where the ports are located. Some works, such as those of Manera, Garau, and Serrano (2016), which include Sardinia and Balearic Islands or Rutin (2010) on Coastal Croatia, confirm that the seasonal concentration of general tourist demand takes place in the summer months. However, in ports on other clusters, the tourist demand for cruises complements the general tourist demand and has a different distribution. For example, ports on cluster 5 have their high season in autumn and, thus, they complement the general tourist seasonality concentrated in summer. Similarly, this occurs for example on the Slovenian coast according to the work of Šegota and Mihalič (2018) where the general tourist demand is concentrated in August and July.
We also observe seasonal distributions of cruise tourism different from the total tourist distribution in ports from cluster 1 and 4. Some works, such as Manera, Garau, and Serrano (2016), which also includes Corsica and Malta with ports in cluster 4, Ruggieri (2015) for Cyprus, or in the mentioned study of Cisneros-Martínez, McCabe, and Fernández-Morales (2018), for the Spanish coasts, which include areas of several ports in cluster 1 (Malaga, Motril, Alicante, Cartagena, Valencia, and Almeria), and Barcelona, whose port is located in cluster 4, confirm the seasonal concentration of general tourist demand in the summer months.
Finally, ports in cluster 3 can also balance the general seasonal tourist scheme of the areas where they are located, which is usually concentrated in the summer season. However, in these cases, the seasonal concentration of both distributions is so low that this effect may have little relevance.
Since seasonal factors were calculated with the mean of all the years analyzed, it was necessary to supplement this information with an annual concentration measure to analyze the concentration levels in each of the observed years. Therefore, the decomposition of the Gini index was used in the following section, where the RMEk provided information on the propitious ports to reduce seasonality.
Estimation and Decomposition of the Seasonal Concentration of Ports by Region
Once the seasonal patterns of each cluster were studied, the decomposition of the Gini index was applied to study whether the levels of seasonal concentration differ in the regions analyzed. The additive decomposition of the Gini index provided information on each port’s contribution to the total seasonal concentration of their region. To synthesize the results, Table 1 shows the averaged results of the Gini index decomposition for the years analyzed (2010–2016) because the annual variations observed in these years were scarce.
Decomposition of the Gini Index Calculated by Regions and Sorted by Cluster (2010–2016 Average).

Source: Generated by the authors based on data from MedCruise Reports.
Note: A value of 0.00 indicate a magnitude lower than 0.005.
High (bold): Gk ⩾ 0.25; low (regular): Gk < 0.25.
High (bold): Sk ⩾ 0.10; low (regular): Sk < 0.10.
High (bold): Rk ⩾ 0.50; low (regular): Rk < 0.50.
A high Gini index for a port (Gk) means that there is a high annual concentration of cruise passengers in the port, which is consequently determined by the concentration level in each of the seasons identified by the seasonal factors. However, the contribution of a port to the seasonal concentration of a region requires a more in-depth analysis. A port with a high Gini index that also shows high levels of annual participation in the total regional demand of where it is located (Sk), and in the level of Gini correlation between the port and the Gini of its region (Rk), contributes to a higher Gini index for the region (G). In other words, the region’s annual seasonal concentration is higher. On the other hand, a port with a high seasonal concentration (Gk) can be adequate for redirecting the flow of passengers to mitigate the effects of seasonality for that region during its low season if the port has low or negative Rk.
All the ports in clusters 2 and 5 had a Gk ⩾0.25 (i.e., a high seasonal concentration). From these results, we understand that there is a greater difference between the volume of demand in spring and winter (a low season according to the seasonal factors) and the rest of the seasons. All the ports in these clusters had a high Rk level (except for Kotor and Piraeus), which means that their annual seasonality patterns are highly correlated with their region’s annual seasonal pattern. In addition, in these clusters we only found two ports with a high level of Sk (i.e., they had a larger share of the region’s total demand). In cluster 2, these ports were in the Adriatic Sea (Bari, Corfu, Dubrovnik, and Venice), the Eastern Mediterranean (Kussadasi/Bodrum/Antalya and Piraeus), and the Black Sea (Sochi). In the case of cluster 5, they were in the Black Sea (Constantza and Odessa). Unlike the other clusters in which only low and medium seasons were identified, clusters 2 and 5 manifested a high season as well. Therefore, although the first objective would be to direct the demand of cruise passengers toward seasons during the year in which the low season takes place, in clusters 2 and 5, it would also be appropriate to direct part of the demand to those periods in which a medium season was identified (winter in cluster 2 and summer in cluster 5).
In cluster 1 and 4 (the low season occurred in winter and extended up to spring in some of the ports), some ports with a high Gk and Rk level were identified. In the case of cluster 1, these ports were in the Western Mediterranean (Almería, Cartagena, Motril, Portimao, Tunisian Ports, and Valencia); and in the case of cluster 4, they were in the Western Mediterranean (Bastia/North Corsica, Civitavecchia, Messina and Valletta), the Adriatic Sea (Sibenik and Zadar), and Eastern Mediterranean (Cyprus Ports and Heraklion). In the case of cluster 3, with a negative Rk in the ports of the Macaronesian islands, a very peculiar case occurred since the correlation of the Gini index of these ports was high but in the opposite direction. In this cluster, the low season was identified in the summer, and there was only a high concentration (Gk = 0.38) in the Azores ports even though the correlation of the Gini index of this port with the total Gini index of the region (Rk) was negative, meaning that the correlation is in the opposite direction; in other words, the demand of this port takes place in a different season than the overall pattern of its region. Therefore, in this case, it would not be a recurring port to direct the demand in the summer season, but simply increasing the demand in its current monthly distribution.
With this information, the ports identified with low season (or medium season as in the case of clusters 2 and 5) and with a Gk ⩾0.25 meet the requirements to be included in the itineraries of the cruises (during seasons of low demand) to reduce seasonality. If, in addition, these ports have an elevated Sk and/or Rk, the impact of the index on the Gini index of the region is even greater. Nonetheless, it would have been interesting to determine the RMEk of the period, especially for the last year analyzed, to see to what extent a port can help reduce the seasonal concentration of the region it is located (i.e., those ports in which cruise tourists are less prone to seasonality). By analyzing the evolution of RMEk throughout the studied period, especially the last year, tourism managers could tailor tourism policies designed to alleviate the yearly seasonal concentration; they could anticipate how each year would contribute to an increase of the demand in a port in order to reduce the overall Gini index that was previously used to measure the degree of seasonal concentration in the regions.
The ports that obtained negative RMEk in all the years observed, or in most of them, are shown in Figure 5. Therefore, they were considered propitious ports for reducing seasonality in their regions, whereas the ports with positive RMEk were unpropitious ports, and they are not represented in the figure. The RMEk of the ports were represented according to the region in which each port is located. Also, the cluster to which they belong has been identified in the legend. This way we can identify the ports that have a cruise tourism demand that can help reduce the seasonal concentration of this segment in their region (because of its negative RMEk) as well as observe to which cluster they belong to.
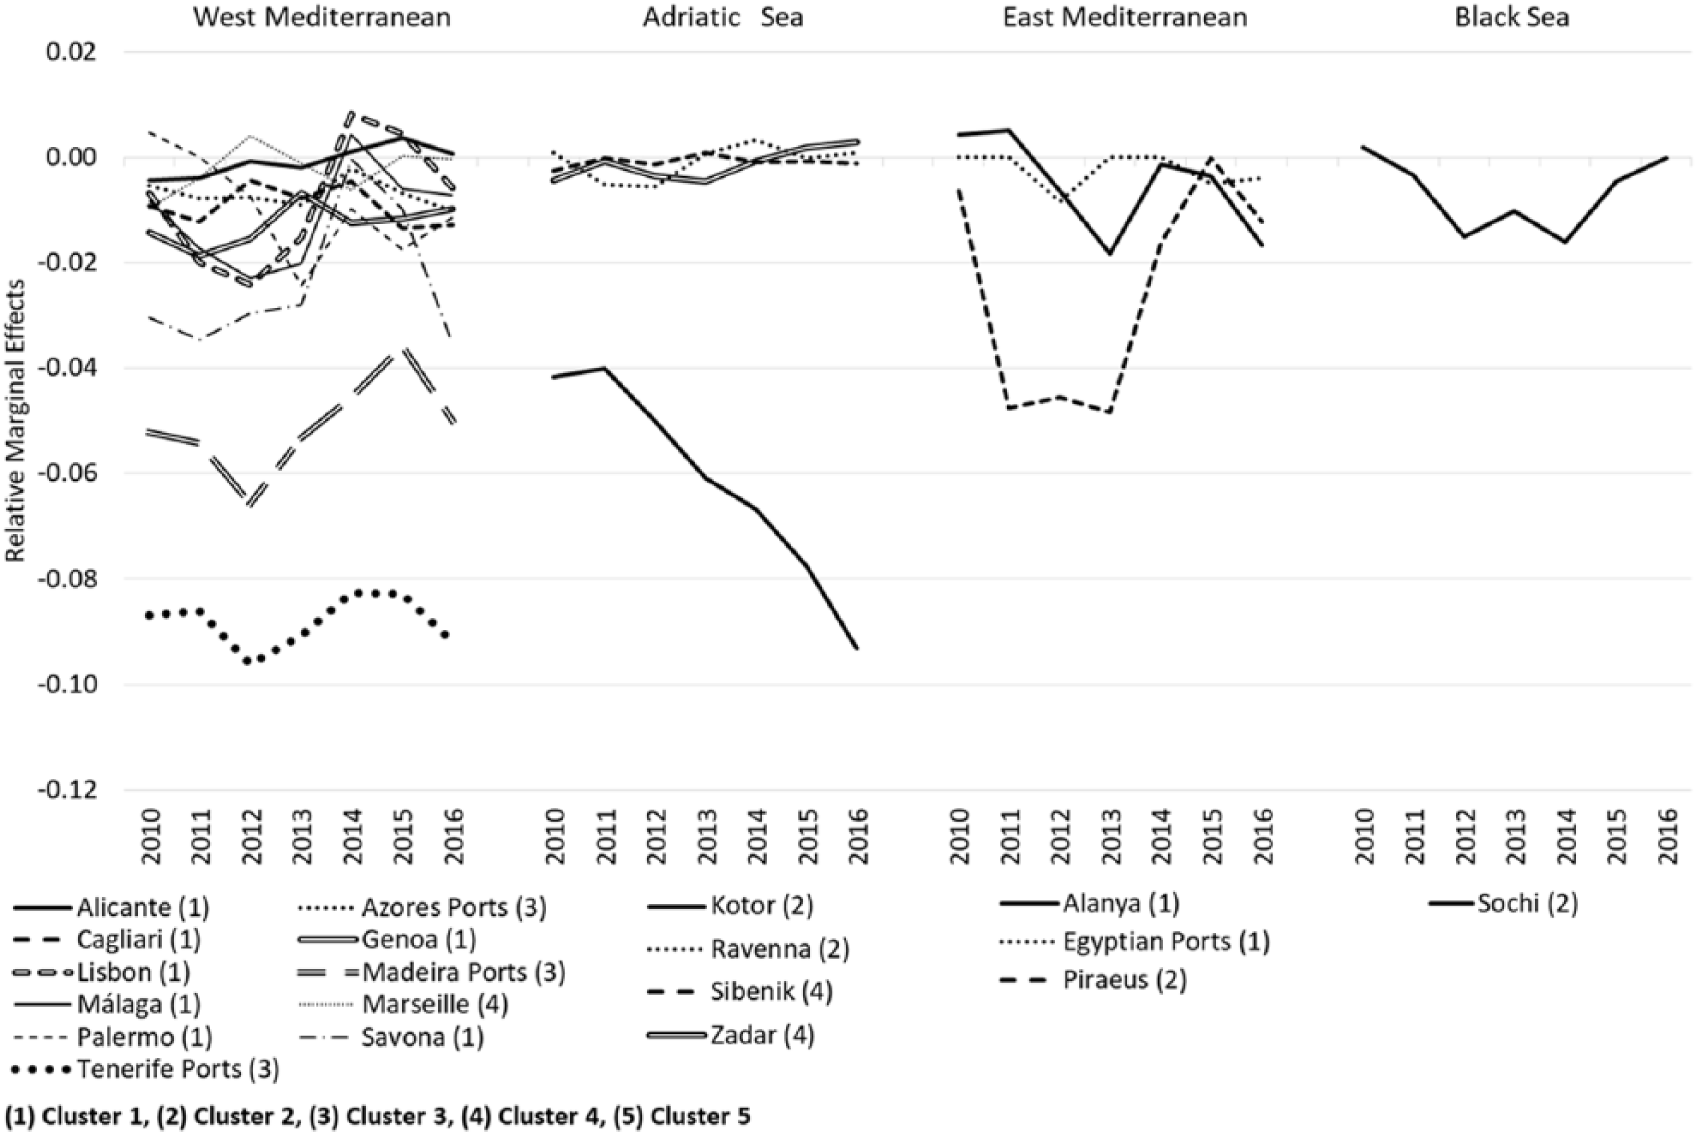
Ports with negative RMEk in the period analyzed.
In the Western Mediterranean, most of the ports that have been considered propitious for reducing seasonality in the region (during the analyzed period) belong to cluster 1 (Alicante, Cagliari, Lisbon, Málaga, Palermo, Genoa, and Savona). According to the seasonal factors, all the ports in cluster 1 have their low season in winter, and in the case of Alicante, Cagliari, Lisbon, Malaga, and Savona, also in summer. The low season in the rest of the propitious ports of this region occurs in summer (Cluster 3: Tenerife Ports, Madeira Ports, and Azores Ports), and in winter (Cluster 4: Marseille). This information is very useful when planning cruise itineraries in the region if the objective is to reduce seasonality since, apart from knowing the ports that are conducive to reducing the annual seasonal concentration of the region via the RMEk, the times of a year when it would be possible to reduce seasonality in each of the ports can be known by analyzing beforehand the seasonal factors. In the Adriatic Sea, the ports identified as propitious for reducing seasonality within their own region (for the period analyzed) were Kotor and Ravenna, with a low season in spring and winter and medium season in autumn (cluster 2), and Sibenik and Zadar, with a low season in winter (cluster 4). In the Eastern Mediterranean, the low season in the Alayna and Egyptian ports (cluster 1) and in Piraeus (cluster 2) was in winter. Finally, the port of Sochi was the only port propitious for reducing seasonality in the Black Sea. In this port, the low season was in spring and winter, and the medium season was in summer.
To study the most recent state of seasonality in the regions analyzed, the decomposition of the Gini index was calculated with data from the year 2016, the last year for which data were available. For this, we performed a scatter plot to identify similarities according to the Gini indexes of each port (Figure 6) and a biplot representing the elements of the Gini decomposition (Figure 7). Figure 6 shows the Gini indexes of each port on the vertical axis according to the number of cruise passengers (million) on the horizontal axis. In this scatterplot, in the Western Mediterranean ports, four homogeneous groups (in terms of the seasonal concentration level) were identified with a low annual seasonal concentration (G < 0.25), and there are two distinct groups. In the first group, with less than 1 million cruise passengers, are the region’s southern ports. These are the ports located in the south of Sardinia and Spain, which includes the port of Gibraltar, the islands’ ports located in the southern part of the region (Malta, Tenerife, and Madeira), and Tunisian ports. In the second group, with a higher demand—between 1 and 2 million cruise passengers—are three ports located in the northern part of the region (Marseille, Savona, and Genoa). There are also two groups differentiated in terms of demand volume with a high annual seasonal concentration (G ⩾ 25). In the group with a greater demand—more than 1 million passengers—are the Barcelona and the Balearic Islands Ports (Spain) and the Civitavecchia and the Naples (Italy); they are all located at a central level in the region. In the group with a lower demand—less than 1 million passengers—are the ports of Sete (France), Monaco (Monaco), Portofino, La Spezia, Portoferraio and Messina (Italy), the Portuguese ports (Lisbon and Portimao), and the rest of the Spanish Levant ports (Cartagena, Alicante, Valencia and Palamós).
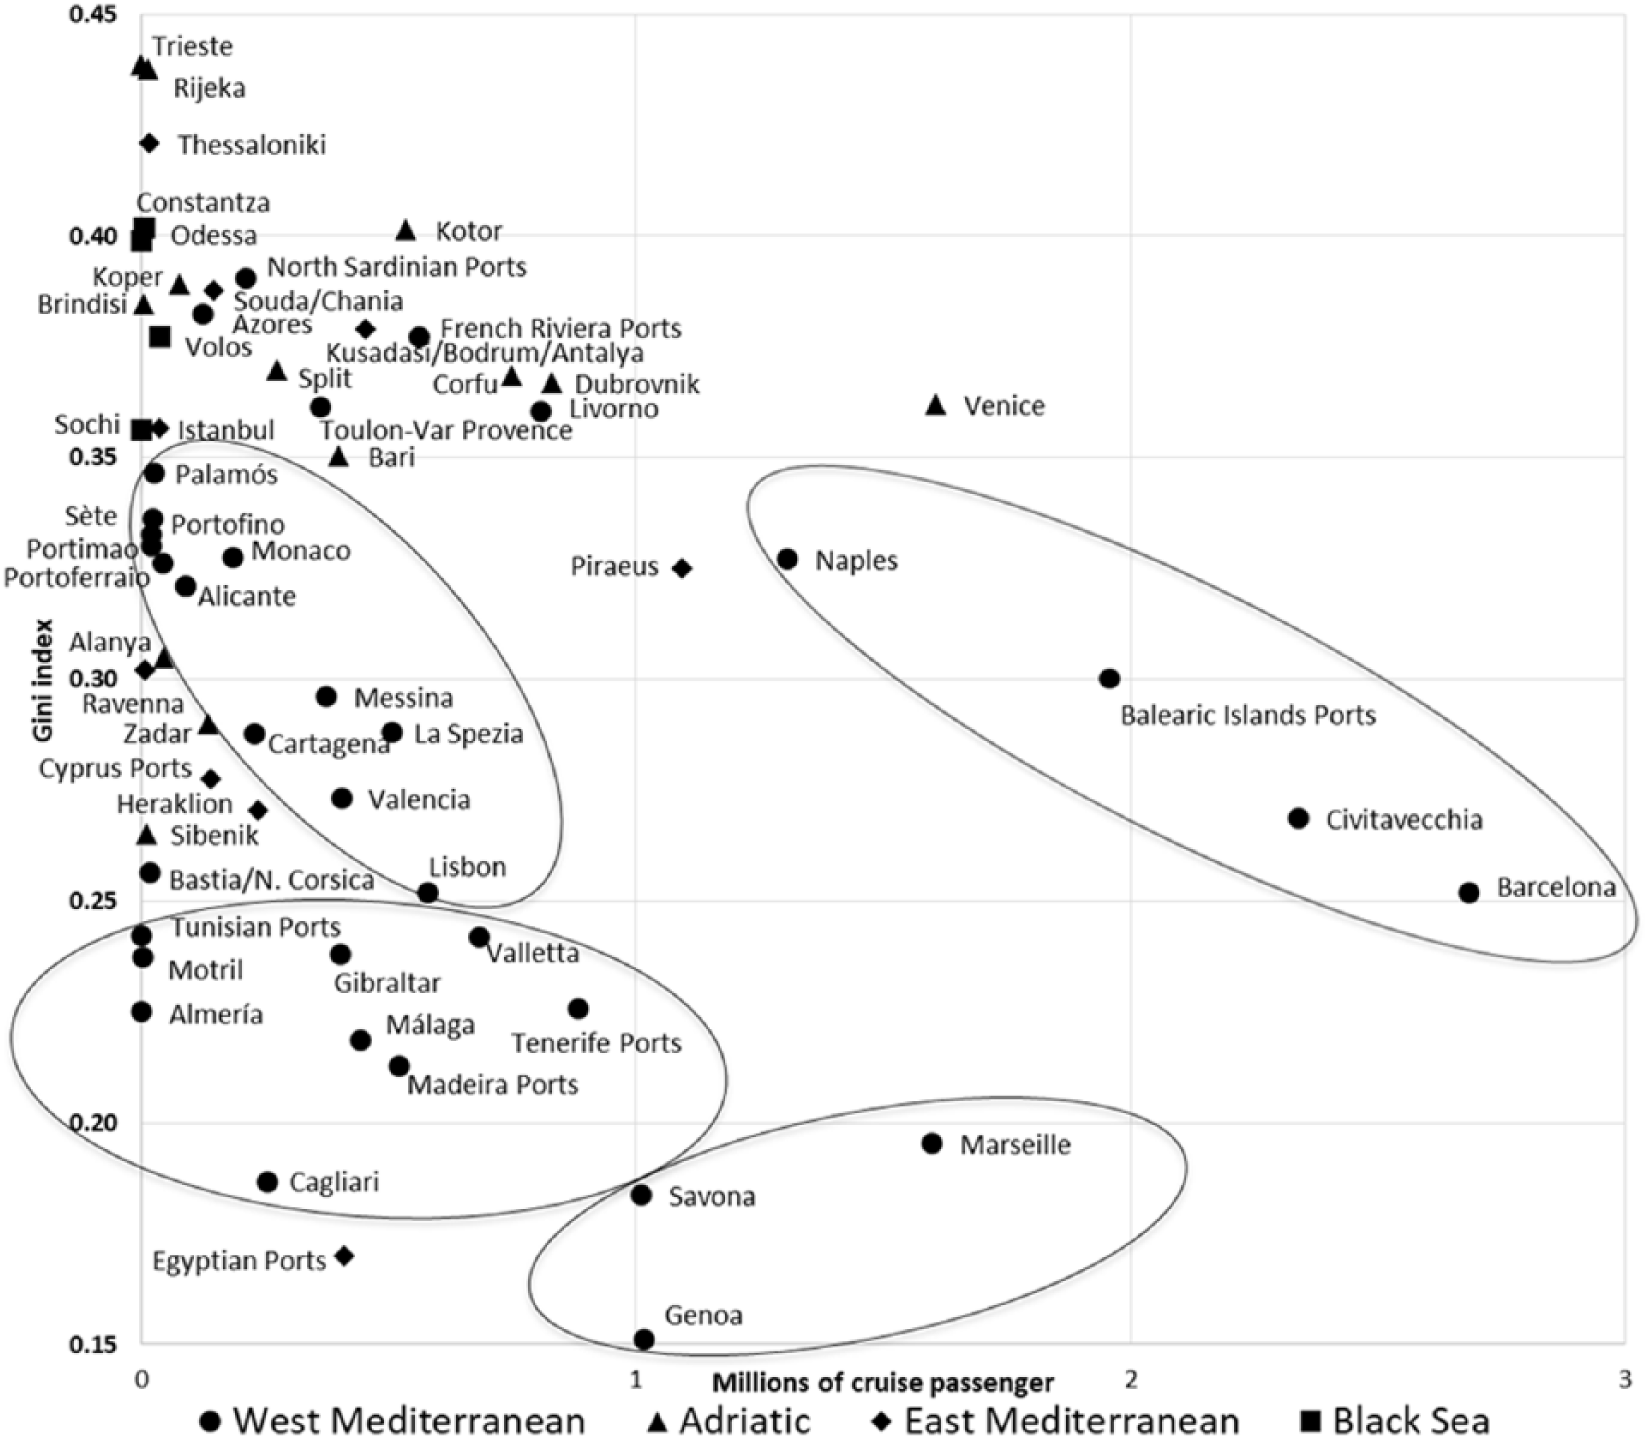
Gini index and absolute values by regions (2016).

Biplot of the Gini decomposition (2016).
To enrich the Gini index decomposition and graphically display its components, a multivariate graphic technique (the biplot) was used in Figure 7, in order to identify ports with similar characteristics, according to the estimated values of their respective components Rk, Gk, and Sk. This figure also helps to interpret the variations between the components of the Gini index decomposition and its influence on the RMEk. The observations are represented by points and the variables by arrows; while the variances are the angles between the arrows. This way, we can find groups of ports that have similar values in their components of the Gini decomposition (i.e., according to their position in the graph and with respect to the arrows that represent the variables).
If the position of the variable representing the RMEk is very close to the horizontal axis, it indicates that the ports located on the right side of the biplot are those with higher RMEk. Meanwhile, ports on the left side generally show negative RMEk. On the other hand, if the position of the variable representing the Gini index is close to the vertical axis, it suggested that ports with high Gini index should be in the upper region of the biplot. Moreover, the angle between these two variables indicates that there was not a very close relation between them, and that the RMEk of each port was also highly conditioned by their respective Sk and Rk.
In fact, most of the ports with negative RMEk were in the lower left region of the biplot, just opposite to the arrow that represents the variable Rk, due to their negative Gini correlation values. The three ports in cluster 3 were in this group, as well as most of the ports in cluster 1, and two ports of cluster 5. These were the ports that contribute to deseasonalize the distribution of their regions given that they either showed a low Gini index and/or a negative Gini correlation with the distribution of their region.
Other cases with negative RMEk that showed a different behavior were two ports in cluster 2 (Piraeus and Kotor), located in the upper right region. Both ports contributed to deseasonalize their region even though their Gini indexes were high since they showed a negative Rk and a significant Sk in 2016.
On the right side of the biplot, showing positive RMEk, the ports tended to group in two areas above or below the horizontal axis. The group above the horizontal axis mainly included ports from cluster 2 and some ports from cluster 4 and 5; they shared some features such as high Gini indexes (with high or moderate Rk) or moderate Gini indexes (combined with Rk values equal or very close to 1). The group of ports in the lower right side of the biplot mostly belonged to clusters 4, 1, and a port from cluster 2. These ports also showed positive RMEk mainly due to high Gini indexes, but not so high as those in the group above the horizontal axis.
Conclusions
Methodological Contribution
Quantifying and analyzing seasonality in the cruise tourism segment could be considered a research of notable interest, given the importance this phenomenon has in tourism activity in general, as well as the special relevance that it has in the sector. Despite the interest aroused by this line of work and the applications that it can have, both in planning and management, there have been no significant methodological advances in the use of specific analytical tools for studying seasonality in cruise tourism.
In the few previous studies in which the Gini index had been used to analyze the annual seasonal concentration exerted by the demand of cruise passengers, some demand patterns had been masked. Therefore, a sufficient level of disaggregation of the demand can reveal nuances that are lost with aggregated data. For this reason, this article intended to disaggregate seasonal concentration by decomposing the Gini index, and thus allowing tourism and port managers to make more adequate decisions regarding marketing and catchment policies by establishing itineraries that can reduce seasonality in the analyzed regions. For example, tourism and port managers can promote cruise segment in ports belonging to clusters with seasonal distributions that can compensate highly seasonal tourism destinations by means of prices or incentives. However, this measure does not seem possible in all European coastal destinations given that in some ports we have verified that the seasonal demand for cruises coincides with the general tourist demand.
As a result, identifying ports, according to their demand pattern, that can help reduce seasonality in their regions can be a difficult task since they may be going unnoticed due to the lack of a suitable methodology to identify them. Considering this deficiency, this study sought to present a measurement approach that provides information about the ports less prone to seasonality.
This article has proposed a methodological framework, based on multivariate statistical techniques to estimate the indicators of the degree of annual concentration, and to classify ports according to seasonal patterns. This methodological framework makes it possible to have a detailed seasonality analysis of cruise tourism demand in the Mediterranean regions. Therefore, it can serve as a control and monitoring tool for measuring seasonal concentration levels in cruise tourism, making it possible for policies against seasonality to be tailored in this segment. The decomposition of the Gini index applied in this study provided marginal relative effects, which served to identify the ports less prone to seasonality in each region.
However, the importance of the methodology proposed does not only consist of detecting the ports that help reduce the seasonal concentration in their region but also in estimating and interpreting the components of the Gini index decomposition. These components can be very valuable for drawing policies against seasonality since they make it possible to differentiate between the demand patterns that affect differently the seasonal concentration of the regions analyzed. A periodic application of the proposed methodology can serve as the base for a follow-up procedure to monitor the level of seasonal concentration for this segment, which can complement the other criteria necessary for decision making in the sector by both cruise companies and destination managers.
Empirical Findings
The four geographic regions studied showed important differences along the observed period regarding their seasonal patterns and level of annual concentration, as measured by the Gini index. The Western Mediterranean region showed the least concentrated seasonal distribution, while the seasonal patterns of the Black Sea and the Adriatic regions are the ones with the highest levels of annual seasonal concentration.
Nevertheless, the seasonal distributions observed in the ports of each region are far from being homogeneous. Our analysis revealed five clusters or groups of ports, according to their yearly seasonal distributions, that are not coincident with the classification based on geographical regions usually considered. Each cluster had specific seasonal characteristics, such as the low season in summer of cluster 3 or the high season observed in summer for cluster 2 and in autumn for cluster 5.
In addition, since the level of annual seasonal concentration is conditioned by the distribution of the demand throughout the year, we found high Gini indexes in all the ports in clusters 2 and 5, and mixed results in the remaining clusters.
The Gini decomposition yielded some noteworthy results. The estimation of the RMEk made it possible to identify ports that can help reduce the seasonal concentration in each region by simply increasing their demand with their current seasonal patterns—those with negative RMEk—like the three ports in cluster 3 (Tenerife Ports, Madeira Ports, and Azores Ports), and many ports in cluster 1 in the Western Mediterranean, or Sochi in the Black Sea.
In addition, with the analysis of the Gini components performed, we differentiated between ports that reduced the concentration level of their region because of (1) a low concentration level as measured by the Gini index, like Genoa or Savona in the West Mediterranean; (2) a seasonal distribution that compensates the regional one, that is, with a low or negative Gini correlation, especially when the port exhibits a high concentration level, like Piraeus in the East Mediterranean; or (3) due to both features, like the Madeira and Tenerife ports in the West Mediterranean. These characteristics can be observed by examining the components of the Gini decomposition either by ports or by examining the ports’ location in the biplot.
Theoretical Implications
Beyond the methodological contribution, this article raises the importance of an adequate study of seasonal patterns and concentration of cruise demand in the economic analysis of this sector. The findings in this work suggest that a sufficient degree of disaggregation is necessary to reveal the extent and effects of this phenomenon and that a single index is not generally enough to get a correct depiction of the seasonality in cruise ports. Therefore, as proposed in this study, economic models that take into account the seasonality as a relevant factor should consider a combination of indexes that evaluate the different features that comprise the complex phenomenon of seasonality, like the components of the Gini decomposition used in this research. Models of coastal destination competitiveness, for example, should include seasonality indicators in their specifications, in the way this study proposes, especially if they involve destinations with cruise ports of call.
Another significant contribution of this research is the identification of the important role of the concept of ports cluster, in terms of seasonal characteristics. Past studies in the field of classifying ports often used variables related to traffic, dimension, or geographic location but rarely introduced seasonality. However, seasonality indexes are additional variables that could enhance this type of models. Nevertheless, from the point of view of cruise tourism analysis, it seems more relevant to classify cruise ports only according to their seasonal demand distribution, and estimating their impacts on regional seasonality. In addition, clusters of cruise ports with homogeneous seasonal distributions may share some interests and cooperate in their interactions with destinations and cruise companies. Therefore, this study also contributes to the existing body of literature providing the concept of cruise ports cluster, nongeographically defined according to the seasonality of demand, and proposing the measurement of their effects on regional seasonal concentration.
Managerial Implications
The results of our study also offer interesting managerial implications. Bearing in mind that the attraction of the cruise segment usually requires significant infrastructure costs, it can be of great importance for destination managers to know what advantages cruise tourism promotion can offer their destinations. One of the advantages that is often adduced is that it can compensate for tourism seasonality. For this reason, the methodology that we have developed allows us to know what the seasonal characteristics of the ports are in each destination, what seasonal typology they belong to, and, therefore, whether it compensates for a decompensated seasonal distribution of the total tourist demand received at the destination.
Closely related to the implications mentioned, the results offered by this study provide management-oriented elements for port authorities. On the one hand, they provide references that ease the relationship with the destination in which the ports are located through the development of counterseasonal policies in the destination. On the other hand, they allow the possibility of generating collaborative relationships between ports that have similar seasonal characteristics—belonging to the same cluster—for planning management policies regarding destinations or cruise companies. Likewise, they would make it possible to organize groups of ports with different seasonal characteristics that could compensate by forming synergies that promote/facilitate competition.
Furthermore, from the cruise companies’ point of view, vessel deployment strategies are to a great extent conditioned by various market circumstances, including the seasonality of demand. For this reason, knowing the seasonal typology to which each port belongs can facilitate the making of the most efficient itineraries for cruise companies, combining the characteristics of the demand of the ports visited and their seasonal distribution; it can also be a negotiating tool with port authorities and destination managers.
Study Limitations
Finally, it is necessary to point out some limitations in this work such as the use of quarterly data (periodicity in which data are currently provided by MedCruise). In future research works, with the use of monthly data, results of both the estimation of seasonal patterns, and the decomposing and effects of seasonal concentration measures could be further refined. On the other hand, based on some of the results obtained, it is possible to venture into a line of research that can provide results of great relevance, which consists on estimating the degree of seasonal concentration of the general tourist demand in the destinations where the ports are located and the role that the cruise segment has. For this, it would be necessary to have homogeneous databases of both the cruise segment demand and the general tourist demand of the regions, which would allow the analysis to be carried out.
Footnotes
Declaration of Conflicting Interests
The author(s) declared no potential conflicts of interest with respect to the research, authorship, and/or publication of this article.
Funding
The author(s) disclosed receipt of the following financial support for the research, authorship, and/or publication of this article: The authors thank the “Universidad de Málaga” for their financial support.