



Abstract
The aim of this article is to propose a novel method for measuring the effect of cultural preference on bilateral tourism receipts. The method applied is inspired from Disdier et al. (2010). Using the UNESCO classification and data on bilateral trade in cultural product, a proxy for cultural preferences is constructed. The variable is used in a gravity model for tourism export, which is estimated using a two-step procedure to avoid issues related to endogeneity. The data set used is a panel of 12 OECD countries for a period of 11 years. The variable for cultural preferences eliminates the problems with traditional methods, which by using dummy variables to account for cultural preferences, assume that the latter are time-invariant and symmetrical. The cultural variable constructed is found to be significant in explaining bilateral tourism exports with an elasticity of 0.39.
Introduction
That geographical distance between trading partners has an impact on trade is clearly established in the literature. It is fairly highly correlated to transportation costs, which act as trade barriers. Empirical evidence to this effect is provided by Isard and Peck as early as 1954. There are, however, factors other than physical distance that account for the economic cost of moving goods and services from one location to another. These are mode of transport, market concentration, and resource endowment (Beckerman 1956). In Beckerman’s words, “the concept of ‘economic cost’ relates to the cost of traversing distance rather than the actual mileage covered” (1956, p. 32).
In the trade literature, the concept of distance has since transcended the notion of geographical distance to encompass economic and cultural distances. Such distances influence trade through different channels. Membership in common markets, in currency unions, historical links, common ancestries and languages may reduce the transaction cost and cultural barriers that would otherwise have a negative influence on trade. According to Kónya (2006), there is the need to differentiate between the effects of geographical and cultural barriers to trade. Kónya argues that countries have “idiosyncratic cultural aspects that separate them from other nations” and this needs to be considered when estimating determinants of bilateral trade. Countries that share distinctive cultural traits may not only be more inclined to trade with one another, as it reduces barriers to trade, but actually develop a preference for each other’s products (Felbermayr and Toubal 2010). It is argued in this article that countries may have a higher preference for the tourism products of destinations with which they share cultural similarities.
Problems, however, arise in empirical studies that seek to quantify the relationship between cultural proximities, preferences, and bilateral trade. Empirical studies of trade often applied the gravity model framework to analyze trade patterns, especially after the earlier criticisms of their lack of theoretical underpinning were addressed in Anderson (1979). Anderson (1979) provides strong microeconomic foundations for gravity models by proving that they may be derived from the properties of expenditure systems that are obtainable by maximizing individuals’ preferences for traded goods subject to budget constraints involving the level of expenditure on these goods.
In gravity models, the geographical distance between trading partners is used as a proxy for transportation cost while the question of the economic and cultural distance is considered through the inclusion of dummy variables that measure the level of cultural distance or proximity and preferences between the home and host countries. This method has been largely employed in the tourism economics literature (see Matias 2004; Garin-Munoz 2006; Durbarry 2008; Khadaroo and Seetanah 2008; Vietze 2012; Fourie, Rosello, and Santana-Gallego 2015; Santana-Gallego, Ledesma-Rodríguez, and Pérez-Rodríguez 2016; Balli, Balli and Rosmy 2016) to explain international tourism flows.
To assess the effect of culture, the traditional approach is to include dummy variables in econometric models, and they have been shown to have strong explanatory powers. It is argued that the effect of culture on trade can be decomposed into the effects of cultural distance/proximity and that of cultural preferences. Moreover, the dummy variables used to measure cultural proximities between two nations do so fairly effectively although not without flaws. They however, fail to measure the effect of cultural preferences adequately. The two main criticisms for using dummy variables are that, first they are time invariant, which is a strong assumption for both cultural proximities and preferences of trading nations, as both can change over time. Second, they assume symmetry in proximities and in preferences of trading partners. While cultural proximities can be symmetric, cultural preferences are more likely to differ. Take for example two trading partners, France and Canada. Dummies for language and colonial links are used to measure the effect of cultural proximities on their bilateral trade under the assumption that because the two countries share a common language, history and other cultural similarities emanating from past colonial links, transactions costs of trading are reduced giving a boost to their bilateral exports. This assumption is rational. However, this method combines the effect of cultural proximities and preferences and assumes that the preferences of French and Canadian citizens for each other’s products do not change overtime and that French preferences for Canadian products are exactly the same as Canadian preferences for French products. This assumption is unlikely to be accurate because preferences are more likely to be asymmetric and vary over time. The effect of cultural preferences is likely to be absorbed by the coefficient of the dummies and combined with those of cultural proximities.
The aim of the present article is to provide an improved measure of cultural preferences that distinguishes between the effect of cultural proximities and cultural preferences on bilateral tourism export. More precisely, it is argued that the dummy variables reflect a form of cultural proximity whereas there is a need to develop a measure for the cultural preferences of the tourists. The methodology is inspired from the contribution of Disdier et al. (2010), who use the value of trade of cultural goods and services as a proxy for cultural preferences in a gravity model to explain bilateral trade among 239 countries over the period 1989–2005. To calculate the value of trade in culture, the total value of the trade in cultural products is used. The products included are based on the UNESCO classification of cultural goods and services. This method is adapted for the tourism trade between 12 OECD countries for the period 2002–2012. To account for potential endogeneity in the model used, the latter is estimated using the two-step ordinary least squares (OLS) regression analysis. The robustness of the results is tested by comparing estimates to a pseudo–Poisson maximum likelihood (PPML) regression.
To improve the estimation further, the article uses tourism expenditure data as the dependent variable unlike the majority of the models that use data on arrivals or departures. Hanna, Lévi, and Petit (2015) state that the size and the nature of the tourism flows have to be analyzed at the bilateral level and using expenditure data because tourists’ expenses better reflect the preferences for the tourism product than data on arrivals. The article proceeds as follows: the related literature is surveyed in in the next section. The third section explains the econometric model and data. The fourth section presents the empirical results and their interpretation. The fifth section concludes the article.
Survey of the Literature
The Trade Literature
The contemporary literature on the link between trade and culture approaches the subject from two different angles. The first is based on the marketing theories and the pioneering study of Hofstede (1980), who introduces the concept of cultural dimension in business decision making. This is measured across IBM subsidiaries in 64 countries using four cultural scores: individualism, masculinity, power distance, and uncertainty avoidance. This approach is adopted by Kogut and Singh (1988), who calculate an index of cultural distance (CD) based on weighted average of these dimensions. The literature has since evolved through the development of other approaches which seek to measure the effect both cultural distances and preferences on trade (see, e.g., Gomez-Mejia and Palich 1997; Clark and Pugh 2001; Jackson 2001. They are criticized by Shenkar (2001), who purports that they do not take into account the asymmetry in the cultural preference between two countries, the temporal variability, and the nonlinearity of preferences.
The second angle of analysis applies the gravity model. Until the theoretical underpinning proposed by Anderson (1979) and Bergstrand (1985, 1989), the gravitational model was used as an ad hoc model to test new international trade theories (see Krugman 1979; Helpman and Krugman, 1985; Krugman 1991). The framework developed by Anderson (1979) and Bergstrand (1985, 1989) relies on the assumption of monopolistic competition, and consumers are represented by preferences subject to constant elasticity of substitution. In the model, each firm in a given country produces a differentiated product and production is subject to economies of scale. In this article, it is assumed that each country supplies a differentiated bundle of tourism products that is unique to the country providing it with the opportunity for achieving economic rent. The size of the domestic market reflects the capacity for internal economies of scale, which is further expanded with trade. The firms that are able compete internationally and reap the benefit of economies of scale, allowing them to stay in the market and compete for market share. As each firm produces a unique bundle of products, the outcome is that a number of varieties are available on the international market at competitive prices. From the import side, the higher the demand for import, the higher the expenditure on import. Therefore, export revenue needs to be high enough to finance the import bill.
From the demand side of the model, the representative consumer seeks to maximize his or her utility subject to his or her budget constraint, which is a function of his or her income, prices of the tourism products, and trade cost (physical or institutional). The utility function of the consumer, as indicated by Disdier et al. (2010), Felbermayr and Toubal (2010), and Carrère and Masood (2018), includes a parameter that indicates the preferences of the consumer for the products of the exporting country.
Transportation costs are approximated by the geographical distance between the countries, and dummy variables are introduced at the estimation stage to account for factors such as preferential trading arrangements, sharing a common border, or membership of common markets or trade region (see, e.g., Hummels and Levinsohn 1995; Durkin and Krygier 2000). The majority of studies have progressively included other dummy variables: common language or colonial links. This inclusion is carried out without any theoretical explanation, with the exception of Kónya (2006). Interpretation of the distance variable had been the subject of many articles (see, e.g., Boisso and Ferrantino 1997 and Buch, Kleinert, and Toubal 2004). However, the critics of Shenkar (2001) can also be addressed to these studies.
More recently, authors have sought to fill this gap by capturing the cultural dimension in models of international trade. Disdier and Mayer (2007) use bilateral preferences; Guiso, Sapienza, and Zingales (2009), bilateral trust; Melitz (2008), linguistic proximity; Rose (2004), colonial links; Wagner, Head, and Ries (2002), immigration; and Lewer and Van De Berg (2007), religious proximity and immigration. Felbermayr and Toubal (2010) provide an estimation of the effect of cultural proximity on bilateral trade by constructing an index using the scores from the Eurovision Song Contest and a panel database between 1975 and 2003. The underlying assumption is that the scores reveal the preferences of the consumers of one country for the culture of another. The index is shown to be positively affecting trade volumes.
The more conclusive work has been done by Disdier et al. (2010) who develops a method using the revealed preferences of trading nations. They assume that the country’s consumption of imported culture is a more accurate measure of its preferences for the culture of its trading partner. The authors, therefore, use the volume of bilateral trade of cultural goods and services as exogenous variables to explain total bilateral trade. They use the BACI database developed by the Centre d’Etudes Prospectives et d’Informations Internationales (CEPII), which included 239 countries over the period 1989–2005. They follow the UNESCO classification of cultural goods and services and extract from the balance of payments the information concerning these items. They demonstrate that trade in cultural products variable is a good proxy of cultural preferences, as it varies over time and does not suffer from a problem of availability and coverage. Their results clearly indicate that this variable has a higher power of explanation than all the other proxies traditionally used in the literature.
The Tourism Literature
The tourism literature also addresses the relationship between tourism and culture broadly from two angles. The first looks at the application of marketing literature to explain the tourism attractiveness of a destination. The second takes an economic modelling approach and that use dummy variables in gravity models to study the concept of cultural proximity and preference. Crotts (2004) constructs a cultural index based on Hofstede’s scores for the uncertainty avoidance with a sample composed of 302 US residents traveling abroad for the first time for leisure purposes in 26 countries. He considers the cultural orientations of the visitor’s home country and of the destination. However, in his conclusion, he admits that the results of logistic regressions do not provide very robust results. This can be explained by the fact that from the tourist’s perspective, cultural distance is a more complex phenomenon, which cannot be captured only by the difference in the uncertainty avoidance index.
Ng, Lee, and Soutar (2007) obtained more conclusive results by using five CD measurements (Kogut and Singh’s cultural distance index, Clark and Pugh’s cultural clusters, West and Graham’s (2004) linguistic distance, and Jackson’s cultural diversity index and perceived cultural distance) in a survey of Australian residents, and they compared the results of these indexes with the intention to visit 11 destinations. They conclude that perceived cultural distance and Clark and Pugh’s index are the ones most strongly related to the consumer’s intention of visiting a holiday destination. The literature continues to provide empirical studies that apply this type of analysis (see, e.g., Ahn and McKercher 2015 on the international visitors to Hong Kong; Esiyok, Cakar, and Kurtulmuşoğlu 2017 on medical tourism in Turkey).
The second type of analysis, based on the gravity model, is also well developed in the tourism literature. Morley, Rosseló, and Santana-Gallego (2014) discuss the theoretical foundations of the gravity model in the tourism context. Their model is derived from consumer choice theories and supports the use of this framework to analyze tourism demand in a destination and the understanding of the consequence of public policies for destination attractiveness.
Most of the empirical studies that use the gravity model in tourism economics introduce exogenous variables that are not integral to this framework. For example, based on a sample that includes 2,420 FDI projects carried out by 50 parent countries in 104 host countries from 2005 to 2011, Falk (2016) finds that the geographic distance has no influence on tourism arrivals. Most studies, however, add dummy variables to distinguish between the effects of cultural affinities, information costs and geographic distance, which are then interpreted as the transport cost of travel. Seetaram (2010) discusses the limitations of using distance as a proxy for transportation cost. The distance variable incorporates the effect of all other distance-related variables and becomes problematic to interpret. For example, Seetanah, Durbarry, and Ragodoo (2010) integrate two dummy variables (common border and common language) for a panel data analysis of South Africa’s inbound tourism. Vietze (2012) uses a dummy variable to capture the religious proximity between host country (USA) and sources countries. He finds that the USA is more attractive for tourists who come from countries with a large share of Christians, and more precisely with a large share of Protestants. A similar variable is used by Hanna, Lévi, and Petit (2015) to explain the intra-tourism trade in EU. There is a growing body of literature that analyzes the effect of immigration on tourism, claiming that the existence of a community of immigrants from the home country at the destination is likely to increase the cultural proximity and preferences between the home and host countries. This has a positive effect on tourism trade. This effect is explained and analyzed in detail in studies such as Dwyer et al. (2014), Forsyth et al. (2012), and Seetaram (2012a, 2012b).
With a cross-section of 195 countries for 2012, Santana-Gallego, Ledesma-Rodríguez, and Pérez-Rodríguez (2016) uses dummy variables representing common border, colonial links, common language, common religion, or free trade agreement with the objective of testing for different indicators of cultural proximity. These variables are also used by Balli, Balli and Rosmy (2016). However, it can be noted that the primary focus of these studies is not to estimate the effect of cultural proximity. The dummy serves only as a control variable in the estimation. The inclusion is more often than not for econometric correctness, with the exception of Zhang, Xiang, and Wu (2019). They estimate a gravity equation for a sample of 81 origin countries and 32 destinations for the period 1995–2008. The role of the cultural distance on tourism arrivals is tested by using the four Hofstede indices. Their results indicate that controlling for the effects of distance, population, and gross domestic product (GDP) per capita, international tourism increases when the host and the destination share the same cultural values (higher individualism and higher indulgence notably). However, the criticisms from Shenkar (2001) are still valid here. It is important to understand that while the use of dummy variables in the tourism literature serves the purpose of measuring cultural, political, and institutional proximity, to some extent, it does not measure the effect of cultural preferences on tourism trade. Hence, this article develops a method that will capture the latter.
Econometric Model and Data
Sample
This study investigates the bilateral international tourism receipts of 12 OECD countries (Australia, Austria, Canada, France, Germany, Italy, Japan, the Netherlands, Portugal, Spain, the United Kingdom, and the United States) for the period 2002–2012. The choice of countries and year are motivated by the availability of data and the need to include the main tourism destinations from the OECD for which data exist. This exercise is constrained by the change in the methodology in accounting for trade in services. The definitions applied changed from the 2002 Extended Balance of Payments Services (EBOPS) classification to that of 2010. However, not all OECD countries have moved to the 2010 definition, and the data from the two definitions are not strictly comparable. Hence, to obtain the largest sample that the available data allow for, it is decided to include the aforementioned 12 countries and the 2002 definition. This allows for the construction of a three-dimensional balanced panel data set comprising 12 countries, 11 trading partners, and 11 years yielding a large sample of 1,452 data points. The advantage of using a balanced panel data set is the guarantee that it will not over or underestimate marginal effects because of the under or overrepresentation of at least one country or year in the sample.
International tourism flows can be captured either through volume (i.e., arrivals/departures) or through value (receipts/expenditures). Monetary data are employed to be consistent with the cultural variable and because Hanna, Lévi, and Petit (2015) state that tourism receipts are a better approximation of the preferences of tourists, and this is supported by the UNWTO. The tourism receipts/expenditures are in millions of US dollars and are compiled from the OECD database (2004 [updated in 2010]). The data on tourism exports are chosen instead of tourism imports because as explained in Nowak, Petit, and Salhi (2013), the value of international trade flows can differ largely between the national accounts of the two countries. Export data are generally more reliable than imports. However, in the case of the USA, a lack of data on exports led to the use of the relevant import data from the host country.
A Gravity Model for Trade in Tourism
Tourism imports, that is, the demand of the tourists from j for the product of destination i, are obtained from the maximization of the consumer’s utility under the budget constraint and can be summarized by the following expression:

where

Constructing a Proxy for Cultural Preferences
The methodology proposed by Disdier et al. (2010) is applied to construct a variable for measuring the revealed preferences for the culture of the destination by tourists from the home country.
Cultural Goods and Services According to the UNESCO Classification.
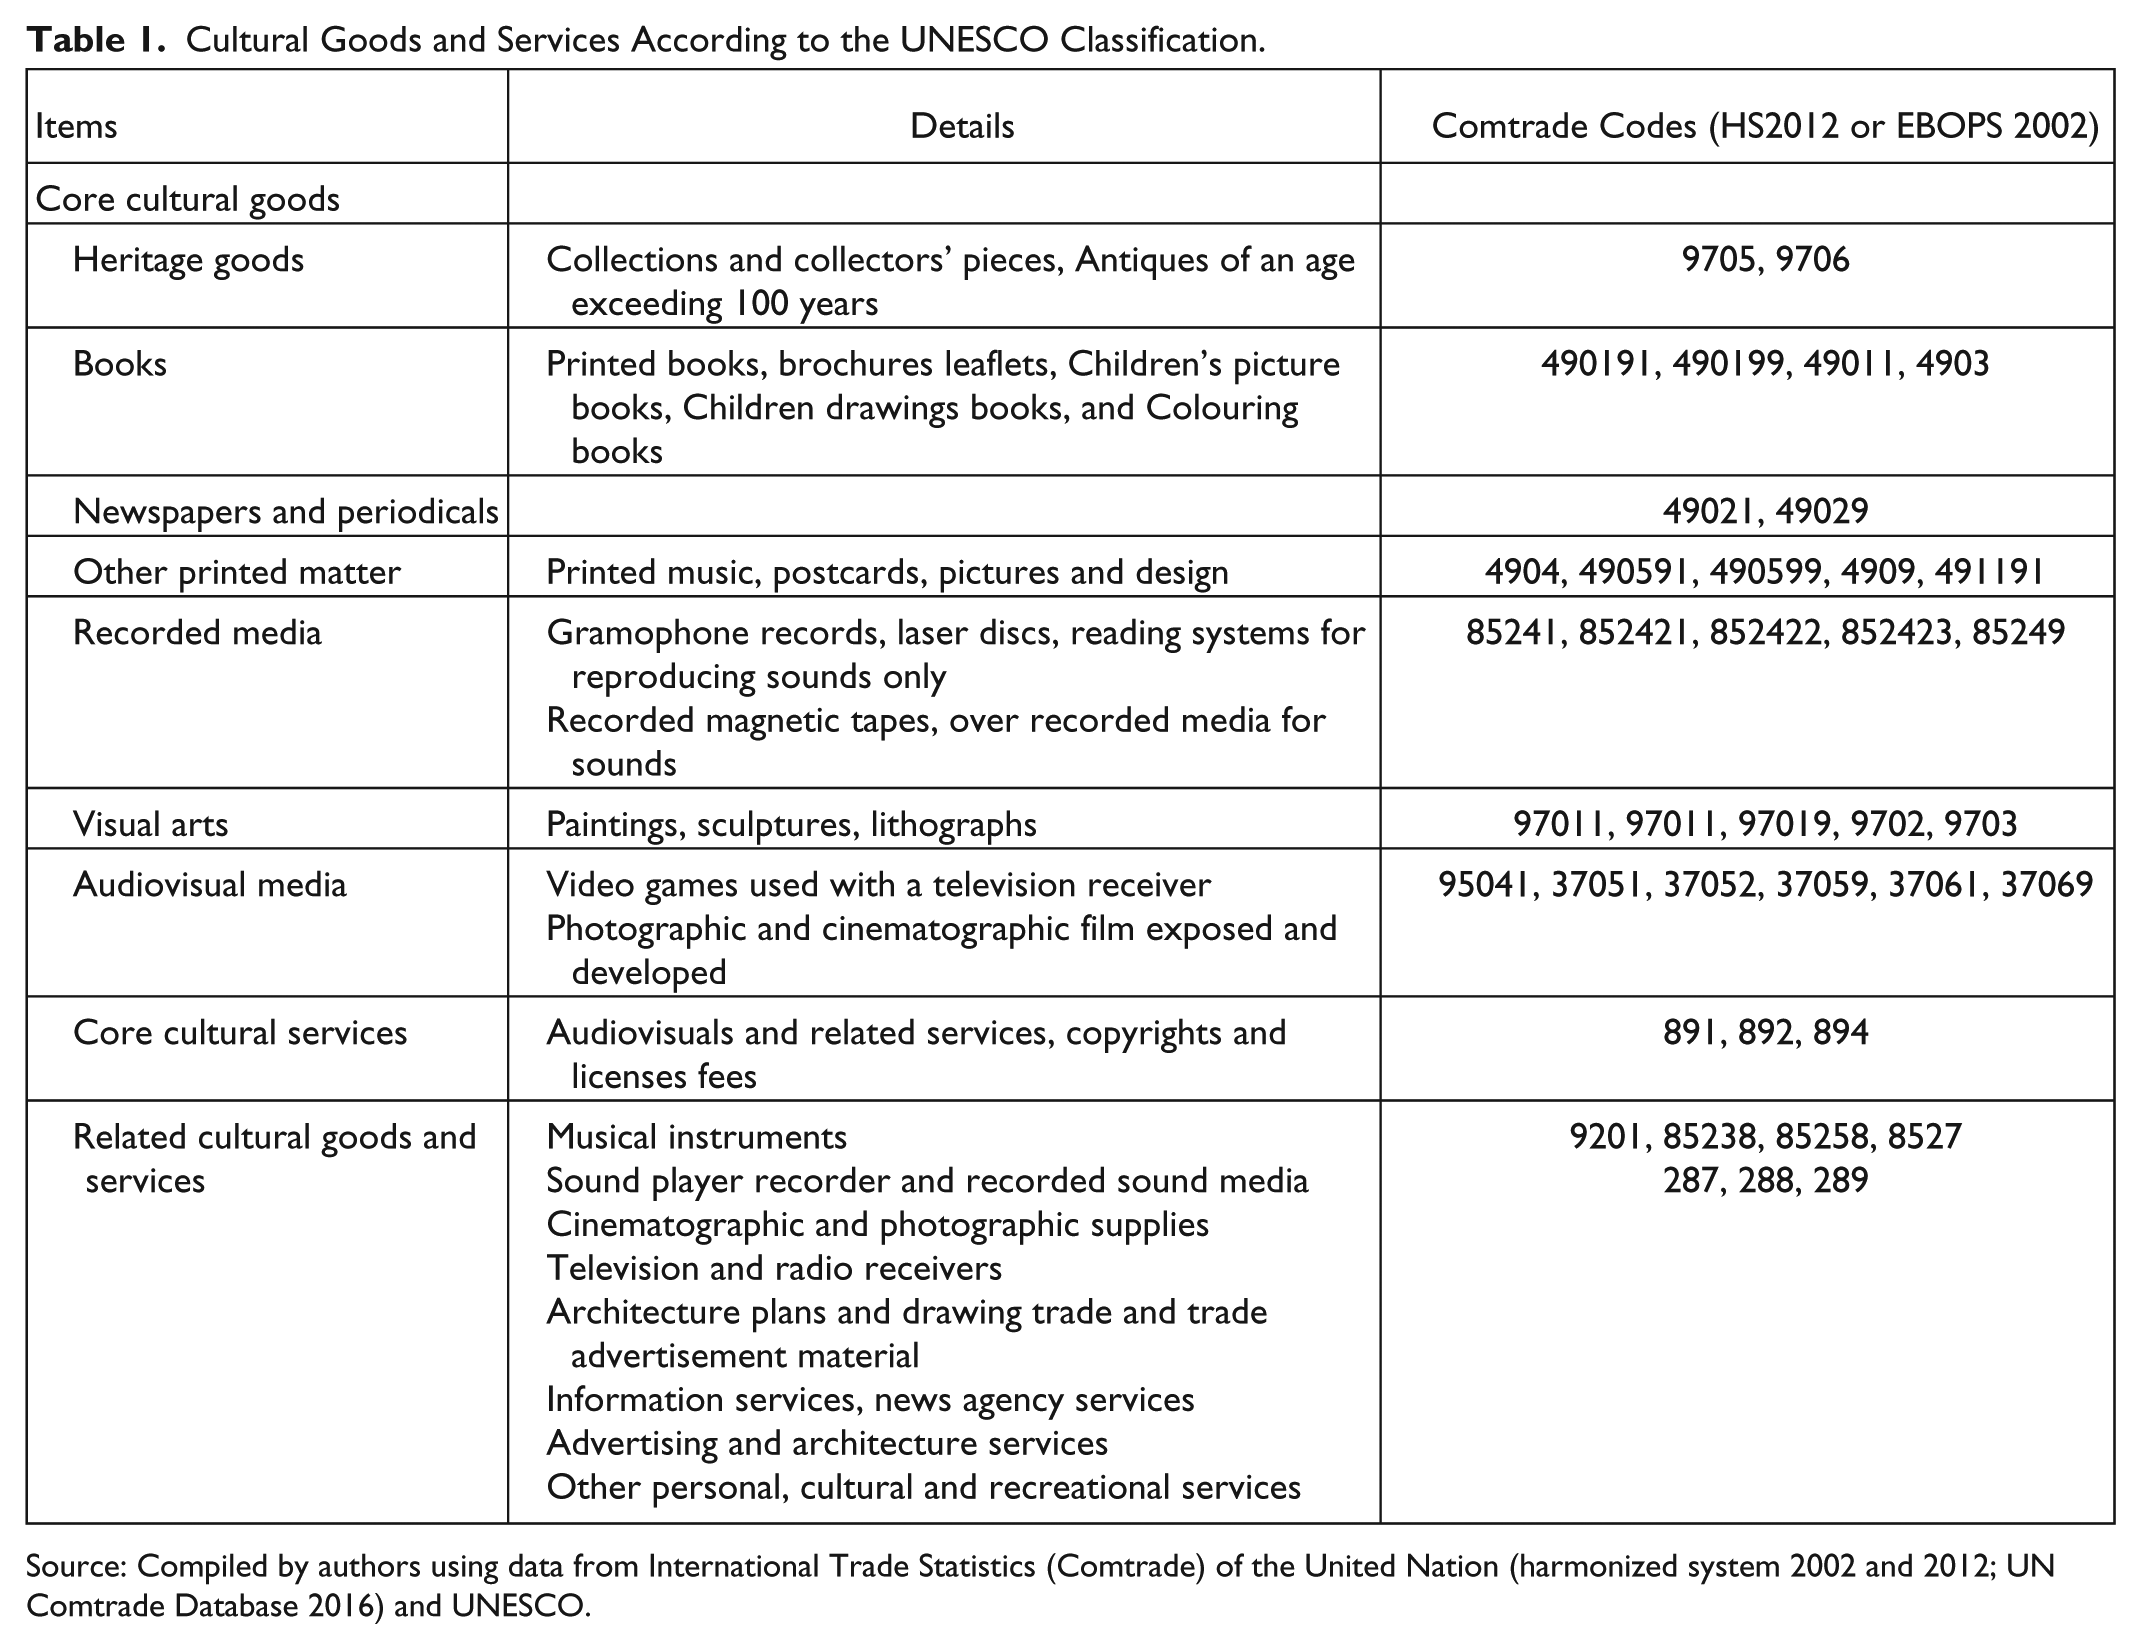
Source: Compiled by authors using data from International Trade Statistics (Comtrade) of the United Nation (harmonized system 2002 and 2012; UN Comtrade Database 2016) and UNESCO.
There are several advantages of using
The data in Table 2 illustrate this point. For each of these country pairs, the values of the common language and colonial links dummies are equal to 1 irrespective of the year and direction of trade, indicating their cultural proximities. However, the data clearly show that the intensity of cultural preferences are asymmetric. For example, the export of cultural products from Australia to the United Kingdom is clearly much lower than the import of cultural products from the United Kingdom to Australia, yielding a trade deficit of $174 million in 2002. Moreover, this value changes to $338.3 million in 2012. The preferences change over time, when the notable increase in import of cultural goods from the United Kingdom raises the trade deficit by 94%. In both cases, not only the preferences are asymmetric with negative trade balance but they also alter over the period of 10 years.
Trade in Cultural Products (Million US Dollars) for Selected Country Pairs, 2002 and 2012.
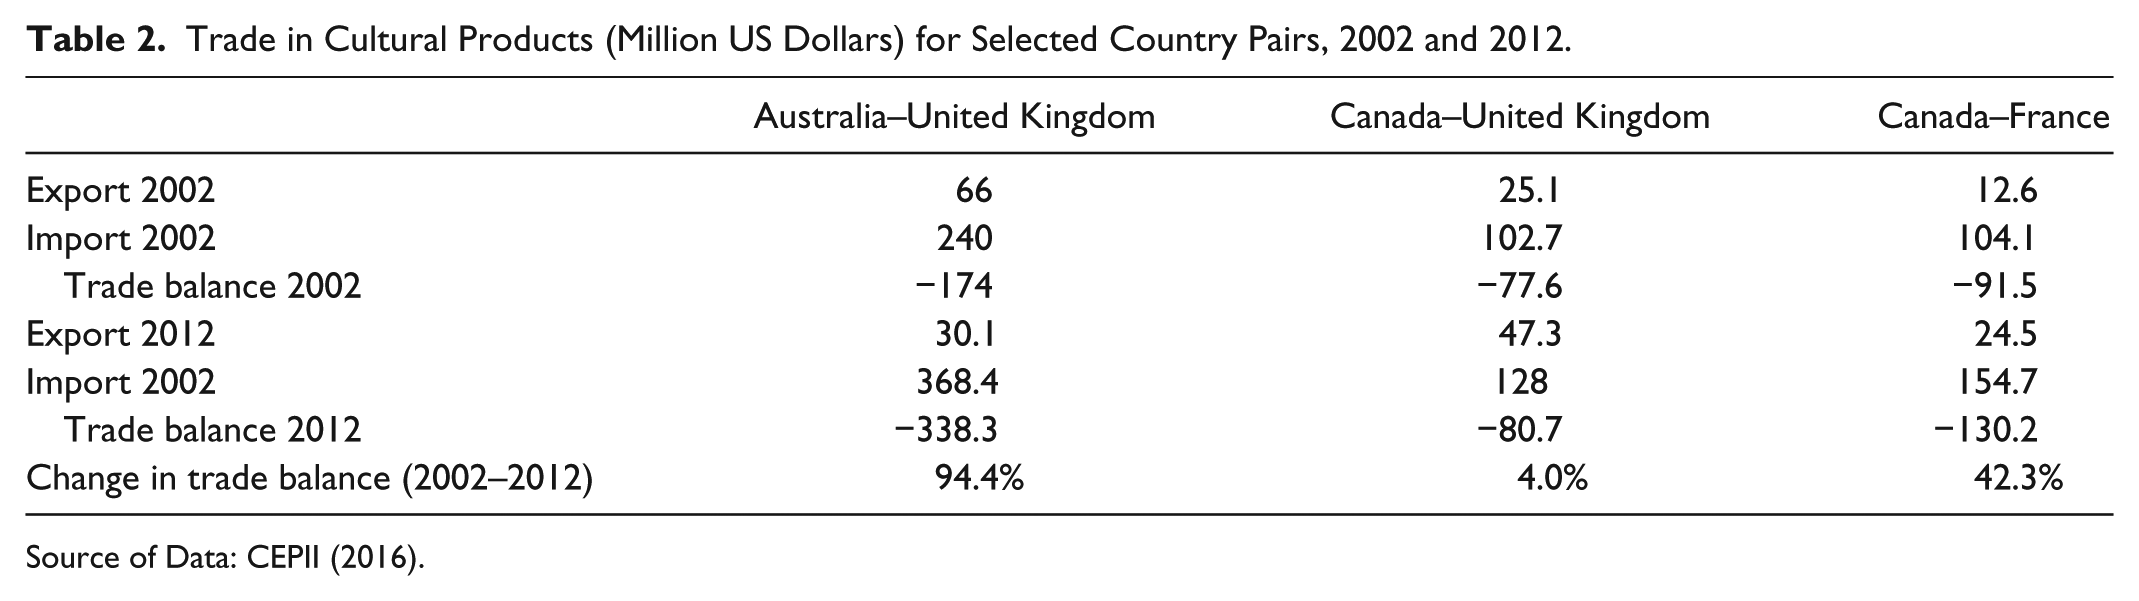
Source of Data: CEPII (2016).
Second, from a technical point of view,
Model Estimation
The proxy for cultural preferences is calculated using trade data, implying that it is not independent but endogenous to the model. Treating it as exogenous will lead to misspecifications of the model. Moreover, it may be highly correlated with the other control variables. To avoid this problem, equation (2) is estimated in two steps using the two-step OLS method. First, the bilateral cultural exports of country i to country j at time t,

where
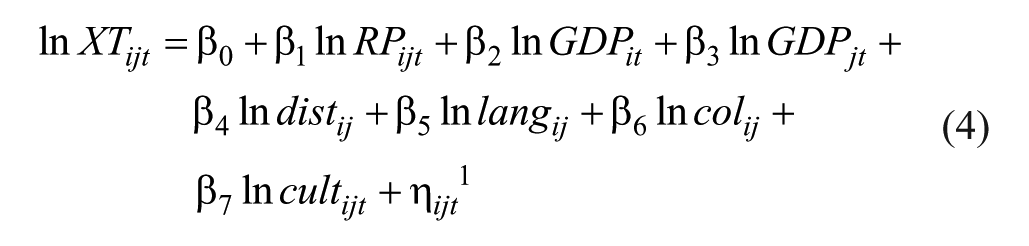
with
Table 3 summarizes the key descriptive statistics of the variables from equation (4) and the expected signs of their coefficients.
Descriptive Statistics of All Variables and Expected Signs for the Estimated Coefficients.
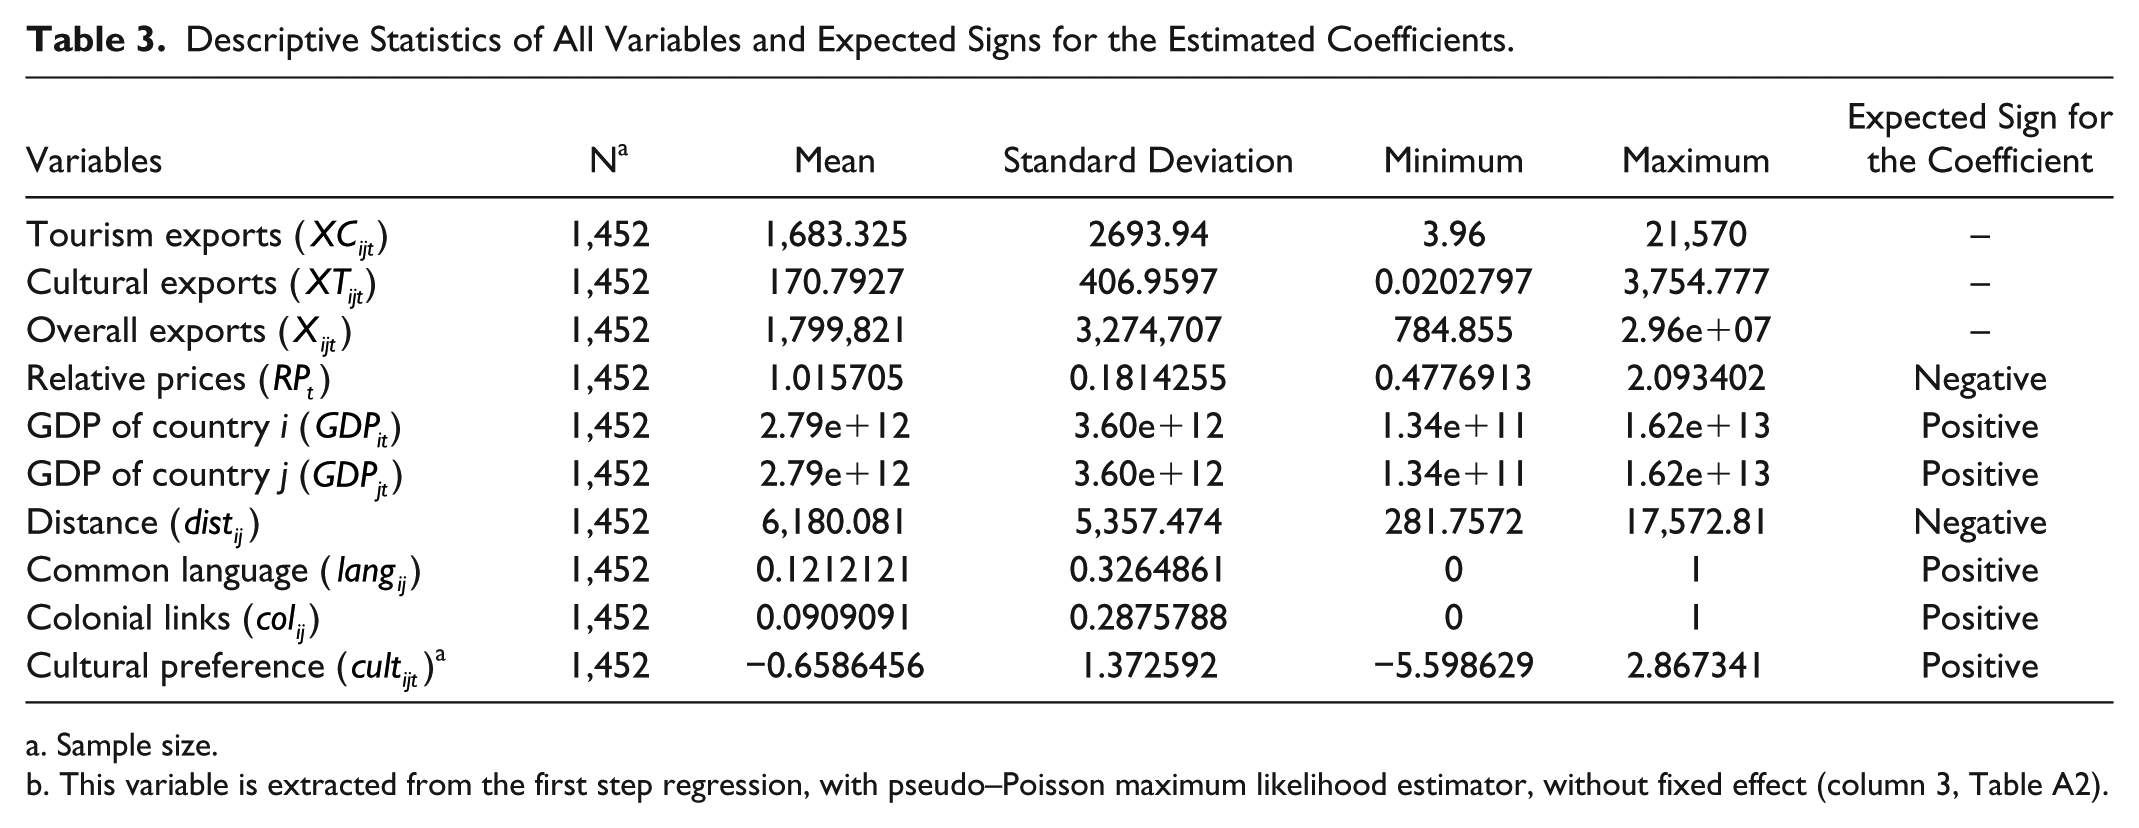
Sample size.
This variable is extracted from the first step regression, with pseudo–Poisson maximum likelihood estimator, without fixed effect (column 3, Table A2).
The model is estimated using temporal fixed effects, as country fixed effect will be perfectly collinear with the distance, common language and colonial link variables. Hummels (1999) and Redding and Venables (2004) have suggested the incorporation of exporter and importer fixed effects (in interaction with time fixed effects) in order to take into account the effect of the size, price, and number of varieties. However, as the estimation already includes variables for the size effects and for the price effect, the recommendation is deemed redundant here.
Initial estimations expose the presence of heteroscedasticity in the model. The econometric estimations are performed using two alternative methods. The most common way to address heteroscedasticity is the application of the OLS method on a model in the log-linear form using a robust estimator of the covariance matrix along the lines of Eicker–White (Eicker 1963; White 1980). The second approach used is the pseudo–Poisson maximum likelihood estimator. This method is recommended by Santos Silva and Tenreyro (2006) for gravity models that suffer from heteroscedasticity.
To avoid problems resulting from multicollinearity, a variance inflation factor (VIF) was used. The VIF for variable h is given by
Estimation Results
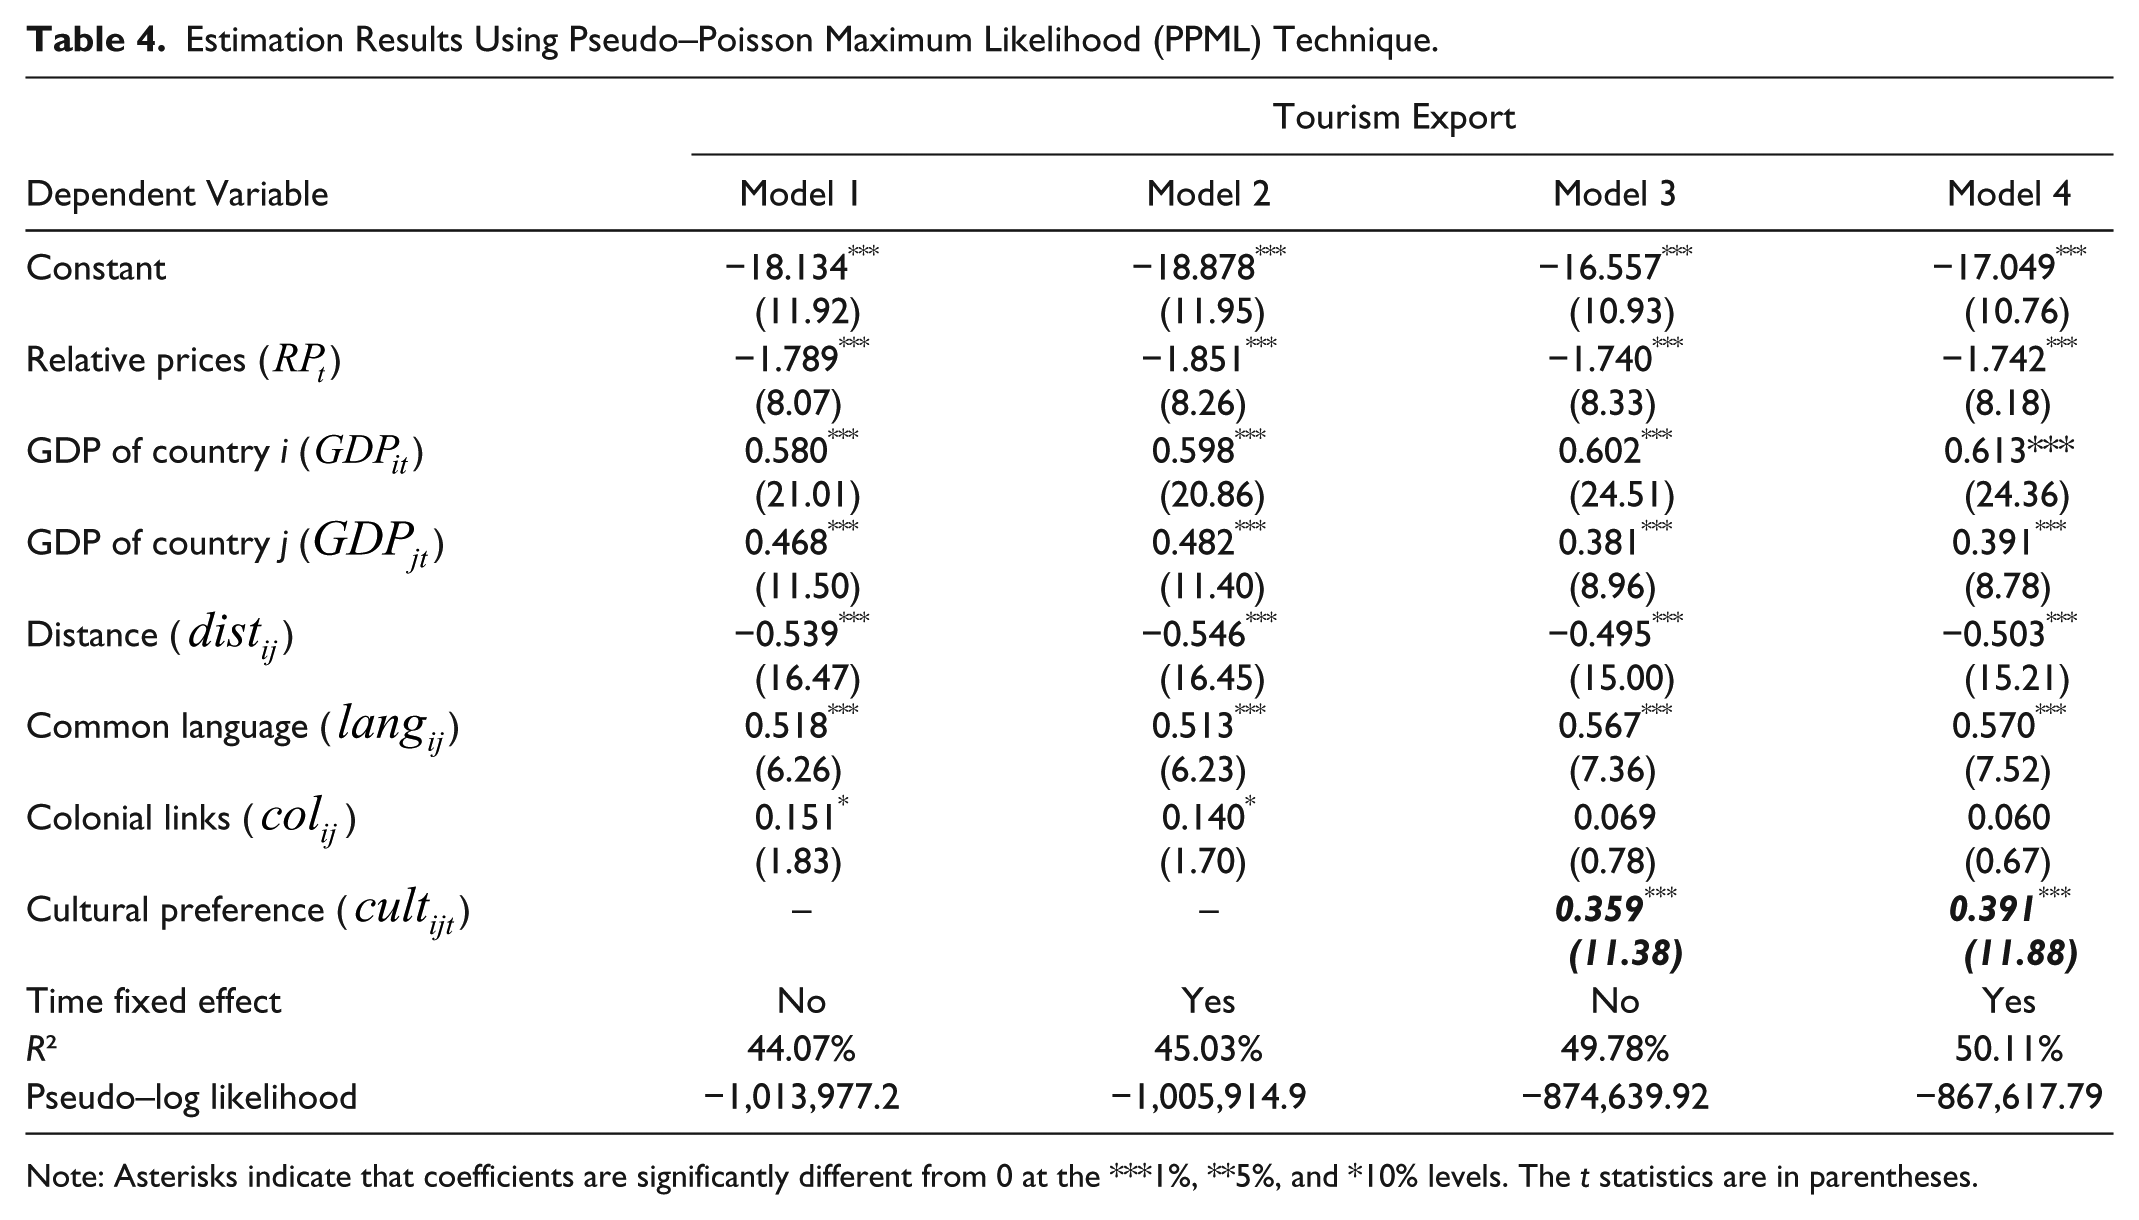
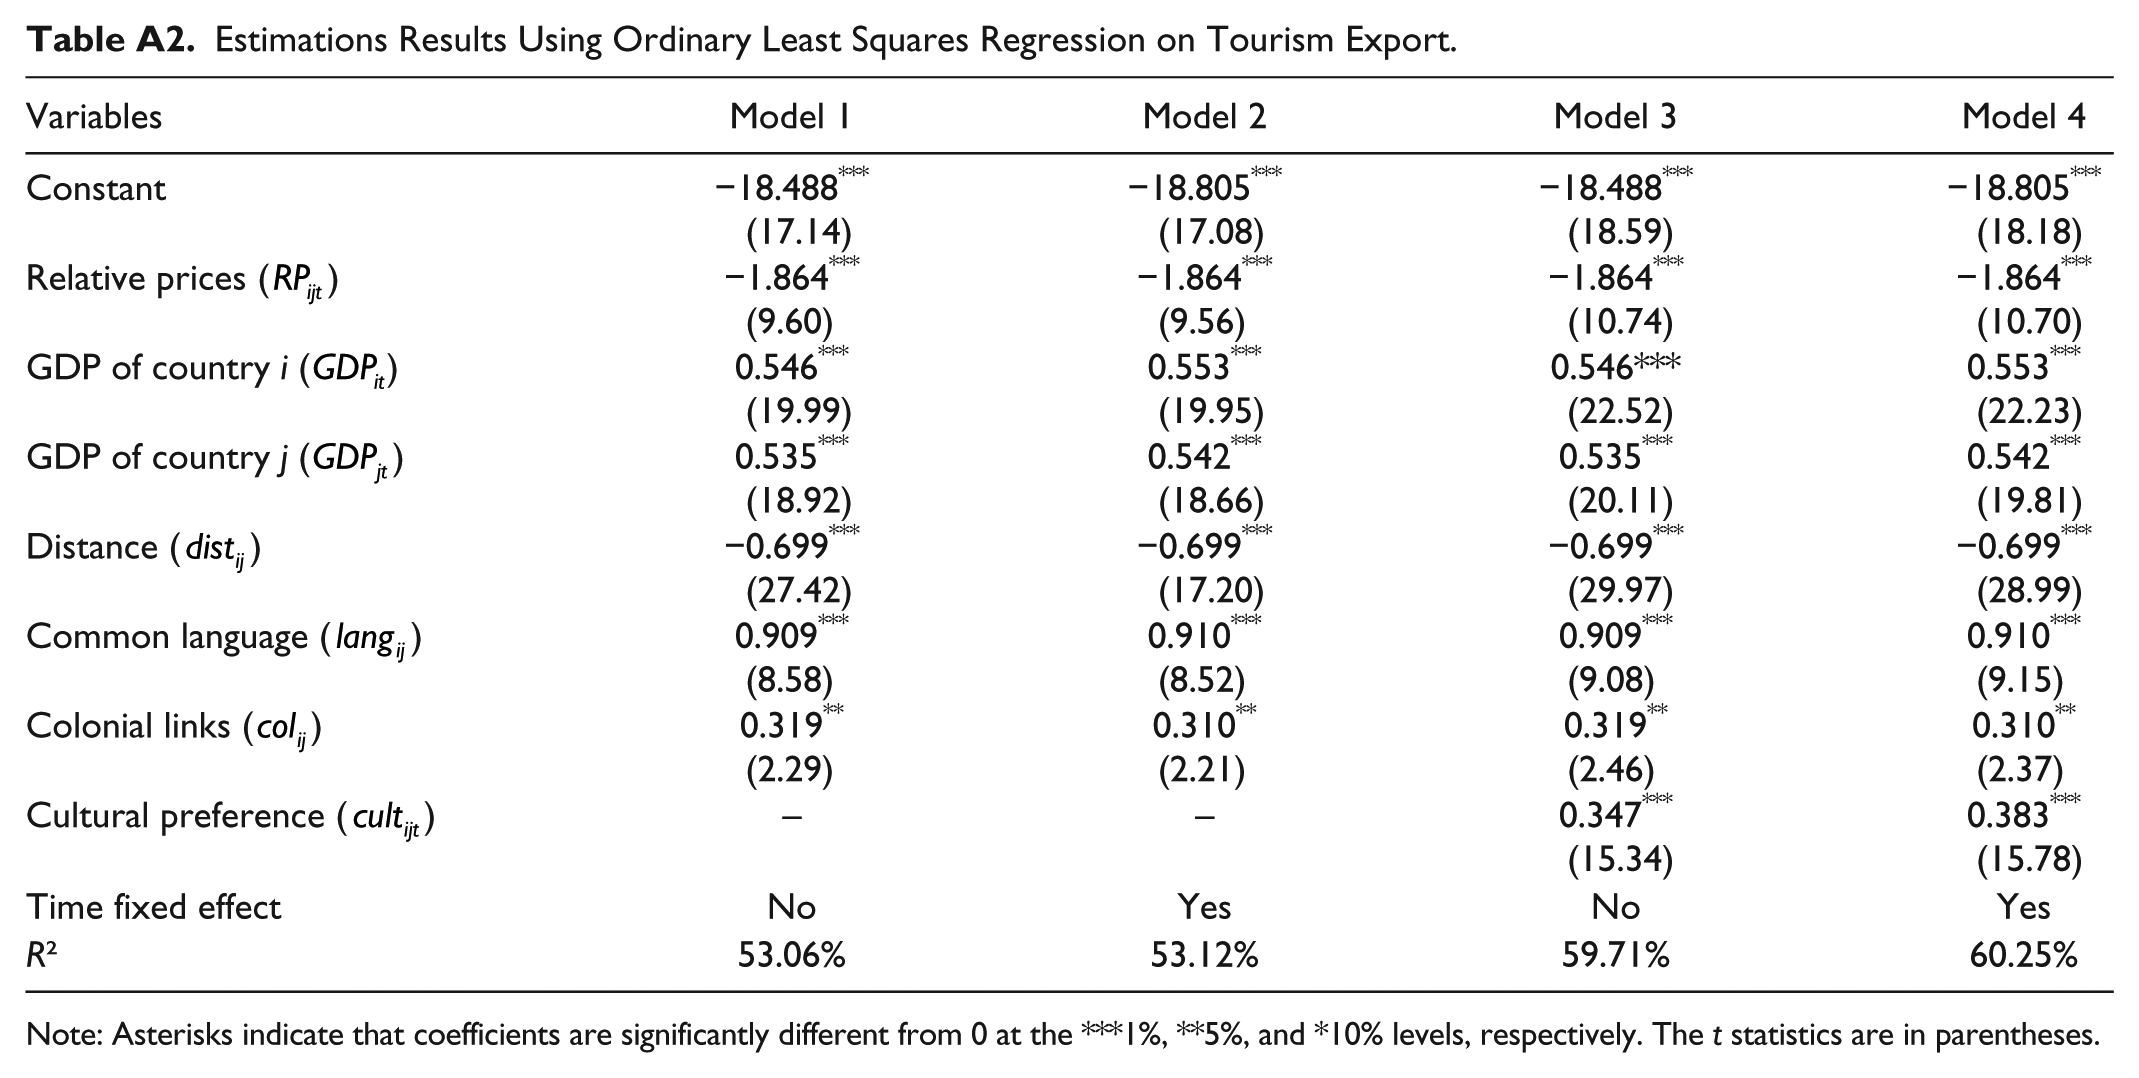
The results of the first step estimation are in Table A1 in the appendix. The results of the second step performed using OLS are in Table A2. The results that are retained for interpretation are given in Table 4. These are obtained by estimating equation 4 using the PPML technique and tourism receipts as the dependent variable. The results using the traditional method with dummy variables only are in columns 1 and 2. The findings from the proposed method are given in columns 3 and 4. Overall, neither the choice of estimators used nor the inclusion of fixed effect significantly alters the results obtained. This demonstrates that the results are robust and reliable. To compare the effect of
Estimation Results Using Pseudo–Poisson Maximum Likelihood (PPML) Technique.
Note: Asterisks indicate that coefficients are significantly different from 0 at the ***1%, **5%, and *10% levels. The t statistics are in parentheses.
All coefficients have the expected signs and are statistically significant irrespective of the estimation technique with the exception of colonial links, which is significant only when the model is estimated with OLS and loses its significance when the model is estimated using PPML with the cultural preferences. The coefficient of cultural links is highly significant irrespective of the estimation technique.
The coefficient of relative price is highly significant and negative, as expected. It reveals that tourism export is highly elastic and sensitive to changes in prices, confirming the results of the literature. The estimations, however, are higher than those of Vietze (2012), whose results are closer to −1, whereas here they range between −1.740 and −1.864. Note that Vietze only considered one destination, the USA, while this study includes several home and destination (OD) pairs. The results from these estimates point to the competitive nature of the business, which offers a range of choices to customers and suggests that tourism exports are more responsive to changes in prices compared to total exports.
The mass effect of the gravity model is obtained from the sum of the coefficient of the GDP variables. The bigger the economic mass of the OD pairs, the higher is the magnitude of the flows between the two countries. Traditionally, in the gravity model of international trade, the mass effect is approximately 1.5. In this study, the values obtained for total exports range from 1.66 to 1.74 and from 0.9 to 1.09 for tourism export. The empirical results confirm that on average, the closer the development levels between the two countries are, the more likely it is that these two countries will engage in bilateral trade and tourism trade. However, the effect on tourism trade is lower, indicating that to some extent, the developmental level may be a less important criterion for choosing a destination and its products and services than it is for conducting international trade. A certain category of tourists may choose to travel to destinations that are of a different developmental level from their home country, as they visit places to experience a different lifestyle and pace of life and experience the exotic. This may account for the lower mass effect than for total exports.
Furthermore,
The coefficient
Geographic distance between the OD pairs produces a push effect on the bilateral trade. The push effect is greater for total export, with an elasticity value of approximately −0.8, than for tourism export, with an elasticity value of −0.5. This can be because for some tourists, a greater distance and remoteness is part of the attraction of a destination, mitigating part of the negative effect from the inconvenience of long distance travel and associated economic costs. This shows that while distance has a negative effect on tourism demand, that effect is smaller on average than for total demand for export. On the other hand, it can be said that having a common language and colonial links demonstrates a degree of cultural proximity between the two countries, which has the effect of reducing the transaction costs of trading and, therefore, has a positive effect on trade. The coefficient of language, which is positive, clearly indicates that cultural proximity is beneficial for the tourism export as well. The limitations, however, as stated earlier, are that the two coefficients may absorb the effect of cultural preferences. The underlying assumption here is that the effect of cultural preference is symmetric, time invariant, and linear, which are very strong assumptions. This study differs from others in the tourism trade literature, in that the coefficients of these variables are isolated from the effect of preference for the culture of the destination, which is encapsulated by the cultijt variable. It may, therefore, be argued that in this study, the coefficient of language, 0.57, is a more accurate measure of the effect of cultural proximity on tourism trade.
The estimated partial coefficient of determination for the revealed cultural preference variable from the two specifications (PPML and OLS) ranges between 10.2% and 17.9%. 2 These rates are highly significant. The t statistics of this variable is more important than those of the relative price, the common border, and the GDP of the home country. Furthermore, the introduction of the cultural variable makes the colonial variable statistically insignificant. This result cannot be explained by correlation of the two variables because the potential correlation has been neutralized through the two-step estimation technique. It simply means that the cultural preference is better at explaining the preference of consumers and that the tourism trade literature has, thus far, missed an important factor in explaining the size of bilateral tourism trade. If the cultural preferences for country i from country j increase by 1%, then the tourism receipts of this country will increase on average by 0.39%, ceteris paribus (from column 4 of Table 4). That is, if two countries become culturally closer, the tourism export between these two countries can be expected to flourish. The results are smaller for total export, with a coefficient of 0.1, which is comparable to the results from Disdier et al. (2010), who find the cultural preferences variable close to 0.2. In this study, it is concluded that the effect of cultural preferences is almost four times larger on international tourism exports than on total exports.
Conclusion
This article supports the idea that tourist choice of destination is not only guided by economic factors but also by other noneconomic factors such as culture that add to the attractiveness of the destination. For this reason, the link between cultural preferences and tourism receipts is investigated within the framework of gravity models and using a panel data set. The literature has provided different ways of capturing the effect of cultural preferences on tourism receipts, and it is clear that there is a need to distinguish between the cultural distance/proximity and cultural preferences. A growing body of literature is investigating the channels through which culture affects trade. For example, cultural proximity has been proven to reduce the transaction cost of trading by cutting down on the cost of gathering information. However, culture itself is an item of consumption, and the volume/value of bilateral trade in cultural products reveals consumer preferences. Disdier et al. (2010) propose that the volume of trade in cultural products can be used to determine the level of cultural preferences between two trading partners. Regarding tourism trade, it can be said that, additionally, culture is one of the attributes of the destination that adds to its attractiveness. Sharing similar culture or preferring the culture of a destination encourages tourism expenses. A tourist may choose to visit a destination more often and spend more money when he or she shares an affinity with the culture of the destination. While this is not a new idea and several authors have sought to measure the effect of cultural preference, the methods that have been applied may be flawed.
Cultural proximity in a trade model is usually accounted for by the introduction of dummy variables. The limitations of this technique are twofold. It presupposes that cultural proximity between two nations is symmetrical and that it does not vary over time. These are very strong and limiting assumptions. In this article, it is argued that there is the need to separate the effect of cultural proximity from that of cultural preference by including a variable to measure the latter. The methodology applied in this study is inspired from Disdier et al. (2010). The UNESCO classification of cultural products is used to construct a variable of cultural preferences based on bilateral trade data for cultural products. By using the two-step estimation technique with a gravity model and a database that contains bilateral trade of 12 OECD countries for the period 2002–2012, a positive and significant impact of cultural preferences on tourism receipts is clearly identified.
Following the estimations, it is concluded that if the revealed preferences of cultural goods and services measured by export of cultural goods from country j to country i increases by 1%, then the tourism receipts of j increases by 0.39%. The proposed measure for preferences has the advantage of being time variant and asymmetric and is not linear, which overcomes the limitations from previous studies. By using data on export of cultural products, this article proposes a new way of distinguishing between the effect of cultural distance/proximity and cultural preferences on tourism receipts. The application of the two-step econometric procedure ensures that the variable is not correlated with any other in the model. Because the dummy variables representing language and the proposed variable for cultural preferences are statistically significant, it reinforces the case for disaggregating the effect into two separate components, each of which can be analyzed in isolation. This allows for a more accurate understanding of the effect of each. It leads to the conclusion that the model developed is also justifiable from a purely statistical point of view.
However, these results have to be taken with some caution. First, the database used includes only developed countries, and the size of the effects may differ when the tourism flows between developed and developing countries are considered. As is explained in the section on methodology, because of a number of constraints, the sample could not be extended to include more destinations. Second, the value of the trade of goods and services listed as cultural goods by UNESCO are the key data used for the measurement of the preference for the culture of the destination by home country consumers. It is likely that changes in the initial classification and measurement errors that normally exist in macroeconomic data due to aggregation misclassification means that other aspects of cultures have not been captured by the variable. The latter, however, remains a good and more reliable measure of cultural preferences.
Footnotes
Appendix
Estimations Results Using Ordinary Least Squares Regression on Tourism Export.
| Variables | Model 1 | Model 2 | Model 3 | Model 4 |
|---|---|---|---|---|
| Constant | −18.488
***
(17.14) |
−18.805
***
(17.08) |
−18.488
***
(18.59) |
−18.805
***
(18.18) |
| Relative prices ( ) | −1.864
***
(9.60) |
−1.864
***
(9.56) |
−1.864
***
(10.74) |
−1.864
***
(10.70) |
| GDP of country i ( ) | 0.546
***
(19.99) |
0.553
***
(19.95) |
0.546***
(22.52) |
0.553
***
(22.23) |
| GDP of country j ( ) | 0.535
***
(18.92) |
0.542
***
(18.66) |
0.535
***
(20.11) |
0.542
***
(19.81) |
| Distance ( ) | −0.699
***
(27.42) |
−0.699
***
(17.20) |
−0.699
***
(29.97) |
−0.699
***
(28.99) |
| Common language ( ) | 0.909
***
(8.58) |
0.910
***
(8.52) |
0.909
***
(9.08) |
0.910
***
(9.15) |
| Colonial links ( ) | 0.319
**
(2.29) |
0.310
**
(2.21) |
0.319
**
(2.46) |
0.310
**
(2.37) |
| Cultural preference ( ) | – | – | 0.347
***
(15.34) |
0.383
***
(15.78) |
| Time fixed effect | No | Yes | No | Yes |
| R² | 53.06% | 53.12% | 59.71% | 60.25% |
Note: Asterisks indicate that coefficients are significantly different from 0 at the ***1%, **5%, and *10% levels, respectively. The t statistics are in parentheses.
Acknowledgements
The authors thank Comue Lille Nord de France for its financial support. The authors are grateful to Dr Vincente Ramos and Dr Nicolas Peypoch for their comments and suggestions.
Declaration of Conflicting Interests
The author(s) declared no potential conflicts of interest with respect to the research, authorship, and/or publication of this article.
Funding
The author(s) disclosed receipt of the following financial support for the research, authorship, and/or publication of this article: The author(s) received financial support from the Comue Lille Nord de France for this reasearch.
