
Abstract
Fluctuations in the numbers of visitors directly affect the rates of return on tourism business activities. This article is the first to examine the spillover effects between the rate of change in the numbers of Chinese tourist arrivals and the rate of change in the numbers of international traveler arrivals. The study used daily data from January 1, 2014, to October 31, 2016, with 1,035 observations. The diagonal BEKK model was used to analyze the co-volatility spillover effects between the rate of change in the international travelers and the rate of change in the amount of Chinese tourists visiting Taiwan. The empirical findings suggest that Taiwan should abandon its development strategy of focusing only on a single market, namely, China. Moreover, with the reduction in Chinese tour groups visiting Taiwan, and increases in individual travelers, the Taiwan Government should change its previous travel policies of mainly attracting Chinese tour group travelers and actively promote in-depth tourism among international tourists.
Keywords
Introduction
With the rising tide of globalization, international exchanges and interactions are becoming increasingly frequent, and the international tourism industry is developing rapidly. Taiwan’s particular terrain and superior geographical location have led to a rich and varied natural landscape and ecological resources, together with a unique scenery and culture. According to the Travel and Tourism Competitiveness Report published by the World Economic Forum (WEF) in January 2017, Taiwan was ranked 30th overall among 136 countries and areas in terms of the Travel and Tourism Competitiveness Index (which encompasses an “enabling environment,” “travel & tourism policy and enabling conditions,” “infrastructure” and “natural and cultural resources”), 16th in regard to its ground and port infrastructure, and 28th in terms of its safety and security.
As a consequence of the large-scale liberalization of Cross-Strait tourism policies in 2008, the numbers of Chinese tourists visiting Taiwan have continued to rise (Taiwan Tourism Bureau 2017). In 2010, China became the largest source of international tourists to Taiwan (although both Taiwan and China regard tourists in each direction as domestic tourists). By the end of 2015, the numbers of tourists from China were 3.43 million, or 45.8% of the total numbers of foreign tourists, with China becoming the major country affecting the development of Taiwan’s tourism economy (Taiwan Tourism Bureau 2017). The growth in the numbers of international tourists has led to an increase in foreign exchange earnings from tourism, with 10.69 million international arrivals in Taiwan in 2016 (an increase of 2.4% compared with 2015), and foreign exchange income from tourism of about 13.374 billion US dollars (UNWTO 2017).
According to statistics from the Tourism Bureau of the Ministry of Transportation and Communications (MOTC), the total number of international travelers visiting Taiwan for sightseeing purposes rose from 1,775,200 in 2008 to 7,560,700 in 2016. The direct contribution of tourism to Taiwan’s GDP reached 2.0% (or growth rate of 0.5%), leading to an increase in capital investment of NT$5.9 billion (an increase of 1.5%), and accounting for 2.6% of employment opportunities (up by 4.0%) (WTTC 2017).
From 2008 to 2016, foreign exchange revenues from tourism increased sharply from NT$5.936 billion to NT$13.374 billion, for an annual compound growth rate of 10.69%, which is much higher than the 5.95% recorded over 2000–2008, and resulting in a large amount of foreign exchange earnings for Taiwan (see Figure 1). The ratio of Chinese tourists to the total number of international travelers also rose from 5.34% (or 947,600 visitors) in 2008 to 37.64% (or 2,845,500 visitors) in 2016 (see Figure 2). International visitors to Taiwan in 2016 came mainly from six regions, namely, China, Hong Kong and Macao, Japan, South Korea, Singapore, Malaysia, and United States. Compared with the numbers of tourists who visited in 2015, South Korea achieved the highest growth of 36.4%, followed by Japan at 16.14%, and the United States at 16%.
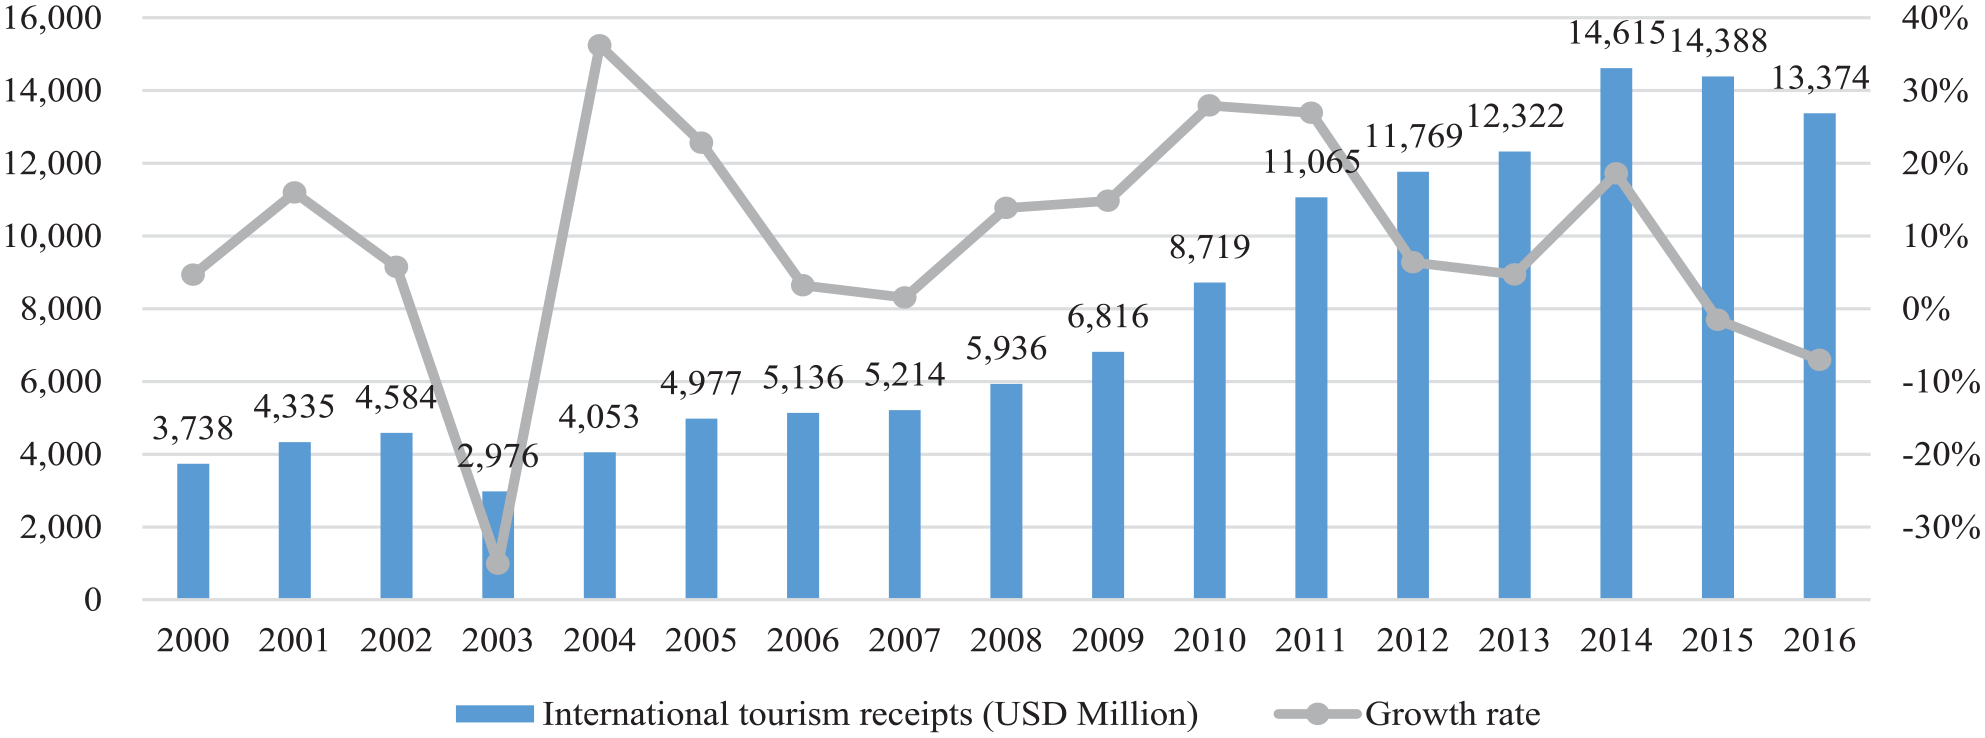
Taiwan’s international tourism receipts and growth rate from 2000 to 2016.

International and Chinese tourist arrivals from 2008 to 2016.
International travelers are driving the development of the local economy in Taiwan. The main tourism spots that have attracted large numbers of international travelers include night markets, Taipei 101 (which held the record was the world’s tallest building from December 31, 2004, to January 4, 2010), National Palace Museum (Taipei), Chiang Kai-shek Memorial Hall (Taipei), Sun Yat-sen Memorial Hall (Taipei), Jiufen (Danshui-Taipei), Sun Moon Lake (Nantou County), Kenting National Park (Hengchun Peninsula of Pingtung), and Taroko Gorge National Park (Hualien County).
The numbers of travelers from China visiting Taiwan are closely related to the political relations across the Taiwan Strait. As the political positions and political environment on the two sides of the Taiwan Strait change, nongovernmental exchanges between the two are indirectly affected. This is especially so when there are conflicts between Taiwan and China, when there is an increased awareness of Taiwan’s sovereign independence in the former and a greater push for territorial reunification in the latter. At such times, sensitivities between the two sides are heightened and this, in turn, may affect the willingness of Chinese tourists to travel to Taiwan.
Since 2008, when Taiwan relaxed its Cross-Strait tourism policy, China has quickly become the largest source of international tourists visiting Taiwan. With the huge increase in the numbers of Chinese tourists, the ability of Taiwan’s tourism industry to handle and support so many visitors has been surpassed. It has also led to views that the quality of tourism in Taiwan is deteriorating, thereby discouraging international travelers. Although the data show that the numbers of international travelers has been increasing on an annual basis, the foreign exchange earnings from tourists have exhibited a downward trend since 2015. As the numbers of tourists from China have declined, the numbers of tourists in the major sightseeing spots have also fallen which, in turn, has had an impact on businesses surrounding the tourist attractions.
According to the “Survey Report on Visitors’ Expenditure and Trends in Taiwan” prepared by the MOTC’s Tourism Bureau, the average spending per person per day for travelers visiting Taiwan has been the highest among tourists from Japan, followed in second place by Chinese tourists. However, spending by Chinese travelers accounts for roughly one-half, on average, of total tourism expenditure in Taiwan, so that they are ranked first in terms of overall expenditures among international visitors to Taiwan.
In terms of the items that are consumed or purchased, there are differences in consumption characteristics between Chinese tourists and other international travelers, in that international tourists tend to attach greater importance to leisure and culture, and exhibit a relatively strong demand for quality accommodation and surrounding facilities. For example, expenditure on hotel accommodation by tourists from Japan, United States, and Europe accounts for between 45% and 50% of their total tourism expenditures. Travelers from South Korea and Singapore spend about 40% of their total travel expenditure on hotel accommodation, with purchases of mostly local products and specialty products accounting for the major share of their expenditure. In addition, spending on food and entertainment by Japanese travelers is much higher, on average, than for visitors from other countries, indicating that Japanese tourists are more willing to pay to experience Taiwanese food and culture (Taiwan Tourism Bureau 2017).
Chinese tourists are less demanding when it comes to the quality of accommodation and eating. In terms of shopping expenditures on purchasing local products and specialty products, Chinese tourists spend large sums on fine clothes, jewelry, jadeware, and cosmetics and perfumes (Taiwan Tourism Bureau 2017).
As international travelers pay higher fees for accommodation, operators of high-priced international tourist hotels are less affected by changes in the numbers of Chinese tourists visiting Taiwan. Chinese tourists, on the other hand, are less willing to spend large amounts on accommodation and food and are more inclined to be part of tour groups. For this reason, reductions in the numbers of Chinese tourists have a greater impact on retailers, lower-priced hotels, and related tour operators in Taiwan.
In spite of the asserted goodwill and maintenance of peace on both sides of the Taiwan Strait after the Democratic Progressive Party (DPP) was elected over the Kuomintang (KMT) in Taiwan in 2016, President Tsai Ing-Wen did not clearly articulate the One-China principle, as demanded by the People’s Republic of China. This led to official dissatisfaction on the part of the Chinese Government, among them limitations in the numbers of Chinese tourists to visit Taiwan. The statistical data indicate that the numbers of Chinese tourists to Taiwan have decreased significantly.
The number of Group-type travelers declined by 7.21% in 2015 and by 29.95% in 2016, whereas the number of Medical-type travelers fell by one-half. The number of Individual-type travelers has also decreased slightly. The decline in visitor arrivals has also directly affected Taiwan’s foreign exchange earnings from tourism, with such revenues falling by 1.55% in 2015 and by 7.05% in 2016 (National Immigration Agency of Taiwan 2017; Taiwan Tourism Bureau 2017). International tourists have not been affected by the political influence brought on by the change in the National Government and, as of 2016, the total number of such visitors has continued to rise.
Because of the changing political positions and political environment on the Cross-Straits, and after the presidential candidate of the Democratic Progressive Party, Ing-Wen Tsai, became the 14th President of Taiwan, the numbers of tourists from China have declined. The decrease in the number of Chinese tourists has hit the tourism-related industries, especially tour operators, tour bus companies, businesses providing nighttime snacks, more budget-conscious hotels, and boutiques that are close to the major tourist attractions. On September 12, 2016, tourism-related enterprises in Taiwan formed a Self-Help Society for the Millions in the Tourism Industry, and demonstrated in the streets, while demanding that the government propose appropriate response policies to enable them “to survive, work, and have enough food and clothing.”
In order to encourage Chinese and international tourism, the Self-help Society for the Millions in the Tourism Industry was organized by the General Chamber of Commerce of the Republic of China, ROC Tourist Hotels Business Association, ROC Federation of Travel Agents, ROC National Federation of Hotels, National Federation of ROC Tour Buses, ROC Tourist Guide Association, ROC Association for Quality Products, the Taiwan Bed & Breakfast Association, Taiwan Tourism Recreation Area Association, Taipei Business District and Industrial Confederation, Hot Spring Tourism Association Taiwan, and Taiwan Brilliant Tourism Association.
The remainder of the article gives a literature review (next section), data and variables (third section), model specifications (fourth section), empirical results (fifth section), and conclusion, limitations of the article, and directions for future research (final section).
Literature Review of Tourism Spillover Effects
The existing tourism literature has reached conclusions based on empirical results using models that do not have the statistical properties of consistency and asymptotic normality, so that the estimates of spillover effects are biased and inferences regarding the purported statistical significance are not valid. From the perspective of policy-making, as Chinese tourists have become the largest tourism source for Taiwan, it is worth checking carefully and correctly the risk fluctuations between the numbers of changes in Chinese tourists and International tourists to Taiwan.
In terms of theoretical contributions, this article uses the fundamental equation in tourism finance established by McAleer (2015) to link the rate of return on tourism revenues to the rate of change in the numbers of tourists. The article uses the multivariate Diagonal BEKK conditional volatility model, with known mathematical regularity conditions and valid asymptotic statistical properties, to analyze the volatility spillovers between the rates of change in the numbers of Chinese tourists and of international visitors. Applying quantitative finance methods to tourism and analyzing the risk and volatility in relation to different groups of Chinese and international tourists is helpful in understanding the impact of tourists on Taiwan as a useful reference to the Taiwan Government for policy making.
Moreover, unlike most of the tourism literature that uses a model without regard to their statistical properties, this article uses an appropriate multivariate conditional volatility model, namely, Diagonal BEKK, with valid statistical properties of consistency and asymptotic normality, to analyze the spillover effects. Consequently, the empirical estimates are statistically valid. The model’s statistical properties have not previously been discussed carefully and in detail in the tourism literature.
Spillover effects were initially applied in the finance literature and have been examined in the tourism literature since 2005. Chan, Lim, and McAleer (2005) measured spillover effects of tourism demand among four leading countries to Australia. Hoti, McAleer, and Shareef (2007) measured spillover effects of international tourism demand for small island tourism economies, such as Cyprus and Malta. A similar study for small island tourism economies, namely Maldives and Seychelles, was undertaken by Shareef and McAleer (2008). Seo, Park, and Yu (2009) examined spillover effects of South Korean tourists to Jeju island, Thailand, Singapore, and the Philippines. Chang et al. (2011) examined spillover effects of tourism demand for ASEAN countries to Taiwan. Balli and Tsui (2016) investigated interregional spillover effects for international tourism demand, such as Canada, China, Germany, Japan, Korea, United Kingdom, and United States to Australia and New Zealand.
However, virtually none of the previous studies above have been concerned with whether the multivariate conditional volatility models conform to the statistical properties of consistency and asymptotic normality. In other words, most previous studies have reached conclusions about spillover effects based on invalid statistical inference. As distinct from the previous literature, this article uses a mathematically tractable and statistically valid multivariate conditional volatility model, namely, Diagonal BEKK, which has satisfactory statistical properties of consistency and asymptotic normality, so that the empirical estimates of the spillover effects are statistically valid, with correct inferences regarding statistical significance.
From the empirical results, it is shown that Taiwan should abandon its development strategy of only focusing on a single market, namely China, and to be proactive in encouraging visits by international travelers to Taiwan for sightseeing purposes. Such a strategy would increase the willingness of international travelers to visit Taiwan.
Spillover effects, which are widely used in research in empirical finance and cognate disciplines, measure the transfer of risk between financial products, thereby helping investors to forecast their returns vis-à-vis risk and allocate their investment products optimally. The changes in the numbers of international travelers in the tourism market are just as uncertain and risky as are the changes in the returns in financial markets. In the past, conditional volatility models have been used in tourism finance to analyze the changes in the numbers of tourist arrivals. In this section, we discuss the issues surrounding spillover effects in relation to the risks associated with tourism revenues.
From a practical perspective, the article estimates the spillover effects correctly for the number of change of Chinese tourists and International tourists. Furthermore, the article provides details of the volatility spillovers for each type of Chinese tourists and international tourists to Taiwan, which can help the Taiwan Government to understand the risk substitutes between the changes in international tourists and the different types of Chinese tourists. The empirical results suggest that Taiwan should abandon its development strategy of only focusing on a single market, namely China, and to be pro-active in encouraging visits by international travelers to Taiwan for sightseeing purposes. Such a strategy would increase the willingness of international travelers to visit Taiwan.
Chan, Lim, and McAleer (2005) analyze the effect of fluctuations in risk in relation to the demand for travelers visiting Australia from Japan, New Zealand, United Kingdom, and United States over the period July 1975 to December 2000. They use the constant conditional correlation (CCC), VARMA-GARCH, and VARMA-AGARCH models to estimate the effects of fluctuations in risk. “Fluctuations in risk” refers to the time dependency of risk as a function of shocks to tourist arrivals. The “interdependency of risk” refers to the time dependency of the correlations and covariances between pairs of countries. “Asymmetry” refers to the different impacts of shocks of equal magnitude on volatility.
The empirical results show that there exist cross-country interdependent effects with regard to the demand for tourism between Japan and United Kingdom, Japan and United States, and New Zealand and United States. This implies that one country’s tourist arrivals are affected by the previous period’s shocks from another country’s tourist arrivals. In addition, the authors also find evidence of asymmetric effects in relation to the risk volatility of travel demand for both Japan and New Zealand. This means that a negative shock had a greater impact on the volatility of travel demand for Japan than a positive shock of similar magnitude, while a negative shock had a smaller impact on the volatility of travel demand for New Zealand tourist arrivals than a positive shock of equal magnitude.
In exploring the spillover effects between tourism growth and country risk premiums for small island tourism economies (SITEs), Hoti, McAleer, and Shareef (2007) use tourist arrivals in Cyprus and Malta covering the period from May 1996 to May 2002, as well as composite country risk ratings published monthly by the International Country Risk Guide (ICRG). Hoti, McAleer, and Shareef (2007) also use the VARMA-GARCH and VARMA-AGARCH models to estimate the spillover effects in relation to risk fluctuations. The empirical results show that tourism growth in Cyprus has a significant positive risk spillover effect on the growth of tourism in Malta, while the country risk premium between Cyprus and Malta exhibits an interdependence effect. There is also a significant negative risk spillover effect between tourism growth in Cyprus and its country risk premium. There is, however, no risk spillover effect between Malta’s tourism growth in Malta and its country risk premium.
The above suggests that Cyprus and Malta are complementary destinations for international tourists, such that changes in the tourism patterns in Cyprus lead to changes to the tourism patterns in Malta. With regard to country risk returns, there are interactions between shocks to Cyprus and Malta. Moreover, the shocks to tourism growth for Cyprus tend to decrease the volatility in country risk returns for Cyprus. For Malta, there are independent effects between tourism growth and country risk returns.
In relation to SITEs, Shareef and McAleer (2008) use the VARMA-GARCH model to explore the risk spillover effects between the Maldives and the Seychelles regarding tourism demand emanating from source countries that provided tourists to these destinations between January 1994 and December 2003. Risk spillover effects, or spillover effects, refer to time-varying correlations and covariances, that is, the effect of a shock in one country’s tourist arrivals on the volatility of a different country. The empirical results show that cross-country risk spillover effects from the Seychelles to the Maldives are greater than those from the Maldives to the Seychelles. Therefore, the tourism demand for the Seychelles affects the tourism demand for the Maldives in a significant way. This suggests that the changes in international tourist arrivals from Italy, Germany, United Kingdom, France, and Switzerland to the Seychelles affect the changes in international tourist arrivals to the Maldives.
In analyzing the monthly departures of South Korean tourists from Korea to the Philippines, Singapore, and Thailand, as opposed to those going to Jeju Island over the period from April 1980 to June 2006, Seo, Park, and Yu (2009) examine the risk spillover effects in relation to the tourism demand created by these tourists. Using a dynamic conditional correlation (DCC) model to estimate these risk spillover effects, the empirical results show that the risk spillover effects for tourism demand between Jeju Island and the Philippines, Singapore, and Thailand are negatively correlated.
This empirical finding indicates that there is a substitution effect for tourism demand, especially in South Korea beginning in 1988 when, following the implementation of the Liberalization of the Travel Code policy, controls on outbound travel from South Korea were relaxed until the 1997 Asian financial crisis. During this period, there is a significant increase in travel demand by South Koreans to visit the Philippines, Singapore, and Thailand, which, in turn, reduced the travel demand for visits to Jeju Island.
Using the CCC, VARMA-GARCH, and VARMA-AGARCH models to estimate the risk spillover effects, Chang et al. (2011) examine the travel demand for ASEAN countries. Using monthly data on inbound travelers for four major southeast Asian countries, namely, Indonesia, Malaysia, Singapore, and Thailand, from January 1997 to July 2009, the empirical results show that there is evidence of volatility spillover effects for the country pairs Thailand and Malaysia, Thailand and Singapore, Singapore and Indonesia, Singapore and Malaysia, and Indonesia and Malaysia, but not for Thailand and Indonesia. This suggests that the changes in international tourist arrivals between these country pairs will affect each other.
In order to examine the existence of risk spillover effects between tourism demand and the exchange rate, Akar (2012) uses the DCC model to estimate the risk spillover effects of the number of visits by travelers from the Eurozone, United Kingdom, and United States to Turkey, and monthly exchange rate data (Turkish Lira/Euro, Turkish Lira/Sterling, and Turkish Lira/US dollar) from January 2001 to November 2011. The empirical results indicate that there is a positive spillover effect between travel demand and the exchange rate for visitors from the Eurozone and United States. This suggests that the exchange rate is an important determinant of Turkish tourism demand from the Eurozone and United States. When the exchange rate increases, tourism demand on the part of those travelers from the Eurozone countries and United States visiting Turkey also increase. However, no such risk spillover effect is found to exist between tourism demand and exchange rate on the part of travelers from the United Kingdom, which implies that tourism demand from the United Kingdom to Turkey is not highly sensitive to the exchange rate.
In another study that also examines the spillover effects between tourism demand and the exchange rate, Yap (2012) uses data covering the period from January 1991 to January 2011 based on the number of visits by travelers from China, India, Japan, Malaysia, New Zealand, Singapore, South Korea, United Kingdom, and United States, and monthly exchange rate data for each currency relative to the Australian dollar. The risk spillover effects are estimated using the CCC, VARMA-GARCH, and VARMA-AGARCH models. The empirical results show that the persistence of the impact of exchange rate shocks on tourism demand gradually decrease over time, and that there is only a weak relationship between the exchange rate and tourism demand. These empirical results indicate that tourism demand on the part of travelers to Australia is affected only slightly by exchange rates. Specifically, the sudden appreciation of the Australian dollar will not have long-term negative impacts on Australia’s inbound tourism.
In evaluating how a country’s geographic location might influence the spillover effects for interregional tourism demand, Balli, Curry, and Balli (2015) use a multivariate GARCH model to estimate the risk spillover effects. The authors analyze the interregional spillover effects for interregional tourism demand for New Zealand’s main tourist attractions (Auckland, Wellington, and Canterbury), and 32 of New Zealand’s regional tour organizations (RTOs), for the period from January 2007 to May 2013. They use variance ratios to estimate the impact of the fluctuations in tourism demand for these major tourist attractions on the fluctuations in the demand for tourism among the RTOs.
The empirical results show that the interregional spillover effects of the major tourist attractions and the RTOs in New Zealand are significant, and also indicate the size of the impacts. In addition to the proximity of geographical locations, the article also examines whether there are scheduled flights between the RTOs and the major tourist destinations that might also impact the interregional spillover effects between two different regions. This empirical observation indicates that major centers and tourism hotspots (such as Queenstown) can attract tourists into a region, and then neighboring regions are likely to receive spillover benefits, with regular flights between major centers and tourism hotspots becoming tourism routes.
In a further study on the interregional spillover effects for international tourism demand in Australia and New Zealand, Balli and Tsui (2016) use a bivariate GARCH model to estimate the risk spillover effects using data on the monthly arrivals of international travelers to Australia and New Zealand from Canada, China, Germany, Japan, Korea, United Kingdom, and United States from 2000 to 2012. The results show that the tourism demand of travelers from East Asia (China and Japan) visiting New Zealand have a significant spillover effect on the tourism demand of travelers visiting Australia. In addition, tourism demand for travelers from Western countries (Canada, Germany, and the United States) visiting Australia have significant spillover effects on New Zealand’s tourism demand, whereas the tourism demand for UK travelers visiting New Zealand and Australia is found to have significant symmetrical spillover effects.
These results suggest that New Zealand’s tourism demand had spillover effects onto Australian tourism demand when tourists originated from “East Asian” countries. Australian tourism demand had spillovers effects onto New Zealand when tourists originated from “Western” countries. Tourism demand spillovers become obvious in both directions when tourists originated from the United Kingdom.
Valadkhani, Smyth, and O’Mahony (2017) investigate the interdependence and risk volatility of the spillover effects resulting from Australia’s inbound and outbound visitor traffic. The authors use monthly data on the arrivals and departures of visitors to Australia from 49 countries for the period from January 1991 to July 2014, and a multivariate GARCH model, to estimate the risk spillover effects. The results show that there is interdependence among international travelers from countries including Brazil, China, India, and Indonesia.
The results show that there is interdependence among international tourist arrivals and departures from Brazil, China, India, and Indonesia to Australia. Fluctuations in the numbers of inbound and outbound passengers from China, Hong Kong, Papua New Guinea, Singapore, South Africa, and the United Kingdom are found to have significant spillover effects, implying that changes in the numbers of arriving and departing visitors from these countries indirectly cause risks to fluctuate, implying that unanticipated global shocks have the greatest impact on these markets. This is likely to have adverse effects on Australia’s tourism market.
From the research findings presented above, it can be seen that the analysis of spillover effects in the context of tourism-related issues has focused mainly on tourism spillover effects between different countries, cities, or regions, in order to explain the changes and interrelationships in tourism demand among countries, cities, or regions. In this article, the issue of the impact of volatility in tourism demand between Chinese tourists and other international travelers visiting Taiwan is discussed in terms of changes in the rate of growth of tourist arrivals and their corresponding volatility. In what follows, we briefly introduce the multivariate conditional volatility model specification that will be used in the empirical analysis.
Data and Variables
Changes in the numbers of tourists can lead to many uncertainties. Changing the numbers of visitors directly affects the rates of return on tourism business activities. Therefore, maintaining a firm grasp of the relationship between changes in the numbers of Chinese tourists and international travelers is conducive to the formulation of a practical and efficient tourism strategy, which will affect the economic benefits accruing to Taiwan’s tourism industry and the economy more generally.
Although the topic of international visitors to Taiwan is important, existing research has discussed the issue of travel demand between Chinese tourists and international travelers. This article is the first to examine the spillover effect between the rate of change in the numbers of Chinese tourist arrivals and the rate of change in the numbers of international traveler arrivals. The article also decomposes, for the first time, Chinese tourists into three distinct categories, namely Group-type, Individual-type, and Medical-type categories, in order to compare the extent and magnitude of the fluctuations in risk between the different types of Chinese and international travelers.
Applications of multivariate conditional variability models are too numerous to mention, but almost none of the extant literature has been concerned with whether or not the multivariate conditional variability models conform to statistical properties of consistency and asymptotic normality, so that the empirical results obtained contained invalid inferences. Among numerous contributions to the literature are Chan et al. (2005), Hoti, McAleer, and Shareef (2007), Shareef and McAleer (2008), Seo, Park, and Yu (2009), Chang et al. (2011), Akar (2012), Yap (2012), Balli, Curry, and Balli (2015), Balli and Tsui (2016), and Valadkhani, Smyth, and O’Mahony (2017).
Daily data for the arrivals in Taiwan of both international travelers and Chinese tourists are obtained from the National Immigration Agency of the ROC’s Ministry of Interior, and cover the period from January 1, 2014, to October 31, 2016, for a total of 1,035 observations.
Given the information provided by the National Immigration Agency regarding the numbers of Chinese travelers arriving in Taiwan, there are three types of Chinese travelers, namely, Group type, Individual type, and Medical type.
The formula used to calculate the rate of change in the total number of tourists each day is
Definitions of Variables.

Table 2 presents the descriptive statistics for the rate of change in the numbers of international travelers and Chinese tourists visiting Taiwan. The standard deviation shows that the extent of the dispersion in the rate of change in the numbers of Chinese tourists coming to Taiwan is greater than for international tourists. The skewness coefficient is positive, meaning that the sequence of the rate of change in the numbers of tourist numbers is skewed to the right. The kurtosis statistic is greater than 3, showing that the distribution has a high narrow peak, with the possibility of extreme observations. The Jarque-Bera statistic shows that none of the rankings match a normal distribution. The sequences for the three types of Chinese travelers also have the characteristics of a right-skewed distribution and high narrow peaks, and none of them seems to have a normal distribution.
Descriptive Statistics.
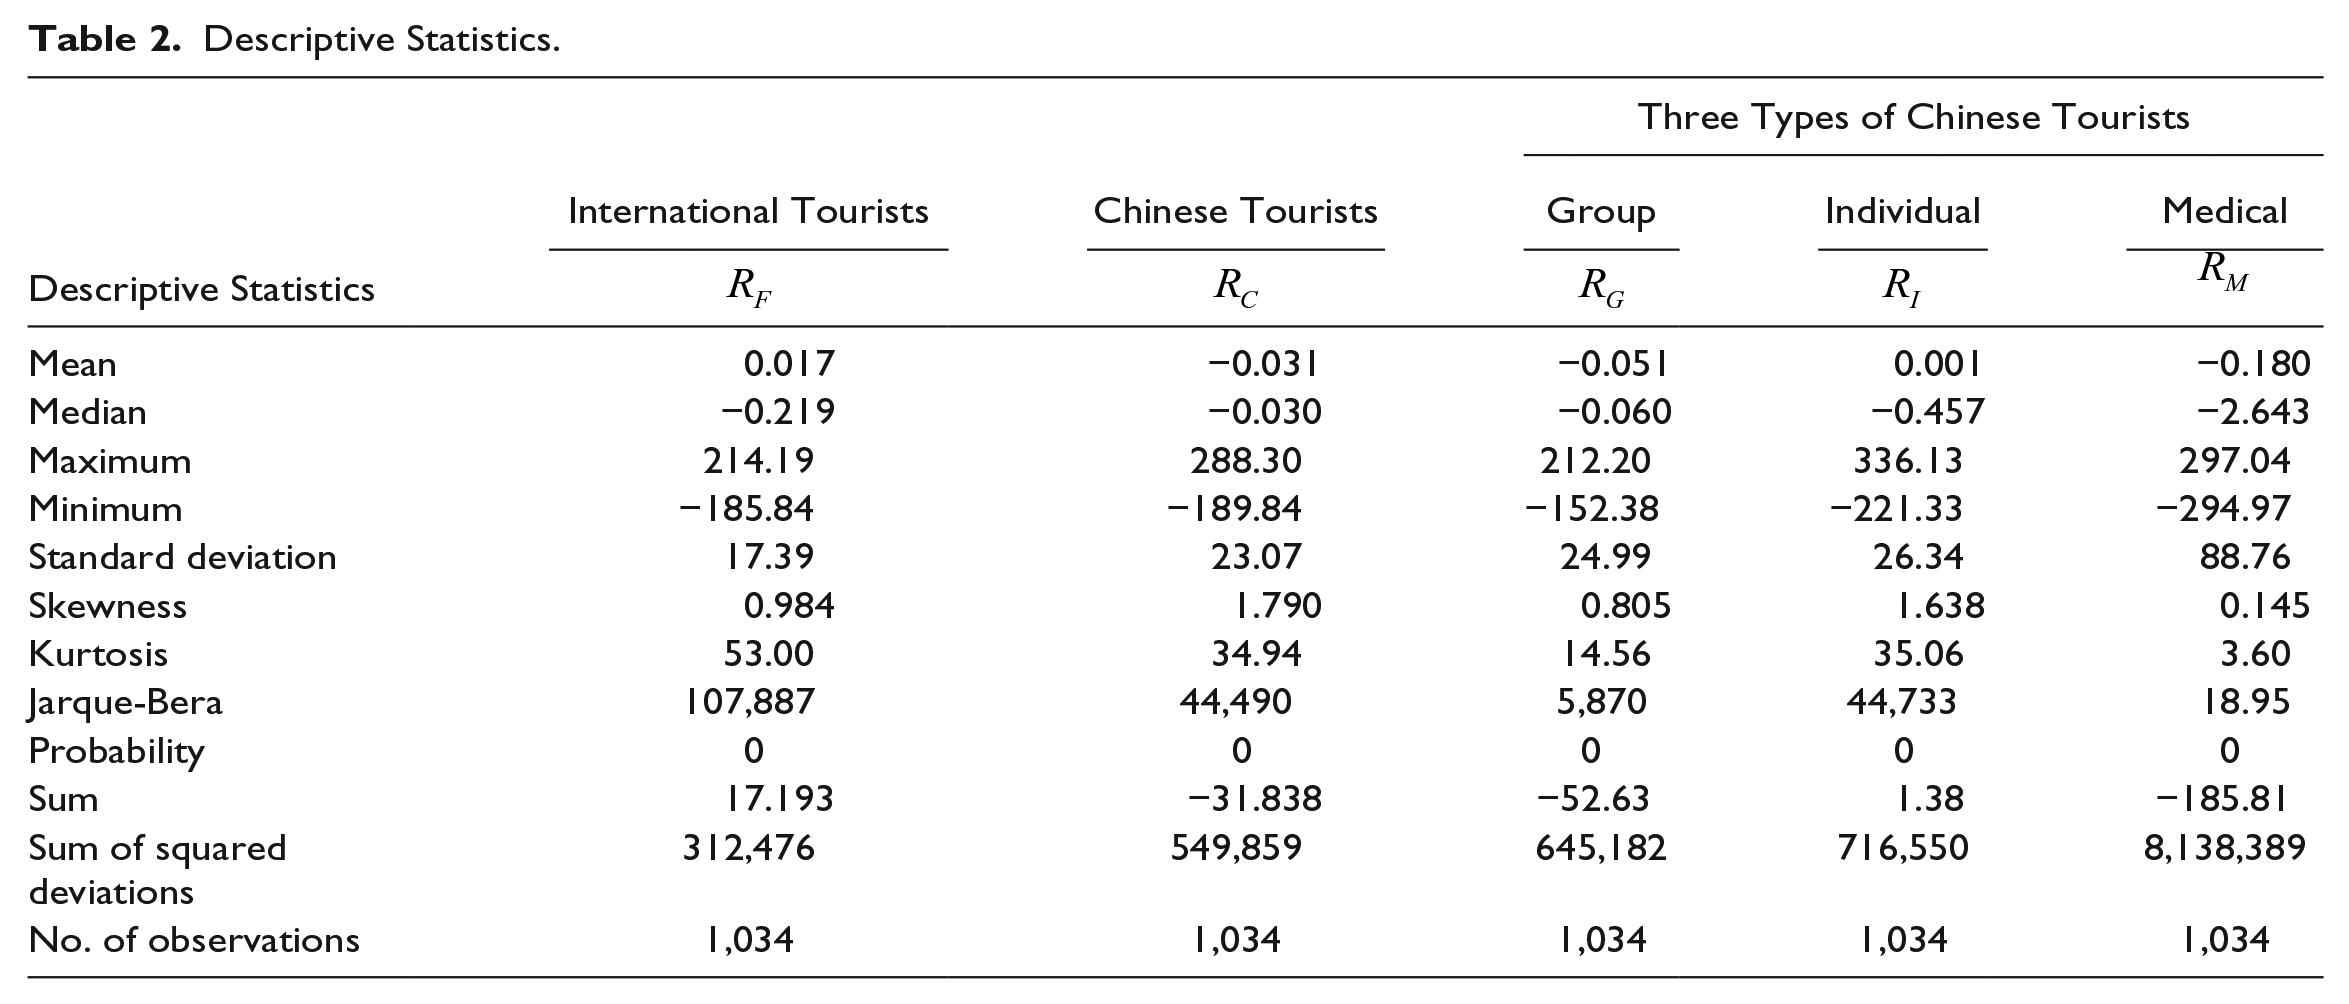
Figure 3 depicts the trend in terms of the numbers of tourists, and the trend in the rate of change in tourist numbers. From the numbers of tourist arrivals, it can be seen there will generally be higher numbers of visits by international travelers during the New Year holidays, whereas the numbers of Chinese tourists (especially Group-type and Individual-type tourists) have seen remarkable growth during the times when China has public holidays. This is especially the case during the Chinese National holidays (October 1-7) and the Chinese Lunar New Year holidays (January 31-February 6, 2014; February 18-24, 2015; and February 7-13, 2016).

Daily tourist arrivals and their change rate to Taiwan from January 1, 2014, to October 31, 2016.
In addition, the numbers of Chinese tourists (especially Group-type travelers) have markedly declined since the change in government in May 2016. The trend for the rate of change in the numbers of tourists depicted in the second column is similar to that in the first column. The fluctuations in the numbers of both Group-type and Individual-type Chinese tourists are larger during the Chinese public holiday periods, especially during China’s National holidays (1-7 October). However, the fluctuations in the numbers of Medical-type Chinese tourists exhibit a persistent volatility clustering effect.
Following the above financial analysis, we seek to determine whether the sequence of variables is characterized by stationarity, using the Augmented Dickey-Fuller (ADF), Phillips-Perron (PP), and Kwiatkowski-Phillips-Schmidt-Shin (KPSS) tests for the existence of a unit root. The results in Table 3 show that the sequence,
Unit Root Tests.
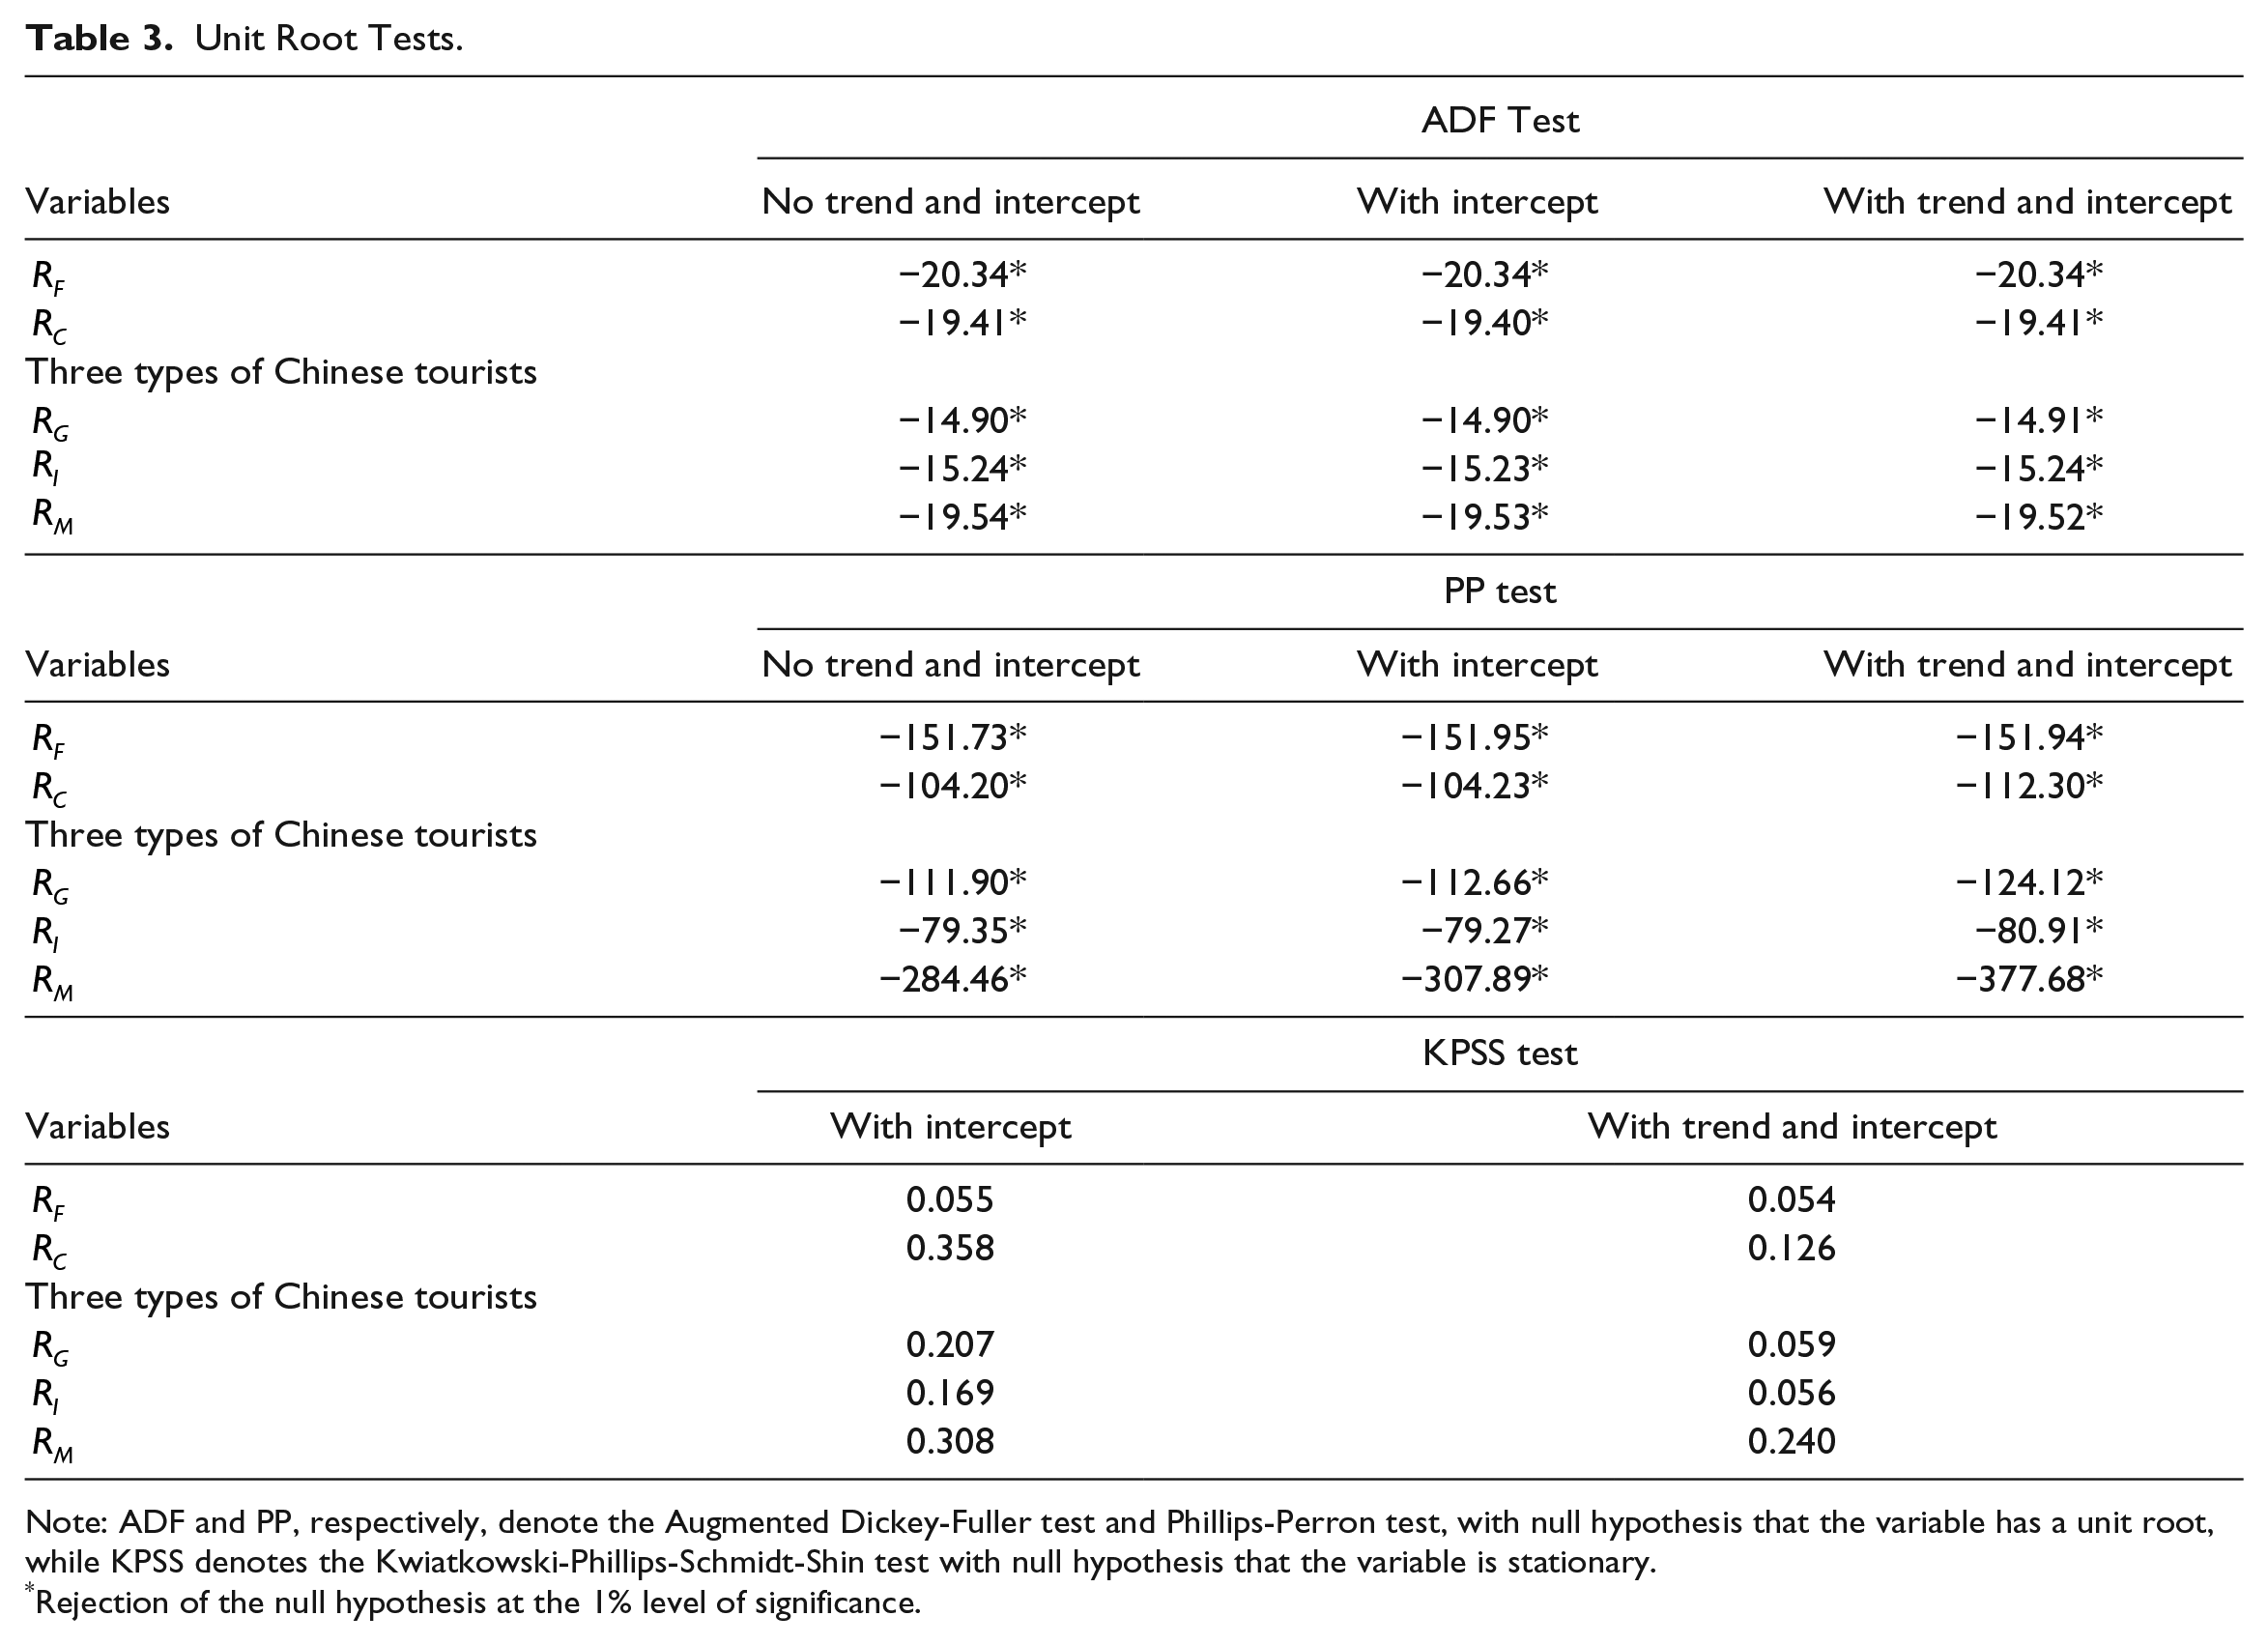
Note: ADF and PP, respectively, denote the Augmented Dickey-Fuller test and Phillips-Perron test, with null hypothesis that the variable has a unit root, while KPSS denotes the Kwiatkowski-Phillips-Schmidt-Shin test with null hypothesis that the variable is stationary.
Rejection of the null hypothesis at the 1% level of significance.
Model Specifications
In order to capture volatility spillover effects, numerous articles in empirical research use multivariate conditional volatility models to estimate conditional covariances. The most widely used models include the constant conditional correlational (CCC) model of Bollerslev (1990), the Baba, Engle, Kraft, and Kroner (BEKK) multivariate GARCH model of Baba et al. (1985) and Engle and Kroner (1995), the dynamic conditional correlation (DCC) model of Engle (2002), the vector ARMA-GARCH (VARMA-GARCH) model of Ling and McAleer (2003), and the VARMA-asymmetric GARCH (VARMA-AGARCH) model of McAleer, Hoti, and Chan (2009). For further details on these and other leading multivariate conditional volatility models, see McAleer (2005) and Chang et al. (2018a).
Despite the popularity and wide use of multivariate conditional volatility models in empirical finance, there are theoretical problems associated with virtually all of them. The CCC, VARMA-GARCH, and VARMA-AGARCH models have static conditional covariances and correlations, which means that accommodating volatility spillovers is not possible (see McAleer et al. 2008). Moreover, the Full BEKK and DCC models have been shown to have no regularity conditions, and hence no asymptotic properties of consistency and asymptotic normality (for further details, see Chang and McAleer 2019; McAleer 2019a; 2019b). Therefore, this article uses the Diagonal BEKK (DBEKK) model to estimate the volatility spillover effects as DBEKK has known regularity conditions and asymptotic properties.
In the previous section, we discuss the DBEKK multivariate conditional volatility model (for further details, see McAleer et al. 2008; and Chang et al. 2018a; 2018b; for univariate conditional volatility models, see Engle 1982; Tsay 1987; and Ling and McAleer 2003). Following that, we define covolatility spillovers and the test of the null hypothesis of volatility spillover effects. Next, in order to link the rate of returns on tourism revenue to the rate of change in the numbers of tourists, we present McAleer’s (2015) fundamental equation in tourism finance.
Diagonal BEKK Model
The multivariate extension of the univariate ARCH and GARCH models is presented in Baba et al. (1985) and Engle and Kroner (1995). The multivariate extension of equation (1) can remain unchanged by assuming that the three components are each

where the financial returns are given as
For establishing volatility spillovers in a multivariate framework, it is useful to define the multivariate extension of the relationship between the return shocks and the standardized residuals, as follows:

where
The conditional correlation matrix of

where

Equation (3) is useful if a model of
In order to derive the DBEKK model, McAleer et al. (2008) used an extension of the Tsay (1987) univariate RCA process, namely the vector random coefficient autoregressive process of order one, which is given as:
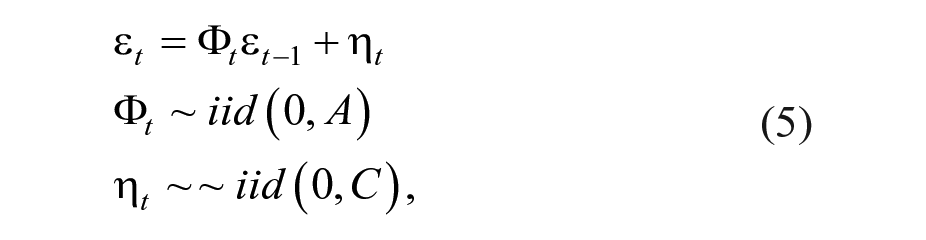
where
If A is a full matrix, the Full BEKK model cannot be derived from any known underlying stochastic processes, which means there are no regularity conditions and hence also no valid asymptotic properties of QMLE of the associated parameters, except by assumption (for further details, see Chang et al. 2018a; Chang and McAleer 2019). Moreover, as estimation of the Full BEKK model involves 3m(m+1)/2 parameters, the “curse of dimensionality” will be likely to arise, which means that convergence of the estimation algorithm becomes problematic and less reliable when there is a large number of parameters to be estimated (for further details, see Chang et al. 2018a).
Therefore, in the empirical analysis, in order to investigate volatility spillover effects, the DBEKK model will be estimated. McAleer et al. (2008) show that the multivariate extension of GARCH(1,1) from equation (5) is given as the diagonal BEKK model, namely:
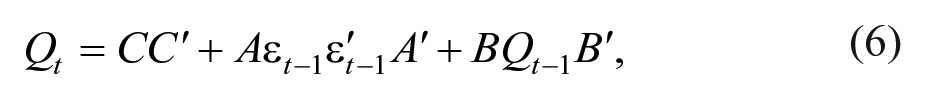
where
McAleer et al. (2008) prove that the QMLE of the parameters of the DBEKK model are consistent and asymptotically normal, so that standard statistical inference on testing hypotheses is valid. Moreover, as
Testing Co-volatility Spillovers
Chang et al. (2018a) show that the DBEKK model permits a test of co-volatility spillover effects, which is the effect of a shock in commodity
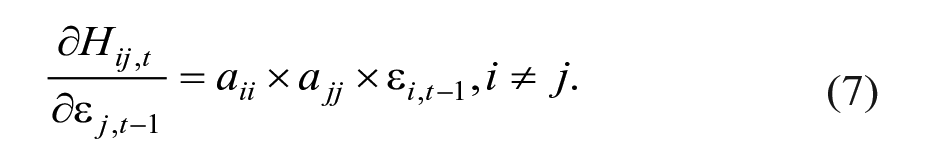
As
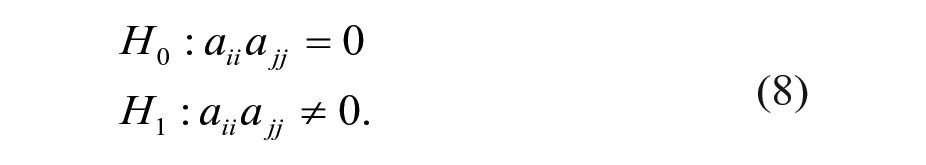
If
It should be emphasized that the returns shock of commodity
Fundamental Equation in Tourism Finance
McAleer (2015) developed the Fundamental Equation in Tourism Finance to connect the growth in the number of tourists and the returns on the associated tourism financial asset. In this article, we use the fundamental equation to derive the relationship between the change rate of tourist arrivals and the financial (tourism) returns, which is derived from

Consider equation (9) where total daily tourist expenditure,

It follows from equation (10) that:

where ∆ is the first difference operator, so ∆yt is the change in total daily tourism expenditure, ∆xt is the change in the net daily tourist arrivals, which the net daily tourist arrivals is the total number of daily tourist arrivals minus daily tourist departures.
Using the lagged version of equation (9) to divide the left-hand side of equation (11) by
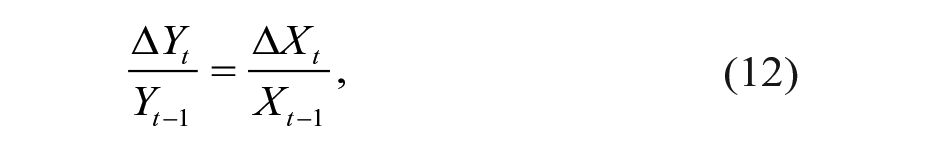
where equation (12) leads to the fundamental equation in tourism finance, which relates the growth in total daily tourism expenditure, or alternatively the daily returns on total tourism,
Therefore, we use the change rate of tourist arrivals as being equivalent to the change rate of total daily Chinese tourism expenditure for purposes of the empirical analysis.
Empirical Results
This article has analyzed the dependency relationship between Chinese tourists and international travelers visiting Taiwan, and has estimated the risk spillover effects by using the DBEKK model that has mathematical regularity conditions and valid asymptotic properties. In order to understand the effects of the interactions between the different types of Chinese tourists and international travelers, we have disaggregated the total Chinese tourists into Group-type, Individual-type, and Medical-type Chinese tourists. We analyze the dependency relationships between each of the three types of Chinese tourists and international travelers, as well as on the risk spillover effects among these various groups.
Granger Causality and Co-volatility Spillovers between Chinese Tourists and International Tourists
The upper half of Table 4 presents the dependency relationships between the rate of change in the numbers of Chinese tourists (
Diagonal BEKK for Chinese and International Tourists.
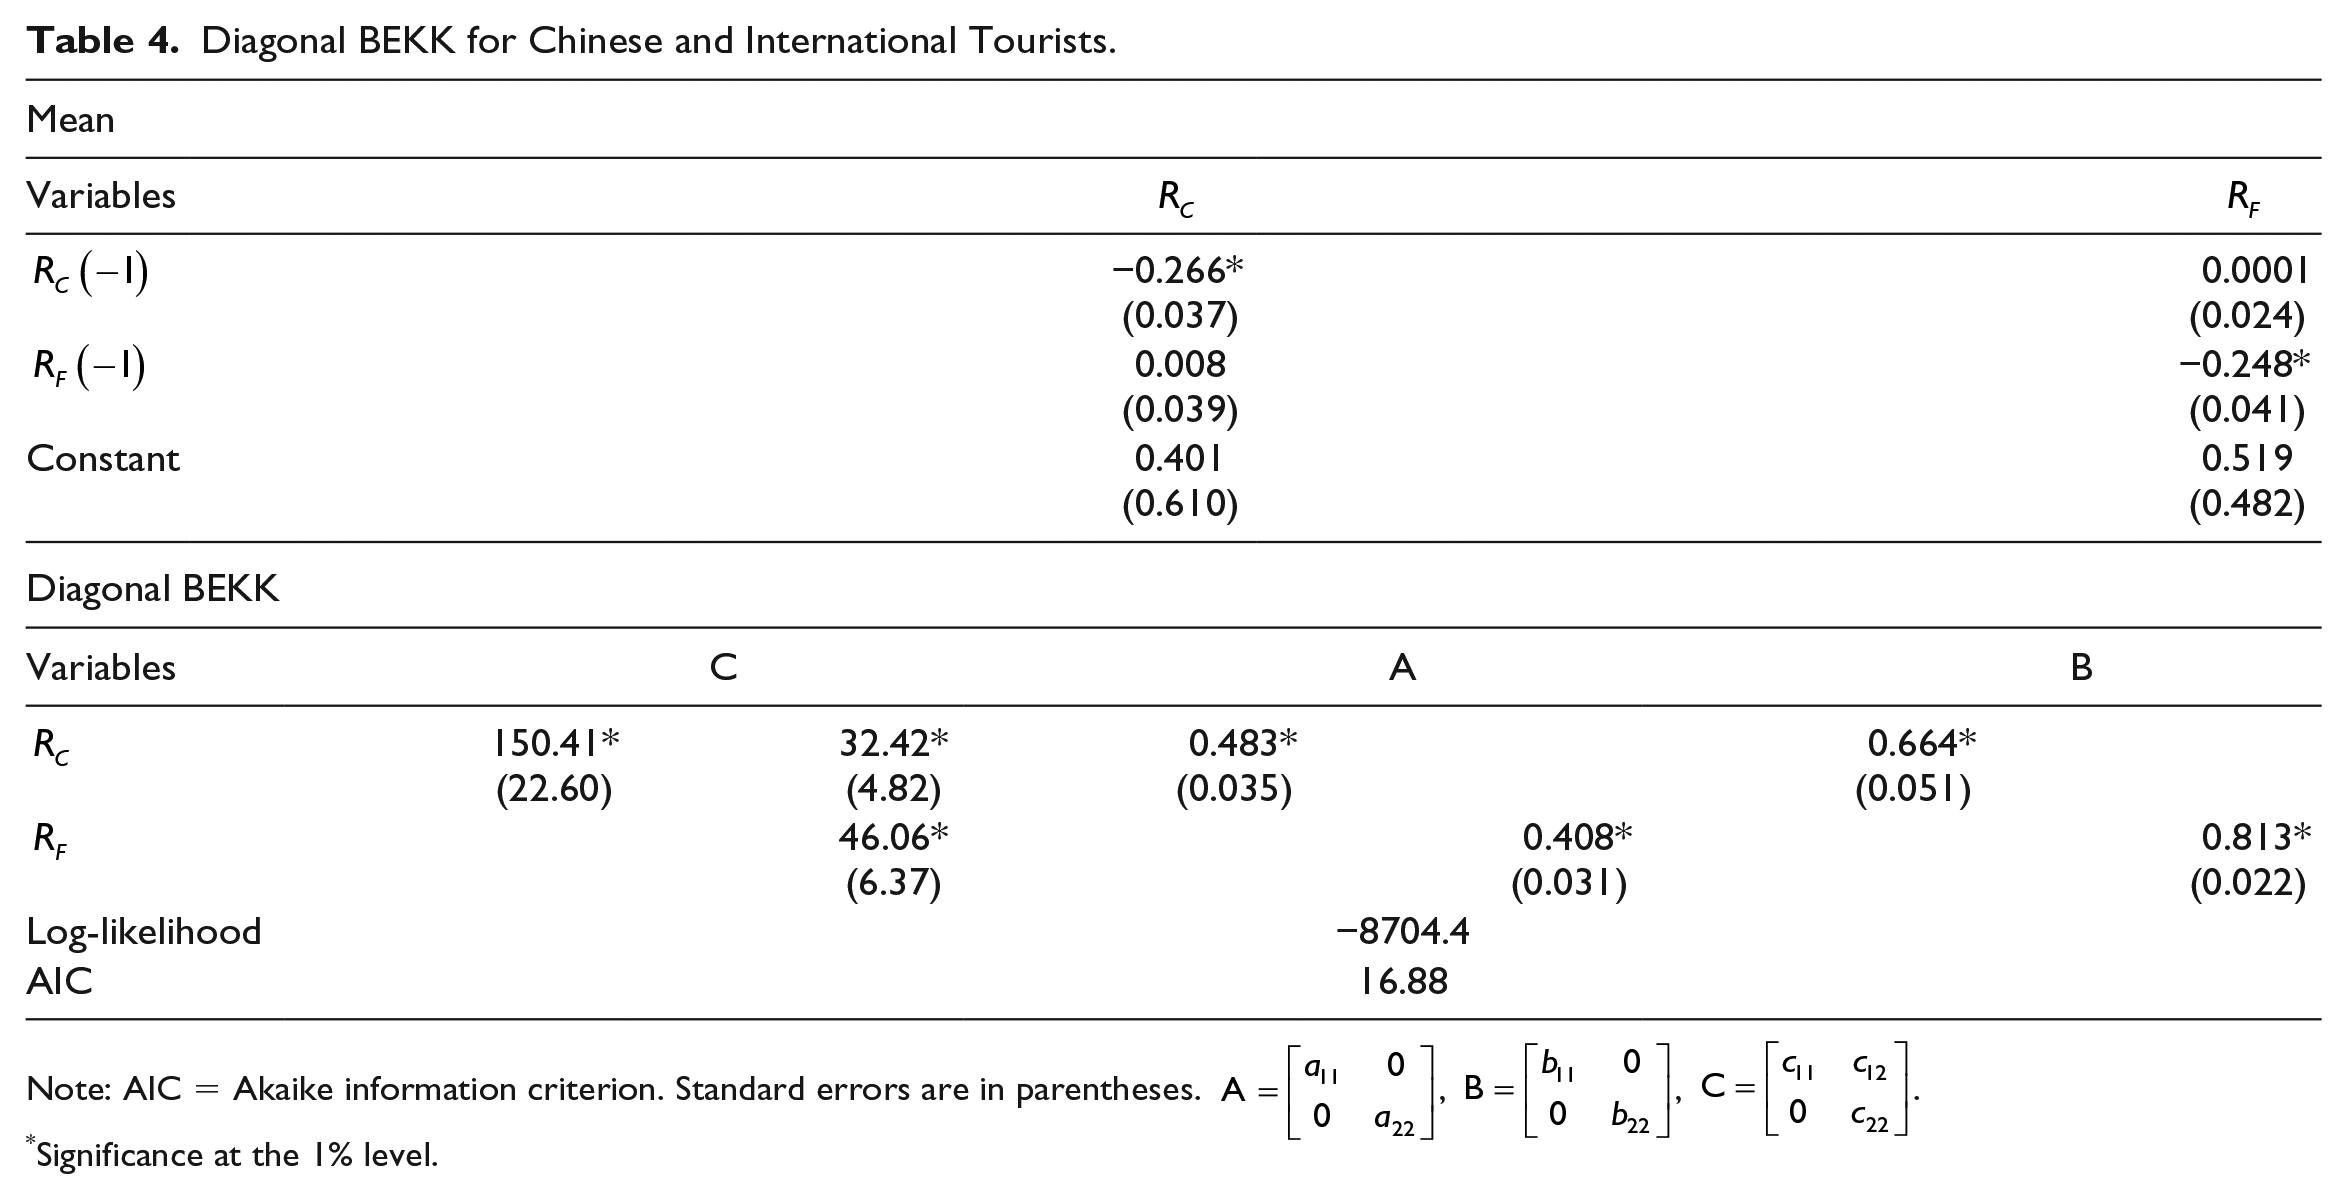
Note: AIC = Akaike information criterion. Standard errors are in parentheses.
Significance at the 1% level.
The lower part of Table 4 presents the estimated risk volatility spillover effects of the DBEKK model. The estimated parameters in matrix A in the second column (0.483, 0.408) are significantly different from zero at the 1% significance level, indicating that the respective impacts of the rates of change in the numbers of tourists in the previous period, whether visiting Taiwan from China or from other countries, on the rates of change in the numbers of such tourists in the current period, both exhibit significant co-volatility spillover effects.
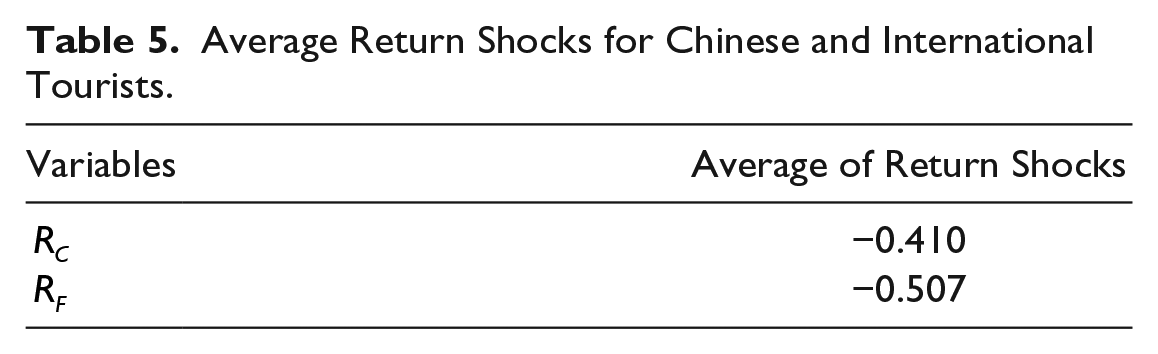
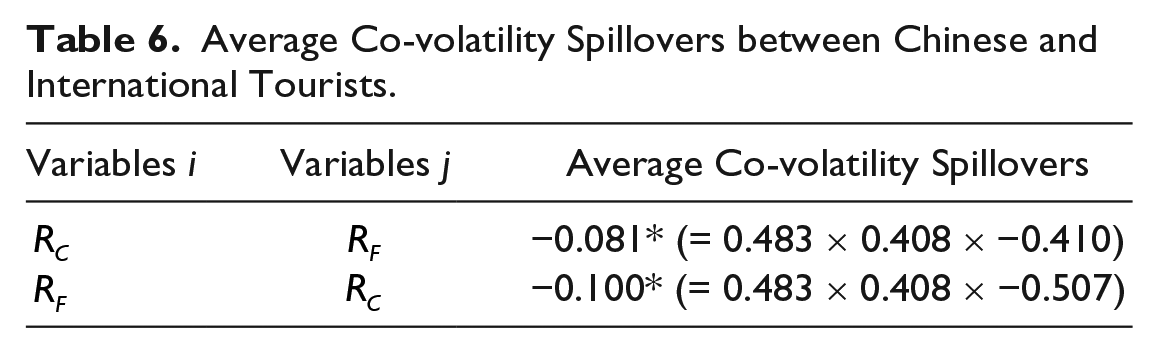
Table 5 reports the means of the impact of tourists visiting Taiwan on tourism revenue, and Table 6 reports the co-volatility spillover effects. For example, the average co-risk volatility spillover effect of
Average Return Shocks for Chinese and International Tourists.
Average Co-volatility Spillovers between Chinese and International Tourists.
Granger Causality and Co-volatility Spillovers between Three Types of Chinese Tourists and International Tourists
The upper half of Table 7 reports the interdependency relationships between the rate of change in the numbers of the three types of Chinese tourists visiting Taiwan (
Diagonal BEKK for Three Types of Chinese Tourists and International Tourists.
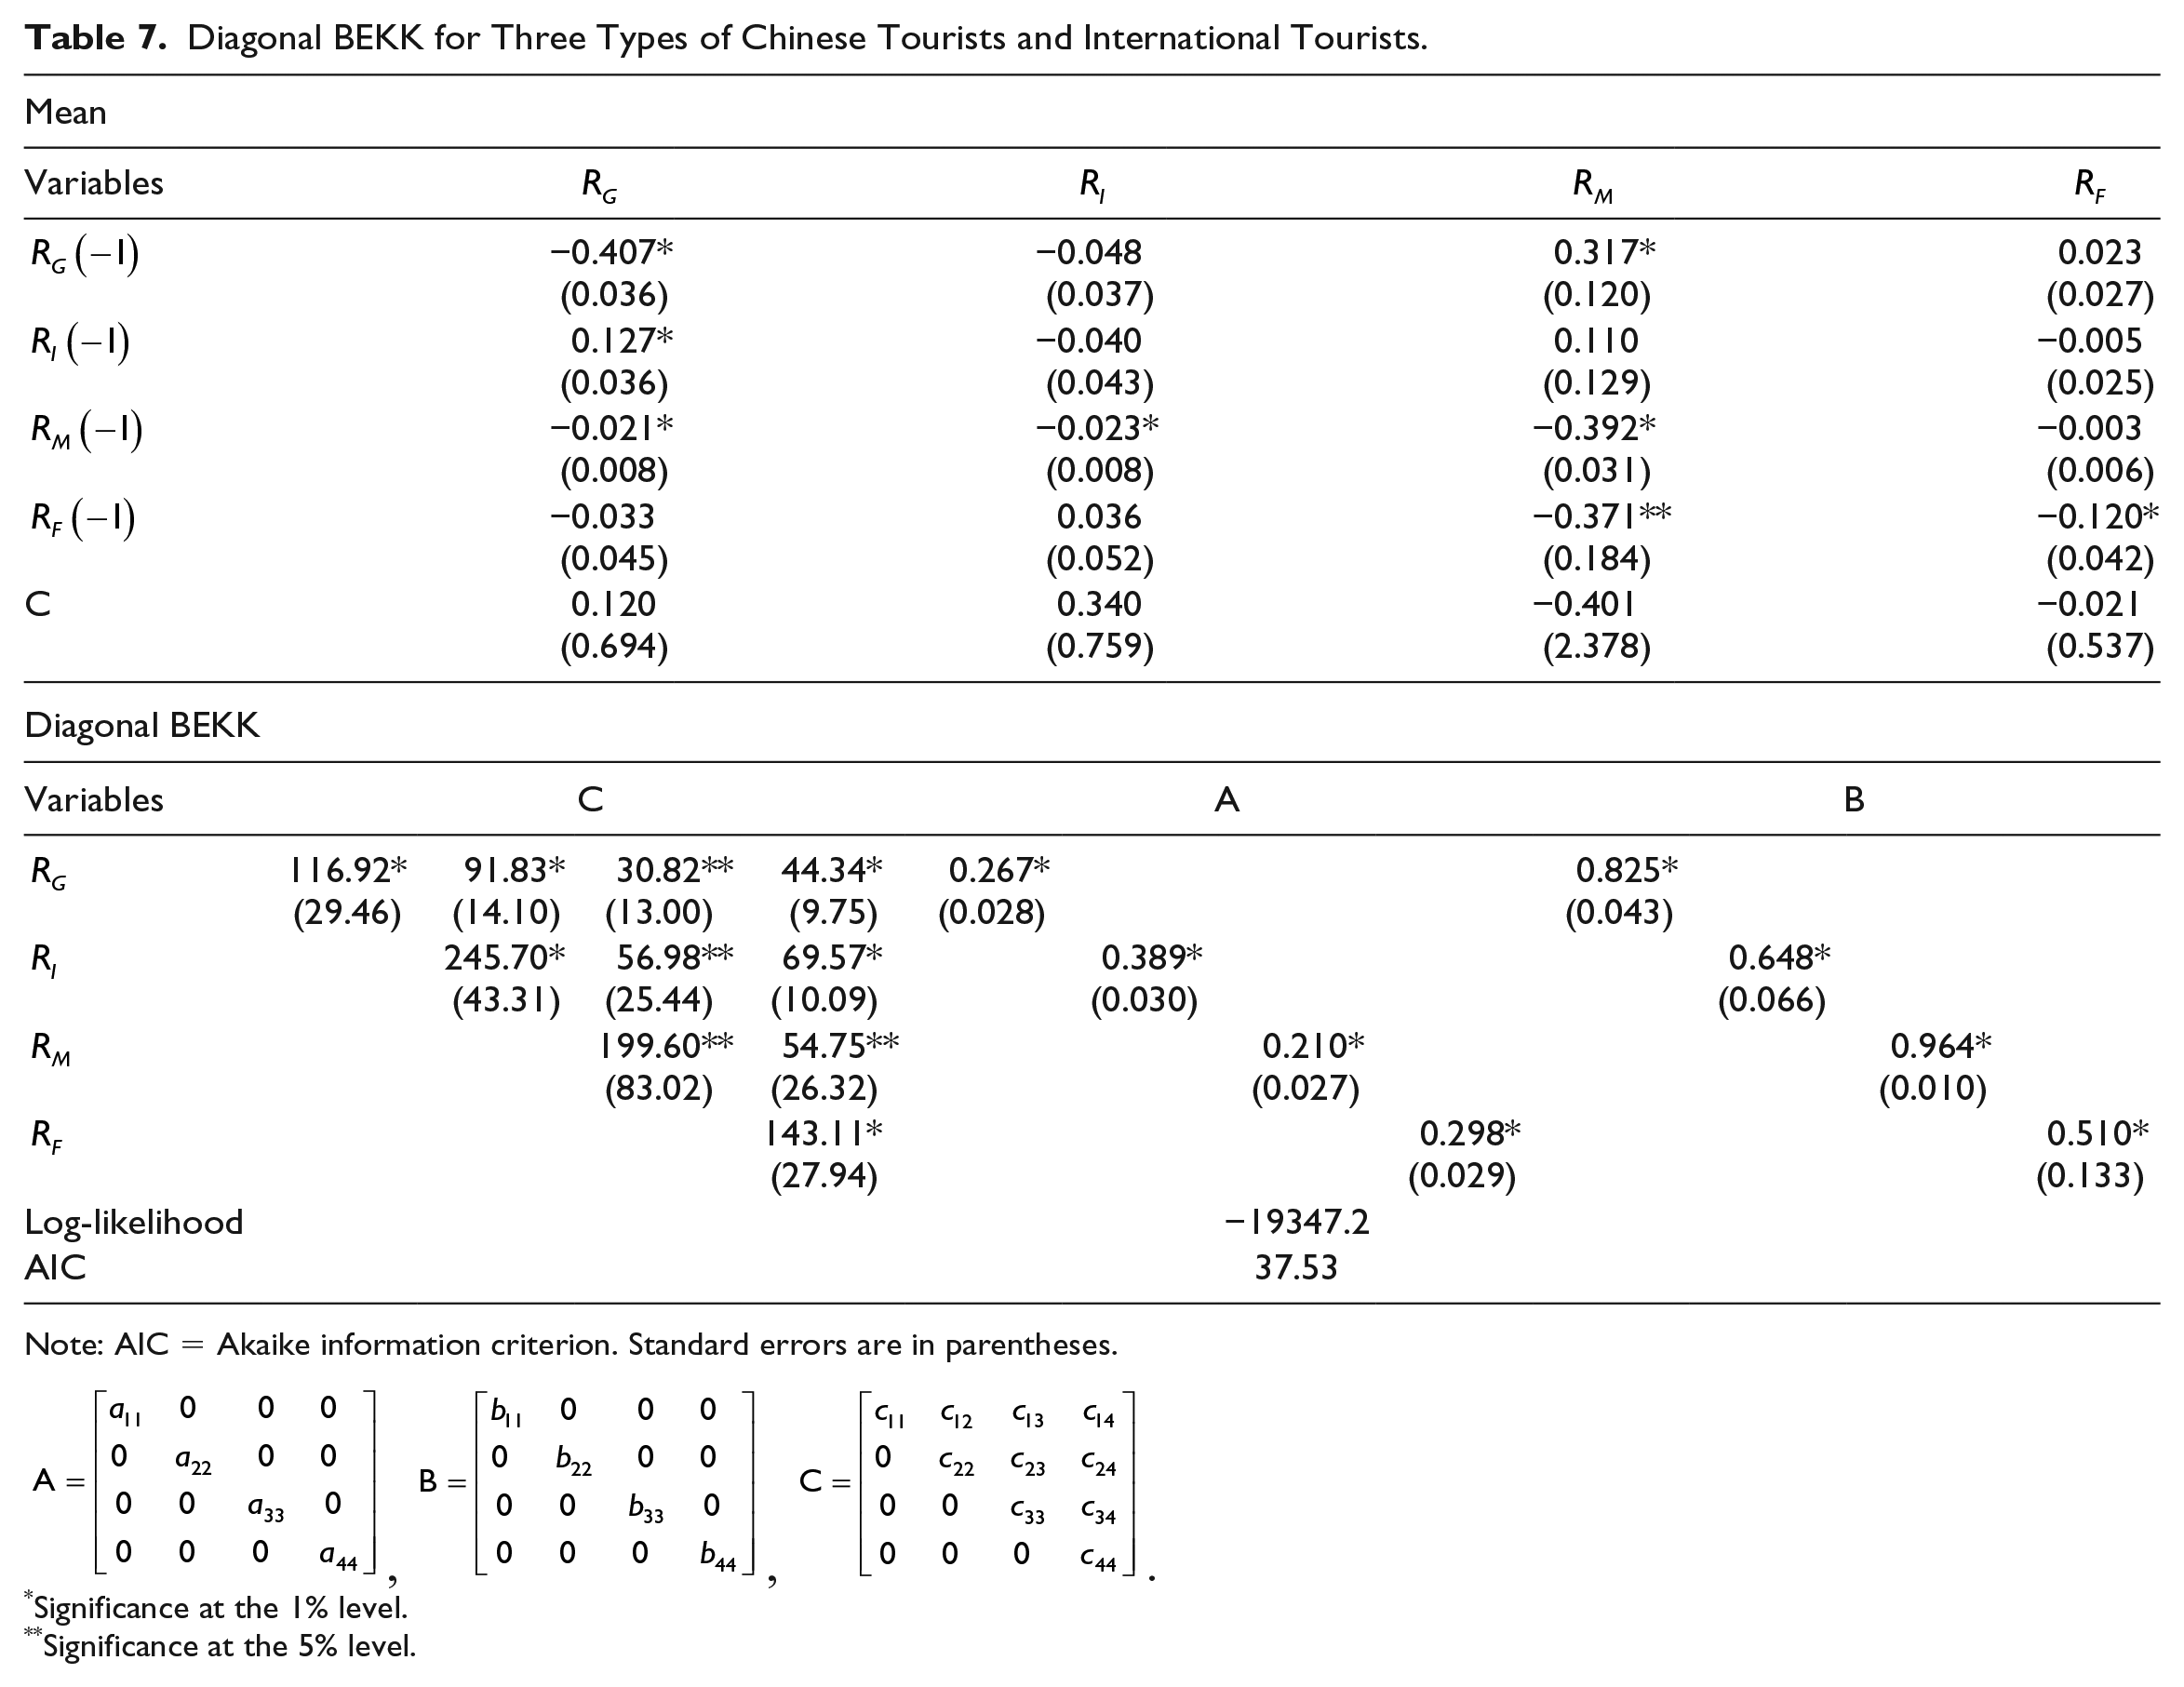
Note: AIC = Akaike information criterion. Standard errors are in parentheses.
Significance at the 1% level.
Significance at the 5% level.
There is a significant negative Granger causality relationship in terms of the impact of the rate of change in the numbers of Medical-type tourists in the previous period (
The lower part of Table 7 presents the results for the risk volatility spillover effects between the rates of change in the numbers of each of the three types of Chinese tourists (
The results for the average co-volatility spillover effects are presented in Tables 8 and 9. Table 8 reports the mean values for the impact on tourism receipts from travelers visiting Taiwan, while Table 9 reports the co-volatility spillover effects. For example, the average co-volatility spillover effect of
Average Return Shocks for Three Types of Chinese Tourists and International Tourists.

Average Co-volatility Spillovers for Three Types of Chinese Tourists and International Tourists.
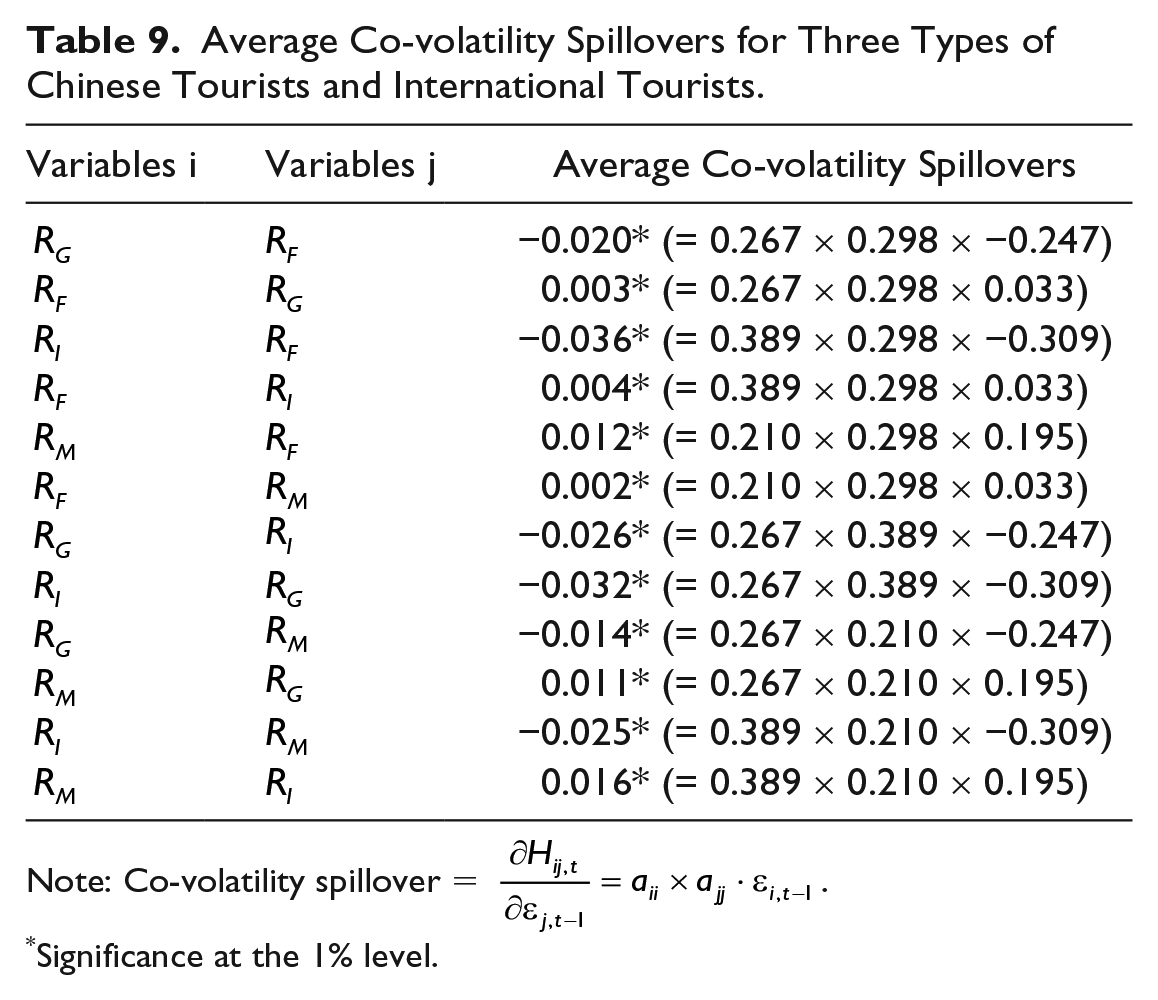
Note: Co-volatility spillover =
Significance at the 1% level.
The last column of Table 9 shows the risk volatility spillover effects between the rates of change in the numbers of each of the three types of Chinese tourists. The co-volatility spillover effect of
Conclusion
Since 2008 when Taiwan relaxed its Cross-Strait tourism policy, China has quickly become the largest source of international tourists visiting Taiwan. Consequently, China has also become the major country affecting the development of Taiwan’s tourism economy. With the huge increase in the numbers of Chinese tourists visiting Taiwan, the ability of Taiwan’s tourism industry and the local environment to handle and support so many visitors has gradually been surpassed. It has also led to controversies and rumors that the quality of tourism in Taiwan is deteriorating, and driving other international travelers away from Taiwan.
The current DPP government, which took office in 2016, has not been able to satisfy China in terms of its Cross-Strait policy, and Cross-Strait relations are currently at a stalemate. Rumors have circulated that the Chinese government had restricted the numbers of Chinese tourists who could visit Taiwan. The numbers of Chinese tourists visiting Taiwan has also been exhibiting a clear downward trend since 2016 but, as compared with 2015, international tourist arrivals to Taiwan actually grew by 2.4% in 2016.
Virtually none of the previous literature in tourism has been concerned with whether the multivariate conditional variability models used actually conform to the statistical properties of consistency and asymptotic normality. In other words, previous studies have drawn conclusions regarding the estimated spillover effects based on invalid statistical inferences. Moreover, the relationship between China and Taiwan is unique, and the risk spillovers between Chinese tourists and International tourists to Taiwan are also different. When China has become the major country that affects the development of Taiwan’s tourism, and Chinese tourists have also become the number one tourism source to Taiwan, under this special situation, it is necessary to provide accurate estimates of the distinctive spillover effects of Chinese tourists and International tourists for policy making in Taiwan.
The purpose of this article has been to understand and explain the risk volatility spillover effects between the tourism demand of Chinese tourists and international travelers visiting Taiwan in order to facilitate the risk management of Taiwan’s tourism market. Using daily data for Chinese tourists and international travelers visiting Taiwan over the period January 1, 2014, to October 31, 2016, the article adopts McAleer’s (2015) fundamental equation in tourism finance to link the correlation that exists between the rate of change in the numbers of tourists and the rate of return on tourism. Then the Diagonal BEKK multivariate conditional volatility model was used to analyze the co-volatility spillover effects between the rate of change in international travelers and the rate of change in Chinese tourists visiting Taiwan.
First, we analyzed the dependency relationship between Chinese tourists and international travelers visiting Taiwan. The empirical results showed that there is no Granger causality relationship between the rate of change in the numbers of Chinese tourists and the rate of change in the number of international travelers visiting Taiwan. This means the change rate in the number of Chinese tourists in the previous period (
With regard to co-volatility spillover effect, there is a significant negative co-volatility spillover effect between the rate of change in the numbers of Chinese tourists and the rate of change in the numbers of international travelers. This means the effect of a shock in the change rate of the number of Chinese tourists
This article analyzed the dependency relationship between Chinese tourists and international travelers visiting Taiwan, and estimated risk spillover effects by using the DBEKK model that has mathematical regularity conditions and valid asymptotic properties. In order to understand the effects of the interactions between the different types of Chinese tourists and international travelers, we disaggregated the total Chinese tourists into Group-type, Individual-type, and Medical-type Chinese tourists. The article analyzed the dependency relationships between each of the three types of Chinese tourists and international travelers, as well as on the risk spillover effects among these various groups.
With the ongoing stalemate in Cross-Strait relations, and the gradual reduction in the number of Chinese tourists, it is imperative be proactive in expanding other markets for international tourists and to attract international travelers to Taiwan. This will help reduce the impact of the reduction in the numbers of Chinese tourists and promote the continued development of Taiwan’s tourism industry.
In considering the interactions between the three different types of Chinese tourists described above, and international travelers, the empirical results show that a Granger causality relationship exists between international tourists and Medical-type Chinese tourists, but there is little evidence of a Granger causality relationship between international tourists and Group-type or Individual-type Chinese tourists. This suggests that only Medical-type tourist arrivals are affected by the previous period’s shocks from international tourist arrivals.
This article also found that the co-volatility spillover effects in terms of the numbers of Group-type Chinese tourists and international travelers caused by the abnormal impact of the changes in the numbers of international travelers are greater than the co-volatility spillover effects in terms of the numbers of Group-type Chinese tourists and international travelers caused by the abnormal impact of the changes in the number of Group-type travelers. Similarly, the co-volatility spillover effects in terms of the numbers of individual-type Chinese tourists and international travelers caused by the abnormal impact of the changes in the number of international travelers are greater than the co-volatility spillover effects in terms of the numbers of Individual-type Chinese tourists and international travelers caused by the abnormal impact of the changes in the number of individual-type travelers.
Put simply, international tourism demand had spillover effects onto Chinese tourism demand (namely, Group-type and Individual-type tourists) that were greater than the Chinese tourism demand spillover effects onto international tourism demand.
From these empirical results, it can be inferred that when the numbers of both Group-type and Individual-type tourists decrease, the government can promote tourism policies that increase the numbers of international travelers visiting Taiwan, so as to lessen the impact of the decline in the numbers of Group-type and Individual-type tourists on Taiwan’s tourism market.
In addition, both Group-type and Individual-type travelers have a significant negative co-volatility spillover effect on the rate of change in the numbers of Group-type and Individual-type tourist arrivals. This means that there is a substitution effect between Group-type and Individual-type travelers. It was also found that the abnormal impact of changes in the number of Medical-type travelers on the co-volatility spillover effects of Group-type and Medical-type travelers was greater than the abnormal impact of changes in the numbers of Group-type travelers on the co-volatility spillover effects of Group-type and Medical-type travelers.
At the same time, the abnormal impact of changes in the numbers of Medical-type travelers on the co-volatility spillover effects of Individual-type and Medical-type travelers was greater than the abnormal impact of changes in the numbers of Individual-type travelers on the co-volatility spillover effects of Individual-type and Medical-type travelers.
From this, it can be inferred that as the numbers of Chinese tourists decline, especially in cases where the numbers of Group-type and Medical-type travelers decrease significantly, by actively taking steps to increase the numbers of Individual-type Chinese tourists visiting Taiwan, it would be possible for the government to reduce the adverse impact brought about by the reduction in the overall number of Chinese tourists. Moreover, the Taiwan Government should also actively promote a unique style of tourism, such as Medical-type tourists, who travel to Taiwan primarily for medical checkups or cosmetic treatment, to maintain continuous development and stabilize the number of medical-type visitors.
The empirical results from the article would suggest that Taiwan should abandon its development strategy of only focusing on a single market, namely China, and have an objective to be proactive in encouraging visits by international travelers to Taiwan for sightseeing purposes. Such a strategy would increase the willingness of international travelers to visit Taiwan.
In addition, with the reduction in the numbers of Chinese tour groups visiting Taiwan, and the increase in the number of individual travelers, the Taiwan Government should change its previous travel policies of focusing on attracting Chinese tour group travelers and actively promoting in-depth tourism among international tourists, by developing tourism that focuses on the special characteristics of different localities. In this way, such a tourism policy could enhance the quality of Taiwan’s tourism, and also attract travelers with high spending power.
There are two limitations of the article: (1) Tourist expenditure (income) is one of the most important explanatory variables for tourism demand. However, as this variable is not available on a daily basis, the article adopted the Fundamental Equation in Tourism Finance to use tourist arrivals data to replace tourist expenditure (income), and (2) given the restrictions in obtaining (daily) data from the National Immigration Agency in Taiwan, the data used in the article focused on daily Chinese and international tourist arrivals data from January 1, 2014, to October 31, 2016.
As an extension of this article, it would be useful to expand the sample period. Future research would use additional data to obtain more accurate forecasts of international tourism arrivals to Taiwan. The use of daily data for tourist arrivals from leading tourism source countries to Taiwan, such as Hong Kong and Macao, Japan, South Korea, Singapore, Malaysia, and United States, would enable a greater understanding of their impacts on cross-county spillovers. Moreover, another useful contribution to the literature would be to test risk spillovers of tourists from Taiwan to China, as well as volatility spillovers and latent Granger causality of higher moments.
Footnotes
Acknowledgements
The authors are most grateful to the editor and two reviewers for very helpful comments and suggestions. For financial support, the first author wishes to thank the Ministry of Science and Technology (MOST), Taiwan, and the third author acknowledges the Australian Research Council and the Ministry of Science and Technology (MOST), Taiwan.
Authors’ Note
Shu-Han Hsu is now affiliated with Chung Hua Institution for Economic Research, Taiwan.
Declaration of Conflicting Interests
The author(s) declared no potential conflicts of interest with respect to the research, authorship, and/or publication of this article.
Funding
The author(s) received no financial support for the research, authorship, and/or publication of this article.