



Abstract
Online ratings are a major driver of hotel choice. There are many ratings platforms, and the number of evaluations is huge. This article analyzes if hotel ratings vary across platforms, vary over time, and if consistency in ratings can be observed. Longitudinal online ratings taken from 11 platforms over a two-year period were analyzed through Self-Organizing Maps. The findings suggest a similar pattern of online ratings across most of the platforms, except for Yelp and HolidayCheck. In addition, the evaluation patterns are stable over time, and the analyzed attributes do not contribute decisively to explain the overall evaluation of hotels, which implies that tourists use a noncompensatory evaluation model. More interestingly, there is no difference between the evaluation patterns of the platforms that require proof of prior reservation and those that do not. The results were confirmed by means of two qualitative studies undertaken with hotel managers.
Introduction
Online reviews are important sources of information for tourist decision making (Toral, Martínez-Torres, and Gonzalez-Rodriguez 2018) and are recognized as the second most frequently used source after search engines (Yang, Park, and Hu 2018). As reported by the UNWTO (2014), guest reviews are “important” or “very important” for more than 70% of international travelers and, more interestingly, consumers tend to visit, on average, almost 14 different travel-related sites when researching a trip. Indeed, the number of platforms is increasing, and the number of online reviews is massive (Alaei, Becken, and Stantic 2019). Tourists assess tourism services by means of unstructured data, namely, text, pictorial or audiovisual, and structured, such as online ratings. However, little is known about the similarities or differences between online ratings across multiple platforms. A practical issue is that some platforms only accept reviews from customers who actually booked, and stayed at, a hotel through their website (e.g., Booking.com), but for others this is not required (e.g., Trivago). In this regard, several questions need to be addressed: (1) Are online reviews similar across platforms? (2) Are overall ratings consistent with ratings given to the different services? (3) Do online ratings vary over time? and (4) Are they affected by whether the poster can verify that (s)he stayed at the hotel? This research will consider the conceptual and practical implications of the answers to these questions.
Despite the growing research into online reviews, there is an emerging need for research into the variability-similarity of online ratings across platforms and over time. As Babić et al. (2016) posit, there is insufficient evidence of the effectiveness of electronic word of mouth (eWOM) across platforms. The analysis of the similarity-dissimilarity and the consistency-inconsistency of online content posted on platforms is important for both tourists and tourism managers. Given the growing number of platforms, tourists and managers may feel compelled to check the reviews on several platforms to get an accurate overall picture of a hotel, which is time consuming. Alternatively, if one platform could provide representative content, then tourists and managers might refer just to that one, at their convenience. Whatever the case, managers and tourists may prefer a summary of data for managing the information on multiple online platforms.
Visual representation of data is an area of growing attention in different fields, from medicine to architecture and in business activities in general (see Keim et al. 2008). Self-Organizing Maps (SOMs), introduced by Kohonen in the 1980s, are part of a bundle of artificial neural network techniques that convey feasible visual representations. This artificial neural model is able to convert complex, nonlinear statistical relationships between high-dimensional data items into geometric relationships in a low-dimensional space (Kohonen 2001). As Li, Law, and Wang (2010) posit, “SOM as an unsupervised process provides a more efficient way to group high-dimensional data items into a set of clusters when comparing with existing tools” (p. 117).
This research aims to overcome the aforementioned research gaps by achieving three research goals. First, to identify whether common patterns of online ratings emerge in the same type of platform, both across platforms (online-rating similarity) and over time; second, to analyze consistency between scores given to individual services and overall scores in online reviews (online-rating consistency) and over time; third, to analyze whether online ratings differ between those platforms that allow reviews to be posted only by those customers who booked a hotel through their website and those platforms that accept reviews based on the poster’s declaration that they stayed at the hotel. Furthermore, the present study proposes that SOMs simplify data analysis and the analysis of nonlinear relationships. To our knowledge, this is the first attempt to analyze hotel-rating similarities across platforms using SOMs.
SOMs have been adopted in tourism mainly for clustering purposes (Bloom 2004, 2005; Mazanec 1992, 1999, 2001). Only Claster et al. (2013) have used SOMs to analyze online ratings in tourism. However, the present study differs from their study in three ways: (1) they used data from only one platform, namely Twitter, while the current analysis is based on data from 11 platforms; (2) they used sentiment analysis as a unit of study; and (3) they did not analyze consistency in online ratings over time, whereas the present study analyses results over 27 consecutive months. Given the scarcity of SOM research into online reviews, there is a need for a further assessment of the suitability of SOMs for analyzing online reviews sourced from multiple platforms over time. As discussed in the methodology section, a complementary analysis based on a qualitative study is developed to establish whether the findings are similar in both analyses.
Conceptual Framework
Online reviews are a major driver of brand choice and sales in tourism (Park and Nicolau 2015) and also influence hotel performance, as shown by a recent meta-analysis (Yang, Park, and Hu 2018). Academic studies are increasing their focus on online reviews and hotel bookings (Sparks and Browning 2011; Guo, Barnes, and Jia 2017) and, more recently, on tourist destinations (Toral, Martínez-Torres, and Gonzalez-Rodriguez 2018). The influence of online reviews on sales has been shown in meta-analyses (Floyd et al. 2014; You, Vadakkepatt, and Joshi 2015).
Previous literature on eWOM has compared a variety of technologies (e.g., chat, text messaging, social networks) (Gvili and Levy 2016). However, cross-channel comparisons within a single type of platform have been almost completely neglected (Xiang et al. 2017). Xiang et al. (2017) compared three online review platforms, TripAdvisor, Expedia, and Yelp, in terms of information quality regarding one tourism destination (i.e., Manhattan, NYC). The present study, from a different research angle, expands the number of platforms and the number of tourism units, namely, hotels and destinations, analyzed. Given the overload of information in online commentaries, and to reduce decision-making costs, tourists rely more on review ratings than textual reviews (Yang, Park, and Hu 2018). Scholarly research also calls for the simplification of the current models and improvements in the speed of algorithms in data-rich environments (Wedel and Kannan 2016), such as online rating platforms.
Given the high number of platforms and online ratings generated over time, hotel managers need to look more closely at the following four interrelated issues: (1) similarity of online ratings across platforms; (2) consistency of overall ratings and online ratings given to the different services provided by each hotel; (3) integrity of tourists in evaluating hotels; (4) the evolution of online ratings over time.
Similarity in Online Ratings across Different Platforms
Much academic attention has been devoted to eWOM, with studies having different goals and levels of analysis (for a review, see Confente 2015). Online reviews as a specific eWOM domain are growing dramatically, especially for accommodation services (Filieri and McLeay 2014). The online rating represents the score given in the online review. Online ratings might come from reviews posted on the three main source types: hotel websites, travel agency websites (e.g., Booking.com), and social media sites (e.g., Facebook). In this new scenario, characterized by multiple information channels, hotel managers and academic researchers need to parse the huge amount of data published on the different types of platforms. Therefore, the research looks for integrative approaches to provide effective and quick analyses. An effective means of achieving a clear understanding of the information provided by the multiple platforms is to analyze the similarity between customers reviews derived from different platforms. This approach is valuable because of its managerial utility for hotels and its more general impact on consumer research. In this sense, if online ratings follow a different pattern by platform, this might be attributed to three issues: (1) differences in the consumer’s criteria in each platform, (2) differences in the service experienced, or (3) different users’ profile by platform.
A simple means of verifying patterns in online reviews is to segment users by demographic variables, including nationality (see Alarcón-del-Alamo, Gómez-Borja, and Lorenzo-Romero 2015). The approach here is different. This study argues that analyzing the similarity of online ratings across different sources will help managers and researchers to obtain timely and meaningful results. Furthermore, if similarities in online ratings emerge across platforms, it can be concluded that there is a nonsegmented distribution of online ratings across platforms, from which two main benefits would be derived. First, this would simplify the data analysis by eliminating the need to integrate data from similar platforms, which would be less time consuming and entail lower research costs. Second, it would facilitate efficient and prompt responses from managers (Wedel and Kannan 2016). Thus, it might be argued that if similarities exist, the service is equally rated and perceived whatever platform is used. Therefore, the first research question is devoted to analyzing the similarity of online ratings across platforms.
Research question 1: Do online ratings follow a similar pattern across different platforms?
Consistency in Online Ratings
The second area of interest in parsing online ratings regards the scores given to specific hotel services, as opposed to the hotel’s overall evaluation. However, little is known about the internal consistency between these overall values and the scores given to specific hotel services.
According to the choice decision framework drawn from consumer behavior literature (Johnson and Meyer 1984), two main approaches can be identified. First, under a compensatory choice model, an overall score should reflect a summary effect of the scores given to specific services. However, consumers may follow a noncompensatory process, which would lead to higher importance being given to some attributes. Thus, a noncompensatory model is associated with inconsistency in scoring the overall rating. Accordingly, if consistency emerges, overall scores would be a valid measure for managers, tourists, and even for researchers, to help build a clear and simple picture from the huge amount of data available.
It is not suggested that it is irrelevant to analyze potential inconsistencies. Rather, it is suggested that if consistencies emerge, tourists are not granting more importance to some specific services at the expense of others. A basic example may clarify this. Let us take the example where hotel H gets an overall evaluation of 9 out of 10, and its service A gets 9, service B gets 8, and service C only 4, using the same scale range. Two main explanations can be given for the overall score of 9: (1) the tourists are not consistent or (2) they do not assign much relevance to service C in their overall hotel experience. Alternatively, tourists may mentally calculate an average score and, consequently, give each service a similar weight, as in a compensatory scheme. Whatever is the case, whether the tourist awards more, less, or the same weight to any particular attribute, if the scores for each service and the overall score are consistent, this suggests that overall scores are an appropriate measure for parsing large numbers of online reviews. If this is not the case, two alternative explanations can be given. It can be argued that tourists are not consistent in their evaluations or, alternatively, they are weighting each item differently, reflecting the fact that they attribute more importance to some services than to others.
A deeper understanding of how consumers utilize user-generated content is provided by grounded theory (Papathanassis and Knolle 2011). In this regard, Guo, Barnes, and Jia (2017) analyzed 266,544 hotel online reviews and through natural language processing found that 5 of 19 main dimensions are key determinants of overall customer ratings. Despite the value of this approach, the perspective of the present study differs from prior studies. The aim is to expand the discussion of the key determinants of online reviews by examining two effects: (1) a consistency effect, previously not addressed in the literature, related to the scores given to the services evaluated and the overall score and (2) a stability effect over time. The latter has been discussed in the social media field by Claster et al. (2013), who showed that stability in tweet content is a contextual issue that depends on the tourist destination. However, the present study looks at both consistency and stability. The next two research questions focus on these effects.
Research question 2: Is there a pattern of consistency between the scores given to each attribute and the overall score (a) within each platform and (b) across platforms?
Consistency can be also analyzed over time. Consistency over time is defined as the stability of the given scores, both overall and for specific services. If similar scores are achieved over time, this may be because service performance levels have been maintained, or because the tourist perceives this to be the case, although they have, in fact, changed. On the contrary, instability might be attributed to changes in performance levels or to the user’s perception. Therefore, the following research questions aim to evaluate consistency over time:
Research question 3: Is there a pattern of stability over time for scores given to each service and the overall score, both (a) within each platform and (b) across platforms?
A straightforward consequence might be derived from these research questions. If internal consistency exists, overall measures are good estimators for analyzing data. If the pattern persists over time, overall scores might be used as a proxy variable in a prospective analysis, both at industry and hotel levels. Even if a hotel has changed its service levels, and the overall scores stay stable, this may reflect that tourists do not perceive the change, or they do not see it as important.
Influence of Integrity on Online Ratings
Online reviews are gaining momentum with the advent of new platforms. They have different formats in terms of their user
Research question 4: Is there any difference between online ratings posted on platforms where a reservation is a prerequisite and those based on the user’s integrity?
A remaining issue to be discussed is whether the SOM is the appropriate approach to address the research questions posed above. SOMs meet the following five practical criteria, all potentially attractive for analyzing online reviews. First, SOMs are appropriate for large data sets, including user-generated content (Lu and Stepchenkova 2015); second, SOMs can reduce a higher-dimensional input space to a lower-dimensional map space, facilitating visual interpretation. If that is indeed the case, SOMs are aligned to the growing trend of visual interpretation adoption, which is a recent path in tourism research (Cheng and Edwards 2015); third, the SOM technique is based on competitive learning (i.e., each data vector recalculates the solution) that helps the dynamics of the result; fourth, SOMs allow outputs to be compared through an objective indicator, named neighborhood function; finally, they are suitable for nonlinear data sets. Despite the growing interest shown in data visualization and SOMs in publications in the artificial intelligence and expert systems’ fields, such research is scarce in tourism.
Research Design
Self-Organizing Maps
SOMs are among the most popular visualization tools currently available. The SOM is an artificial neural network proposed by Teuvo Kohonen in the 1980s (Kohonen 2001).
The key point is to maintain neighborly relations between patterns in an original space (which considers all the variables) and a transformed space (which has two to three dimensions, the most used being a two-dimensional space). Thus, patterns that are close in the original space remain close in the transformed space. In this way, different data evaluation patterns can be directly visualized, and the spatial distribution of values in the transformed space can be analyzed. It should be noted that this tool allows a simultaneous visualization of all the variables and all patterns.
In contrast to SOMs, classic techniques can only deal with accurate visualizations of whole data sets when the number of features required is three or lower; to represent a higher number of features, 3D projections need to be carried out, establishing restrictions (such as maintaining a fixed set of variables and representing the rest). Such a restriction allows only a partial representation of the information. Moreover, most real data sets are formed by more than three features, making graphical representations difficult, or impossible. For that type of representation, which makes it possible to find patterns in data sets with high dimensionality, SOMs are especially appropriate; in particular, SOMs produce a low-dimensional (typically 2D) representation of high-dimensional data by identifying data that are similar in the input space and grouping them on a grid (Kohonen 2001). The most appealing characteristic of SOMs is that the underlying mathematics ensures that the map is a faithful representation of the original data; that is, when two data points have similar features, they are represented as close to each other in the resulting map.
This neural model seeks to find and visualize patterns in N-dimensional data sets where the key working principle is to keep a neighborhood relation between the original space of the N-dimensional data (input space) and the regular low-dimensional grid (output space). In terms of its structure, an SOM consists of elements of a process, called neurons, organized on a regular low-dimension grid (normally in two dimensions). The number of neurons may vary from a few dozen up to several thousand. Each neuron is presented by an N-dimensional weight vector m = [m1, . . . mi, . . . mN], where N is equal to the dimension of the input vectors (the number of variables that describe the problem).
In SOM design, the first choices to be made are the type of map and how many neurons to use (as this will determine the size of the low-dimensional grid). The first step for this algorithm is weight initialization, which creates a great number of possibilities. When the initial values of the synaptic weights have been selected, the next step is to move them closer to the optimum values through an iterative procedure. After the SOM training process, it is very easy to project the map onto the different features; these projections are called component planes (Kohonen 2001), or component maps. The component planes can be plotted so that information regarding each single variable can be visualized, allowing the most complete representation of reality and showing the relationships between the different analyzed variables. The component plane of an SOM is a map where, for each neuron, only one component of its weight vector (corresponding to a given input variable) is shown; thus, in experiments a total of N component planes (where N is the data dimension or the number of variables) can be displayed. Therefore, input patterns mapped onto certain areas of a component plane maintain their graphical positions in all other component planes. Since all the component planes belong to the same map, areas of the map can be simultaneously analyzed for different features.
In the component plane, each neuron in the SOM grid is colored based on the value of the i-th component of its weight vector (here i = 1, …, N); higher values are usually depicted in red and lower in blue. Thus, component planes tend to show some parts of the map as having a similar color; this means that similar input vectors are clustered in those particular areas of the map, that is, similarly colored neurons within a plane represent a set of input vectors that are similar according to the variable under analysis. The same region within every plane (say, the upper left corner) identifies the same set of records, but different planes focus on a different variable.
Despite the use of SOMs in a huge number of scientific papers, surprisingly their application in economic research lags behind (see Oja, Kaski, and Kohonen 2002). In tourism, only a few papers published in the 1990s, notably by Mazanec (1995), and in 2000s by Curry et al. (2001), were based on this technique. However, most of these studies were cluster analyses (Curry et al. 2003). Indeed, the application of SOMs in tourism is still scarce (see Li, Law, and Wang 2010), and has not focused on eWOM analysis.
The only research that can be said to be similar was undertaken by Babić et al. (2016), who compared different eWOM studies in a meta-analysis, and Phillips et al. (2015), who used data from the same source, namely TrustYou. The present research differs from Babić et al. (2016) in three ways: (1) they compare different types of platforms, (2) they analyze different products and services, and (3) their study is a meta-analysis. The focus of the present study is on analyzing multiple hotels within the same type of platform, for a specific service (i.e., hotel bookings). For their part, Phillips et al. (2015) focused on only one platform, used a smaller data set, and applied partial least squares path modeling, not SOMs. Furthermore, our work introduces a minor innovation in the use of SOMs, which correlates the synaptic coefficients of the heat maps obtained at particular moments in time. This correlation indicates the evolution of the maps over time. The use of other approaches, such as temporal SOMs, is not possible because of the insufficient length of the sequences.
Data Set Description
TrustYou (www.trustyou.com), which operates a reputable online monitoring system featuring more than 50,000 hotels worldwide, provided data for the Spanish hotels. A similar data source for the Swiss market was used by Phillips et al. (2017), but with a different purpose, and detailed company information can be seen in their paper. Phillips et al. (2015) also used TrustYou but focused on 235 Swiss hotels. The data set of the present study encompasses longitudinal data of online ratings posted on 11 platforms for 1,165 Spanish hotels. Data came from user-generated ratings from 11 online review platforms: Agoda, Booking, Expedia, HolidayCheck, Hostelworld, Hotels, Travelocity, TripAdvisor, Trivago (UK), Trivago Germany, and Yelp. These platforms provide a rich diversity of sources of tourist ratings: (1) they are all international and popular; (2) they differ in being tourism biased, that is, tourism specific (e.g., Expedia) and nonbiased (e.g., Yelp); (3) there are pure online review platforms (e.g., TripAdvisor) and pure online travel agencies (e.g., Booking); and (4) some require the reviewer to have stayed at the hotel (e.g., Agoda) and some just need declarations without actual proof (e.g., Trivago), as seen in Table 1.
Tourism Specialization and Requirements for Online Reviews by Platform.
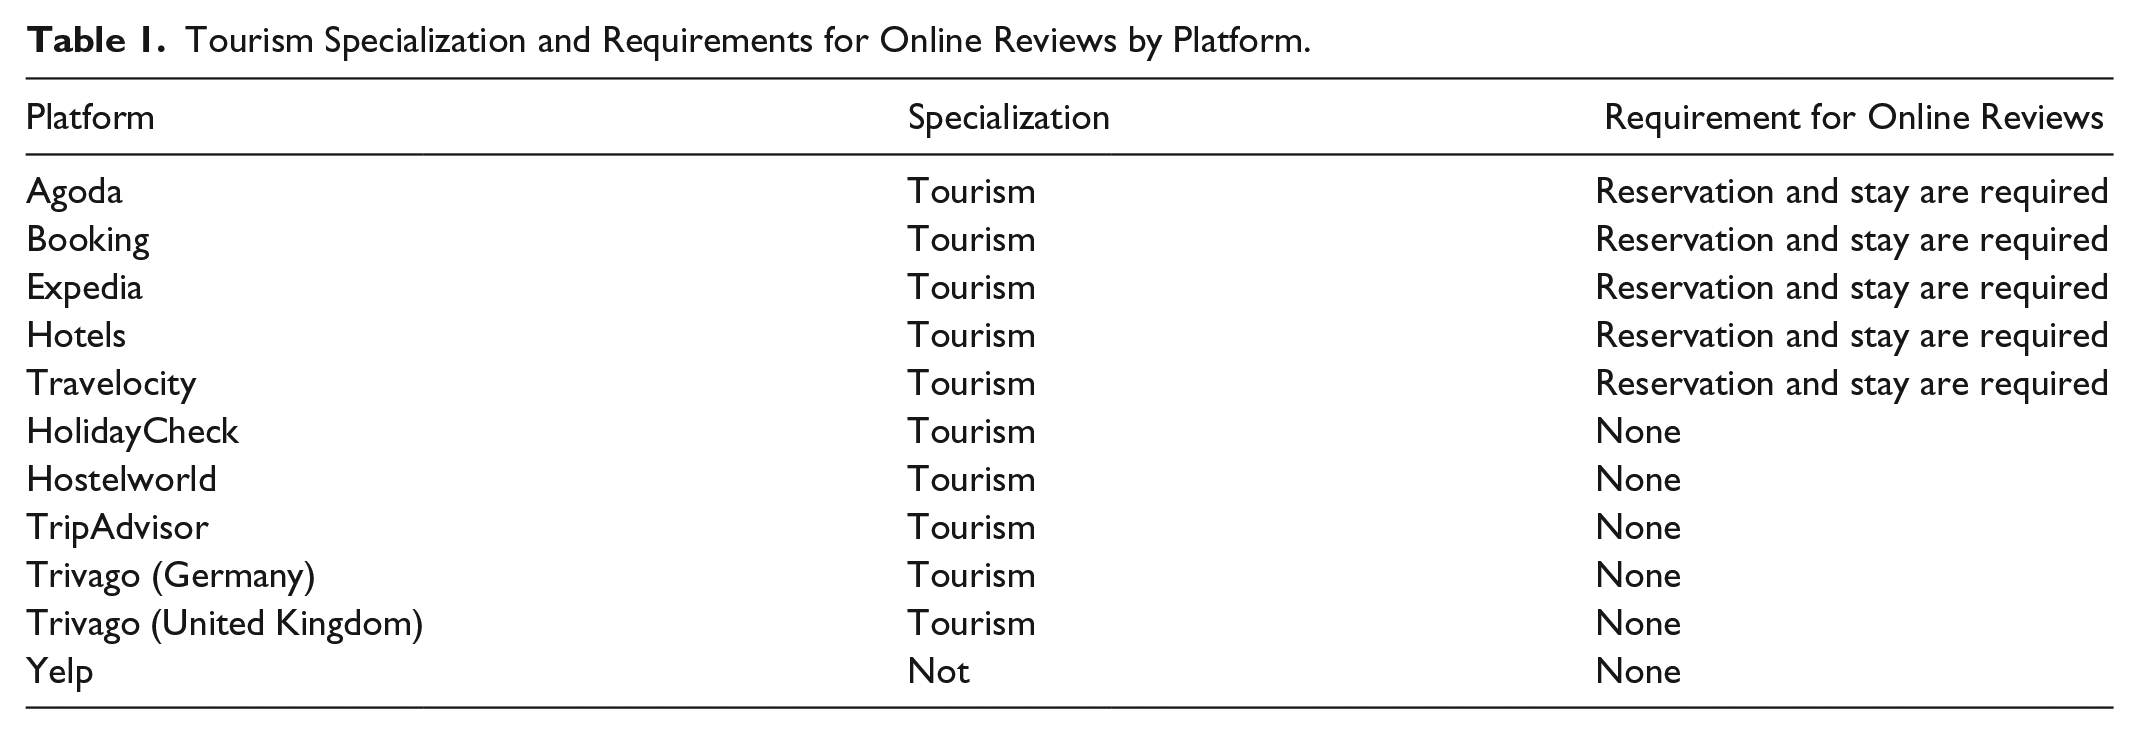
The present study uses monthly data from hotel reviews posted on the platforms from January 2012 to March 2014. For these purposes, a data set of 27 monthly reviews posted on 11 platforms rating 1,165 Spanish hotels was used.
Table 2 provides the details of the six variables in the analysis, as provided by TrustYou. The data consisted of online comments on 1,165 hotels by 6 variables and 11 platforms for 27 consecutive months. The average monthly data were grouped by quarter years that reflect a common season. The software used was Matlab SOM Toolbox, accessible at http://www.cis.hut.fi/somtoolbox/
Variables Used in the Analysis.
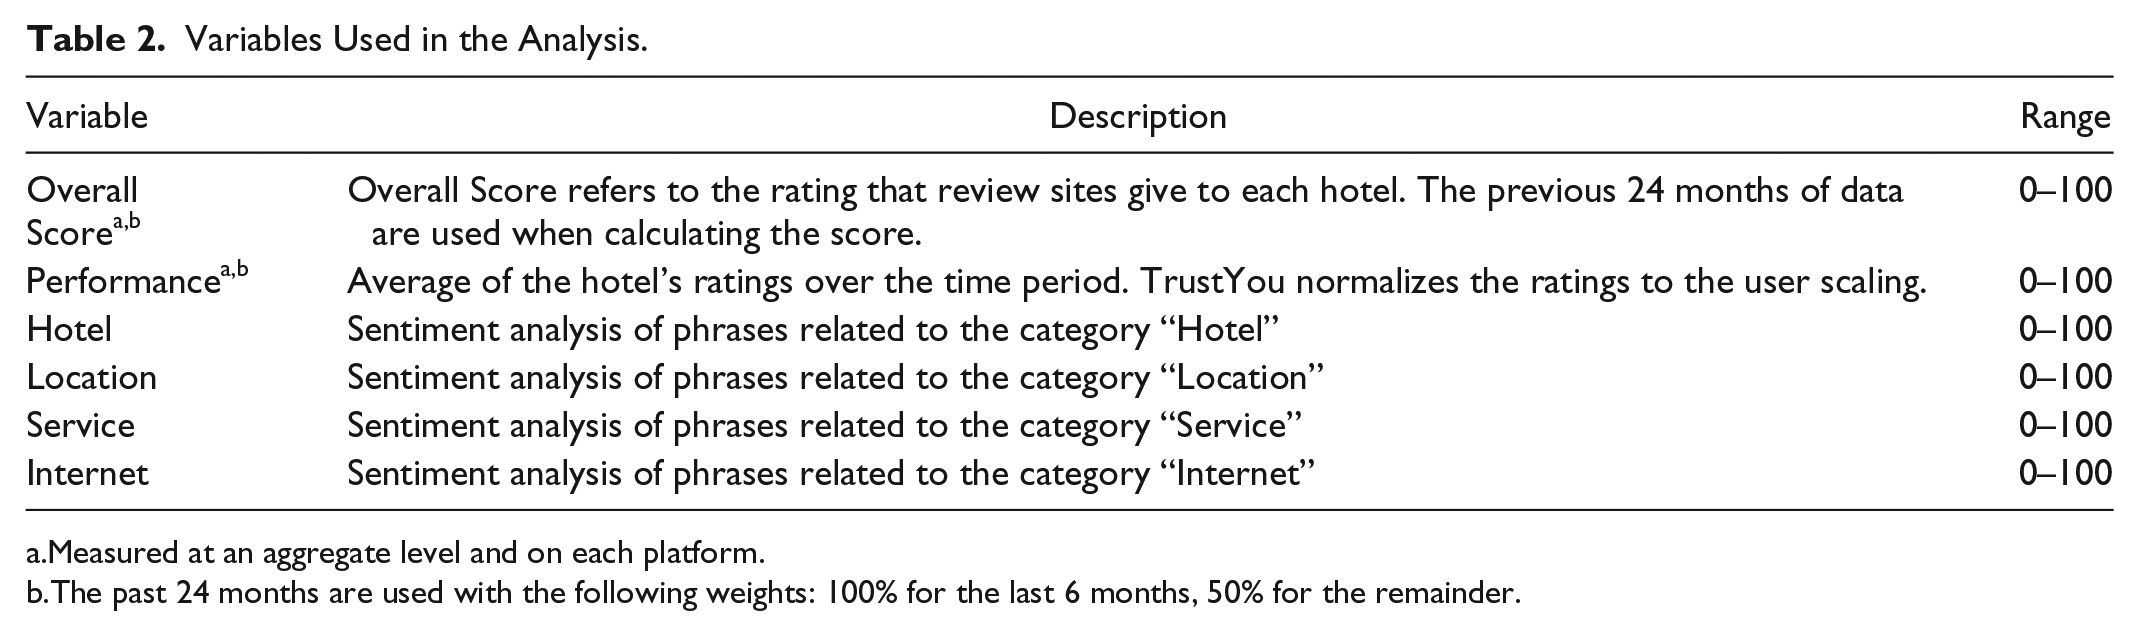
Measured at an aggregate level and on each platform.
The past 24 months are used with the following weights: 100% for the last 6 months, 50% for the remainder.
Methodology
A two-step study was implemented. First, a quantitative study based on the data set was conducted using SOMs. Second, a qualitative confirmation analysis using a focus group and an in-depth interview was conducted. These studies aimed to give robustness to the initial findings based on the expertise of hotel professionals closely involved with online ratings. This approach is in line with a recent call for adopting mixed research methods (Molina-Azorín 2016).
To achieve meaningful results from the quantitative study, the data for the 27 months were grouped into quarters, following a three-stage strategy. Stage 1 generated an SOM using data from the first quarter. This SOM was used as the baseline for the other quarters; the data from these other quarters were, therefore, represented in terms of their differences with respect to the first quarter.
The learning parameters, discussed below, are as follows:
Initialization. Two different types of parameter initialization of the model (synaptic weights) were conducted, random initialization and principal components analysis of the inputs.
Neighborhood function. The gaussian, bubble, and cut gauss functions were used as neighborhood functions to update the neuron coefficients close to the winner neuron.
Learning algorithm. Two types of algorithms were used for SOM training: (a) Sequential—synaptic weights are updated for each database pattern, and (b) Batch—here the weights are updated when all database patterns are analyzed. This algorithm is faster than the first because it requires fewer updates. However, it usually provides poorer results.
In stage 2, the coefficients (synaptic weights) of the first SOM are used as initial values for the second (the SOM that takes into account data from the second quarter); in this way, possible changes between quarters can be visualized in the same spatial area of the SOM. The SOMs highlight the differences in behavior among the quarters and, thus, each quarter is easier to visualize and interpret. The other learning parameters discussed above are maintained.
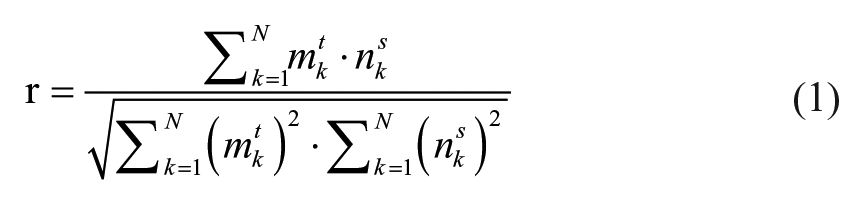
In stage 3, the similarity between the variables for different quarters can be obtained by visually comparing both maps. A numerical approach establishes correlations between the synaptic weights of the neurons that form the maps for each quarter. That is, the correlations between the vectors of the neurons are carried out for each pair of data sets. Finally, these relationships are averaged by dimension. That is, the SOMs represent images that can be used to visualize their similarities. For that purpose, the classic correlation was used, shown in equation (1):
where
Qualitatively, equation (1) captures the similarity between different SOM analyses over time. The correlation is used to determine the similarity between the maps at different instants in order to analyze the relationships between the variables and their temporal evolution.
The qualitative study was in two parts, a focus group of hotel marketing managers in charge of social media and an in-depth interview with the Managing Director, Spain, of TrustYou. Two researchers conducted the focus group, which consisted of six hotel managers of chains controlling 52 hotels with domestic and international tourism. First, each research topic was introduced as an open question to elicit the views of the participants based on their own experience. Second, the researchers presented the results of the SOM research and opened a discussion to confirm or discard the research findings. An in-depth interview with the Managing Director, Spain of TrustYou, was conducted one week after the focus group. The in-depth interview followed the same structure as the focus group, with first an open discussion and then a debate based on the research findings.
Results
Quantitative Analysis
A scan was performed between the parameters of the SOMs: (1) weight initialization, (2) neighborhood function, and (3) SOM training. The one that performed best was used in each of the cases presented. In general, the best SOM always had a gaussian neighborhood function with sequential learning.
The results show the visualization derived from the SOM analysis and the correlations between the variables under study. These analyses allow us to address the research questions. Because of their lack of online ratings during the study period, Travelocity, Hostelworld, and Trivago Germany were discarded. The focus, thus, was on just eight platforms: Agoda, Booking, Expedia, HolidayCheck, Hotels, TripAdvisor, Trivago (UK), and Yelp.
To analyze the similarity of online ratings across the different platforms (research question 1), Figure 1 represents the component map, obtained from the overall score of the platforms for the first quarter. Figure 2 represents the correlations between the quarterly overall score for each platform, obtained from equation (1). It is observed that the correlations of the different quarters are all very high, with correlations between 0.9 and 1. This high correlation allows us to analyze the SOM derived only from the first period (first quarter), since the other quarters are very similar, as indicated by the high correlation values.
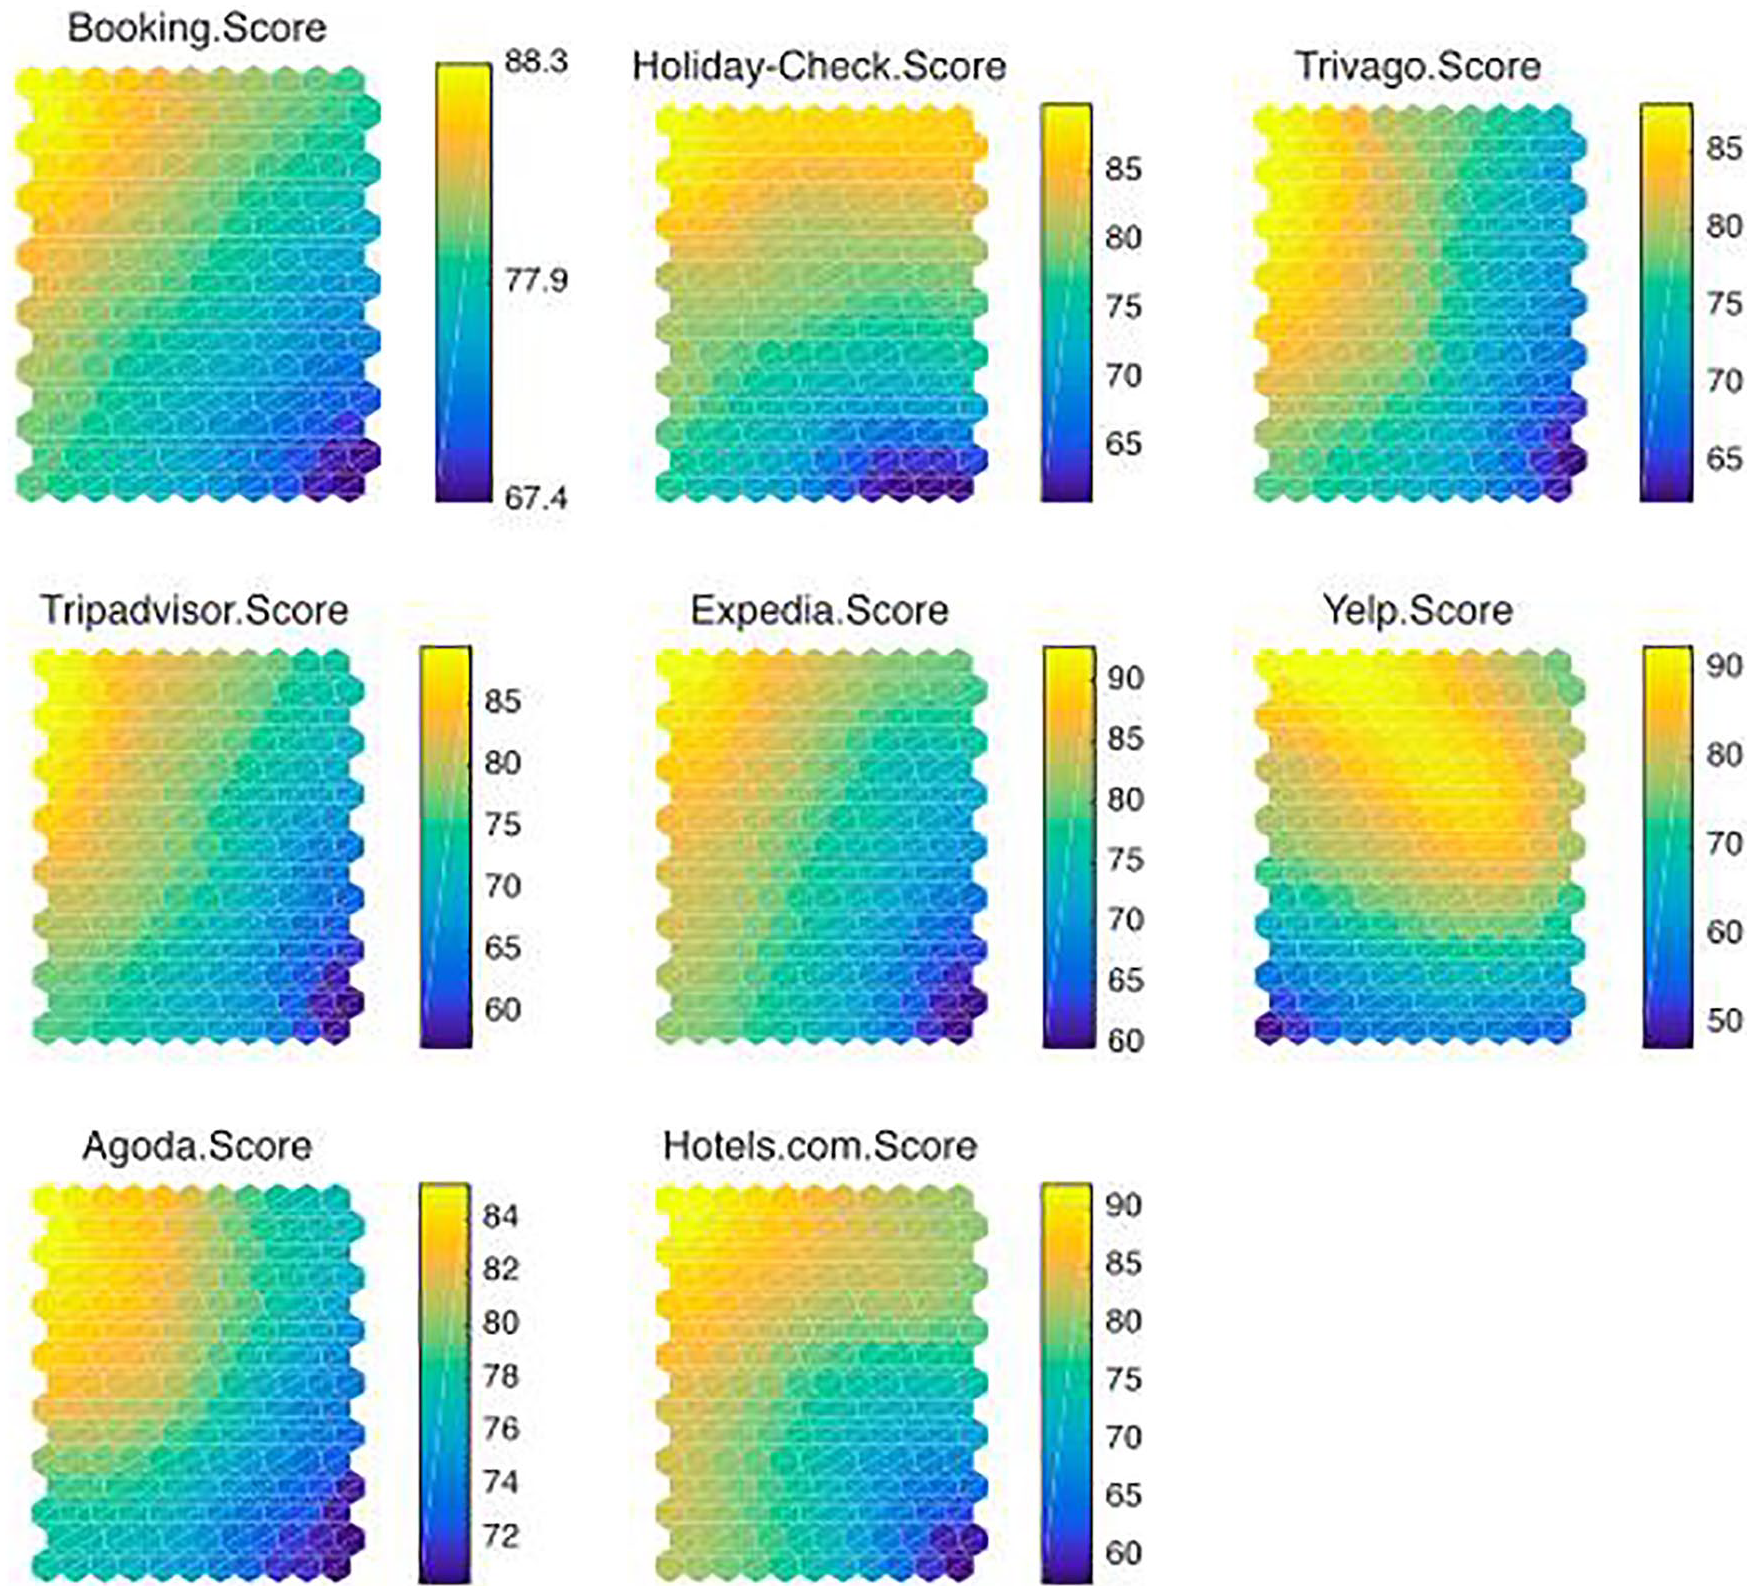
Component planes of the overall scores across platforms for the first 3-month period.
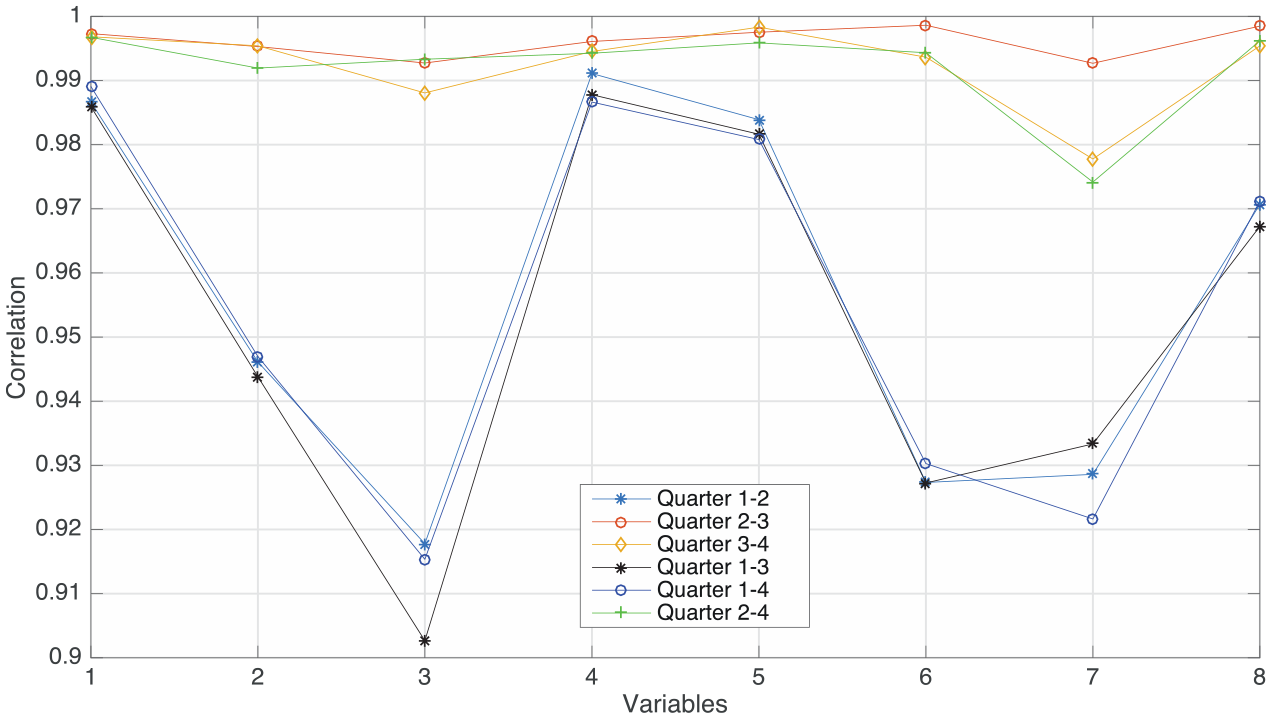
Correlations between the different self-organizing maps by quarter: (1) Booking score, (2) HolidayCheck score, (3) Trivago score, (4) TripAdvisor score, (5) Expedia score, (6) Yelp score, (7) Agoda score, (8) Hotels.com score.
Figure 1 shows the great similarity between all online ratings by platform. In particular, the greatest similarities can be found in Booking, Expedia (both online travel agencies), Trivago, and TripAdvisor (both online review platforms). The visual patterns of the Yelp ratings are the most differentiated. The lower left corner is where that difference appears most clearly. This finding shows similar behavior to the online ratings on tourist platforms and a difference between these platforms and the nontourist platforms, as represented by Yelp. Figure 2 displays the correlations between online ratings by quarter, showing values higher than .94, except on platform 3, Trivago, which ranges from .90 to .92; platform 6, Yelp, with a correlation value of around .93; and platform 7, Agoda, which has correlation values between .92 and .94. Overall, the high values of the correlations between the online ratings for each quarter for each platform show the existence of a common pattern over time in the four quarters analyzed.
To analyze the relationship between the attributes and the global score (the aim of research question 2), Figure 3 shows the SOM of the overall score for the first quarter for each platform and the score by attribute based on the sentiment analysis of hotel, location, service, and Internet (as depicted in Table 2). Figure 4 shows the correlations between quarters based on equation (1). Again, it is observed that there is a very high correlation between different quarters except in Yelp, 6, and in location, 10. In the latter, the difference between the first and third quarters was particularly significant, with a value close to .6. If the quarters are compared, it is observed that the third and the fourth are very similar in all variables (the correlations never fall below .9 for all platforms).
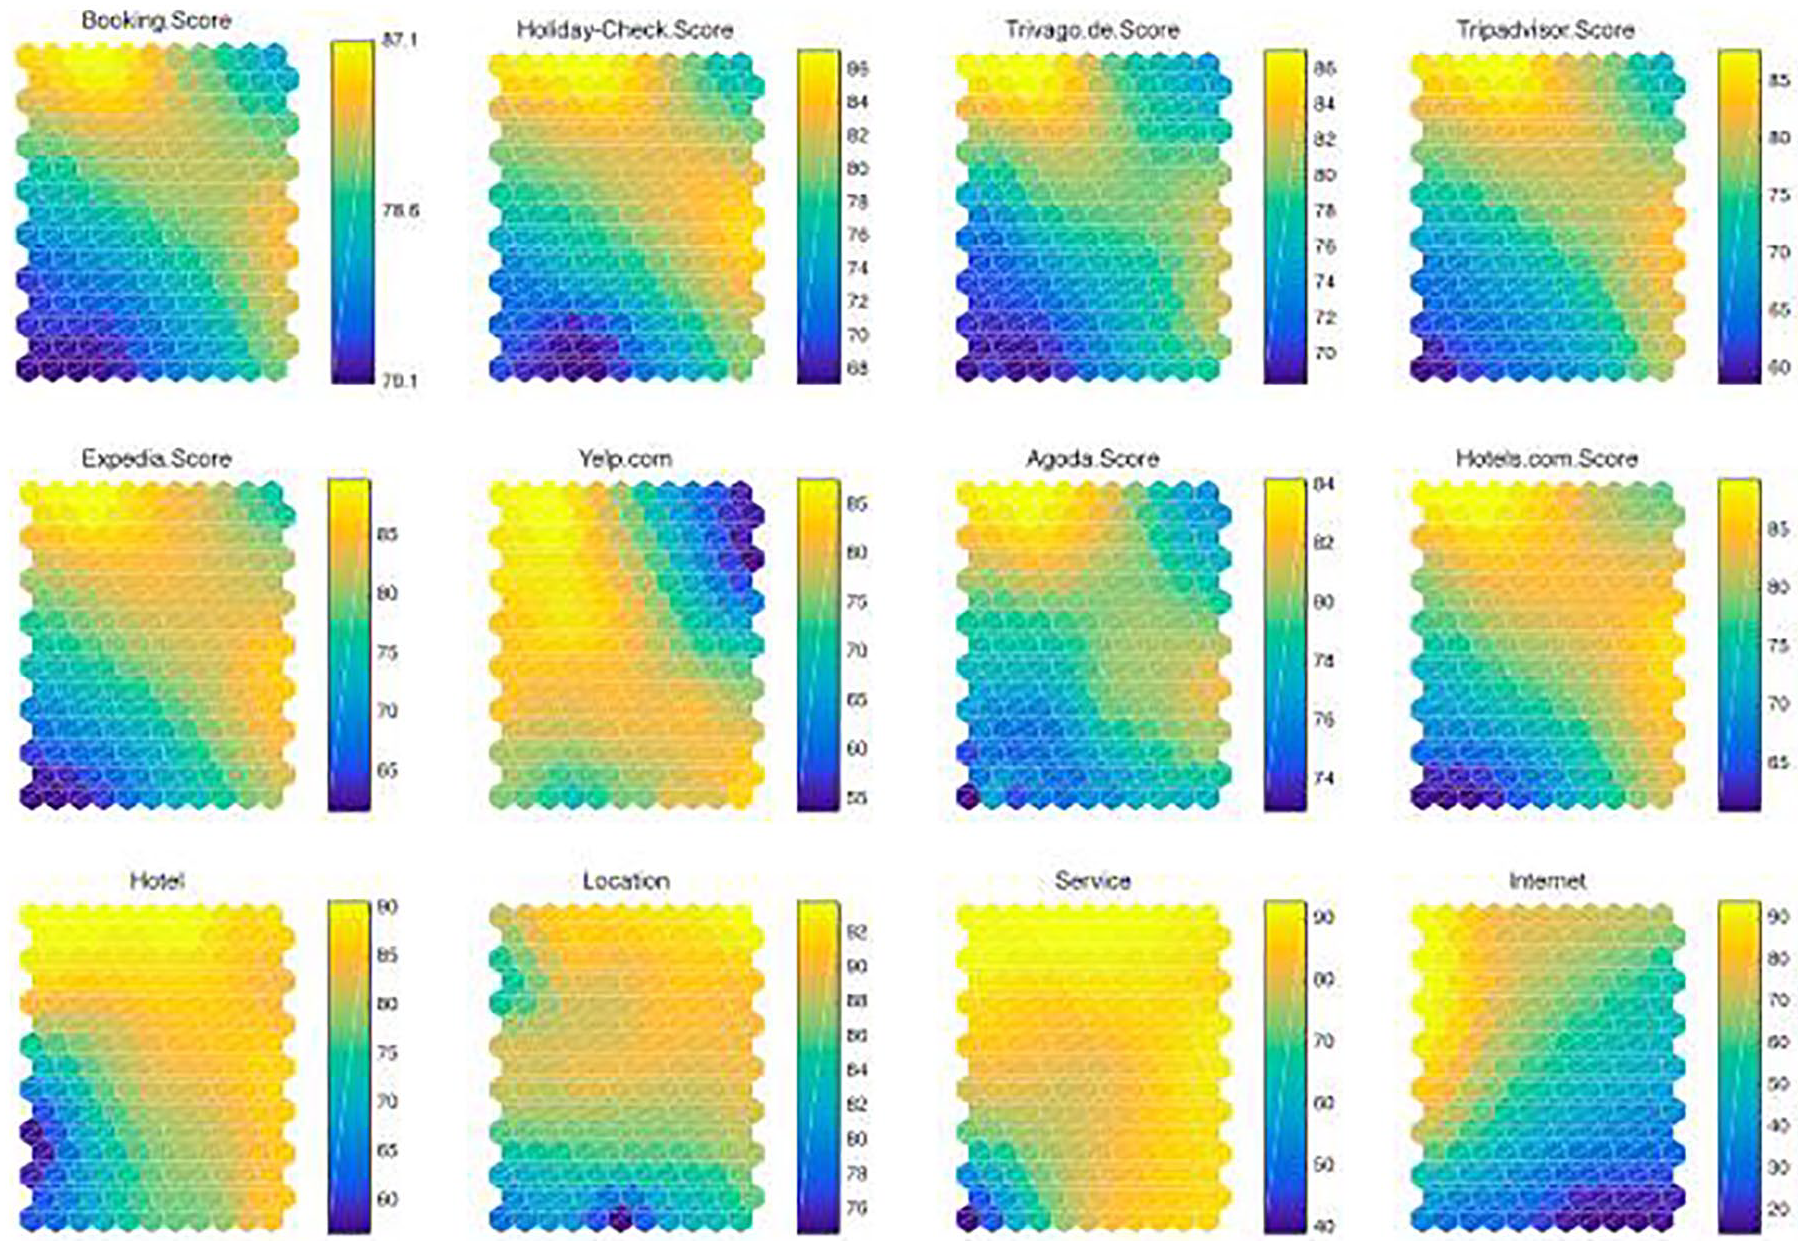
Component map for the first quarter comparing the overall platform scores and scores by attribute (hotel, location, service, and Internet).
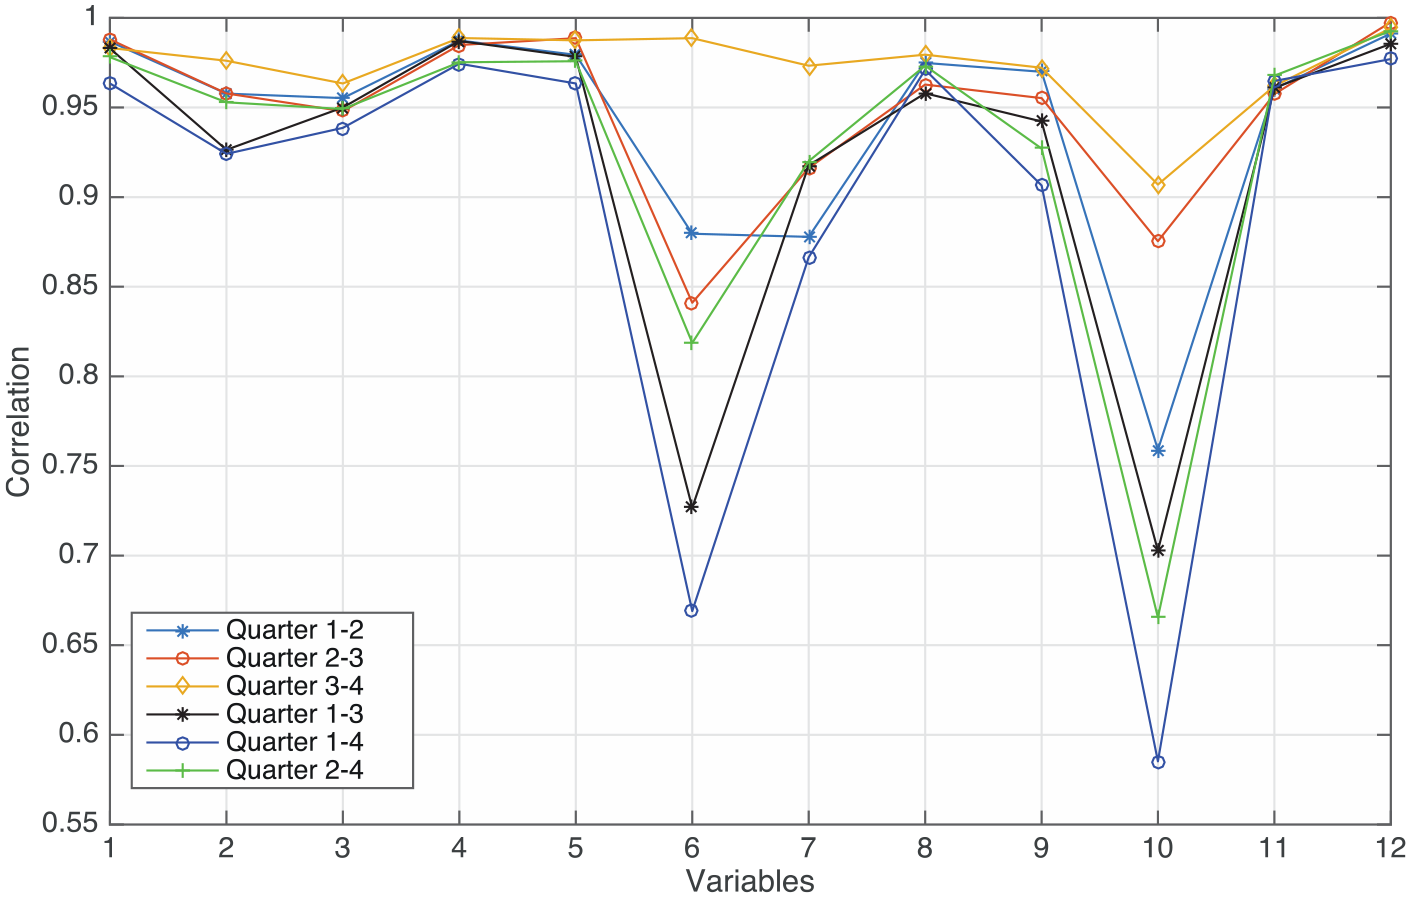
Temporal correlations across the different self-organizing maps for each quarter: (1) Booking score, (2) Holiday Check score, (3) Trivago score, (4) TripAdvisor score, (5) Expedia score, (6) Yelp score, (7) Agoda score, (8) Hotels.com score, (9) hotel, (10) location, (11) service, and (12) Internet.
Regarding the SOM analysis of the overall scores, Figure 3 shows the similarity in the overall scores for the different online review platforms, except for Yelp.com, which, as in the previous analysis, behaves differently from the others. It is also noted that the lowest values for the different online review platforms (bottom left corner of the maps) correspond to the lowest scores for location, service and Internet. Consequently, none of the analyzed attributes alone is strong enough to determine the overall score pattern on any of the platforms. This result is in line with Park and Nicolau (2015), who found a similar asymmetric relationship between overall sentiment and overall rating, using only Yelp. However, there are four additional findings. First, a very bad score for service is associated with a bad overall score, except in the case of Yelp, which, as seen previously, does not follow the same pattern. Second, no hotel with a very good location rating is among the most generally highly rated on any of the platforms. In terms of hotel location, the results are partially aligned with those of Xiang and Krawczyk (2016), who used semantic analysis on online reviews in Manhattan and found that while hotel location is a significant factor in the guest experience, it was ranked only fifth in the list of terms reflecting the guest experience. Third, the hotels with the highest overall scores do not have the highest location scores. In this same vein, Phillips et al. (2017) did not find that location influenced hotel performance. This must be attributed to the fact that the location decision is made at the earliest stage of the process and does not influence the location rating given subsequently. Finally, the hotel and service sentiment assessments follow a similar pattern and give higher values than location and the Internet in almost all the maps.
In summary, if the variables of Figure 3 are analyzed, it is observed that there is no single attribute that determines the overall score pattern for the different platforms. Consequently, tourists, in their overall hotel evaluations, value attributes other than the four previously described. Hence, as Phillips et al. (2017) showed, several hotel subfactors, such as rooms, Internet, building, grounds, and ambiance contribute toward explaining the overall hotel factor, which had the strongest influence on hotel performance. However, their study, based on causal modeling, did not find any relationships between other factors, such as service, that are seen in this study. This finding contributes to the ongoing need to research the type of factors that influence overall hotel evaluations.
As regards the analysis of the (dis)similarities between the online ratings by platform, the present study used hotel performance based on consumer evaluations (see Table 1). Only those platforms with the largest number of online ratings were selected. Figure 5 depicts the relationships between performance and platform in the first quarter. The component map of Figure 5 also shows that performance across the platforms does not follow a similar pattern, although it is noteworthy that those hotels with the highest performance on one platform have it in all platforms. When scores descend from the maximum, the pattern diffuses across the platforms. It is observed that, for average and low scores, each platform presents a different pattern, so there is no agreement between them in that score range. On the other hand, Figure 6 shows stability over time across platforms (research question 3), demonstrated by the temporal correlation between quarters, showing again a high correlation (above 0.9), which evidences the same temporal behavior by platform, so that only the first quarter need be analyzed.
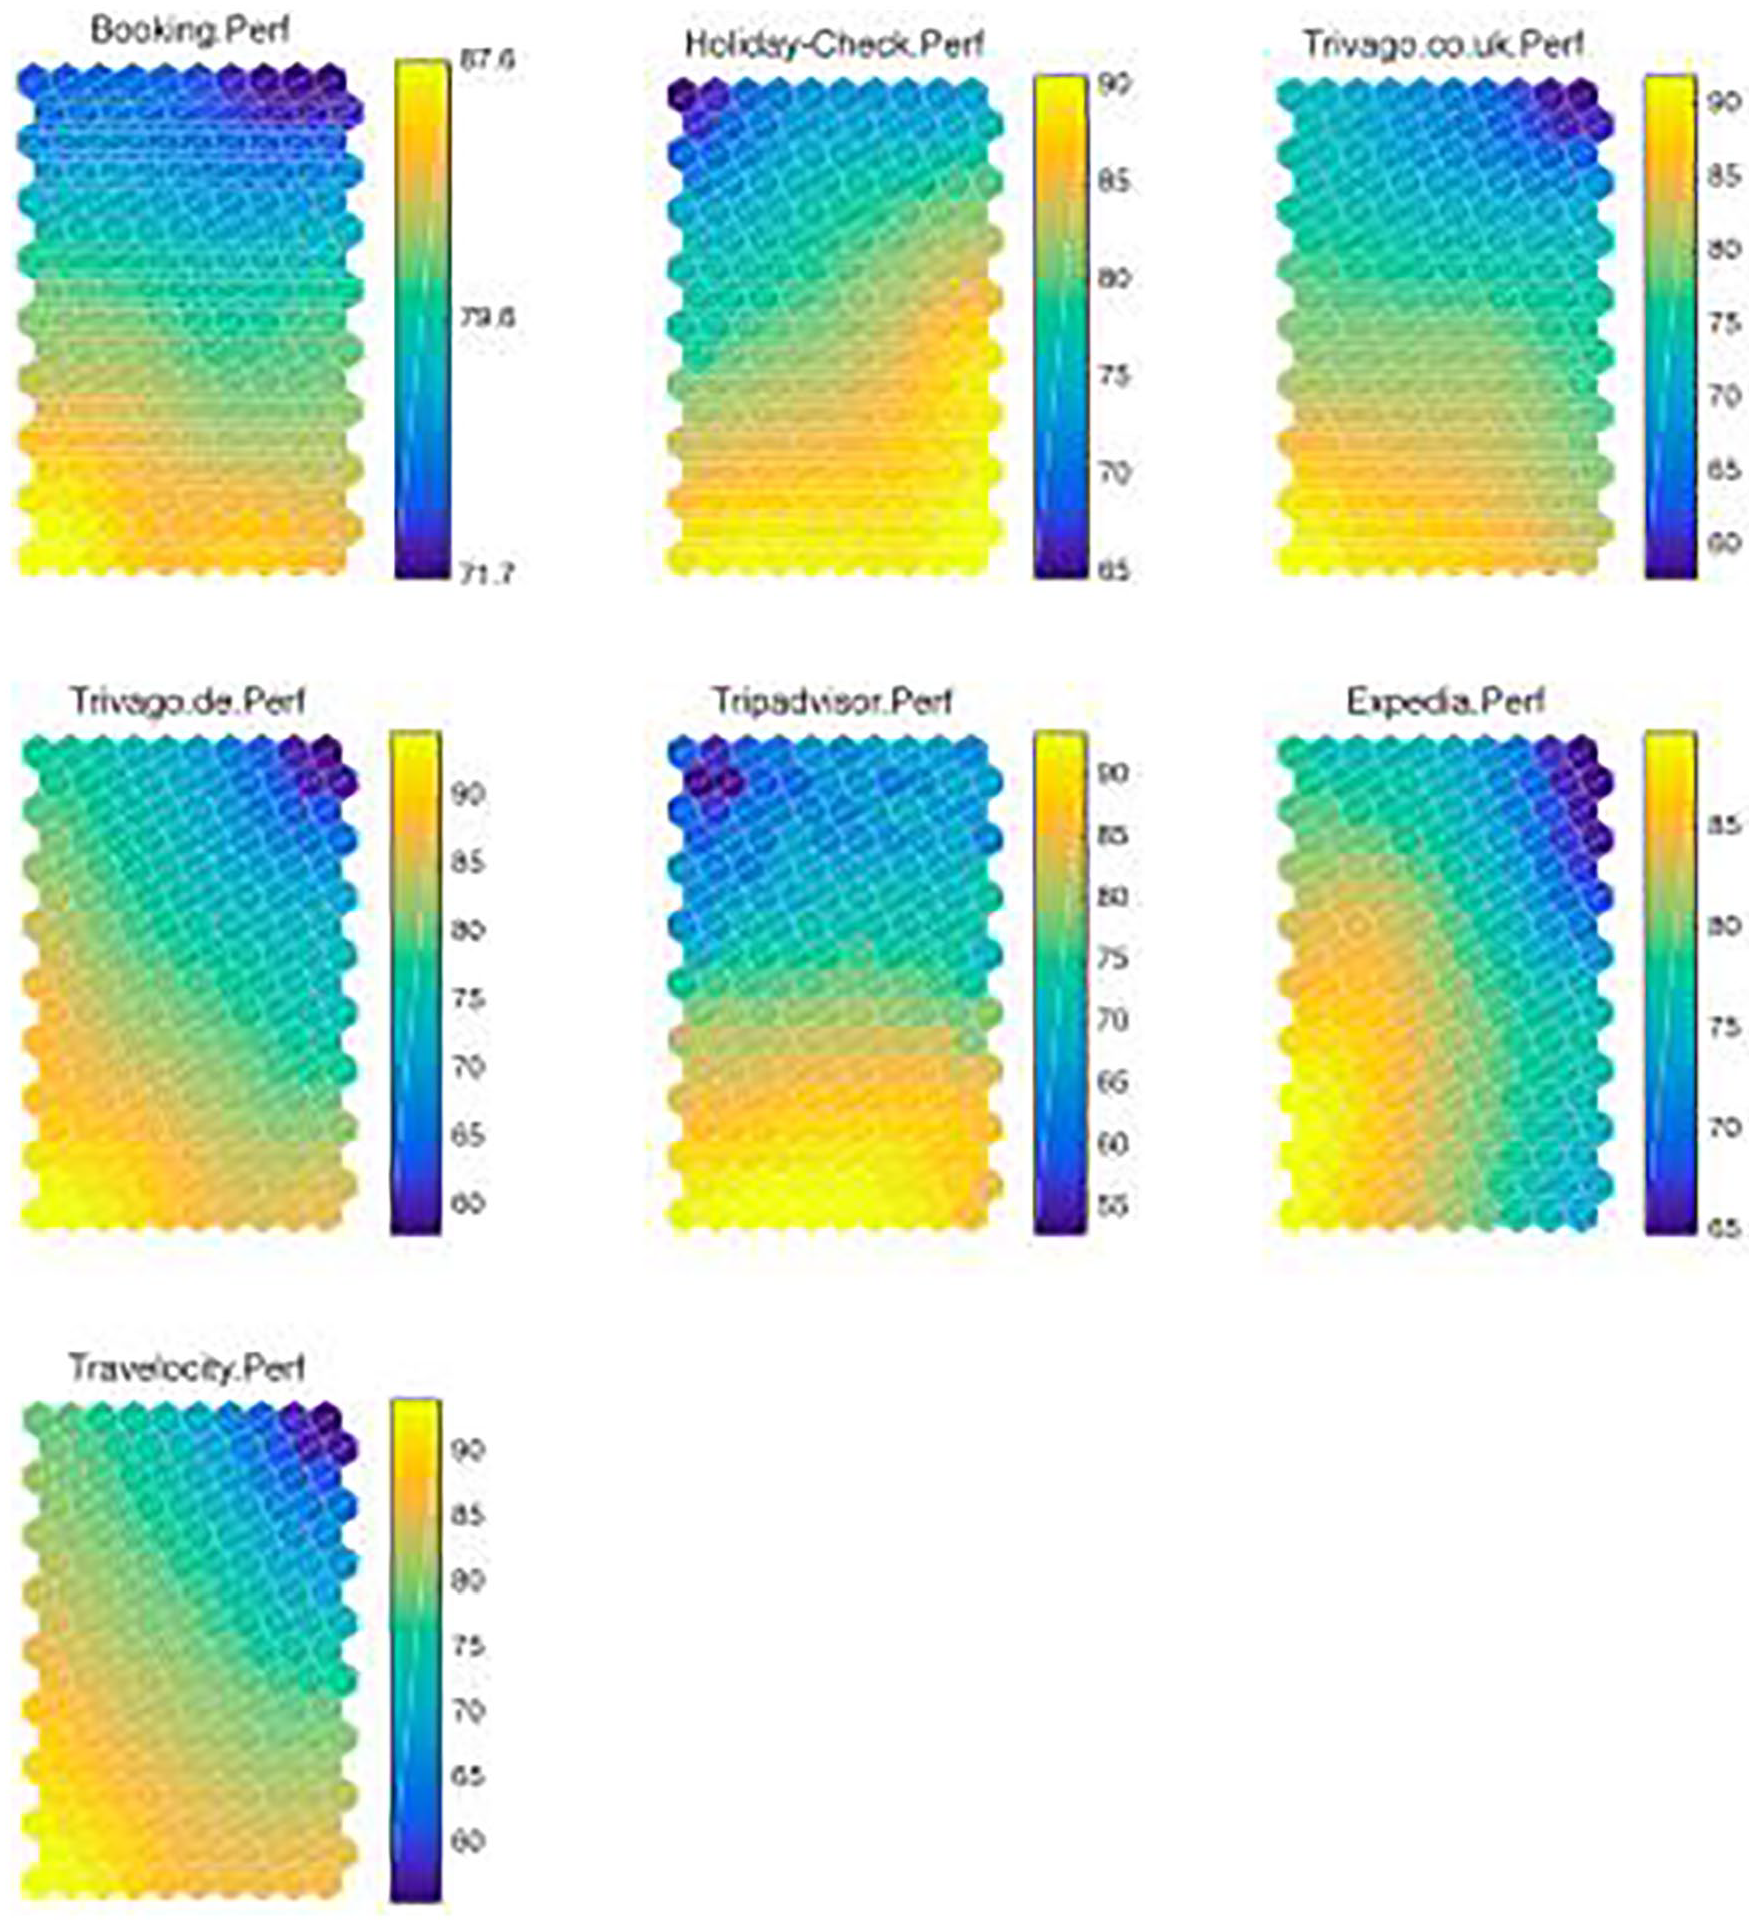
Component planes of performance across platforms for the first quarter.
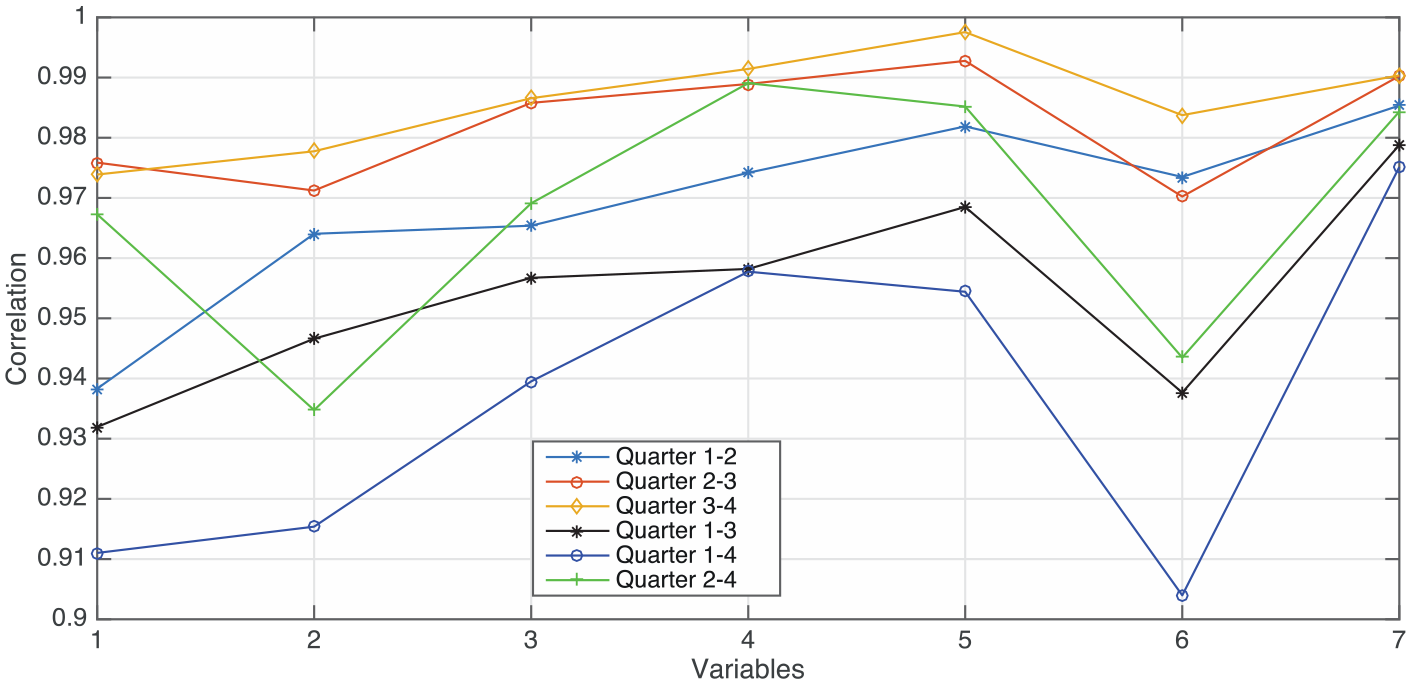
Temporal performance correlations across the SOMs for each quarter: (1) Booking, (2) HolidayCheck, (3) Trivago.co.uk., (4) Trivago.de., (5) TripAdvisor, (6) Expedia, and (7) Travelocity.
In order to analyze if performance captures behavior similar to the sentiment analysis of the four attributes, hotel, location, service, and Internet (research question 3a), Figure 7 shows the component map depicting average hotel performance on the platforms and average sentiment by attribute. From this map, the following findings are observed: (1) there is a similar pattern between performance and the service attribute, ensuring, at least, that a very good service evaluation implies very good overall performance; (2) very good hotel and location evaluations are related to very good performance scores, although this relationship is not maintained for poorer evaluations; and (3) the Internet score does not show any special relationship pattern with performance.
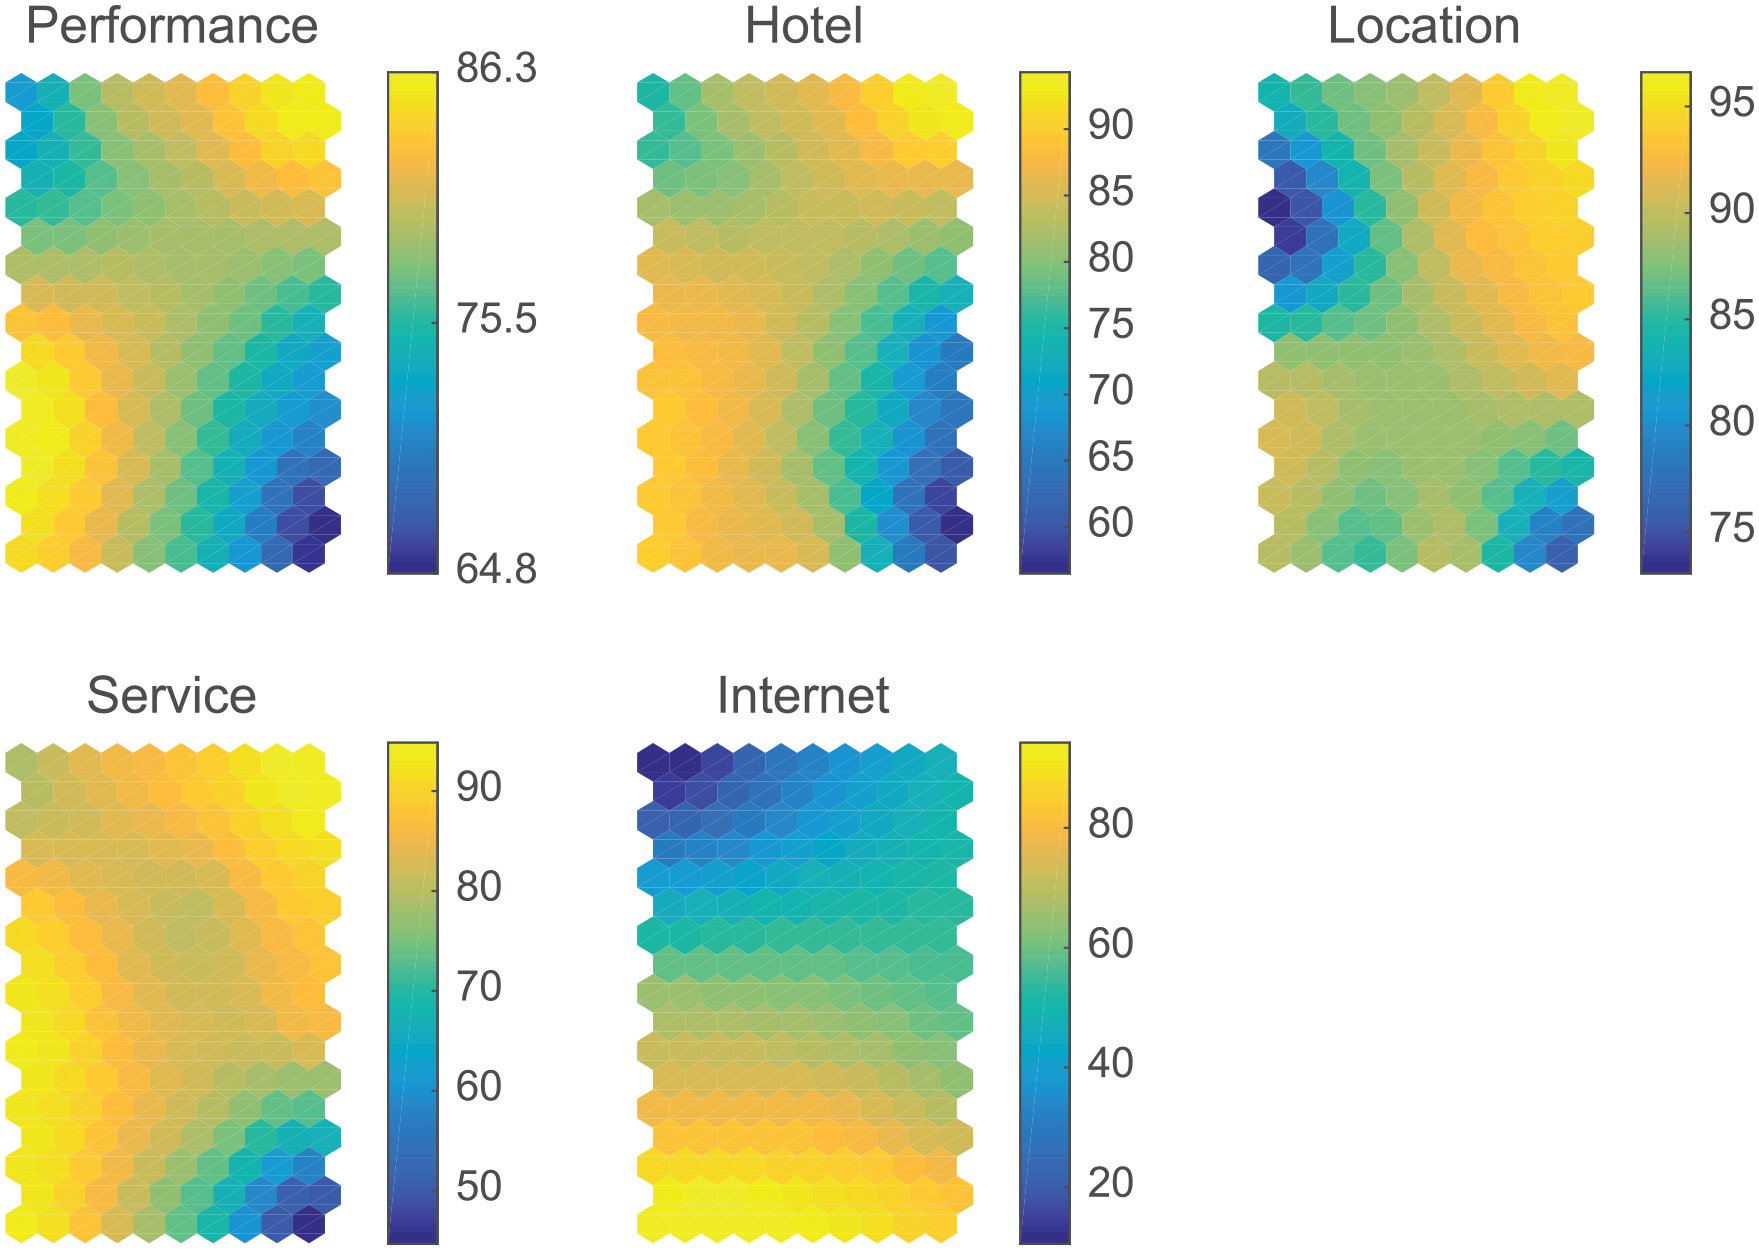
Component map of average performance on all platforms and score by attribute.
Figure 8 shows the temporal correlation between quarters for the SOMs. The correlations are above .9, except for variable 3, location, whose correlations by quarter are between .55 and .65. Perceptions about location are time dependent. This dependence can be explained by the season during which the hotel is visited. As an example, in a coastal city, in summer the beach may be attractive but, in winter, the historic center may be more interesting. Consequently, the location assessment will differ depending on the quarter.
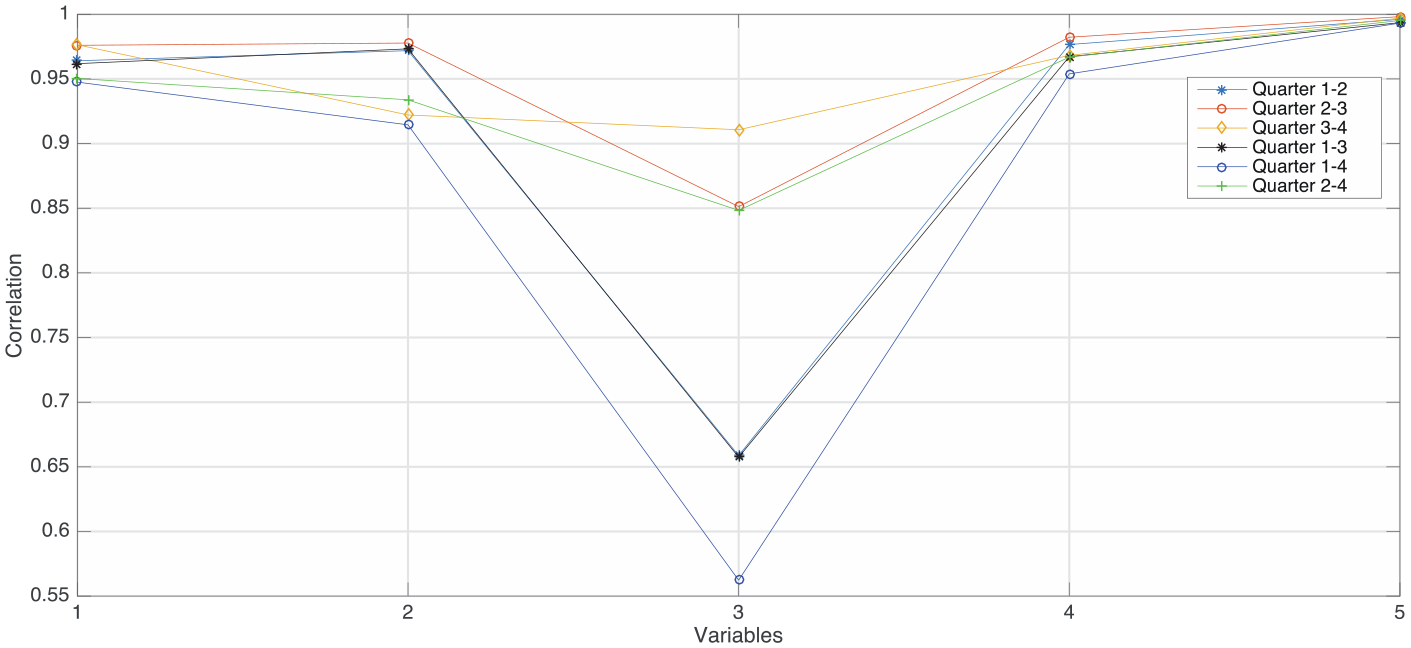
Temporal correlations across the SOMs for each quarter: (1) overall performance, (2) hotel, (3) location, (4) service, (5) Internet.
To analyze if there is a relationship between attribute sentiment and average overall score across all platforms, Figure 9 shows the component map of the average overall score of the platforms and sentiment score by attribute. From this map, it is observed that there is a similar pattern between the average score across all the platforms and the specific hotel attribute. There is no relationship with the Internet score.
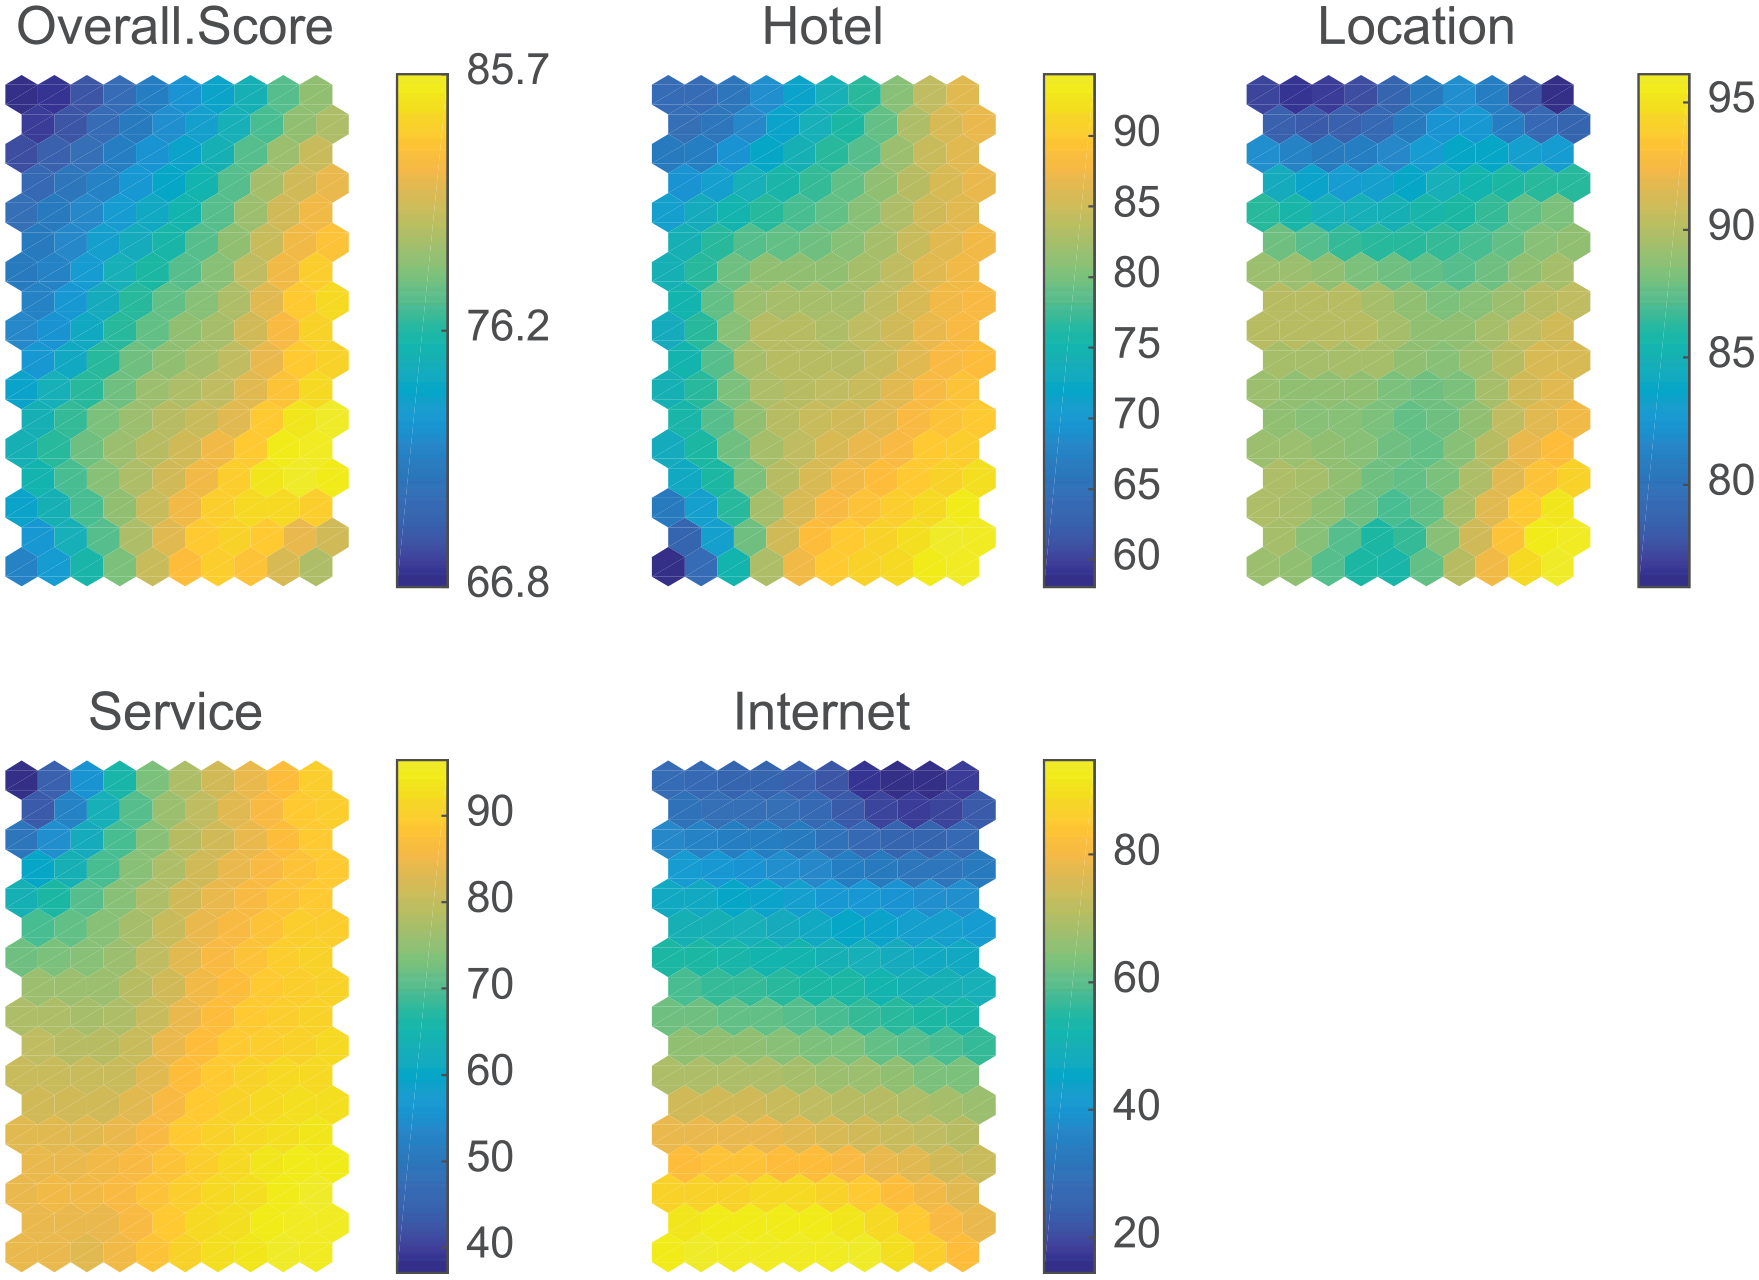
Component map of average scores for all platforms and score by attribute.
Figure 10 shows the temporal correlation between quarters for the SOMs. The correlations are above .8. These results are similar to those obtained in the overall score analysis, reinforcing those obtained for overall score (Figures 5 and 6), thus supporting the concept of stability within each platform and across platforms over time.
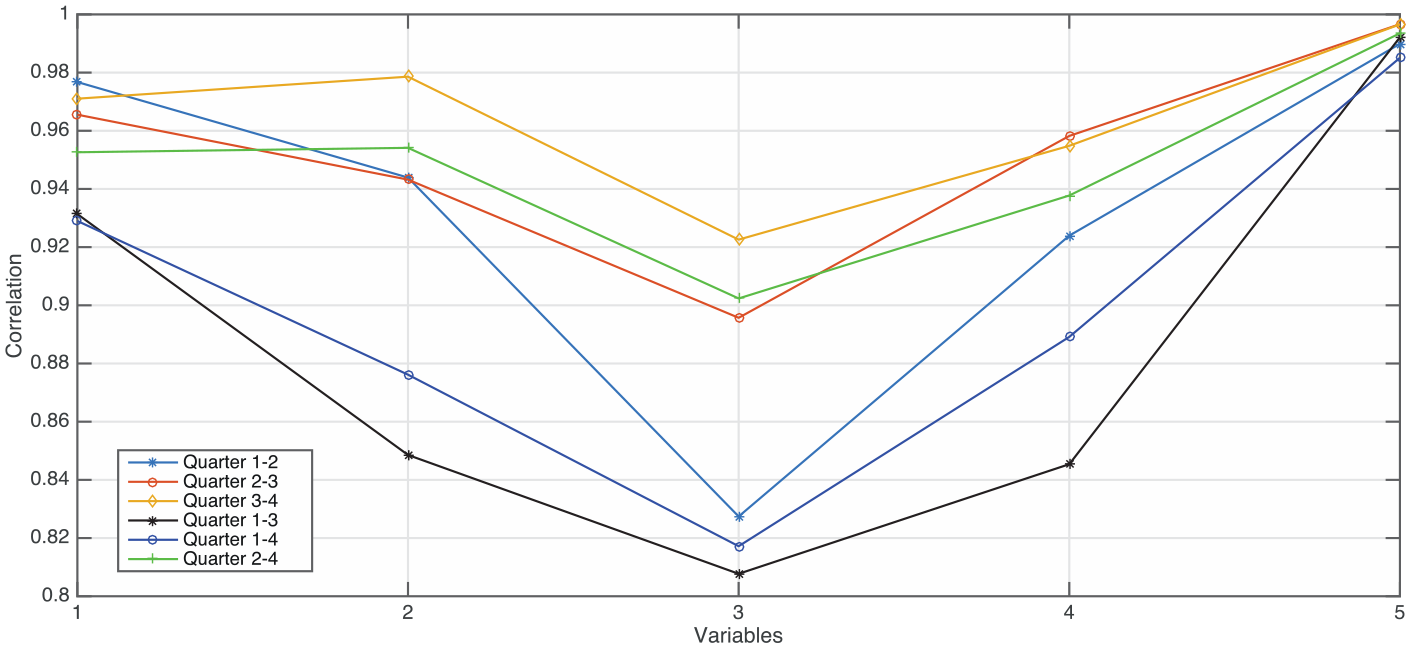
Temporal correlations across the different SOMs by quarter: (1) overall score, (2) hotel, (3) location, (4) service, (5) Internet.
Qualitative Confirmation Analysis
An explanatory sequential design, as suggested by Creswell and Creswell (2018), was used. Therefore, next, a qualitative study was conducted. The qualitative study was in two parts: A focus group of hotel marketing managers in charge of social media and an in-depth interview with the Managing Director (MD), Spain, of TrustYou. The aim of the qualitative study was twofold: first, to contrast the research findings derived from the SOM analysis and, second, to identify potential explanations for the results and new insights for future research.
Focus Group
As for research question 1, the participants confirmed the research findings. They all understood that online review patterns behave in a similar way across the platforms. Although the scores of the hotels were not identical in each platform, they were very similar and the order of online rating for each hotel in each platform was maintained, except in specific or exceptional cases. No manager used Yelp, and they did not see it as a specialist tourism platform.
Research question 2 aimed to analyze the consistency of the ratings between the overall evaluations and the evaluation of each specific service. The participants held diverse views. In some cases, an overall rating, either positive or negative, might be transferred to each individual service. However, other participants suggested the reverse was the case, that is, that tourists are quite confident in assigning different ratings to each service independently. In any case, the “hotel variable” is seen as an umbrella score that mostly reflects overall evaluation. Potential differences here were attributed to type of tourist and their countries of origin.
Research question 3 aimed to analyze whether the online ratings of the hotel features varied over time and by platform. The findings suggested that the ratings were stable over time, except for location. Although the locations of hotels do not change, the participants’ view was that the season might affect the ratings depending on when the comment is posted. That is, the location might be rated as good during the summer but not during the winter. However, in nonseasonal locations, these ratings will not vary over time or platform.
As for research question 4, the participants confirmed there were no differences in ratings between the platforms, as in research question 1. They suggested that potential differences might exist between type of guest rather than type of platform.
In-depth Interview
In terms of the similarity between online ratings between platforms, research question 1, it was again confirmed that online review patterns behave in a similar way across platforms. This result confirms the research findings and the focus group results. Furthermore, two interesting comments were made. First, platforms that do not require the reviewer to prove that they actually stayed at the hotel prior to posting the comment, such as TripAdvisor, attract more reviews than the more restrictive platforms. This lack of a verification system may make these platforms primary options for publishing negative reviews triggered by disappointment, resentment, or disagreement with the property’s management. This may explain why average hotel scores are slightly lower on TripAdvisor than on the other platforms. Second, since the beginning of 2017, Yelp has not been monitored by TrustYou because it does not attract a high volume of comments on hotels, and is not, therefore, consulted by hotel managers. This confirms that Yelp, a platform not specializing in tourism, as do the others, is something of an anomaly. As for research question 2, which aims to analyze the consistency of online ratings between overall evaluations and evaluations of each specific service, the TrustYou MD saw this trend as logical, since the hotel variable summarizes the overall rating. However, further research might analyze whether the scores of other services, such as room cleanliness and food and beverages, may vary. These variables might be more subjective and score differently.
Research question 3 aimed to analyze whether ratings of hotel features vary over time and by platform. In the experience of TrustYou, there should be stability across services and platforms. The findings suggest there is stability of online ratings over time, except for hotel location. The MD suggested these results need further discussion. The explanations suggested depended on the type of hotel and destination. First, in peak seasons, scores tend to be more negative because the higher prices charged then create higher expectations. Second, although location is a tangible attribute, it might be perceived differently depending on the season and travel motives. Third, location embraces related services such as transport, recreational activities, and other services that vary seasonally and therefore might elicit different scores depending on destination type and seasonality.
Lastly, taking research question 4, the MD argued there should be no differences between the ratings where a prior booking is required to post an opinion and those where no booking is required. This confirms the findings and results of the focus group. Two comments were made that may enrich future research. The platforms where no proof of a prior booking is required tend to attract a higher number of online comments than those that do require proof of a previous booking. Also, platforms that attract a high volume of comments tend to dilute their more extreme scores; this suggests an interesting research avenue, based on an analysis of the tails, to capture potential changes.
Overall, there is consensus in the research findings and, especially, on the value and usefulness of the research, among the hotel managers and the MD of TrustYou, Spain. Furthermore, the focus group and the in-depth interview opened new research avenues that might focus on analyses of online reviews by type of tourist and country of origin.
Discussion and Implications
As to research question 1, the results suggest that there is a similar pattern of online review scores across most platforms, except for Yelp and HolidayCheck. This implies that to a certain extent, users give homogenous evaluations on typical tourism platforms. This interesting finding suggests that from a practical point of view, hotel managers, and even customers, do not need to consult all review platforms. From an academic point of view, this finding means that users tend to evaluate the same types of service as being equal, regardless of the platform, all of them being of the same nature. Accordingly, if tourists show similarities in their evaluations across online platforms, it can be derived from this that tourism online platforms are trustworthy information sources.
Research question 2 aims to analyze if there is a pattern of consistency between the scores given to each attribute and overall score. The results do not show a high level of consistency between the scores given to the four attributes and the overall score by each platform and between platforms, as Figures 3, 5, and 7 show. Thus, location is less correlated than the other three variables. This may be attributed to the influence on the location score of the season during which the visit takes place. The consistency between specific attribute assessments and the global score awarded to a hotel (research question 2) is of importance in understanding which attributes contribute to the overall assessment and to analyze their relative importance in the evaluation of the hotel. It can be argued that tourists are not consistent in their evaluations or, alternatively, all attributes (e.g., location, Internet, hotel and service) do not equally contribute to the overall score. In fact, the average overall score has a pattern very similar to that of the hotel’s sentiment assessment. However, the pattern differs extensively, as expected, when it comes to an attribute that is increasingly common in hotels, such as Internet availability. Another interesting implication is the different pattern observed between overall score and service attribute. This can be attributed to the different level of service usage according to type and category of hotel. From a conceptual point of view, it seems that users follow a noncompensatory evaluation model, regardless of platform. Furthermore, the results, depicted in Figure 4, show stability over time for each attribute, except for location, which is attributable to the fact that location scores vary depending on the season.
In relation to research question 3, the results shown in Figures 4 and 6 indicate that there is stability over time in the overall scores and in performance over time.
Possibly the most important current debate in relation to online comments is about the reliability of platforms that do not require prior proof of reservations, as opposed to those that do (research question 4). The ability to define a pattern of correlation between platforms that require prior bookings (Booking.com type) and those do not (e.g., TripAdvisor.com) is a topic of great interest as it indirectly affects the credibility of the online commentators. The results indicate that there is no difference between the patterns of those platforms that require prior reservations and those that do not. This again implies that the behavior of the consumer is homogeneous and not conditioned by the booking requirement of the platform, which is especially important with a requirement so fundamental in tourism, the prior reservation.
Lastly, this research has shown that SOMs are useful tools to compare multiple online review platforms. Their main advantages for future research are as follows. First, SOMs are easy to create and are in accordance with tourism research calls (Cheng and Edwards 2015). Second, when data comes from multiple databases (e.g., online platforms), SOMs allow a rapid comparison that can detect common patterns or differences. Third, SOMs allow the analysis of nonlinear relationships. As Kohonen (2001) suggested, this artificial neural model can convert complex, nonlinear-related relations between high-dimensional data items into geometric relationships in a low-dimensional space. Fourth, SOMs transform N-dimensional data sets into 2D representations. Finally, the correlations between SOM results help to analyze the relationships across platforms, or one platform over time.
The implications for managers and analysts can be grouped as follows:
The analysis of just a few platforms is enough to assess the online evaluation of a hotel. Thus, social media analysis is facilitated because the number of social media platforms is smaller.
The global perception of a hotel is the element that impacts most directly on the overall hotel rating. Therefore, hotel managers should focus their actions on highlighting the overall value of the hotel rather than its specific attributes.
As the variation over time of online ratings is low, hotel managers should focus more on delivering the right product and service rather than spending too much time analyzing these small variations.
Whether a platform has a reviewing requirement about staying in the hotel overnight has no influence on ratings. Therefore, hotel managers must look at all online ratings.
Conclusions
Online ratings are typically used by tourists to help choose service providers and by managers to monitor hotel performance. From a conceptual viewpoint, online reviews can be seen as part of the service offered by online sites that, in turn, affects the navigation experience (Küster, Vila, and Canales 2016) and supports purchase decisions (Babić et al. 2016).
Given the increasing number of platforms, tourists and managers have to consult several to get an accurate impression of reviews. Thus, similarity between online reviews posted on each platform and consistency between overall scores and specific attributes, and over time, calls for specific research. Therefore, this study analyzed four main areas: (1) similarity across online platforms, that is, whether online ratings followed a similar pattern across multiple tourism and nontourism platforms; (2) consistency of online reviews over time on each platform; (3) online consistency between overall scores and attribute-based scores; and (4) whether online reviews differed depending on platform reservation requirements.
This article adopted SOMs to parse large amount of data about online ratings. Thus, the accuracy of SOMs in analyzing online ratings was tested. Using data from 1,165 hotels and 11 platforms over 27 months, this study addressed similarity and consistency in online ratings.
The findings suggest the following:
1. Tourist platforms follow the same patterns in online reviews, regardless of the platform. By contrast, the only nontourism platform differed in its pattern of online evaluations.
2. There is a lack of a clear, consistent pattern across the overall scores and the scores given to each attribute, except for the generic hotel attribute, which, in turn, means that only this attribute matches the overall scores given by tourists. The remaining three attributes analyzed, location, Internet, and service, do not affect overall evaluations.
3. Assessments at the aggregate level remain stable over time, except for location.
4. Surprisingly, there are no differences in evaluation patterns between those platforms that require prior hotel reservations as against those that do not require proof of a previous booking. This finding can be interpreted as reflecting a high degree of sincerity in the evaluations.
5. Overall, the SOM is shown to be a useful tool in parsing large data sets and simplifying visual representations.
This article contributes to the literature, both conceptual and methodological. From a conceptual viewpoint, the analysis of the (dis)similarity of online ratings across platforms and over time provides knowledge of how users rate the same type of service on different platforms and over time. The analysis of (in)consistency might be considered as a valuable composite measurement. From a methodological point of view, this study introduces SOMs as effective means of parsing large data sets from different sources. This technique provides objective measures (e.g., neighborhood function) that may support initial conclusions derived from a visual analysis.
This research has some limitations. First, the data were analyzed without any level of disaggregation by tourist type. Future research might look at country of origin and the expertise of the online raters. Second, although this research comprises more platforms and tourism destinations than previous, related studies, further research should adopt a stimuli-response approach in order to look at the specific influence of any improvement in a hotel’s performance in comparison to its competitors. Third, the present study does not differentiate type of hotel by stars. Future studies might analyze (dis)similarity and (in)consistency by type of hotel and even by location. Future research might be improved by applying a dynamic approach based on Temporal Kohonen maps and related developments (Salhi, Arous, and Ellouze 2009).
Footnotes
Declaration of Conflicting Interests
The author(s) declared no potential conflicts of interest with respect to the research, authorship, and/or publication of this article.
Funding
The author(s) received no financial support for the research, authorship, and/or publication of this article.
