




Abstract
Online peer-to-peer platforms empower individual users and facilitate value-oriented exchanges. Personal profiles are the main point of contact with consumers on these platforms. Although individual sellers can use these profiles to market their own products, the optimal communication strategies that maximize their revenues remain uncertain. In line with construal-level theory, a self-presentation strategy that reduces social distance might increase sellers’ revenues. An empirical validation, based on 6,074 Airbnb listings, affirms that self-presentation that evokes social values leads to higher revenues. The length of the self-presentation also exerts a notable impact. Specifically, an inverted U-shaped effect on revenues reaches its peak at 424 words. This research has rich managerial implications, in that it demonstrates how sellers on peer-to-peer platforms can increase their revenues simply by emphasizing social values in their self-presentations.
Introduction
The so-called sharing economy offers an appealing alternative to traditional businesses, such that recent predictions anticipate more users and transaction values of around €570 billion annually by 2025 (Pricewaterhouse Coopers 2016). This growth largely stems from the development of social network platforms, which have fostered the creation and maintenance of online peer-to-peer marketplaces (Botsman and Rogers 2011; Tussyadiah and Pesonen 2016). These marketplaces enable individual users to share various goods and services; instead of buying and owning things, consumers access them temporarily (Bardhi and Eckhardt 2012). Peer-to-peer transactions have completely reshaped the travel and hospitality industry in particular, and platforms like Airbnb and Homestay allow individual sellers to market their own products (Botsman 2014; Cheng 2016; Dolnicar 2017; Karlsson and Dolnicar 2016; Sigala 2017).
To facilitate these transactions, and thus maximize the revenues they earn, sellers must determine how best to present themselves in these marketplaces (Caldieraro et al. 2018). Such questions have received scant research attention. We draw on construal-level theory (CLT; Trope and Liberman 2003) to investigate self-promotion in peer-to-peer trading and particularly how self-presentation strategies affect sellers’ revenues. This theory offers a sound theoretical grounding for explaining consumers’ elaboration of distant objects, such as accommodations, which inherently reflect some social distance from the host. We focus on self-presentation, because it affects perceived trustworthiness and booking intentions (Tussyadiah and Park 2018). With informative self-presentations, hosts can provide a more concrete construal of the distant outcome (i.e., the accommodation), which in turn might affect revenues (Forman, Ghose, and Wiesenfeld 2008; Larrimore et al. 2011).
Such self-presentations often signal specific social values, which drive peer-to-peer transactions (Tussyadiah and Pesonen 2016) and motivate sellers to participate in the markets (Lutz and Newlands 2018). Social values can serve as “mottos” for peer-to-peer platforms (Gebbia 2016), yet sellers’ final goal remains earning revenue (Abrate and Viglia 2019). Therefore, this study investigates whether a social-oriented self-presentation strategy enables sellers to achieve this goal and maximize their revenues.
In so doing, we make three main contributions to extant literature. First, this study advances recent research into the effectiveness of self-presentations. Tussyadiah and Park (2018) note the usefulness of self-presentations for trust building; we instead consider the effect of different self-presentation strategies on revenues. The findings suggest that self-presentation content influences sellers’ revenues, such that, after controlling for other factors, listings that provide details about the social aspects of the experience lead to greater revenues. A self-presentation focused on sellers’ personal interests instead has a negative impact on revenues. Second, drawing on decision-making theory, we tackle questions surrounding information disclosure and its effect on sellers’ revenues; when sellers disclose too much information, it has a detrimental effect. Third, leveraging the social dimension of CLT (Trope and Liberman 2003), we demonstrate that social distance is a powerful tool for achieving revenue maximization.
In the next section, we present the theoretical underpinning for this study in more detail. After we describe the methodological approach and derive the empirical analysis, we present the study findings and discuss them. Finally, we note some theoretical and practical implications, along with some limitations and areas for further research.
Social Distance in the Sharing Economy
Substantial research investigates the sharing economy from multiple perspectives, including its impacts on the accommodation sector (Guttentag 2015; Zervas, Proserpio, and Byers 2017), the risk of digital discrimination (Edelman, Luca, and Svirsky 2017), regulation issues (Koopman, Mitchell, and Thierer 2015; Williams and Horodnic 2017), value co-creation (Camilleri and Neuhofer 2017), and online reputation (Abrate and Viglia 2019; Liang et al. 2017; Zervas, Proserpio, and Byers 2015). These various research streams in turn produce different conceptualizations. In hospitality settings, the sharing economy mainly refers to peer-to-peer accommodations. As Tussyadiah (2016, p. 70) states, peer-to-peer accommodations allow “regular people, who are distinct from typical business entities, to offer hospitality (by renting out their spare bedrooms or unoccupied properties) to their peers (i.e., tourists).”
Social utility drives these peer-to-peer transactions (Guttentag et al. 2017; Habibi, Kim, and Laroche 2016; Ikkala and Lampinen 2015; Zhu, So, and Hudson 2017), because the act of sharing represents “a step toward creating social connection and community” (Albinsson and Yasanthi Perera 2012, p. 311). Contrary to traditional market-based exchanges, in peer-to-peer transactions, service providers take part in consumers’ experiences (Tussyadiah 2016). Societal risks thus arise (Malhotra and Van Alstyne 2014), because when the transaction counterpart is a stranger, consumers experience greater social distance (Schreiner and Kenning 2016). This social distance intensifies their perceived risks and may impede the transaction (Ert, Fleischer, and Magen 2016; Linke 2012; Schreiner and Kenning 2016).
Construal-level theory (Trope and Liberman 2003) provides a theoretical framework for understanding such social distance. In CLT, psychological distance refers to the subjective experience of considering something close or far from the self. It spans multiple dimensions, including temporal (i.e., present vs. distant future), spatial (i.e., close vs. distant), and social (i.e., degree of personal connection) distances. The social dimension of psychological distance explains closeness between individual entities (Trope and Liberman 2003), and people tend to exhibit more sympathetic reactions when they feel psychologically closer to others (Linke 2012; Small and Simonsohn 2008). Companies similarly can be represented as close to or distant from consumers (Escalas and Bettman 2005).
Distant objects affect predictions and guide actions (Dhar and Kim 2007; Trope and Liberman 2010; Trope, Liberman, and Wakslak 2007). The CLT proposes that people elaborate abstract mental construals to represent psychologically distant objects and go beyond the immediate situation (Trope and Liberman 2010). Online information might help create an abstract mental construal about the transaction that can assist users in making current decisions about a distant outcome. In this process, they overcome the social distance that exists between them and the potential service provider (Schreiner and Kenning 2016). In online transactions in particular, social distance affects purchase decisions (Darke et al. 2016), which tend to be driven by affective concerns (Han, Lerner, and Keltner 2007). Sensing psychological closeness enhances the affective intensity of the transaction; a psychologically distant mindset instead undermines these affective elements (Williams, Stein, and Galguera 2013). Reducing psychological distance thus should boost the social proximity between the seller and consumer and encourage purchases (Darke et al. 2016).
In sharing accommodation interactions, the host and guest initially are strangers (Tussyadiah and Pesonen 2016), so they both face reputational and societal risks (Malhotra and Van Alstyne 2014). Online communication helps consumers anticipate future in-person interactions (Gibbs, Ellison, and Heino 2006), though traditional reputation cues do not seem to alleviate uncertainty concerns, because of the presence of severe reviewing biases (Zervas, Proserpio, and Byers 2017). Similar to corporate brands in traditional marketplaces, personal self-presentations might serve to disclose fine-grained information and reduce perceived risks (Gibbs, Ellison, and Heino 2006). To measure the role of different self-presentation strategies on the effectiveness of transactions, we consider seller revenues as our outcome variable, an encompassing measure that combines prices and occupancy into a single indicator.
Self-Presentation: Social-Oriented Content to Boost Revenues
In online communication, personal profiles offer key information (Ellison, Hancock, and Toma 2012; Uski and Lampinen 2016). Websites communicate with known and unknown others (Schau and Gilly 2003), and information displayed on sellers’ profiles allows potential consumers to gauge their reputations (You, Vadakkepatt, and Joshi 2015). Personal information becomes especially pertinent in sharing contexts (Belk 2014). A wide range of personal profile attributes contribute to trust and reputation building in these transactions, including the seller’s photo (Ert, Fleischer, and Magen 2016; Xu 2014), full identification (Edelman and Luca 2014), and sellers’ self-presentation patterns (Ma et al. 2017; Tussyadiah and Park 2018).
Goffman (1959) refers to self-presentations as the continuous strategic expression of the self. In conveying self-image to others, self-presentations are a critical component of social interaction (Goffman 1959; Schlenker 1980). Online, individual users present themselves to project a desired impression, and this digital self is essential to interpersonal communications (Schau and Gilly 2003). The level of social distance between two parties can be measured by the intensity of their interpersonal communication (Giles and Ogay 2007); and it has a significant role in trust building. Trustworthiness increases when people are socially closer (Glaeser et al. 2000). Because expressing and sharing personal information attenuates psychological distance between parties, it also can create trusting beliefs (Toma and D’Angelo 2015).
In online communities, users create and share identities through profile self-presentations (Chen 2013). As previous studies show, compelling self-presentations determine consumer choices (Larrimore et al. 2011; Ma et al. 2017) and contribute to transaction effectiveness (Weinberg et al. 2013). Specifically, a seller’s self-presentation can increase the popularity of her or his listings by 8% (Mauri et al. 2018). A compelling self-presentation is essential to building an identity (Pera, Viglia, and Furlan 2016) and creating emotional and cognitive states of connection with consumers (Bhattacharya and Sen 2003; Woodside, Sood, and Miller 2008).
Different self-presentation patterns also evoke varying levels of trust and purchase intentions. Particularly, consumers’ booking intentions are higher when the host self-presents as well-traveled rather than as a worker (Tussyadiah and Park 2018), suggesting that a relational self-presentation (i.e., showing competence in hosting guests, highlighting empathy and social connections) enhances the bond between host and guest and results in greater trust and booking intentions. Guests also report increasingly looking for meaningful social interactions with hosts (Tussyadiah and Pesonen 2016).
Socialization refers to processes by which people from varied cultures and communities achieve a harmonious group existence, in social, emotional, and cognitive domains (Maccoby 2007). We embrace this conceptualization and focus on social values and their role in creating a human bond between host and guest. Social contact and cultural distance effectively define customer value and travel experiences (Fan et al. 2017; Zhang, Gu, and Jahromi 2019). By disclosing information about the type of relationship and the level of interactions between host and guest, a social-oriented self-presentation might mitigate the social distance that guests perceive regarding the experience (i.e., staying at that place). Hosts thus might emphasize their ability to provide meaningful experiences, such as a willingness to interact with and support guests (e.g., offering a nice welcoming experience, involving them in the community).
Building on these arguments, we predict that promoting social themes in a self-presentation may mitigate the social distance between parties and facilitate peer-to-peer transactions. Schreiner and Kenning (2016) similarly report a diminished sharing ratio as social distance increases. Overcoming social distance in the transaction should result in more concrete construals of the host. Because social elements are key to establishing demand (Ert, Fleischer, and Magen 2016; Liang et al. 2017; Tussyadiah and Pesonen 2016) and maximizing revenue (Abrate and Viglia 2019), we predict that the more the content in the seller’s self-presentation is social (i.e., appealing to social values), the higher sellers’ revenues should be. Formally,
Hypothesis 1: A social-oriented self-description has a positive effect on sellers’ revenues.
Information Overload Effects of Self-Presentations on Revenues
Berger and Calabrese (1975) recommend reducing uncertainty by increasing the amount of available information. In online interactions, consumers perceive information disclosure as useful (Bazarova and Choi 2014; Gibbs, Ellison, and Lai 2011; Racherla and Friske 2012). It also relates closely to willingness to pay (e.g., Huang, Zhu, and Zhou 2013). To reduce uncertainty, a longer and detailed description can be effective; Flanagin (2007) finds that longer descriptions correlate with increased bids and higher selling prices on eBay. Larrimore et al. (2011) reveal that the number of words in self-presentations is a significant predictor of funding success on an online peer-to-peer lending platform. Likewise, Ma et al. (2017) suggest that longer self-disclosures are perceived as more trustworthy.
However, research into information effects in consumer decision-making also reveals that too much information can lead to information overload (Lurie 2004; Messner and Wänke 2011). Humans have limited cognitive resources and allocate them judiciously (Payne 1982). Compared with an alternative that requires more effort to judge, an option that requires less cognitive effort is mostly preferred (Garbarino and Edell 1997). Decision quality decreases when there is too much information, because consumers struggle to process it (Lee and Lee 2004; Malhotra 1982). In online settings, consumers can access infinite amounts of information, so the optimal length of presentations is a critical question (Aljukhadar, Senecal, and Daoust 2012). Previous studies suggest an inverted U-shaped relationship between the amount of information and the degree of information processing (Sicilia and Ruiz 2010). According to Lee and Lee (2004), information overload leaves consumers less satisfied, less confident, and more confused. As the required cognitive effort increases, the likelihood of the difficult alternative being selected also tends to be lower (Garbarino and Edell 1997). Issues with information overload are especially salient in the tourism domain, preventing consumers from making online bookings (Lu, Gursoy, and Lu 2016).
Following these premises regarding the optimal length of self-presentations, we propose that revenues initially increase as self-presentation length increases. However, after a threshold, revenues diminish, because of consumers’ inability to process the excessive information efficiently. This shift leads to a lower likelihood of selecting listings with overly long self-presentations, resulting in a negative revenue effect. Formally,
Hypothesis 2: The effect of self-presentation length on sellers’ revenues follows an inverted U-shape.
Methodology
Data
The empirical context for this study is Airbnb, the largest peer-to-peer platform in the tourism accommodation sector (Guttentag 2015). Airbnb is growing at a rapid rate and currently represents a major player in the hospitality industry (Zaleski 2017), with more than 3 million global listings in nearly 200 countries, and approximately 200 million registered guests (Airbnb 2017).
The study relies on two different data sources. First, we retrieved information about all Airbnb private rooms in Manhattan (New York) and London from Insideairbnb.com (Insideairbnb 2017), an independent website that provides data sourced from public information available on Airbnb.com. Second, we gathered revenue data from AirDNA (2017). By tracking daily calendar and booking information on Airbnb listings, AirDNA collects data about daily rates, occupancy rates, seasonal demand, and revenues generated by short-term rentals. For the purpose of the present study, the AirDNA database comprises hosts’ actual revenues for each Airbnb listing over the previous 12 months.
Because self-presentation is important to create a social bond with guests, we investigate “private room” listings, where the host and guest share spaces. To guarantee that the sample does not contain property dealers (“business” hosts), whose performance outweighs that of ordinary hosts (Gunter 2018), we removed any listings for which the host manages more than two listings. In addition, as in Miller (1997), the sample comprises only listings whose self-presentation contains more than 30 words, to ensure the self-presentation is long enough to be meaningful. Finally, to avoid within-city location effects for revenues, as in Abrate and Viglia (2019), we collected just listings within a 3-km distance of the main touristic attraction. The multistage sampling procedure starts with the selection of the investigated city and then selects the individual collection of Airbnb listings that match the key criteria.
The final data set consists of 6,074 Airbnb listings in New York (n = 1,497) and London (n = 4,577). These two cities are top destinations in North America and Europe, respectively (GDCI 2017). In addition, they are similar, in that they both attract business and tourism travelers throughout the year, which helps us avoid seasonality patterns in the revenues.
Data Analysis
We use a two-step methodological approach to analyze the effect of self-presentation strategies on hosts’ revenues. First, we use latent topic modeling to categorize the content of self-presentations by semantics. Second, with multiple regression analysis, we test the hypotheses.
Latent topic modeling
The latent Dirichlet allocation (LDA) technique is a latent topic modeling approach that uses a Bayesian learning algorithm to capture the underlying dimensions in a set of documents (Blei, Andrew, and Michael 2003). The topic model assumes that latent dimensions (i.e., topics) are distributed over a vocabulary of words that people use in descriptions (Tirunillai and Tellis 2014). In addition, the LDA algorithm adjusts the relative importance of topics in documents and words in topics iteratively. The words in each document get independently extracted from different “boxes,” each containing some set of words. Topics generally are shared among documents, and every document features its own mixture of topics. According to LDA, the dimensionality k of the Dirichlet distribution, or the number of topics to be extracted, is known and fixed. Researchers can predefine the number of topics to extract (K).
Recent tourism research has used LDA to extract dimensions from online reviews (Guo, Barnes, and Jia 2017). We follow this line, for two main reasons. First, LDA can analyze large-scale data. Second, it calculates the frequency of occurrence of each extracted dimension per document, which facilitates the validation of the results. Therefore, for this study, we assume that N is the sequence of words that constitutes a self-presentation, referred to as a document. The set of documents (i.e., corpus) contains M self-presentations.
Guo, Barnes, and Jia (2017) provide a detailed explanation of the hierarchical topic model process, which we also illustrate in Figure 1. The Wij circle represents observable variables (i.e., words in self-presentations). Circles Zij and θi refer to latent variables, such that Zij is the topic for the j-th word in document i, and θi represents the topic distribution per document i. The inner circle shows the repeated choice of words and topics within a document; the outer one refers to documents. In addition, ϕzij represents the word distribution per topic K. The boxes are the replications. Thus LDA entails the following generative process for each document in a corpus:
Choose N ∼ Poisson(ξ).
Choose θ ∼ Dir(α).
For each of the N words wn: (a) Choose a topic zn ∼ Multinomial(θ). (b) Choose a word wn from p(wn |zn,β), a multinomial probability conditioned on the topic zn.
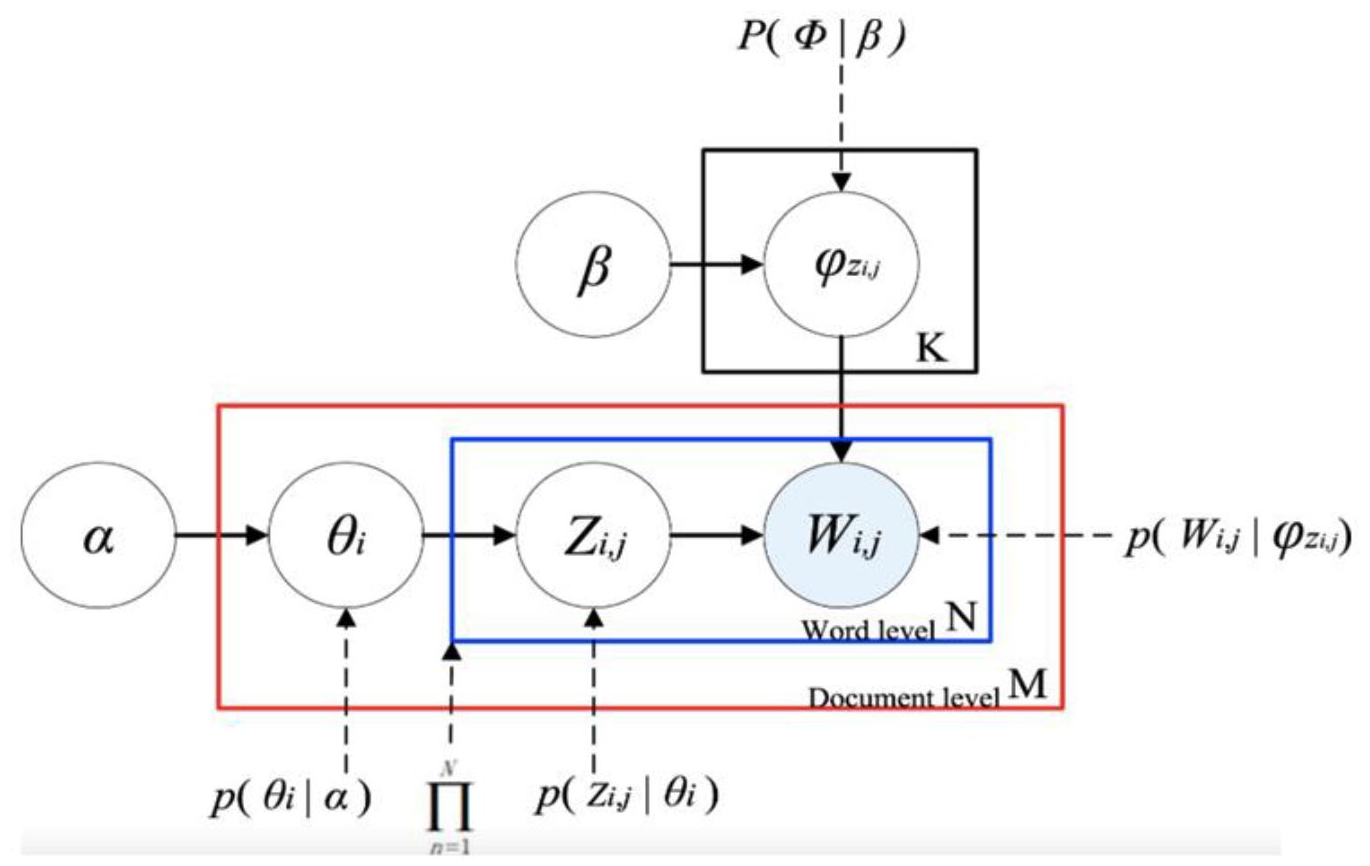
Latent Dirichlet allocation (LDA) model (Guo, Barnes, and Jia 2017).
In this process, z and θ refer to latent variables, N is the length of documents, and α and β are hyper-parameters at the corpus level inferred using Gibbs sampling methods (Griffiths and Steyvers 2004).
To conduct the LDA analysis, we used the packages “tm,” “SnowballC,” and “topicmodels” of the R statistical software. The first step consists of eliminating non-English words, tokenization, word stemming, and stopwords. Next, the algorithm extracts the K dimensions and allocates words to topics iteratively.
Multiple regression analysis
After LDA identifies the emerging topics, we use multiple regression analysis to measure the effect of these topics on hosts’ revenues. The dependent variable is hosts’ revenues (over the previous 12 months). Five independent variables, one per topic, come from the LDA (Ti, where i = 1, . . ., k) and represent the degree in which each self-presentation relates to each topic in its content. That is, Ti reflects the proportion of the content that relates to topic i. LDA assumes that
Finally, to test the effect of self-presentation length on revenues, the analysis includes the number of words (NoW) as another independent variable. To account for the effect of the listing characteristics, we include several control variables in the regression too.
Results
Table 1 presents the descriptive statistics of the listings. AirDNA (2017) uses US dollars to record prices and performance in both countries. The annual revenue is around $8,334, with values ranging from $23 to more than $120,000. The overall average rating is 4.75, and listings earn an average of 34 guest reviews. On average, hosts show 14 pictures of the accommodation and include a self-presentation with 82 words. Finally, 26.6% of hosts have earned “Superhost” status, meaning that they receive five stars in at least 80% of their reviews.
Descriptive Statistics.

Notes: In the case of dummy variables, the average value corresponds to the percentage of listings in the sample with that specific characteristic.
LDA Analysis
With the preliminary analysis of the data, we predefine the number of topics to extract (k parameter), by setting the k parameter to different levels (k = 1, . . ., 10). Low k values (i.e., k = 1, . . ., 3) result in broad classifications of the content; high k values (k = 7, . . ., 10) result in very narrow topics. Three judges independently examined the results of the 4-, 5-, and 6-topic solutions and agreed that the 5-topic solution was the most consistent. Thus, Table 2 presents the results of the LDA analysis for the 5-topic solution, including the 10 most frequent words per topic. In some cases, a word is truncated, such that it represents a group of terms with the same root.
Categorization of Topics by Semantics.
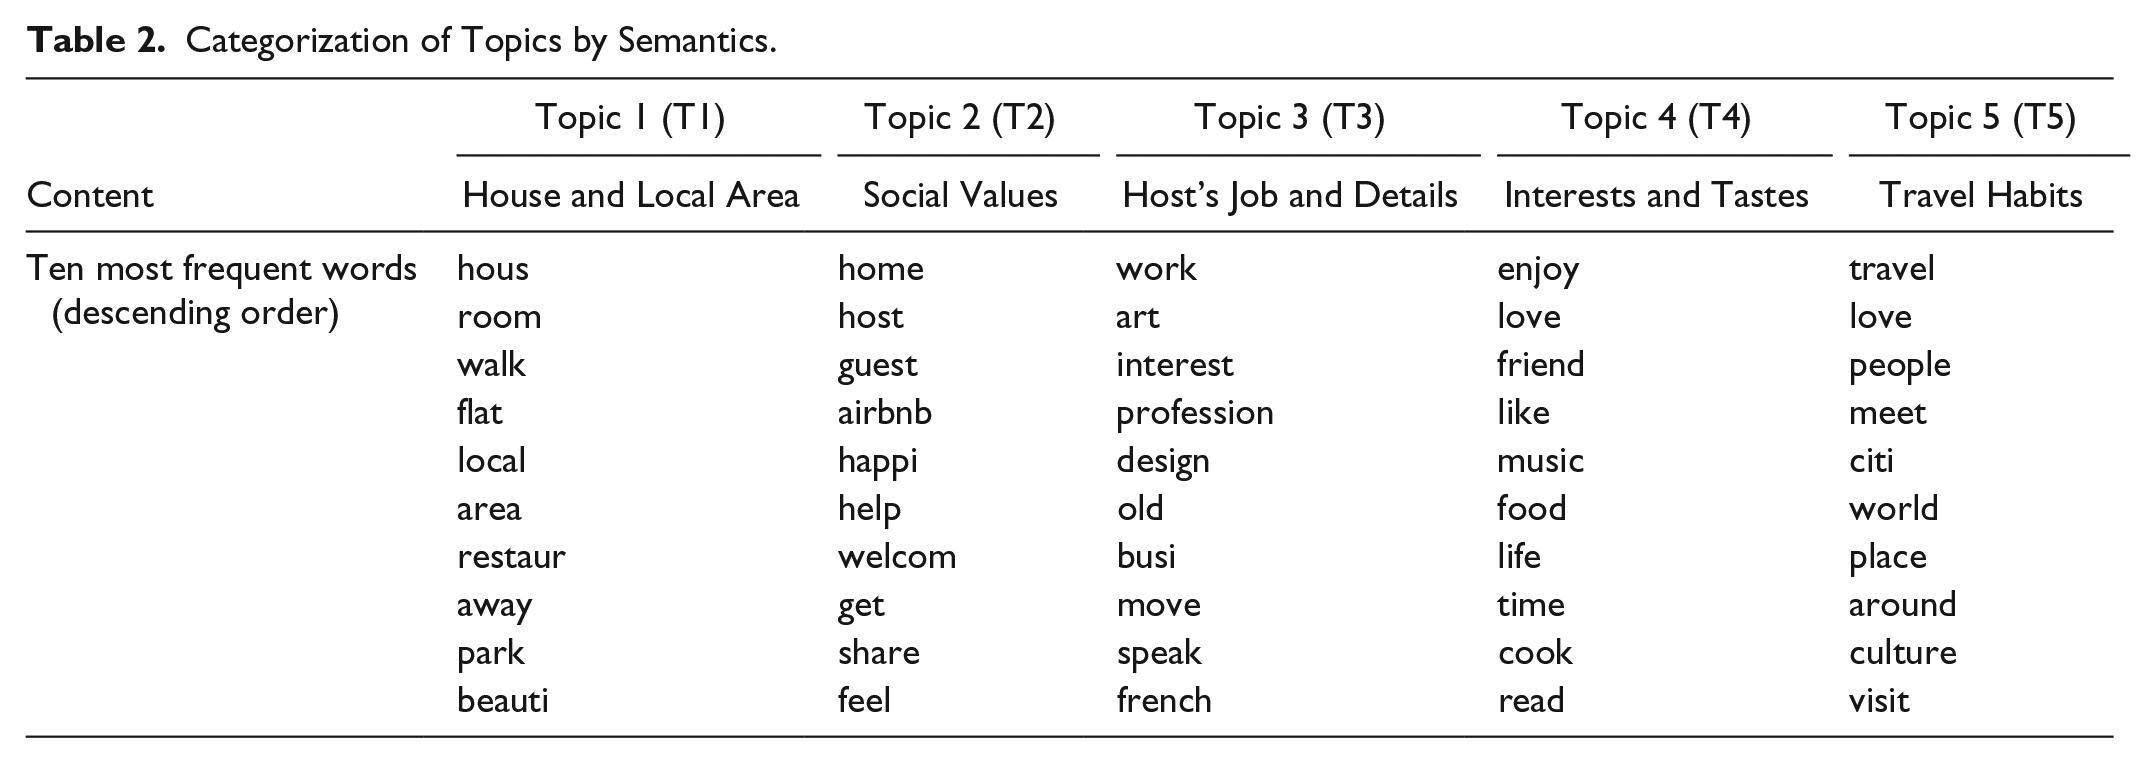
The final topic classifications are “House and local area,” “Social values,” “Host’s job and details,” “Interests and tastes,” and “Travel habits,” which align with previous research. For example, we compare these emerging topics with the dimensions extracted by Ma et al. (2017), who coded the sentences in Airbnb profiles to estimate the relationship between self-disclosure and perceived trustworthiness. For their coding scheme, Ma et al. (2017) began with topics that the Airbnb interface suggests hosts should use. Using qualitative data analysis software and annotators from Amazon Mechanical Turk to validate their results, they identify the following topics: “Interests and tastes,” “Life motto and values,” “Work and education,” “Relationships,” “Personality,” “Origin or residence,” “Travel,” and “Hospitality.” These results match our LDA dimensions well.
To check the ecological validity of the findings, we selected a random sample of 50 self-descriptions. Three judges independently analyzed their content to identify the most salient topic in each self-presentation. Their results were consistent, reaching agreement about the predominant topic in 81% of the self-descriptions. Next, we compared their results with the output of the LDA analysis, which revealed the topic with highest percentage of occurrence in each self-presentation. The judges’ solutions matched the LDA output for more than 90% of the self-presentations.
Regression Analysis
Table 3 contains the results of the regression analysis. The effect of “Social values” (T2) on hosts’ revenues is positive (p < .01); when self-presentation content focuses on the experience’s social aspect, revenues are higher. This topic refers to social values on the Airbnb platform and includes words that represent interactions or a sense of community, such as “welcome,” “share,” and “home.” Conversely, the effect of “Interest and tastes” (T4) on revenues is negative. The other topics do not have significant effects on hosts’ revenues (T1, T3, and T5). These results offer support for hypothesis 1. A self-presentation that evokes social aspects of the experience (i.e., interaction with guests, sharing community) leads to higher revenues.
Multiple Regression Analysis.

Note: Std. coef. = standardized coefficient.
p < .05; ***p < .01.
We also find a positive effect of the number of words (i.e., self-description length) on hosts’ revenues, in support of hypothesis 2. As illustrated in Figure 2, this effect is significant and quadratic, following an inverted U-shaped function. As the number of words increases, hosts’ revenues increase up to a point (i.e., number of words = 424). Beyond this threshold, revenues start decreasing. Table 4 shows that these results hold when we include the entire set of topics in one single regression (excluding T1, to avoid linear dependency among the regressors).

Effect of self-presentation length on revenues.
Additional Regression Analysis.
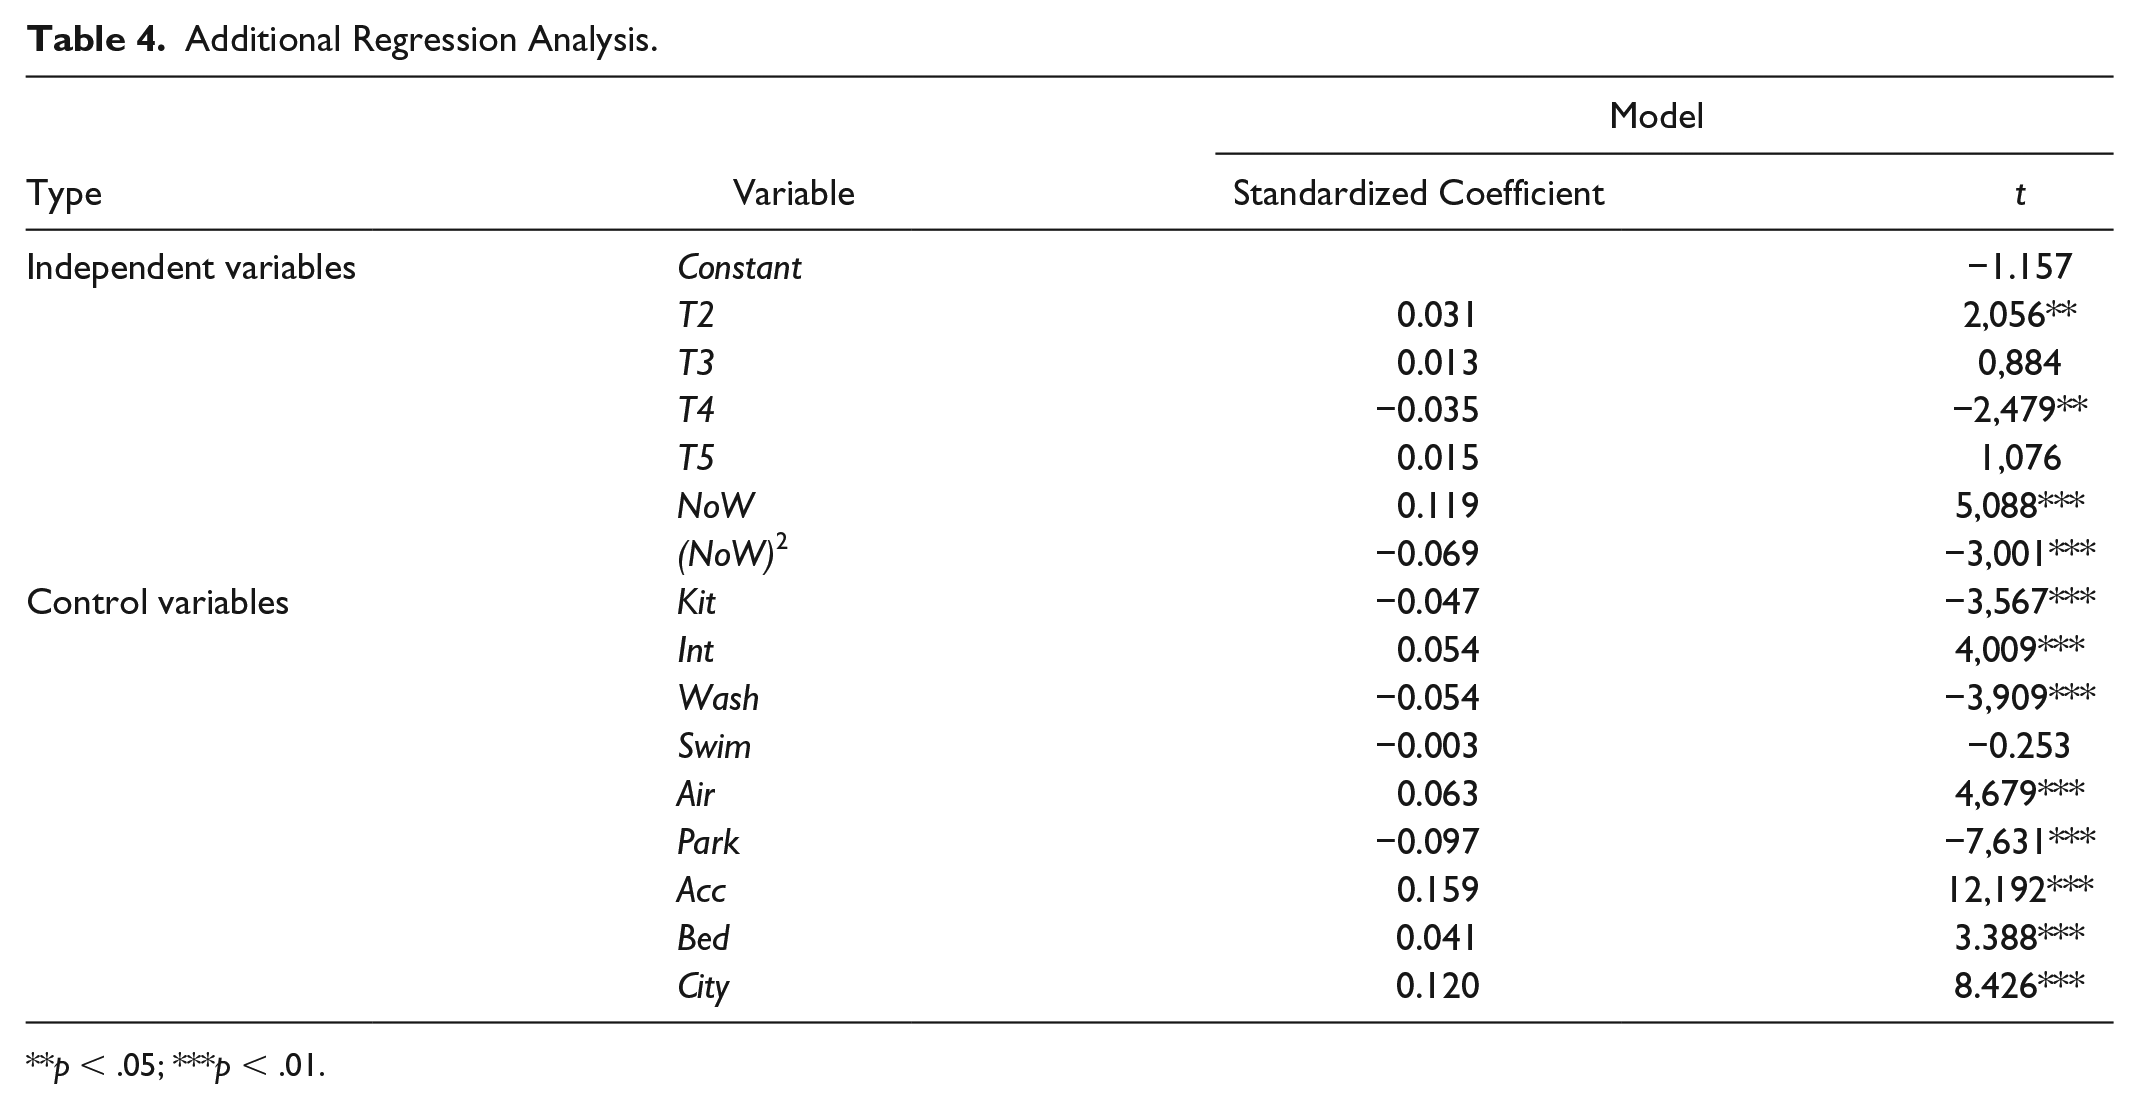
p < .05; ***p < .01.
Discussion
A self-presentation strategy that reduces social distance positively affects sellers’ revenues. Enhancing expectations about the host–guest relationship helps create a social bond between the guest and host prior to the experience. A self-presentation focused on the host’s personal interests instead has a negative effect on revenues. On the one hand, this finding may stem from the lack of social closeness that potential guests perceive from such a self-presentation. Stressing specific personal hobbies or tastes may signal a self-centered or individualistic approach to the sharing activity. On the other hand, disclosing information about the host’s own interests and tastes could reveal a mismatch with guests’ preferences. Although possible, an exact match of the host’s and guest’s interests is unlikely, especially if hosts embrace niche activities.
Our findings also reveal an inverse U-shaped effect of self-presentation length on revenues; providing more information increases sellers’ revenues up to a point, but then the effect of the number of words on revenues becomes negative. That is, there is an optimal threshold length for self-presentations, so that hosts achieve the highest revenues when their self-descriptions are about 424 words in length. After this point, longer self-descriptions lead to decreasing returns. As proposed in previous studies (e.g., Messner and Wänke 2011; Sicilia and Ruiz 2010), providing consumers with too much information results in suboptimal decision-making processes, in line with both information overload (Lurie 2004; Messner and Wänke 2011) and cognitive effort (Garbarino and Edell 1997) theories. On Airbnb, an alternative that requires more cognitive effort will be chosen less frequently than an alternative that is easier to evaluate.
Theoretical and Practical Implications
This article contributes to extant theory in at least three ways. First, noting the existence of different self-presentation patterns in peer-to-peer marketplaces (Tussyadiah and Park 2018), we posited that self-presentation strategies affect sellers’ revenues, such that a social-oriented self-presentation can boost revenues. This finding adds support to the growing body of research that stresses social values’ key role in peer-to-peer trading (Lutz and Newlands 2018; Tussyadiah and Pesonen 2016; Zhang, Gu, and Jahromi 2019). Self-presentation length also affects revenues, following an inverted U-shape that reaches its peak at 424 words. This result provides measurable evidence for lingering questions about the effects of information overload (Lee and Lee 2004; Lu, Gursoy, and Lu 2016; Messner and Wänke 2011).
Second, this study contributes to CLT literature (Trope and Liberman 2010). Our findings suggest that including content that enhances social closeness in self-presentations is a good strategy to reduce psychological distance between the seller and consumer. They thus provide additional support to studies that emphasize social distance as an underlying mechanism of sharing behavior (Schreiner and Kenning 2016). This study also responds to calls for research that applies decision-making perspectives to peer-to-peer interactions (Yadav and Pavlou 2014).
Third, analyzing self-presentations by extracting online discourses through latent topic modeling represents another unique contribution of this research. Previous studies focus on quantitative variables such as online ratings or the presence of specific attributes; research on sellers’ self-presentations is scant though (Tussyadiah and Park 2018).
From a managerial perspective, self-presentations offer a powerful instrument to promote peer-to-peer accommodations, a finding that is particularly relevant for ordinary hosts who have limited resources to promote their services (Blazevic et al. 2013). Self-presentations can be a powerful personal branding tool (Kim and Tussyadiah 2013; Labrecque, Markos, and Milne 2011), and with this study, we offer two clear implications for hosts. First, they should include social values content in their self-presentation to maximize revenues. Their self-presentations should reveal details about their expected interactions with their guests and emphasize their ability to provide meaningful experiences, such as signaling their willingness to interact with and support them (e.g., offering a nice welcoming experience, involving them in the community). With a social-oriented self-presentation, hosts can enrich the social bond with potential guests, create memorable experiences (Kim and Chen 2018), and boost their revenues. This recommendation extends broadly to other peer-to-peer platforms that involve interactions of seller and consumer, like car- and meal-sharing sites.
Second, this research provides actionable levers regarding the optimal length of the self-presentation. Empirically, our data indicate an optimal length of 424 words. For hosts, this level of detail seems sufficient to establish a sense of social bonding with guests. A longer self-presentation would backfire in terms of revenue maximization. Accordingly, online platforms might establish constrained spaces to assist sellers.
The findings also have implications for traditional hospitality operators. Hotels are reacting relatively slowly to the disruptive effects of peer-to-peer trading. In view of the social motivations that prompt consumers to use peer-to-peer accommodations, they might benefit from targeting social-oriented consumers and offering experiences that focus on human connections. Encoding more social and personal elements seems a likely future development for the traditional hospitality industry (Tassiello, Viglia, and Mattila 2018); recent hotel campaigns already have started emphasizing these social values (e.g., Marriott 2017).
Limitations and Further Research
The present research is not without limitations. First, analyzing the content of self-presentations with word analysis software might pose accuracy concerns regarding the allocation of terms to topics. Although the LDA technique has been used successfully in prior tourism research (Guo, Barnes, and Jia 2017), it categorizes content without human input. Second, a qualitative approach to explore the storytelling elements in self-presentations (e.g., Pera, Viglia, and Furlan 2016) could provide more fine-grained data pertaining to the structure plot of presentations and go beyond a mere analysis of content. Storytelling is central to a deeper understanding of consumer psychology (Bahl and Milne 2010; Dessart 2018; Escalas and Stern 2003). Third, our sample only spans two Western cities; it would be interesting to include destinations where hosts have different cultural backgrounds.
Several other aspects also remain to be investigated. Similarity theory (Naylor, Lamberton, and Norton 2011) might provide another compelling framework to analyze how social distance is perceived differently at the individual level. Using this framework, an experimental approach could manipulate hosts’ presentation and then measure individual travelers’ choices. Furthermore, this research focuses on the role of self-presentation strategies on income generation, in accordance with the increasing attention to revenue maximization in the sharing economy (Abrate and Viglia, 2019). However, we acknowledge that a strong similarity between host and guest might increase transaction likelihood (Kwok and Xie 2018). On this note, a host that focuses on a better fit with a guest might decide to accept very few bookings. Future research might use the fit between the guest and host as an alternative dependent variable.
Airbnb has recently implemented a new feature that enables users to present their profiles in a video format. Visual information magnifies social presence online (Xu 2014), so additional research might investigate the revenue effects of multimedia self-presentations. An extension of this analysis could include a comparison of the self-presentation patterns on other hospitality platforms (e.g., HomeAway, Booking.com, Tripadvisor.com).
Conclusion
The emergence of peer-to-peer platforms has transformed the nature of transactions (Figueiredo and Scaraboto 2016; Sigala 2017). The resulting marketplaces focus on access-based consumption and challenge the dominance of ownership and possessions as the ultimate goals of consumption (Bardhi and Eckhardt 2017). This new paradigm has significantly affected the tourism and hospitality industry, which has thus undergone a unique transformation. These marketplaces have empowered individual users who can market their own products. Increasing their marketing literacy is a key agenda issue (Benoit et al. 2017; Sundararajan 2014). Despite initial research emphasizing the relevance of strategically managing information (Caldieraro et al. 2018), clear guidance for sellers is scant.
Our findings address this gap by specifying the revenue impact of different self-presentation strategies in peer-to-peer platforms. Social values are key dimensions of the customer value proposition, as predicted by Zhang, Gu, and Jahromi (2019). We provide evidence that to boost the human bond with potential guests, hosts’ self-presentations should focus on the social aspect of their relationship. Because social interactions contribute to creating memorable travel experiences (Kim and Chen 2018), emphasizing hosts’ willingness to interact with guests can positively affect their revenues.
Footnotes
Declaration of Conflicting Interests
The author(s) declared no potential conflicts of interest with respect to the research, authorship, and/or publication of this article.
Funding
The author(s) disclosed receipt of the following financial support for the research, authorship, and/or publication of this article: The authors acknowledge the financial support received from the Ministerio de Ciencia, Innovación y Universidades, Spain (ref. ECO2017-82107-R).
