
Abstract
Long-haul tourist arrivals depend on the airline market, its size, and the degree of competition. This article studies the entry and exit of full service carriers (FSCs), charter carriers (CCs) and low-cost carriers (LCCs) from two origins: the United Kingdom and Germany, and five sun-and-beach destinations in Spain. The relationship among all types of airlines is captured with a trivariate structural time series model to disentangle the airlines’ responses under common shocks of airlines’ entry and/or exit and provides estimates of immediate responses and indicators of responses over time. The results show that in the British market, the entry of LCCs has crowded out FSCs and CCs. However, in the German market, the results are heterogeneous and overall do not support the existence of such crowding out effect.
Introduction
At the end of the twentieth century, air market liberalization and the advent of the Internet transformed the international tourism market. Before that, the international air market was mainly run by flagship airlines, mostly owned by the public sector. International flights connected the main capital cities, and stopovers were necessary to fly regionally. Such traditional full-service carriers (FSCs) are based on hub–spoke networks that offer high frequencies to and from the hub airport. Thus, FSCs can offer connected flights among the different nodes of the network and are characterized by geographical concentration around the hub, which boosts the number of passengers flying with stopovers (Pels 2008). Nowadays, most FSCs belong to an airline alliance, which allows for passenger and baggage transfers among the flights of all its members. FSC flights usually offer frills such as food, beverages, and cabin classes, which requires a system of different fares driven by revenue management. These carriers have a diversified fleet of airlines to cater to the characteristics of each route.
Charter carriers (CCs) were created because some tourism destinations were located far from capital cities, and the travel time and cost to reach them were too high for tourists. These flights were characterized by nonscheduled flights. Pels (2008) referred to charter flights as “the original low cost carriers,” with a high seasonality component and a lower cost than the traditional legacy carriers. Together with charter flights, tourists were provided with bundled services such as accommodations, meals, transportation, and excursions. Most of the market power was held by travel agencies, the main distribution channel at the origin. There was also a high degree of vertical integration among the charter airlines and tour operators (e.g., Lobbenberg 1995; Williams 2001; or Parton and Ryley 2012). This integration responds to the essential driver of cost-efficiency because of the intense competition among the big tour operators. This phenomenon has resulted in a charter market that has a low profit margin and is susceptible to downturns in demand, especially for smaller airlines (Parton and Ryley 2012). Modern CCs regularly fly leisure routes to achieve economies of density.
Air transportation liberalization in Europe began in the 1970s. However, the liberalization started progressively, with the first package of policies in December 1987, and a second package in 1990, which allowed the designation of new airlines but maintained capacity restrictions and bilateral agreements. The key measures were implemented with the approval of a third package in 1993, for example, the freedom to set airfares according to commercial criteria (see Morrell 1998, for details). In 1997, the so-called seventh, eighth, and ninth freedoms were implemented, and European airlines were allowed to operate without restriction among European Union (EU) air routes. These freedoms allowed low-cost carriers (LCCs) to enter the European international air market.
The origins of LCCs are associated with the so-called Southwest model (Doganis 2006, p. 157), that is, are airlines that use a point-to-point network characterized by direct flights that connect mainly secondary or regional airports. Frequency varies by route, but a low frequency is common. LCCs offer no transfers, a single cabin class with no frills, ticketless travel, and direct sales on the airline’s website. Additionally, LCCs use a single aircraft model to reduce the maintenance cost, for example, Southwest employs the same type of aircraft (Boing 737), with high utilization per day (approximately 11 hours) and 15–20 minutes turn-rounds.
In Europe, the entrance of LCCs connected regional destinations of different countries, which affected travel time and cost. LCCs also used the Internet as their main distribution channel, decreasing costs by eliminating the profit of travel agencies. Similarly, most accommodation companies also offered direct online booking, and today, Internet portals offer direct booking rooms in hotels, apartments, or private houses, with peer-to-peer services. Such portals facilitated the flow of information, namely, location, price, and quality. Moreover, customers could post reviews to help other tourists make better-informed decisions. Hence, compared with the traditional packaged holidays, Internet bookings allowed tourists additional freedom to customize their trips, for example, destination, accommodation, and services.
The entrance of LCCs affected the market; thus, an inquiry to understand the types of economic impacts on destinations is worthwhile. Such economic impact can be measured by considering the variations in the number of arrivals, expenditures, and the lengths of stay of new LCC passengers compared with the previous situation. A precise response to this issue is necessary to evaluate its impact and to consider policies that facilitate the entry of LCCs. For instance, in some Italian airports, some LCCs have received discounts on landing and terminal charges, revenue-guarantee schemes, and co-marketing agreements (Laurino and Beria 2014). In other destinations such as Cyprus, stakeholders agree that LCC subsidization may be necessary (Farmaki and Papatheodorou 2015).
Nevertheless, LCC entry may crowd out incumbent CCs or FSCs. Such redistribution has relevant consequences for tourism destinations. The FSC network contributes with arrivals from farther nodes in the network, which are difficult to cover by LCC routes. Moreover, CCs provide bundling services that can also influence certain tourists. Moreover, tourists’ profiles differ. For instance, Eugenio-Martin and Inchausti-Sintes (2016) show that LCC travelers usually save money at the origin (i.e., cheaper transportation) but spend part of that savings at the destination. The literature has studied net impacts of LCC entry but it has not sufficiently contemplated the redistribution among FSCs, CCs, and LCCs. The purpose of this article is to fill that gap in the literature. More precisely, this article tests the following hypotheses:
Hypothesis 1: Low-cost carriers entry crowded out full service carriers in a tourism destination.
Hypothesis 2: Low-cost carriers entry crowded out charter carriers in a tourism destination.
We employ a trivariate structural time series with interventions for the key entry and exit of airlines. This methodology has several advantages, such as its ability to manage structural breaks, cointegration, and simultaneity analysis of the series. Additionally, the series do not need to be stationary, and the intervention analyses are not based on simple dummies on the series but on the unobserved components, especially on the irregular, level, and/or slope components.
This article makes several contributions to the literature: (1) It disentangles the market into LCCs, CCs, and FSCs to understand the impact of LCC entry in terms of the passenger redistribution among them; (2) it estimates the three series over time simultaneously so that their errors are seemingly unrelated and their correlations can be considered; (3) it estimates the impacts on each series after key entry and/or exit events; and (4) it estimates the level error component of the series, which is a net of seasonal and irregular components, to obtain the correlations among the types of airlines and to illustrate the degree of crowding out effects if any. Hence, the article provides two main results, it estimates immediate shocks to the series after entry/exit events, and it estimates level correlations that can be used as indicators of the degree of crowding out effects over time if any.
Literature Review
Economic Impact
The literature has demonstrated mixed results in terms of LCC entry impacts. Obviously, the market structure of each destination differs and determines such results (Moreno-Izquierdo, Ramón-Rodríguez and Perles-Ribes 2016). However, most articles have shown that LCC entry has a positive impact on international arrivals (Graham and Dennis 2010; Rey, Myro, and Galera 2011; Chung and Whang 2011; Alsumairi and Tsui 2017; Boonekamp, Zuidberg, and Burghouwt 2018; Bilotkach et al. 2019) and domestic arrivals (Pulina and Cortés-Jiménez 2010; Tsui 2017). LCCs have been observed to mimic the seasonal pattern of incumbent air companies; thus, seasonality remains similar (Graham and Dennis 2010; Chung and Whang 2011). Concerning the length of stay, Ferrer-Rosell, Martínez-García, and Coenders (2014) show that LCC or FSC passengers’ stay is usually shorter than CC passengers. Finally, for expenditure, LCC passengers’ expenditure at the origin is lower than FSCs or CCs, but their expenditure at the destination is usually higher (Eugenio-Martin and Inchausti-Sintes 2016). Similarly, Ferrer-Rosell, Coenders, and Martínez-García (2015) also find that lower- and mid-income tourists traveling with LCCs have a different expenditure pattern than tourists traveling with FSCs; namely, former tourists spend (in relative terms) more at the destination and on discretionary expenditure. However, Ferrer-Rosell and Coenders (2017) show that differences between expenditures are decreasing and that both expenditure profiles are converging over time. Pratt and Schuckert (2019) conduct a comprehensive study that calculates the direct and indirect effects of LCC entry by using input–output analysis.
Market Impact
Passengers’ airline choice is based on the fares, service quality, schedule, and airports involved (Correia, Pimpão, and Tão 2012), and the advent of the Internet has provided passengers with real-time information on these factors. LCC entry has been based on low fares strategies. Overall, Rosselló and Riera (2012) show that the advent of Internet channels decreased tourist package prices in Majorca. Fageda et al. (2017) show that in Spanish routes where an LCC replaced an incumbent FSC, the fares decrease significantly. Such a decrease also occurs when the LCC entrance occurs partially. Indeed, Moreno-Izquierdo, Ramón-Rodríguez, and Perles-Ribes (2016) show that the degree of LCCs’ low fares depends, as expected, on their market power in the route. Thus, LCC entry has provoked a heterogeneous impact on the market. For instance, Abrate et al. (2016) show that for the Milan–Rome route, LCC fares react to FSCs and high-speed trains. However, economy tickets of FSCs vary similarly to LCCs, whereas business class tickets and high-speed trains are independent. Similar to FSCs, LCC fares are driven by revenue management. Alderighi, Nicolini, and Piga (2015) demonstrate that Ryanair dynamic pricing depends on seat availability and the remaining time to departure. Their conclusion is that an LCC fares series is U-shaped with respect to the remaining time of departure. Nevertheless, Bilotkach, Gaggero, and Piga (2015) demonstrate that in markets with a high presence of leisure traffic (holidays and VFR) on the route, the revenue management interventions are less sensitive.
Understanding Airlines Entry Decisions
Initially, the literature modeled the entry of airlines with oligopolistic models. For instance, Reiss and Spiller (1989) develop an airline entry model à la Cournot and à la Bertrand. However, they recognize empirical difficulties due to endogeneity, unobservable costs, and heterogeneity among airline markets. Berry (1992) investigates heterogeneous potential entrants, but still within a static city–pair market. Ciliberto and Tamer (2009) extend the heterogeneous approach by considering the role of networks in entry decisions. Moreover, they distinguish between FSCs and LCCs, provide a comprehensive set of entry determinants, demonstrate that the current number of firms deters entry, and are distinguished by airline; thus, deterrence capacity can vary among them. Other key determinants include market size (with population as a proxy), income per capita, income growth, presence of close airports, costs (with distance to origins as a proxy), location, and number of airline markets. Nevertheless, they point out that dynamic models that can capture long-run relationships are necessary.
Finally, Aguirregabiria and Ho (2010, 2012) develop dynamic games of network competition and estimate the decisions disentangling demand, cost, and strategic factors. They state that “airlines with a small number of connections in an airport must pay a large sunk entry cost to operate an additional route, airlines with many connections should pay negligible entry costs for that additional route.” They also find evidence that hub-and-spoke networks can deter entry of competitors in spoke markets.
Crowding Out Effects
The entry literature has demonstrated that the dynamics of the supply do not need to be smooth with entries and exits of airlines. It motivates our article to understand how sensitive incumbent demand is under such dynamics. Indeed, the strategic behavior of the airlines differs concerning entry deterrence. For instance, FSCs may expand their capacity to deter entrance (Ethiraj and Zhou 2019), whereas LCCs may decrease fares but do not expand capacity. Moreover, under new entries, the incumbents may show some resilience to shrink the supply or they may exit. The reactions may be delayed, or they may be anticipated and result in exit straight away.
The research inquiry of this article relies on the crowding out effects of LCC entry. Rodríguez and O’Connell (2018) show that despite deregulation, the relevance of package tours have remained stable (approximately 40%) in the outbound British market. However, Castillo-Manzano et al. (2017) show a smooth decline of CC market share over time for the outbound Spanish market. A similar decrease is found for some outbound Taiwanese routes (Wu and Hayashi 2014). Obviously, the nature of the market is different, and each case study demonstrates different results, depending on the determinants and degree of LCC entry (Wang et al. 2017) and exit (de Wit and Zuidberg 2012, 2016).
Beyond descriptive analysis, causality models may provide insights into the relationship between the types of airlines. Khan, Kim, and Kim (2018) propose a predatory–prey model for the South Korean market, where on the one hand, LCC variations over time depend on a nonlinear trend and FSC time series, and on the other hand, inversely, FSC variations over time depend on a nonlinear trend and LCC time series. The results of this model and SARIMA alternative specification show a positive relationship between them. Nevertheless, they assume that both equations are independent, and cointegration is not considered.
Castillo-Manzano et al. (2017) employ dynamic linear transfer function analysis to understand Spanish outbound air travel market. They distinguish domestic, EU, and non-EU destinations. Similar to Khan, Kim, and Kim (2018), they assume two independent models: a model where an LCC depends on a CC time series, and a model where an LCC depends on an FSC time series. For the domestic and EU market, the results demonstrate a negative relationship between LCCs and CCs and a negative relationship between LCCs and FSCs. For the non-EU market, LCCs and FSCs demonstrate a positive relationship, whereas for LCCs and CCs, the result is not significant. The results make sense with the descriptive analysis, but running independent regressions and omitting relevant variables in the model specification may be problematic.
Our approach in this article is to manage the three types of airlines simultaneously, by employing a trivariate structural time series analysis. This method allows us to employ error correlation matrices among the three series to better understand their short-term and long-term relationships. Such a structure contemplates cointegration as the common level among the series. Moreover, interventions on the unobserved components can be added to the specification to estimate the impulses of airlines’ entries and exits. One of the purposes of the article is to understand the LCC entry phenomenon and its consequences for policymaking. Thus, tourism destinations can better understand the degree of support that LCC entry should receive. Such support may be provided in terms of discounts on landing and terminal charges, revenue-guarantee schemes, co-marketing agreements, or subsidization (Laurino and Beria 2014). This topic requires a wide analysis. Our article focuses on the crowding out effects of LCC entry and its consequences for tourism destinations in terms of arrivals. For this reason, an inbound perspective is required. The details of the case study are explained as follows.
Case Study
The case study comprises the air traffic between two origins: the United Kingdom and Germany and the main international airports of the Canary Islands (Spain). In 2017, according to the United Nations World Tourism Organization, Spain was the second-largest tourism destination in the world in arrivals (US$81.8 million) and receipts (US$68 billion). The Instituto Nacional de Estadística shows that the Canary Islands was the second-largest tourism destination in Spain in arrivals (14.2 million) during 2017. Finally, in 2018, AENA (Spanish airport operator) shows that the United Kingdom led in international air traffic to the Canary Islands with 37.7% of market share, followed by Germany with 22.7%. An advantage of working with isolated islands is that international tourists must arrive by air; thus, the accuracy of the tourism statistics is commensurate with the accuracy of air traffic documentation. Thus, we posit that the Canary Islands is a satisfactory laboratory for air traffic studies.
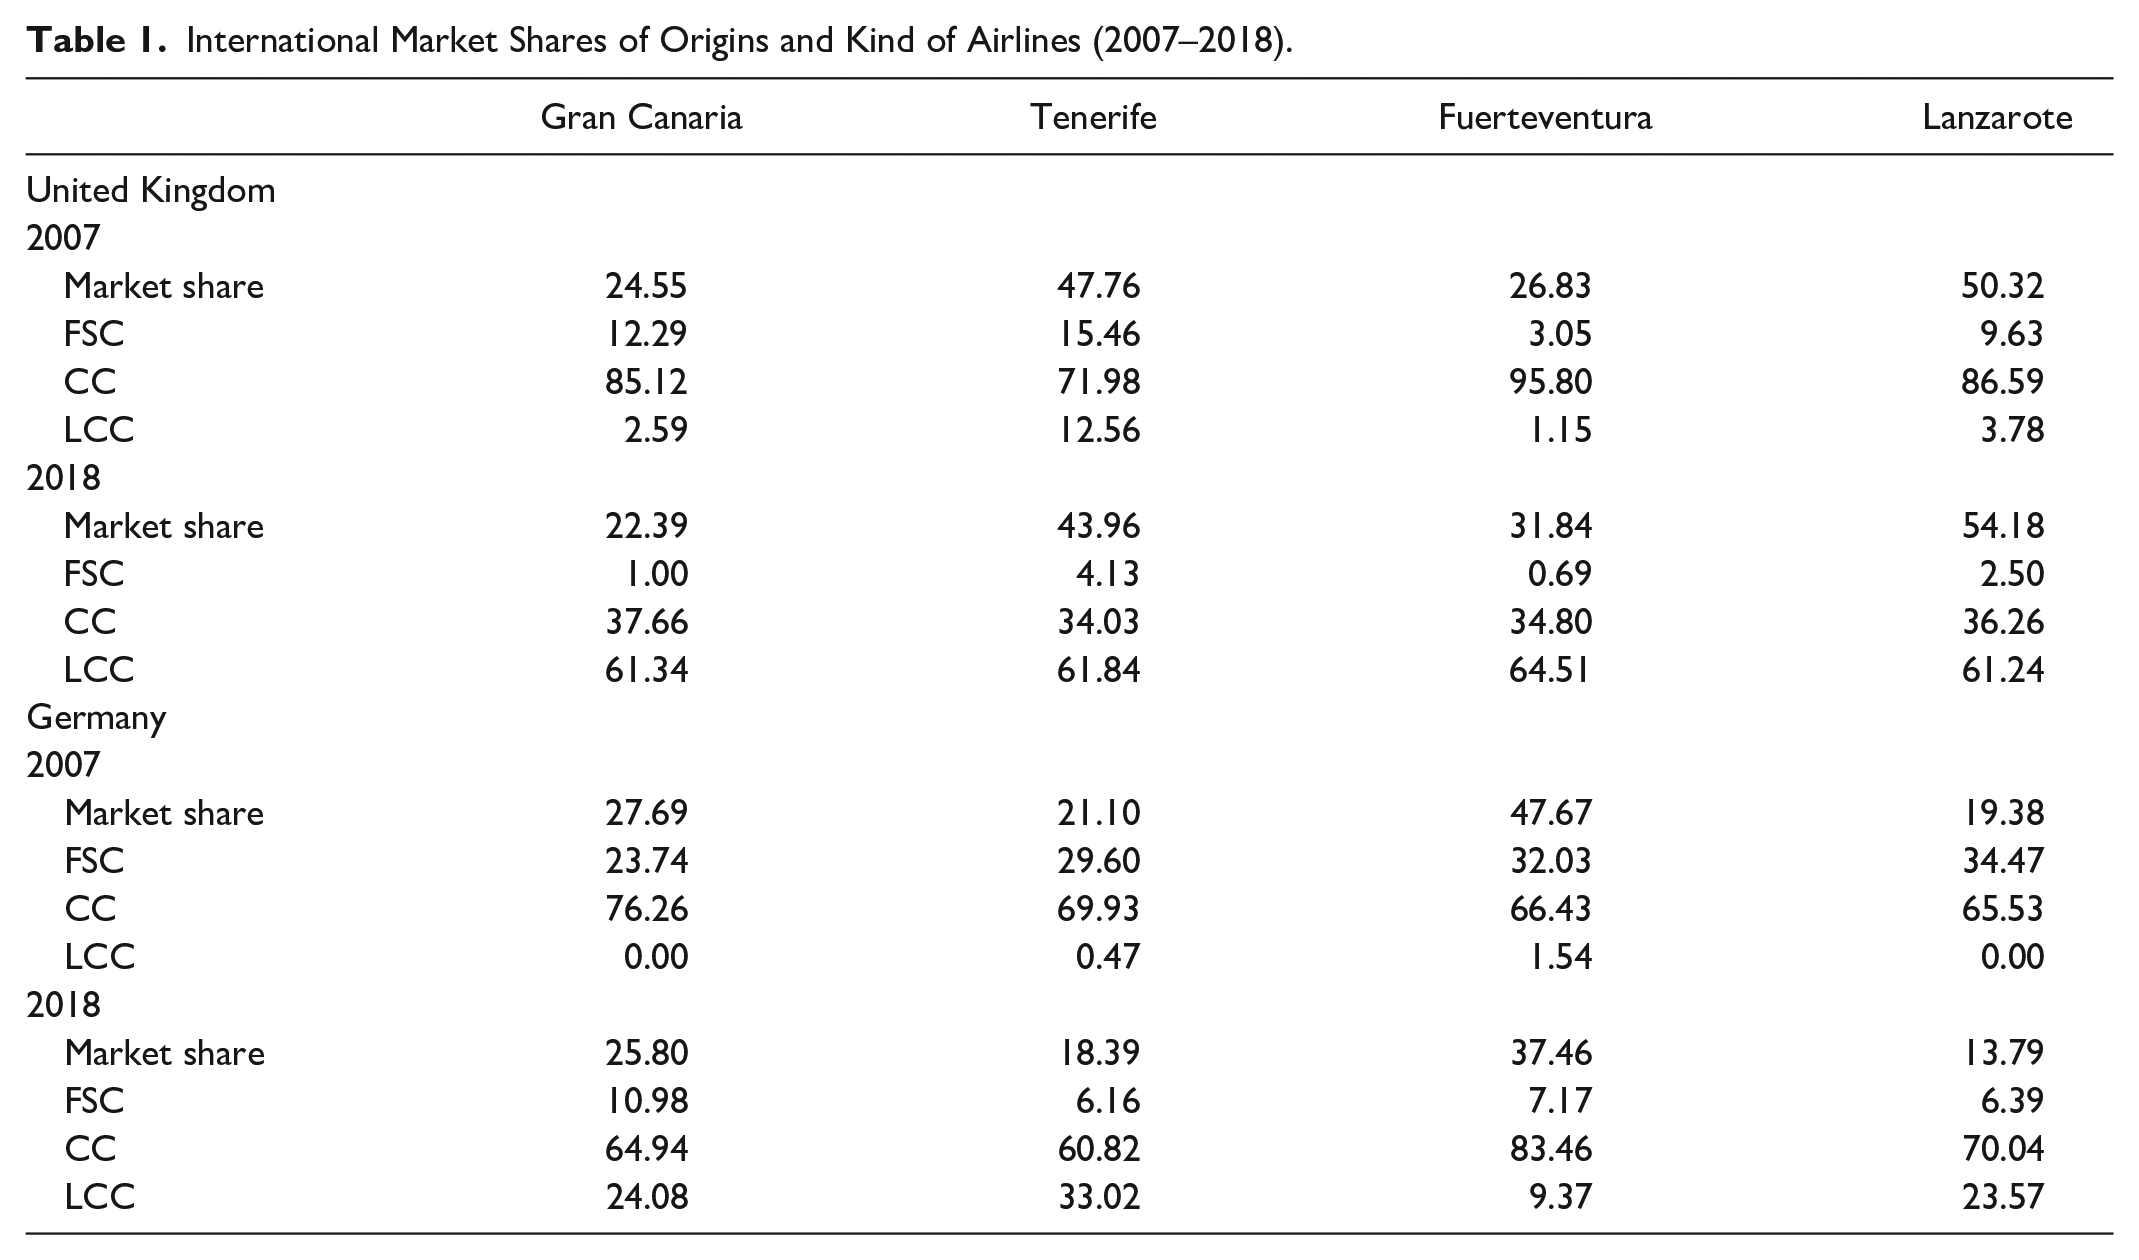
The United Kingdom is also a relevant outbound market because of its tradition of charter flights and a marked LCC entrance (O’Connell and Bouquet 2015; Martín and O’Connell 2018). Table 1 shows the relevance of the United Kingdom and Germany as origin market shares. The United Kingdom is the most relevant market for Tenerife (43.96%) and Lanzarote (54.18%), whereas Germany is the most relevant market for Gran Canaria (25.80%) and Fuerteventura (37.46%). Moreover, to double-check the robustness of the results, Malaga airport is also considered an additional destination located in mainland Spain. The market share details are shown in Table 1: comparative statics between 2007, when LCC entry was incipient, and 2018, when LCCs led the airlines’ British market share.
International Market Shares of Origins and Kind of Airlines (2007–2018).
The source of the data set is AENA, which provides monthly air traffic among international and domestic airports throughout Spain. We used a time series that starts in January 2004 and finishes in December 2018. To study the crowding out effects among airline types, proper identification and aggregation are required. Notably, the third package also removed the regulatory distinction between scheduled and charter airlines. Indeed, according to Budd et al. (2014), nowadays, FSCs have made a move towards LCC, creating a full-service subsidiary. Similarly, CCs have also made a move that creates diversified charter flights. LCCs are aggregated based on the ICAO’s (2017) definition of an LCC. CCs were identified according to AENA classification, based on nonscheduled companies. However, some CCs already operate scheduled flights; thus, they are also added to the group as long as they are companies with business models based on selling tourist packages. The complete list of airlines and their distribution among each group is shown in Table 2.
List of Airlines (2004–2018).

Before LCC Entry
The first tourists that arrived to the Canary Islands traveled by ships during the nineteenth century. However, the great impulse to the tourism industry occurred after the entry of charter airlines at the end of the 1950s (Dominguez 2008). According to Hernández et al. (2011), in 1952, an SAS airplane landed in Tenerife North as the first charter flight on the archipelago. In 1957, 15 charter airlines were already operating in Gran Canaria and/or Tenerife, where most of them were from the United Kingdom (Overseas, Starways, Transair Ltd., Tradair Ltd., Eagle Aviation, Continental, Derby Aviation, Orion, and Hunting Clan were the first charter airlines operating the route). In the early days, technical limitations only allowed for small airplanes with several stopovers. In 1962, the Gran Canaria airport runway was widened to allow larger airplanes to land and obtained the international airport mention (Jorge 1996). In 1967, Los Rodeos airport runway was also widened in Tenerife to allow larger jets to land for direct connections and boosting the mass tourism in the Canary Islands. According to Hernández et al. (2011), between 1955 and 1960, the number of arrivals increased from 39,500 to 69,000, reaching in 1970 the figure of 821,000 tourists and 2,521,500 by the year 1981.
During the 1980s and 1990s, as Sinclair and Dieke (1992) indicate, “overseas tour operators’ ability to negotiate low prices for hotel rooms is not dependent on their ownership of hotels, but on their powerful bargaining position vis-à-vis individual hoteliers.” Sinclair and Dieke illustrate the case of Kenya, but such oligopsony was commonplace in many tourism destinations, and the Canary Islands is no exception.
After LCC Entry
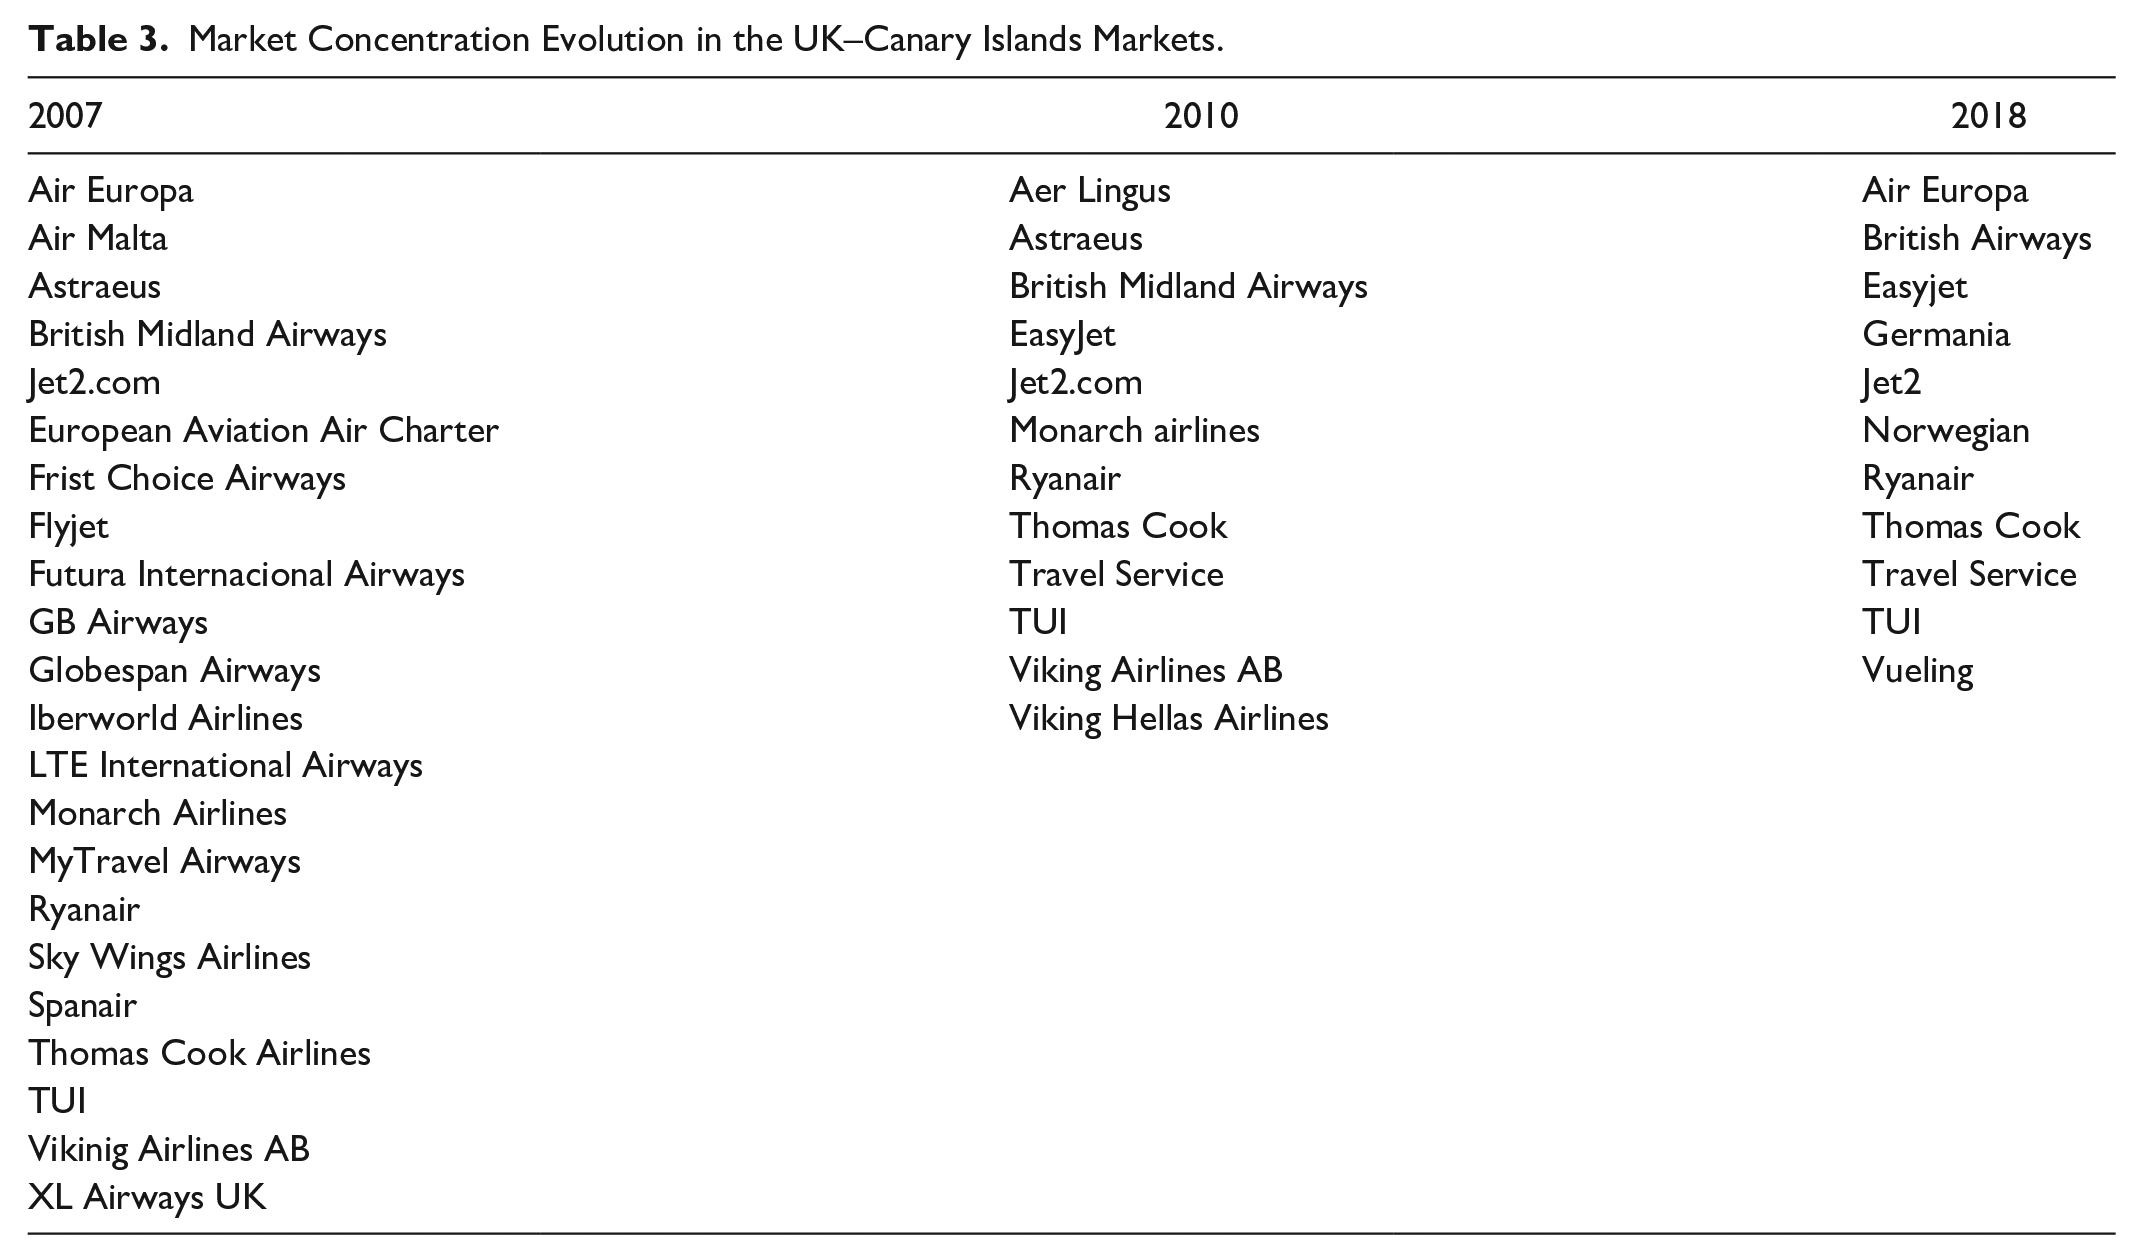
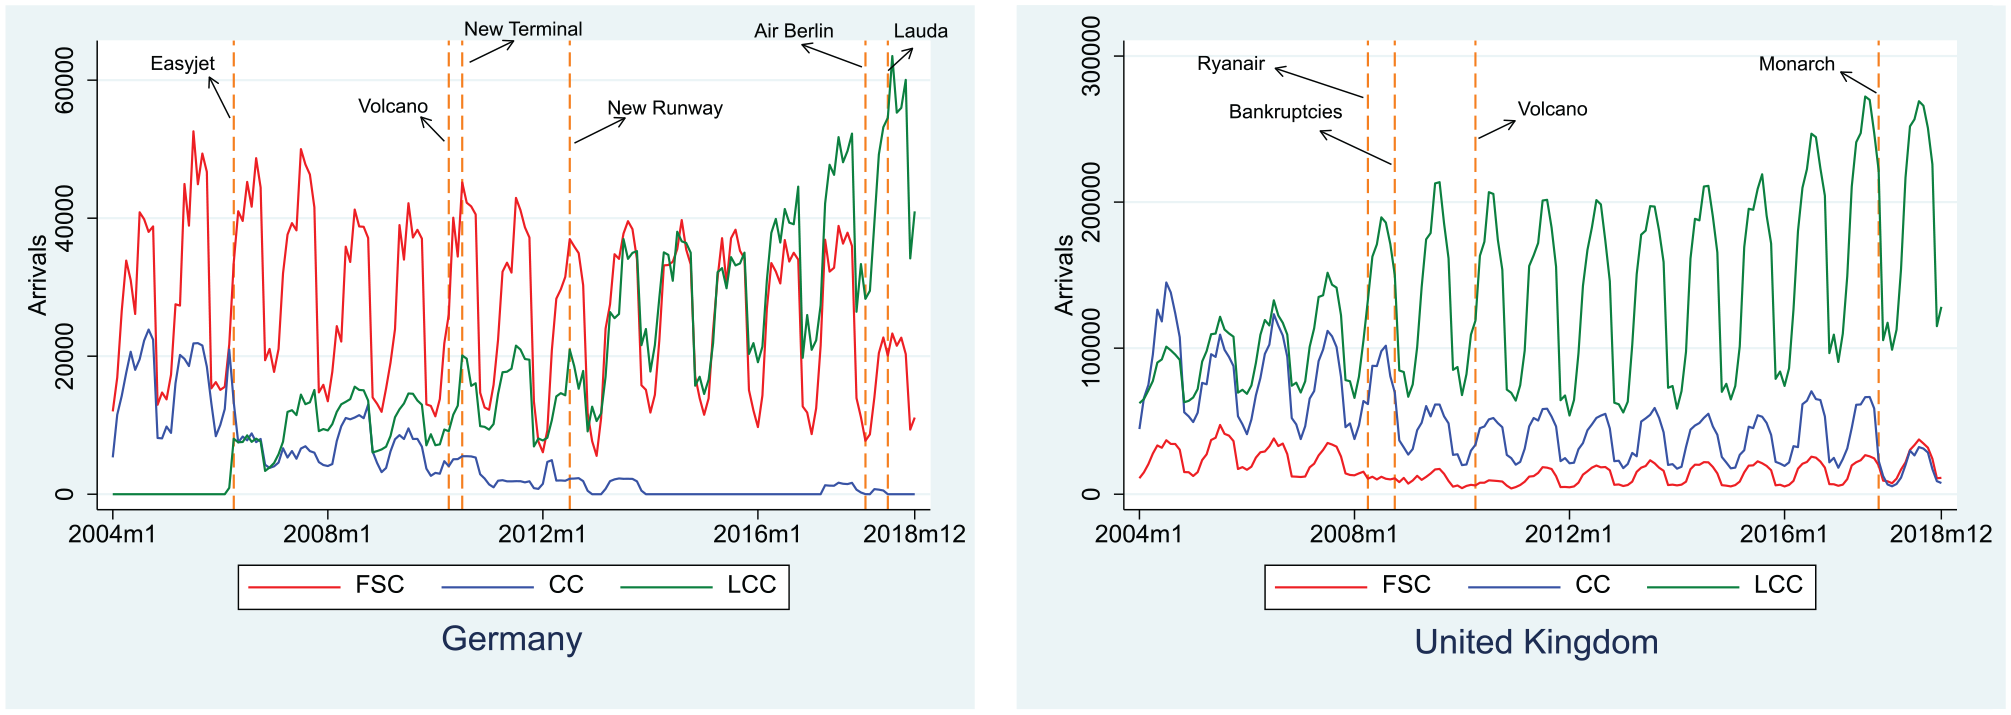
Thus, LCC entry and the advent of the Internet were a key to unbundling the tourist package and decreasing tour operators’ bargaining power. However, the distance of the Canary Islands with respect to the main origins was problematic for LCC optimal route designs, and its entrance was delayed notably. In October 2007, Ryanair entered the market in Tenerife, followed by easyJet in March 2008. The entrance in the other islands occurred on similar dates. Furthermore, during the financial crisis in approximately 2008, a set of bankruptcies and mergers in the airline market occurred (Figure 1) that conditioned arrivals and reshaped market shares. In October 2017, traditional CC Monarch exited the market, causing a relevant decrease in arrivals, especially in Tenerife. The market share of Monarch was not fully covered by any other airline, which motivated us to write this article. The list of air companies operating in the Canary Islands has been notably reduced in the British market (Table 3) but not in Germany (Table 4).

Mergers and bankruptcies of airlines after 2008 economic crisis.
Market Concentration Evolution in the UK–Canary Islands Markets.
Market Concentration Evolution in the Germany–Canary Islands Markets.

The purpose of this article is to understand the impacts of the entry and exit of such airlines. Because the number of airlines is too large, the strategy for the analysis is to aggregate them attending to Table 2 and build an LCC, FSC, and CC time series. The objective is to measure their degree of substitutability. A methodology that can manage such simultaneous and cointegrated (in case they are) time series is the multivariate structural time series model, which belongs to the family of state space models. The details are explained as follows.
Methodology
Univariate structural time series models (STSMs) have been widely used for tourism forecasting (González and Moral 1996; Greenidge 2001; Turner and Witt 2001; Eugenio-Martin, Sinclair, and Yeoman 2005; Blake et al. 2006), especially after the publication of Harvey’s (1989) seminal book, who suggests its use for forecasting passengers arrivals (see Harvey 1989, pp. 93–95), especially in the presence of seasonality. STSMs disentangle the series into unobserved components: level, slope, irregular, and seasonal and/or cycle. The level, slope, and seasonal components can be either stochastic or fixed (Commandeur and Koopman 2007). Such decomposition can improve the understanding of the series and forecasting accuracy (González and Moral 1995). The model specification allows for time varying parameters (Song et al. 2011), and interventions on the components (Harvey and Durbin 1986), which provides a deeper understanding of the impulses provided by significant events in the series (Eugenio-Martin 2016). Moreover, the series does not need to be stationary; thus, series transformations are not required, and the interpretation is more straightforward.
In our case, the number of passenger arrivals on FSCs, CCs, or LCC may not be independent of each other. Thus, instead of running independent models, a seemingly unrelated time series analysis may be required. For that purpose, multivariate structural time series models (MSTSMs) are an appropriate approach. Du Preez and Witt (2003) explored MSTSMs in a tourism context; they state that in the presence of a “rich” error correlation structure, an MSTSM should outperform univariate time series models. More recently, Chen et al. (2018) measured the accuracy of MSTSMs with respect to alternative tourism models. They found that in the presence of seasonality, MSTSMs outperformed alternative models such as SARIMA or univariate exponential smoothing.
In our case, the model specification is a trivariate structural time series model, which is specified as a local level with drift and a seasonal component. The following representation is based on Harvey (1989), Commandeur and Koopman (2007), Durbin and Koopman (2012), and Koopman et al. (2009). The model can be represented as follows:

Equation (1) represents the observation or measurement equation, where

where


Equation (2) represents the state or transition equation, where μt denotes the N×1 vector of the stochastic level component, with a matrix of error variances and covariances
Additionally, in our case, we also have explanatory variables and interventions that can be added to the model; thus, equation (1) can be extended:

where
Thus, the models have a stochastic level, fixed slope, stochastic seasonality, and interventions that vary with each market. For instance, the UK–Gran Canaria market has four level interventions related to easyJet entry (April 2008), the exit of CCs because of bankruptcies (October 2008), Ryanair entry (November 2009), and the exit of Monarch (October 2017). Moreover, the Iceland volcano eruption (April 2010) was considered with a pulse intervention on the irregular component.
One key question in the multivariate analysis of a structural time series is the relationship among the series, measured by the correlation of the component disturbances. If the correlation between the disturbances of an unobserved component is high, a test of the presence of common factors in that component is required. Common factors in STSMs mean that the disturbance matrix has a less than full rank. Furthermore, a common trend between two series implies the presence of cointegration (Harvey and Koopman 1997). Thus, when the disturbance of the level components of two series are uncorrelated (e.g.,
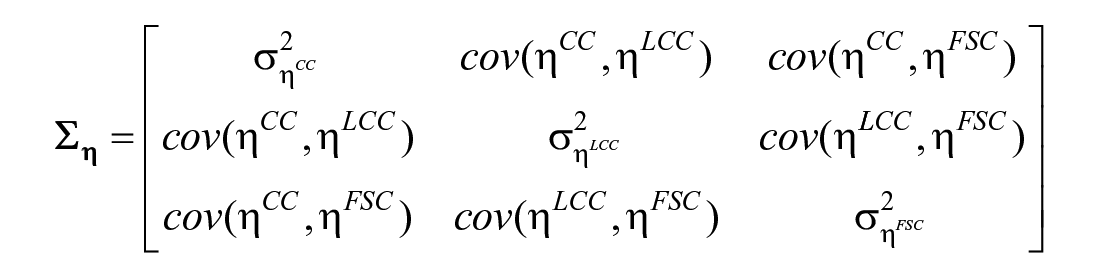

Notably,
Results
The article analyzes five destinations, namely, Gran Canaria, Tenerife, Fuerteventura, Lanzarote, and Malaga, and two origins, namely, the United Kingdom and Germany; thus, 10 markets are studied. The series represent tourist arrivals that start on January 2004 and end on December 2018. A trivariate structural time series analysis comprising all three types of carriers is estimated. Level and level error component correlation matrices are obtained to understand the relationship among FSCs, CCs, and LCCs.
Key interventions are also considered on the irregular, level, and slope error components. They provide estimates of the impact of events, especially those related to the entry and exit of airlines. Any significant event that has occurred must be modeled to reveal its impact and estimate the components with lower noise. Notably, several interventions were tested on the series, and the significant tests are shown in the tables.
Explicative variables are also considered, but neither origin gross domestic product (GDP) per capita nor real exchange rates were statistically significant. This finding makes sense for well-established routes, especially when traveling from high-income countries to mature destinations. In this sense, Smeral (2012) shows that income elasticity varies by origin and the business cycle. Furthermore, Eugenio-Martin and Campos-Soria (2014) show that during the global financial crisis, high-income origin countries hardly reduced their outbound tourism demand, especially for countries in colder regions. For illustrative purposes, we explain the UK–Gran Canaria market in detail, whereas the remainder of the markets are presented briefly.
UK–Gran Canaria market
In Table 1, the UK–Gran Canaria market in 2007 was dominated by CCs, with 85.12% of the market share. FSCs had a small presence, with 12.29% of the market, and LCCs were incipient (2.59%). Figure 2 shows the evolution of the market and key events.

Time Series of Arrivals in the UK-Gran Canaria Market (2004-2018).
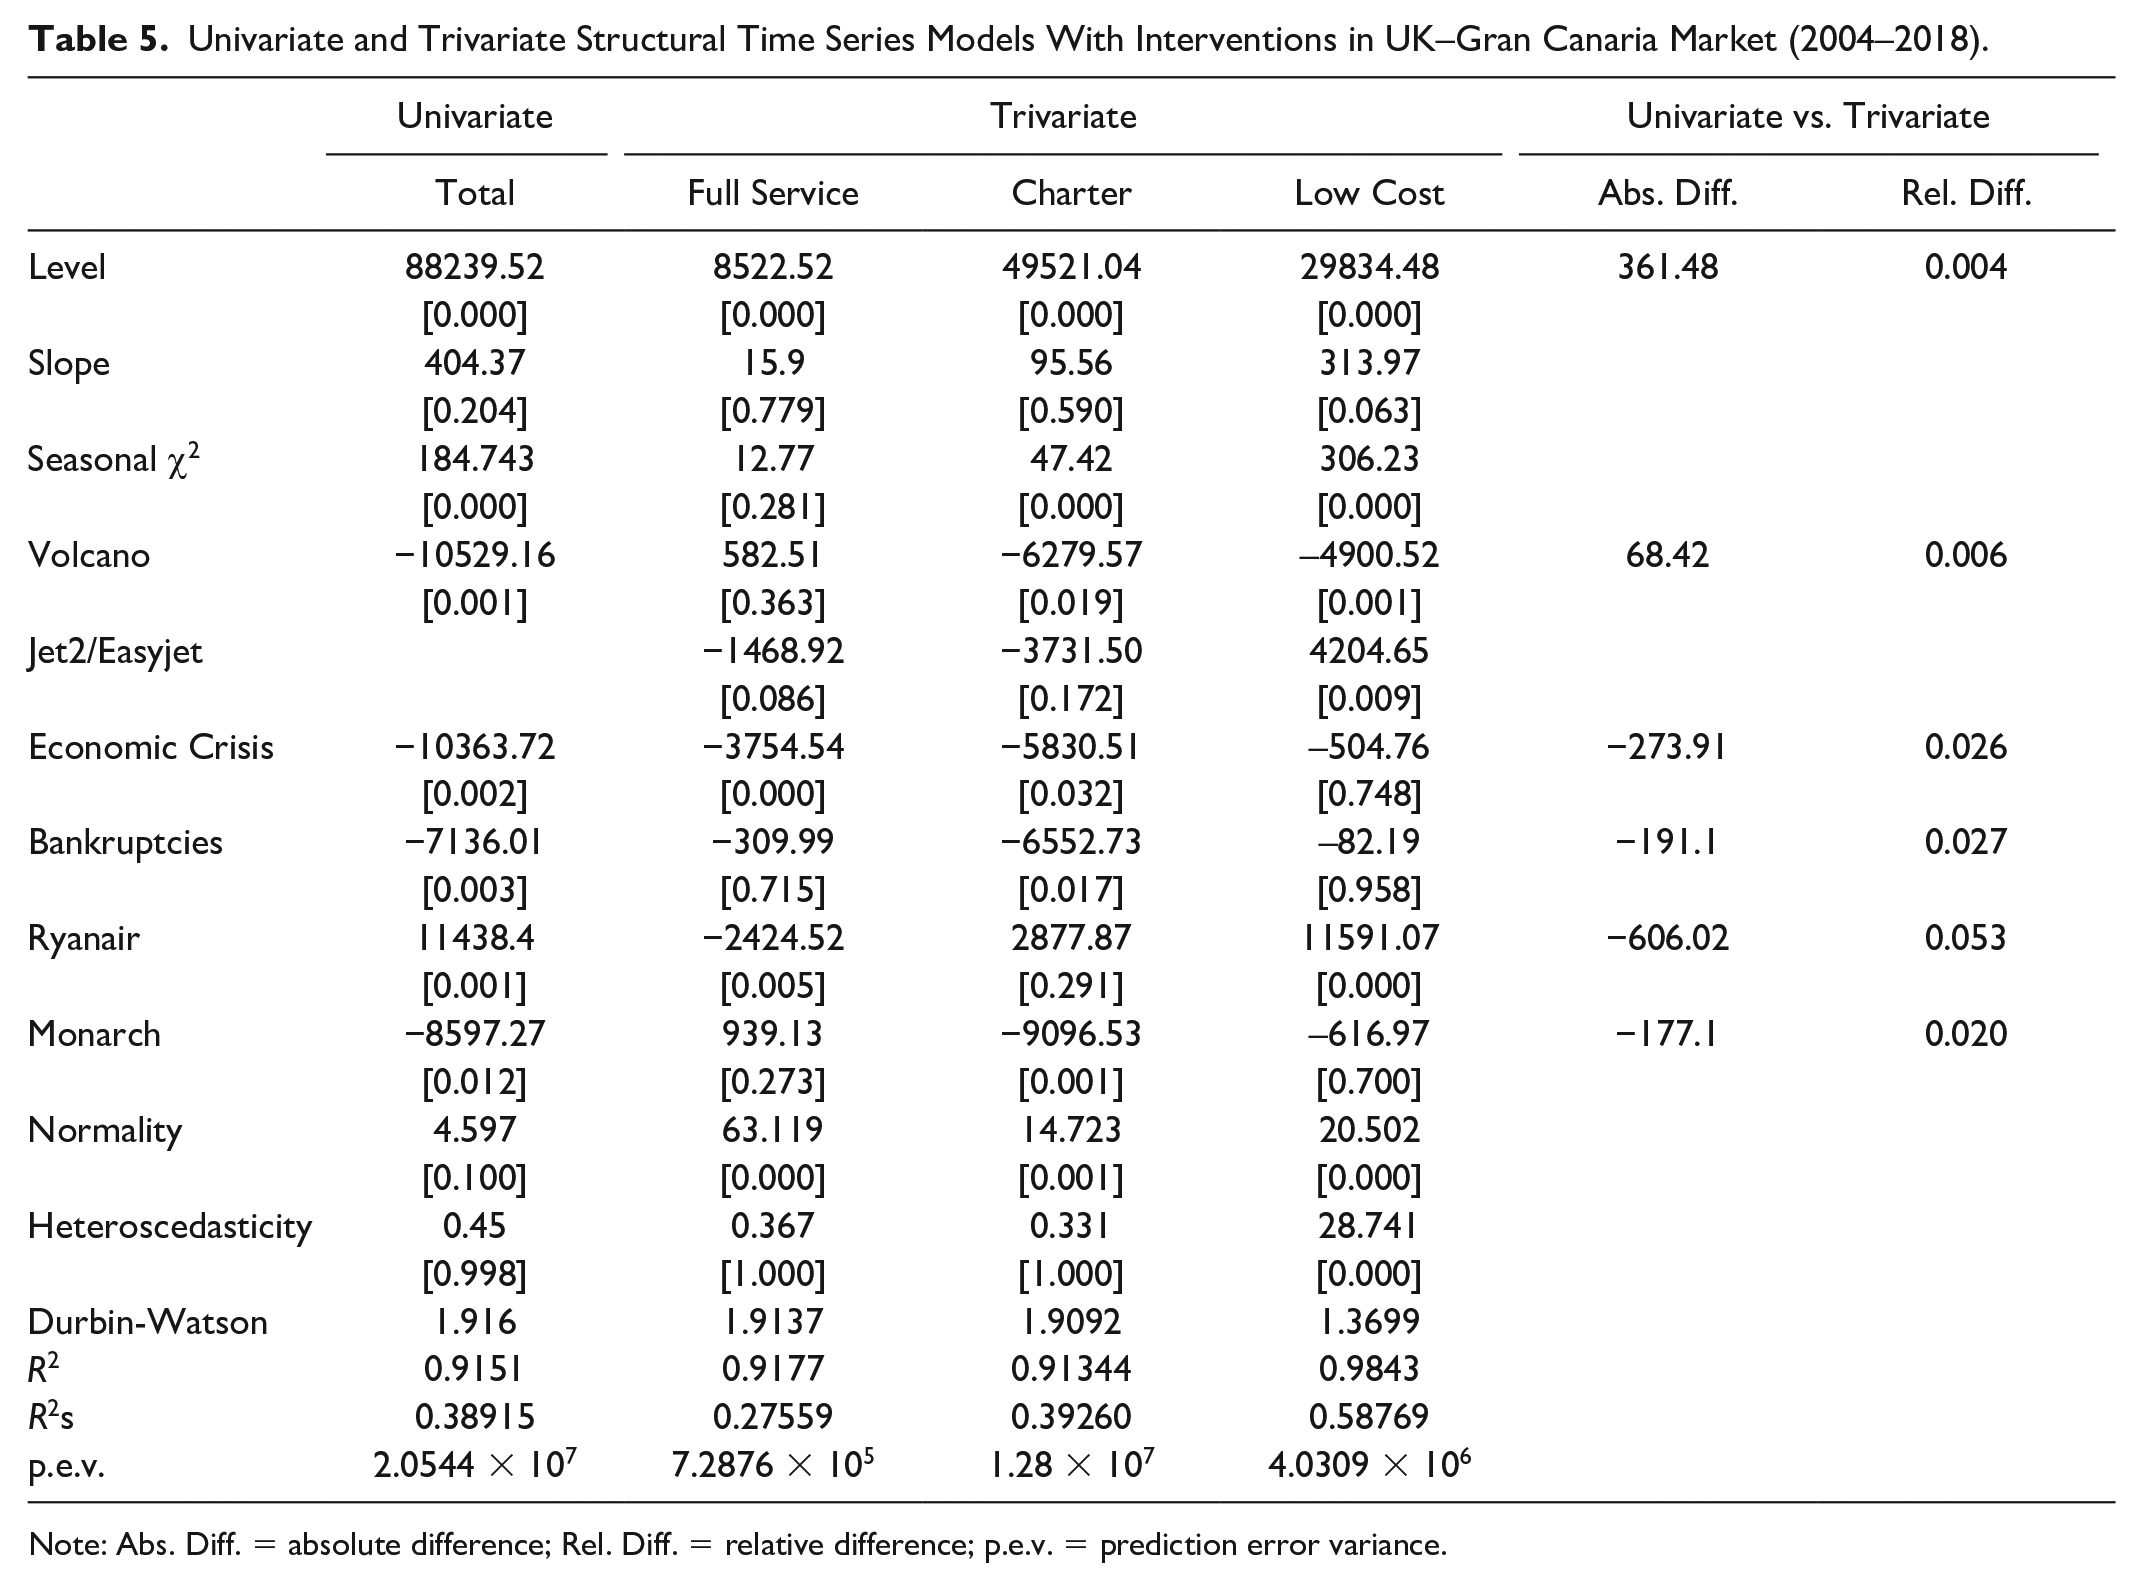
Two STSMs are estimated: an aggregate model of the whole market is estimated by employing univariate structural time series with the key interventions, and a trivariate model that disentangles the three types of airlines is also estimated. The former model estimates the impact on the whole market of entry and exit of airlines. However, the latter model can also understand the redistribution of passengers among them. The results are shown in Table 5.
Univariate and Trivariate Structural Time Series Models With Interventions in UK–Gran Canaria Market (2004–2018).
Note: Abs. Diff. = absolute difference; Rel. Diff. = relative difference; p.e.v. = prediction error variance.
The results of the estimation of the total market demonstrate that the stochastic level and stochastic seasonal components are significant, whereas the estimated slope is low and not significant. The results of the trivariate model demonstrate that FSCs have a significant stochastic level, CCs have a significant stochastic level and seasonal components, and LCCs have a significant stochastic level, a seasonal component, and a fixed slope, which shows marked LCC growth over time. Additionally, one of the main advantages of a structural time series is its ability to estimate the impacts of events. Below, the results of the estimation of the impact of the events are described. These results are key to understanding the crowding out effects among types of airlines.
Jet2 and EasyJet Entry
The CC series has been decreasing since 2004, whereas the FSC series remains stable until 2008. At the end of 2007, Jet2 (LCC) enters the market, followed by easyJet (LCC) in early 2008, which forces GB Airways (an FSC) to leave the market at the same time. Actually, GB Airways merges with easyJet (Figure 1). The total model estimates whether the entry and exit of such airlines have affected the total number of arrivals. Notably, LCC entry may crowd out FSCs or CCs exiting the market with the same number of passengers. For that type of situation, the parameter estimate of such an event is expected to be nonsignificant. Indeed, that is the case for this event: the entry of Jet2 and easyJet (LCCs) are not significant in the total market and such intervention is excluded from the model; however, they are significant in the trivariate model. The trivariate model shows a significant increase of approximately 4,204 LCC passengers, a significant decrease of approximately 1,469 FSC passengers, and a nonsignificant decrease of approximately 3,731 CC passengers. This example is the first where significant crowding out between LCC and FSC occurs.
Economic Crisis and Bankruptcies
The financial crisis negatively affected the GDP of the United Kingdom in the second term of 2008. The economic crisis causes a decrease of approximately 10,364 passengers, on average, per month. The trivariate model disentangles the effect among the types of airlines: the crisis implied a decrease of approximately 3,755 FSC passengers and 5,831 CC passengers but was not significant for LCC passengers. Such LCC strength in the economic crisis is relevant information for tourism destinations managers and to compare the results of the total model with the results of the trivariate model. If we sum up the effects on the three types of airlines, the result is approximately 10,090 passengers, which is a close figure to that obtained in the total model, that is, only 2.6% lower. The right side of Table 5 shows such absolute and relative differences. In all cases, the relative difference is smaller than 6%.
As depicted in Figure 1, the crisis also implied mergers and bankruptcies of certain airlines around October 2008, which redistributed the market shares. The total model estimates that the bankruptcies implied a decrease of approximately 7,136 passengers, whereas the trivariate model reveals that, as we expected, the main decrease was concentrated in the CC market, which lost approximately 6,552 passengers, and in the lower nonsignificant figures for the other types of airlines.
Ryanair Entry
In October 2009, LCC Ryanair enters the market. The total model estimates a positive impact on arrivals of approximately 11,438 passengers. However, the trivariate model provides a richer picture. It estimates that the entry of Ryanair increases approximately 11,591 LCC passengers, causes a decrease of approximately 2,424 FSC passengers, and crowds FSCs out of the market. Indeed FSCs will no longer operate the market during the next five years. After Ryanair entry and the economic recovery, LCCs continue to grow, whereas CCs manage to maintain their size or recover by the end of 2016.
Monarch Exit
In October 2017, Monarch (a CC) collapses. Notably, Monarch operated in many markets around the world, and their decision depended on the profits of the whole company; thus, it cannot be necessarily linked with profits in this market. The total model estimates a decrease of approximately 8,597 passengers. How many of Monarch’s passengers were captured by the competing airlines? The trivariate model provides additional insights into this topic. The trivariate model shows that neither FSCs nor LCCs absorbed the CCs lost. All these figures confirm again that exit events markedly affect total arrivals, but more notably, it suggests that market resettlement is not straightforward. The lack of immediate reaction by other types of airlines may be explained by an airline’s capacity constraints and the entry determinants shown in the literature. Moreover, the collapse also affected many other markets where the incumbents have operations. Thus, the incumbents may attempt to absorb part of the decrease but because the decrease occurs simultaneously in many other markets, the capacity constraints cannot be overcome soon. This result corroborates that entry and exit decisions are considered within a network context and do not concern only one particular route.
Notably, in April 2010, the Eyjafjallajökull volcano erupted in Iceland, causing a two-week closure of the air traffic of many routes. This event is controlled with a pulse intervention on the irregular component, which is required for one-off events, and it is significant for CCs and LCCs but not for FSCs. The series decomposition into level, seasonal, and irregular components is shown in Figure 3, that is, how the model fits the actual data. On top, the figure shows the series of the estimated level components, and in the center, it shows the estimated seasonal component. This figure shows the ability of MSTSMs to re-estimate the level after permanent structural changes and manages with such variations with a stochastic level and stochastic seasonal components. For the stochastic seasonal components, the figure shows a decrease in the seasonality of FSCs and CCs and a convergence process of LCCs to reach the CC seasonality pattern.
Trivariate Structural Time Series Error Components for UK-Gran Canaria Market (2004-2018).
Diagnostic Checking
The methodology relies on the assumption stated in equation (3), where residuals are assumed to be normally and identically distributed with constant variances. For the total market, the Bowman-Shenton normality test shows that the residuals are normal, the H(h) statistic for the heteroscedasticity test is also fine, including the Durbin-Watson test of autocorrelation. The details of the first two tests are shown in Harvey (1989, pp. 259–60).
However, the trivariate model fails some tests. The series are less stable, and the behavior of the LCC and FSC series is very peculiar (Figure 3). The LCC series starts from null values and it ends up with large figures of passengers. In this case, by definition, the size of the errors cannot be the same; thus, heteroscedasticity must occur, and normality cannot be achieved in a series of this nature. A similar phenomenon occurs with FSCs but all the way round, and even worse for periods with null values. The CC series has the most stable behavior. The tests demonstrate the non-normality of the three series, and heteroscedasticity and autocorrelation in the LCC series.
Commandeur, Koopman, and van Montfort (2010, pp. 186–87) explain that the residuals require to satisfy independence, homoscedasticity, and normality, in this order of importance. However, under a maximum likelihood estimation, when we have a sufficiently large number of observations, the estimators are consistent and efficient. Concerning the multivariate structural time series, Commandeur, Koopman, and van Montfort (2010, p. 191) state not to worry if the series is large.
Moreover, as a double-check exercise, we compare the results from the total market with the results from the trivariate model. Because the total market model does not fail normality, nor heteroscedasticity, nor autocorrelation, we expect it to have consistent estimates of the components and interventions. On the right side of Table 5, the differences in the level and the interventions between both models are shown. The level of the total model estimates approximately 88,239 passengers, whereas summing up the level of the three types of airlines reaches approximately 87,878 passengers, which means a 0.4% relative difference. The differences in the interventions are also less than 6%, suggesting that the trivariate model results are close to the total model results and that the test failing has not biased the results.
Postestimation Level Correlations
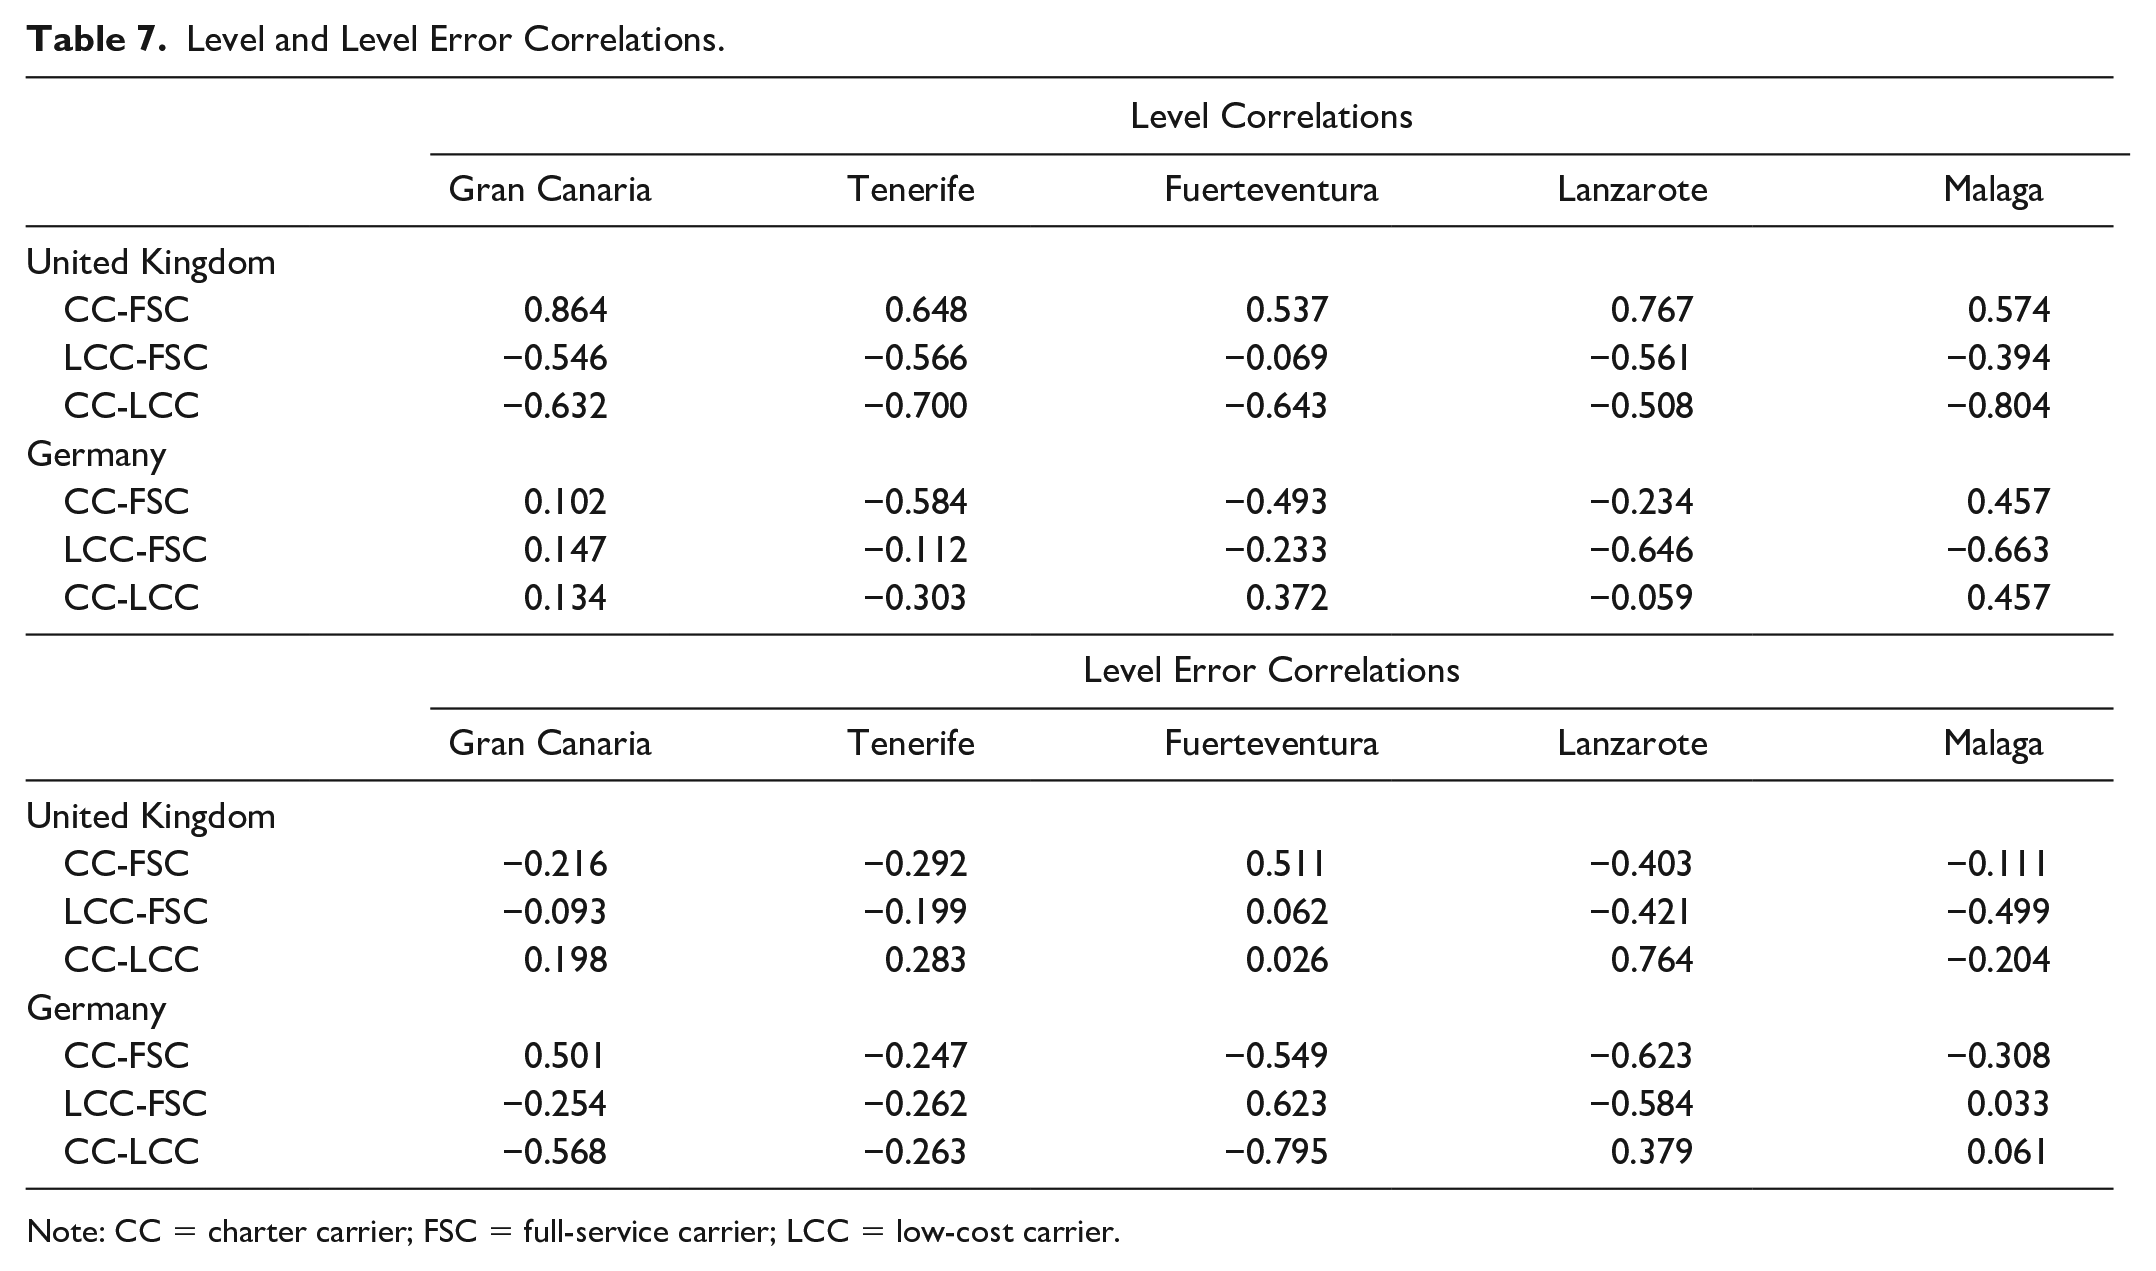
If the correlation of the errors of the level component among the series is high, they may share a common trend and be cointegrated (Harvey and Koopman 1997). However, the results of such correlations are not high. The level error correlation is −0.216 for CC–FSC, −0.093 for LCC–FSC, and 0.198 for CC–LCC. Hence, the long-run relationship among the three types of airlines is weak.
Some LCCs enter the market abruptly; thus, a level intervention makes sense to be considered and is likely to be significant. However, in other cases, the airlines increase or decrease their supply smoothly over time, and that is the case of Ryanair entry in Tenerife or Malaga. In those cases, the degree of competition also varies smoothly, and intervention analysis is insufficient to capture the whole picture.
For this purpose, the relationship among the level series can provide useful information. Notably, the level is a postestimation result of the model that represents the behavior of the series net of seasonal effects and irregular components, and incorporates the estimated interventions and an estimate indicated that considers the errors of the other series simultaneously. The postestimation-level correlations among the three types of airlines is a useful indicator for measuring the degree of crowding out effects over time. In this series, the correlations are 0.864 for the CC–FSC pair, −0.546 for the LCC–FSC pair, and −0.632 for the CC–LCC pair. Such postestimation-level correlations imply a negative relationship between LCC growth and FSCs and CCs. Hence, for this market, the implication is that hypotheses 1 and 2 have occurred. Moreover, the detailed interventions also corroborate this result. By contrast, CCs and FSCs have been increasing or decreasing their traffic together over time.
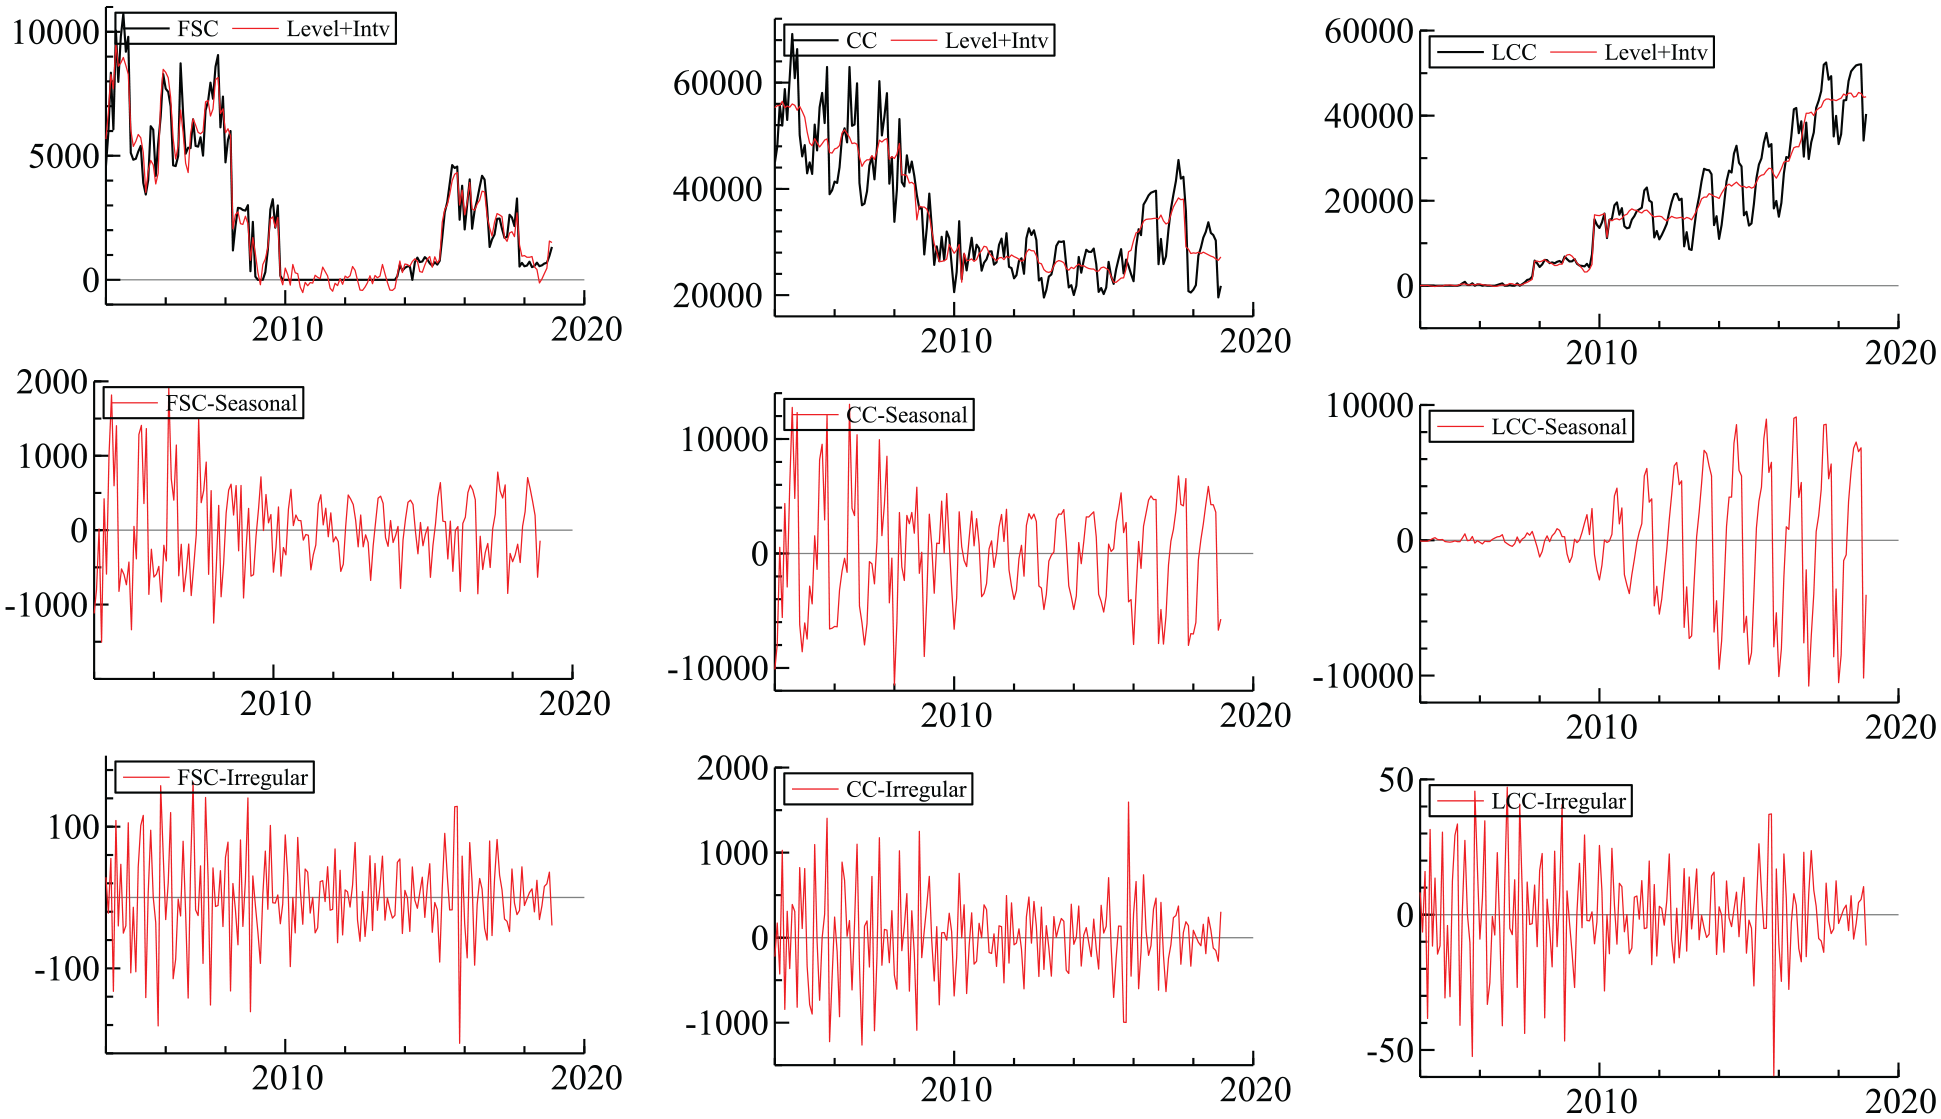
UK–Rest of Markets
The results of the parameter estimates of the interventions in the remainder of UK markets are shown in Table 6 (the details of the estimations are in the Appendix). Overall, the results are similar to the Gran Canaria case. Obviously, not all markets have exactly the same type of interventions, and they do not necessarily occur at the same time. Nevertheless, the LCC entry consequences are similar. For instance, the case of easyJet entry and the economic crisis has a negative impact on FSCs in Tenerife, Lanzarote, and Malaga. Thus, the existence of a contemporary crowding out effect between LCCs and FSCs is proven.
Parameter Estimates of the Interventions of the Trivariate Structural Time Series Models of other UK Markets (2004–2018).
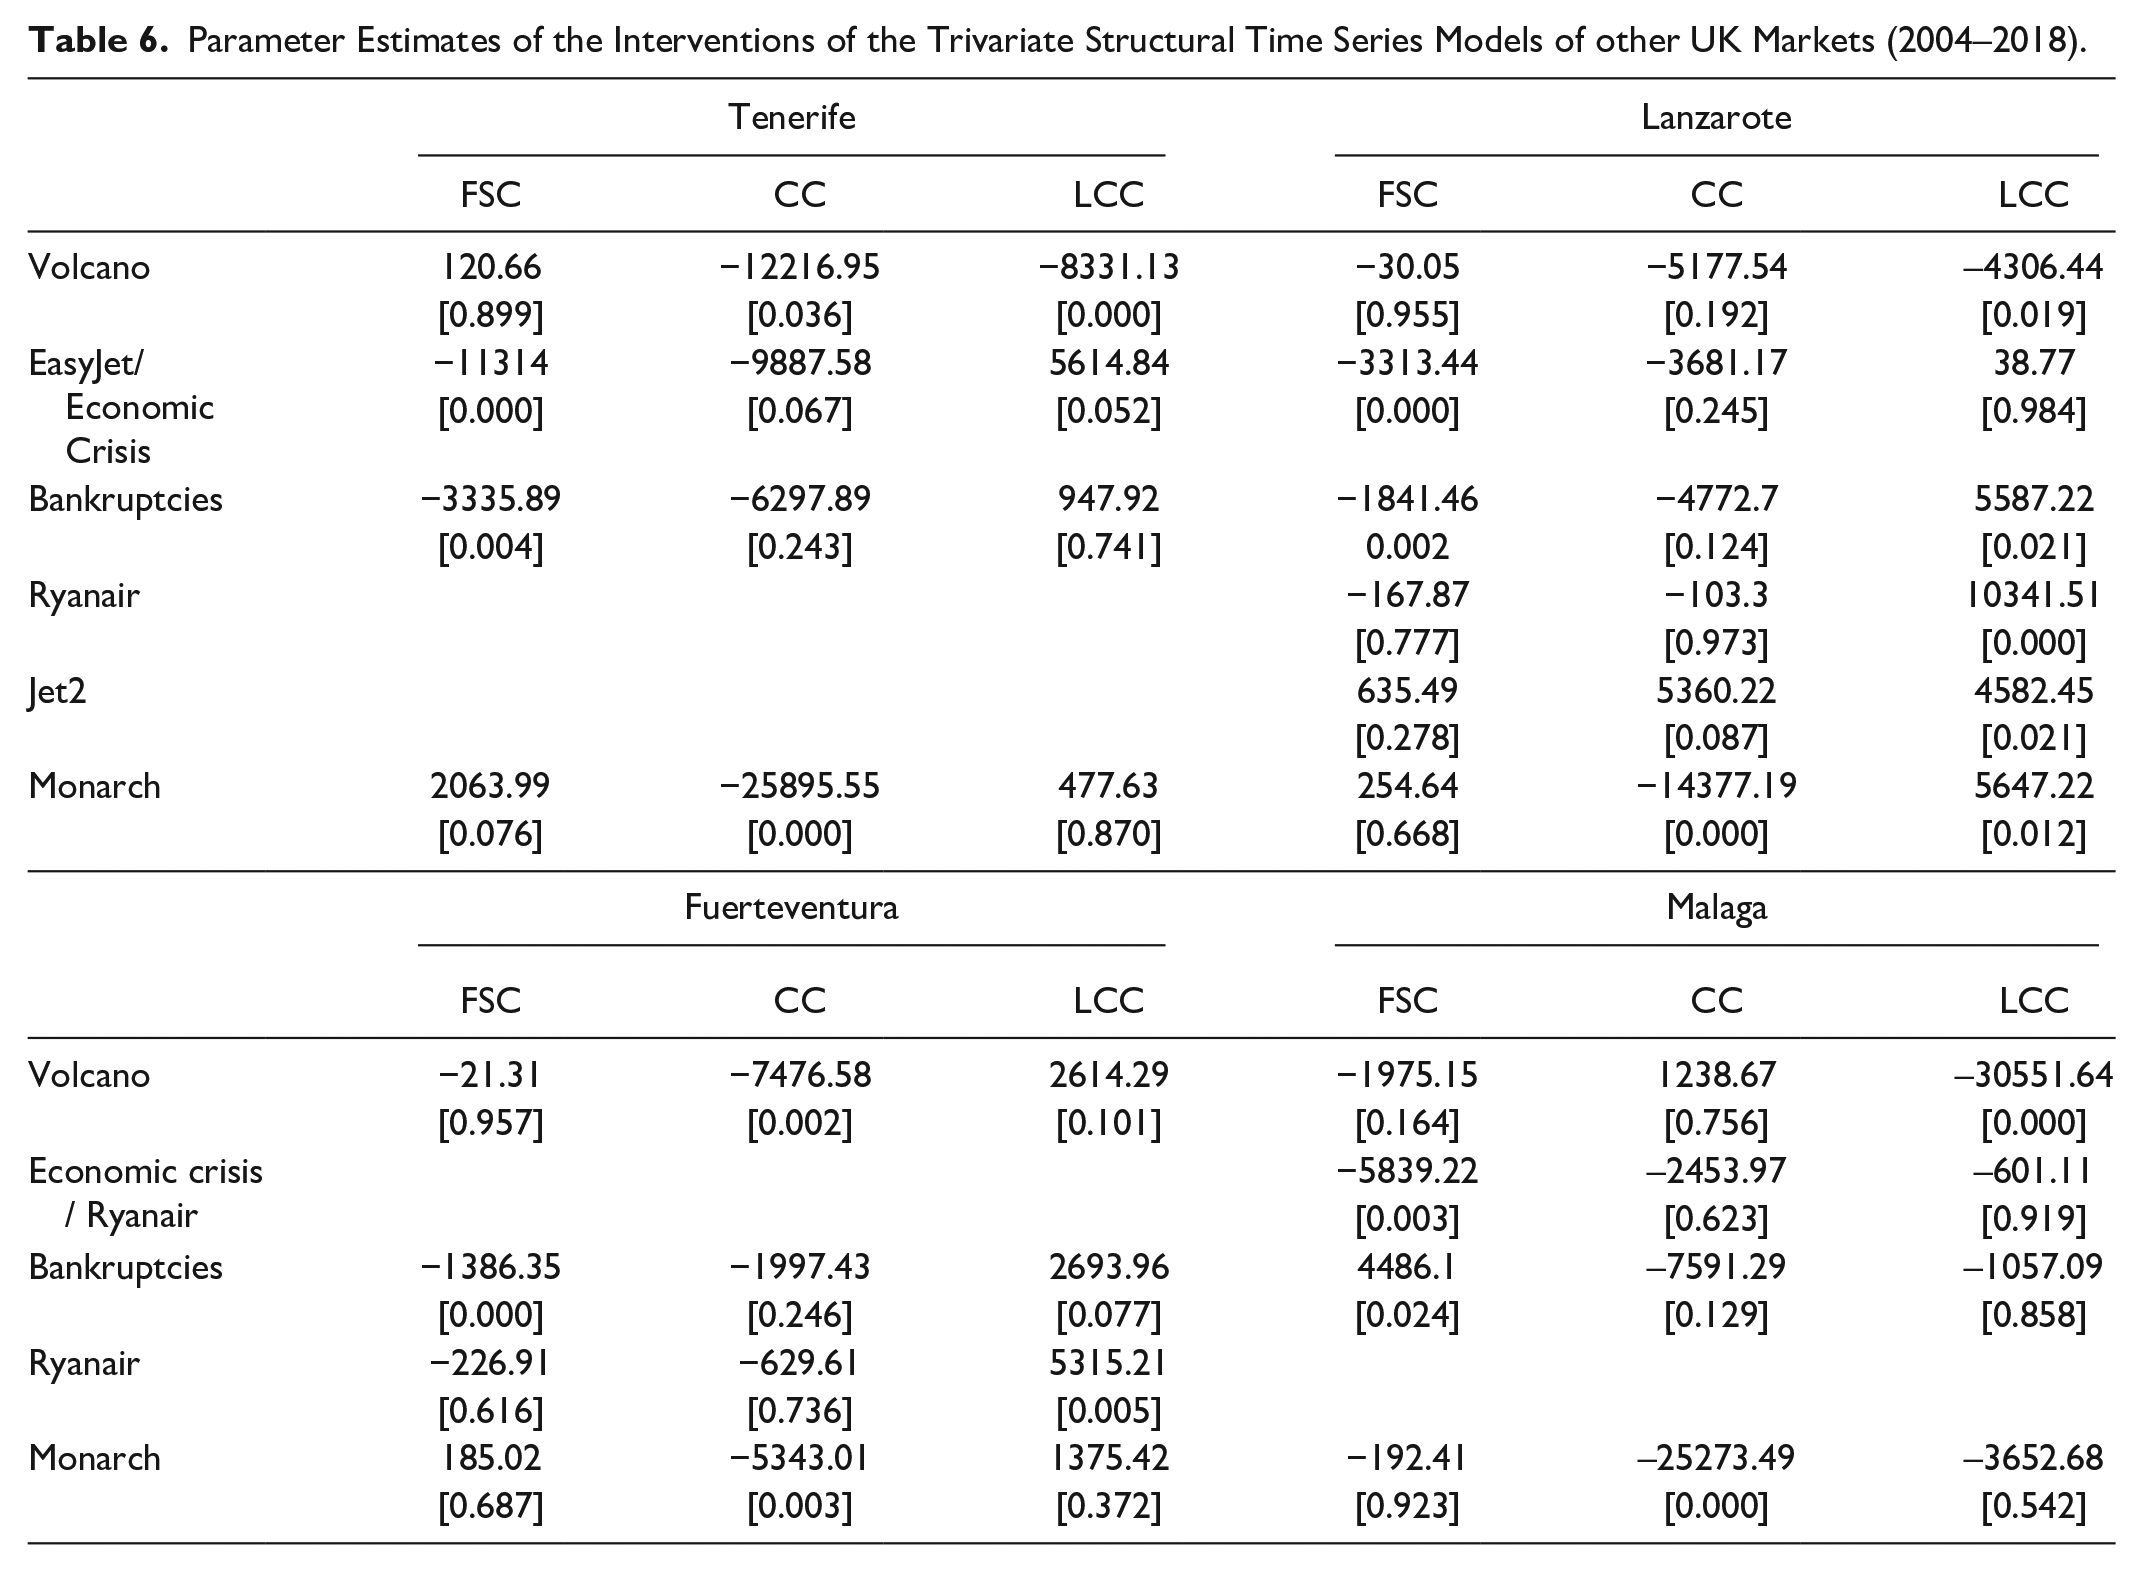
Nevertheless, LCC entry did not always occur abruptly. In Tenerife and Malaga, LCCs entered smoothly over time. In those cases, the level interventions are likely to be nonsignificant, and the crowding out effect must be understood with the level correlations (Table 7). The pattern of all the destinations is exactly the same: the negative-level correlation between LCCs and FSCs, and between LCCs and CCs. This finding corroborates the crowding out effect over time. Additionally, we observe that the level of FSCs and CCs are positively correlated, suggesting that they grew together with the market size. Moreover, Ryanair entry showed a positive impact on Fuerteventura and Lanzarote, where it entered abruptly, and a delayed crowding out effect on FSCs, as suggested by the level correlations.
Level and Level Error Correlations.
Note: CC = charter carrier; FSC = full-service carrier; LCC = low-cost carrier.
Finally, the Monarch collapse had a null response in Fuerteventura and Malaga on the other types of airlines. However, in Tenerife, a tiny part of the decrease was absorbed by FSCs, whereas in Lanzarote, one third was absorbed by LCCs.
Germany–Gran Canaria Market
We now consider Germany because of its different market distribution. Table 1 shows that in 2007, CCs dominate the market, with 76.26% of the market share and with a relevant presence of FSCs (23.74%). LCC presence did not exist in 2007 but increased up to 24.08% in 2018. It represents a much lower presence compared with the 61.34% market share of LCCs in the UK–Gran Canaria market. Such low figures may also anticipate a low crowding out effect.
The results of the parameter estimates of the main interventions in the market are shown in Table 8. Ryanair entry implied an impulse of approximately 5,592 LCC passengers, without significant reductions in the other types of airlines. Subsequently, the Norwegian entry had the same positive result in terms of LCC passengers (approximately 1,721), without significant decreases in the other types of airlines. However, at the end of 2017, FSC Air Berlin collapses, and the market loses approximately 16,658 FSC passengers. Similar to the Monarch case, the remainder of the airlines do not immediately absorb such a massive decrease and continue operating at the same capacity. Finally, LCC Lauda enters the market and captures part of the market share left by Air Berlin; it increases by approximately 4,619 LCC passengers, which still represents only approximately one quarter of the market size loss.
Parameter Estimates of the Interventions from Trivariate Structural Time Series Models for Germany–Gran Canaria Market (2004–2018).
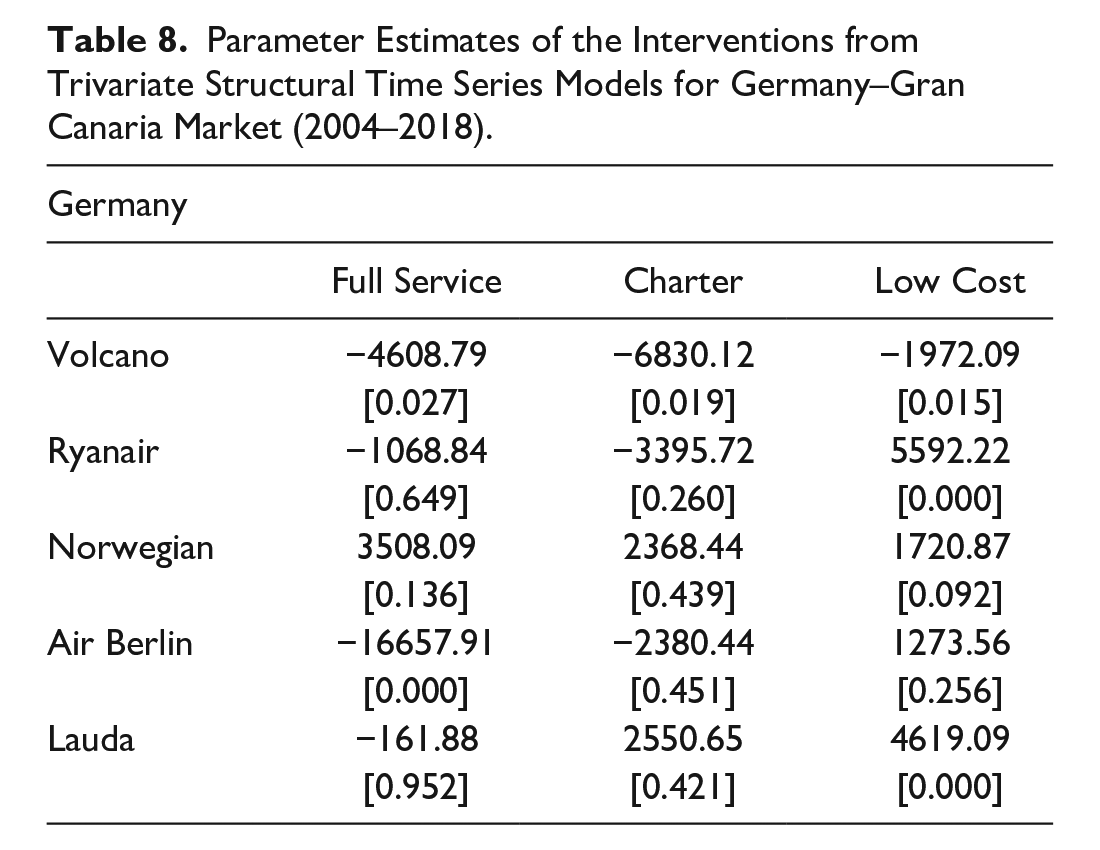
More notably, the level correlations are all positive and low. They confirm that LCC entry had no negative influence on FSCs and CCs; however, they grew together with the market size.
Germany–Remainder of Markets
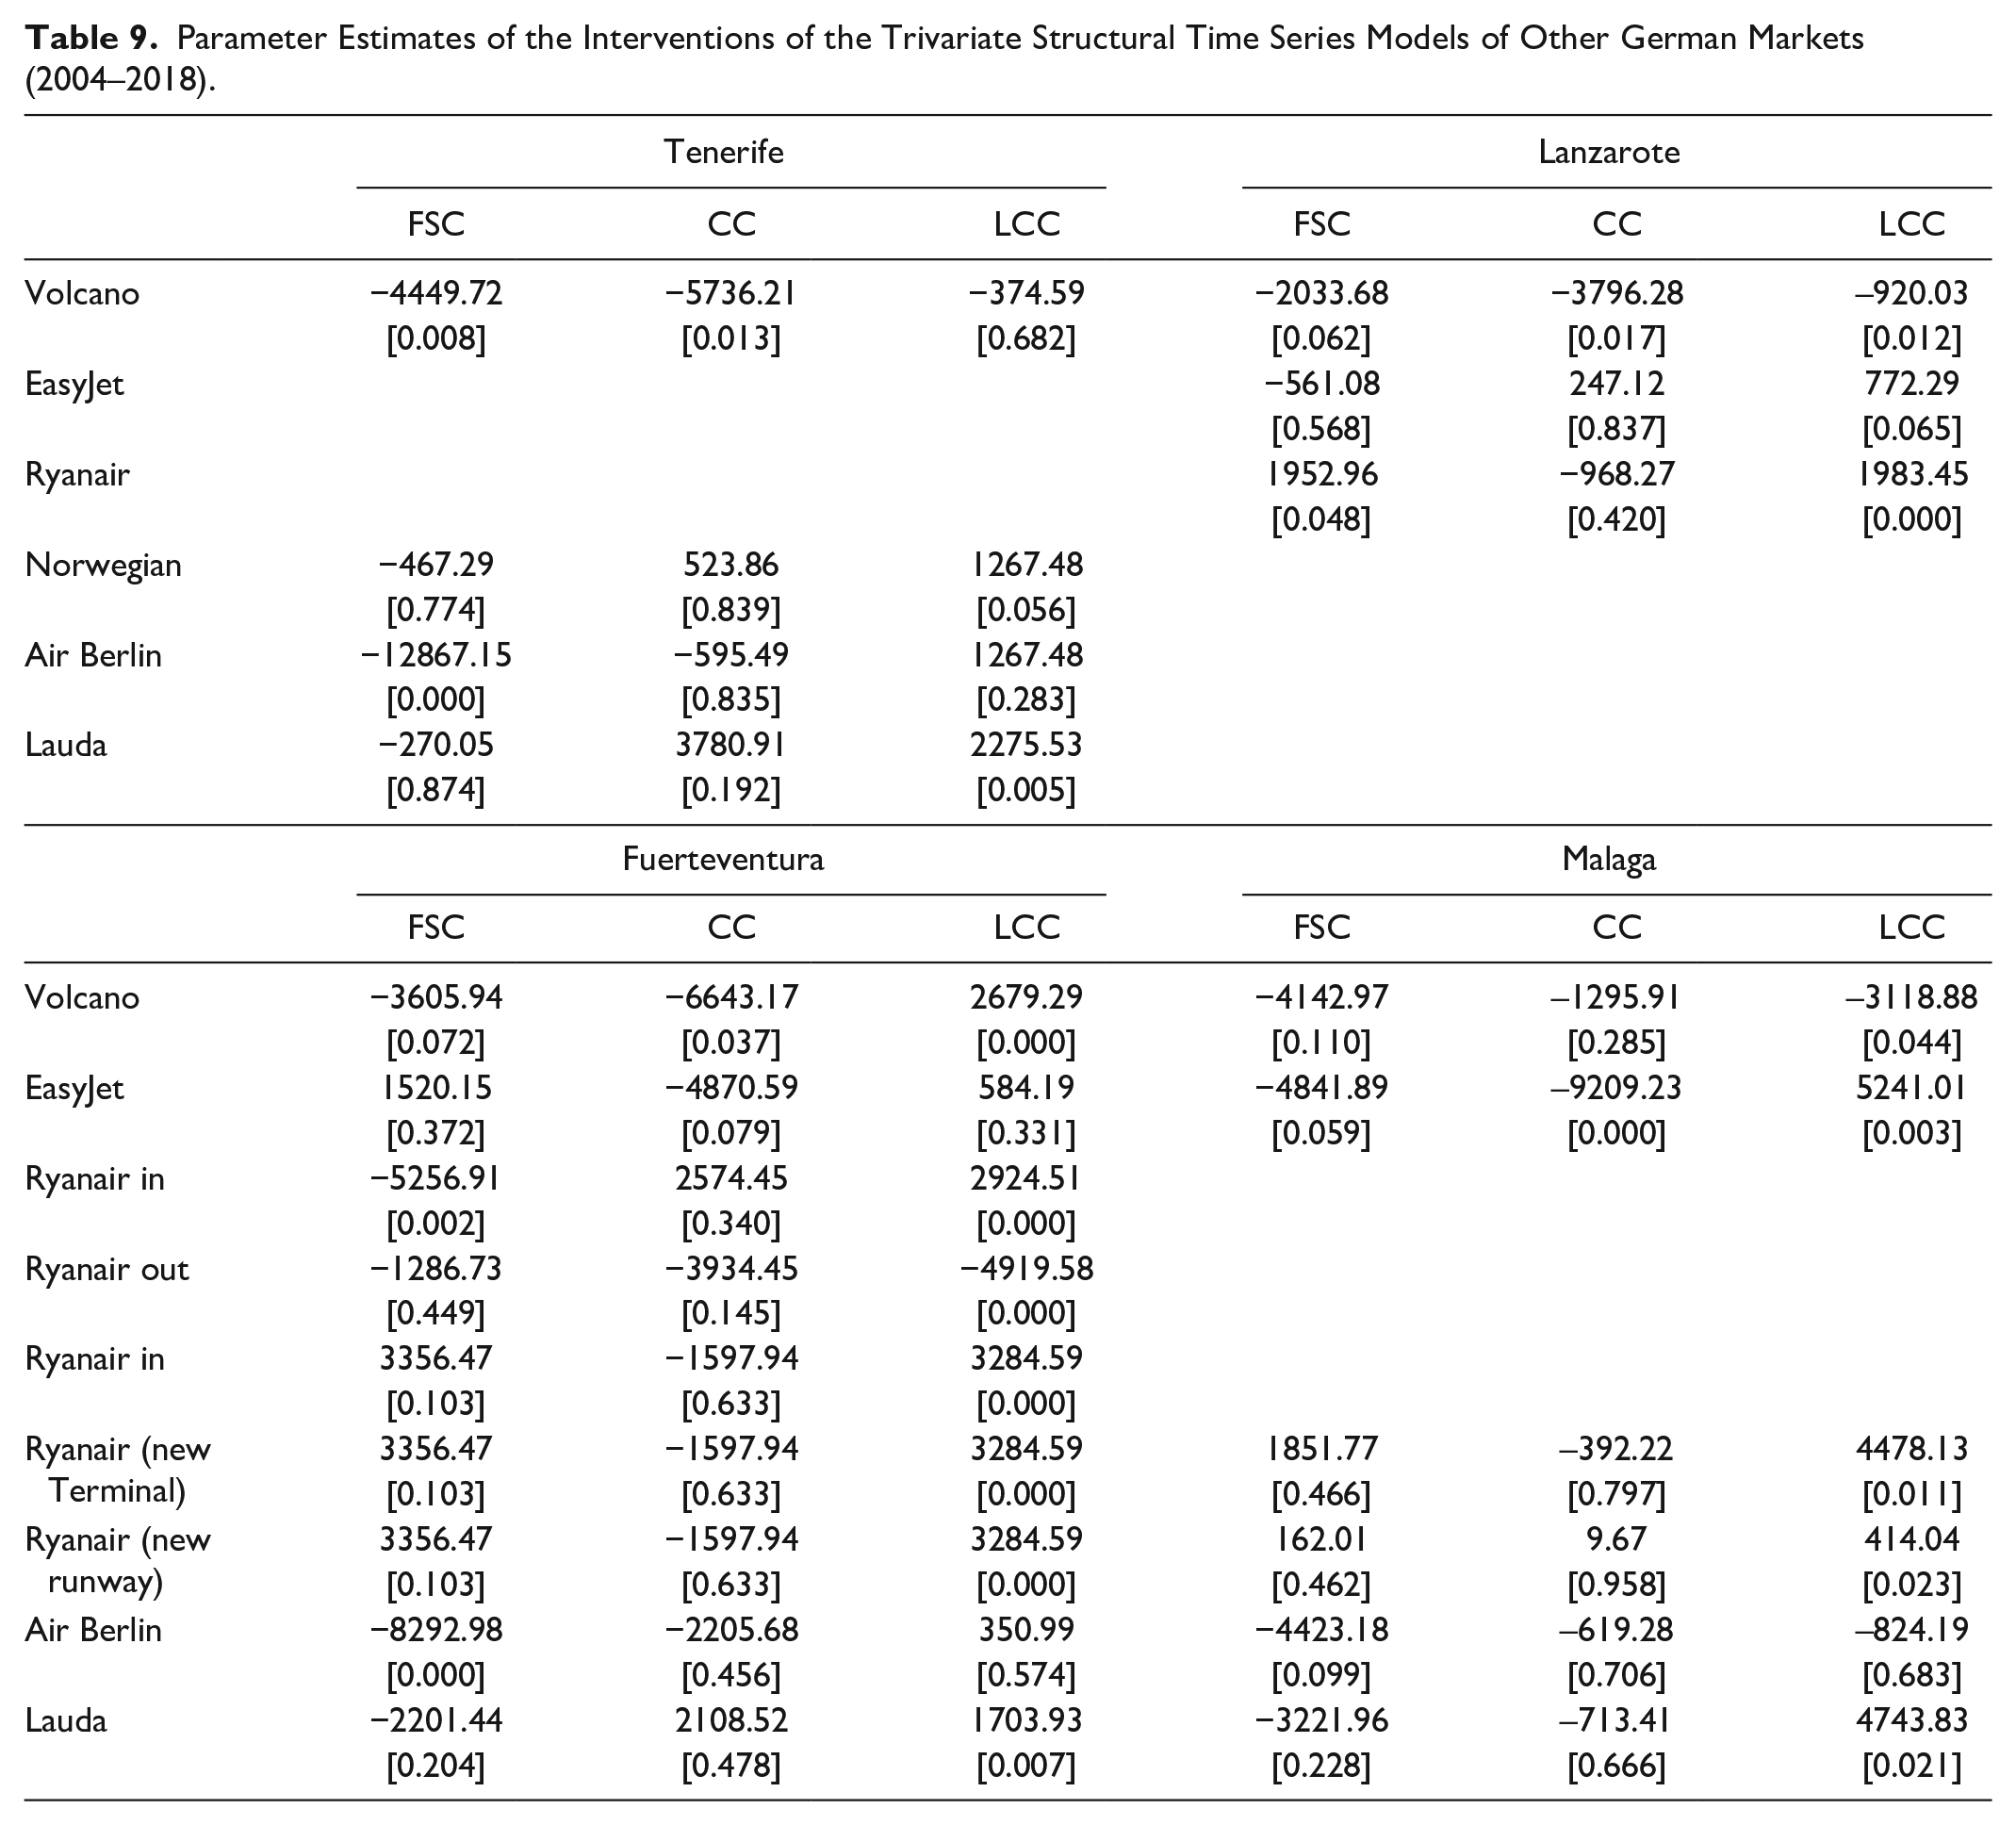
The remainder of the markets demonstrates heterogeneous responses after LCC entry (Table 9). Despite that, some differences are found for certain interventions, but overall, the results are also similar to the Germany–Gran Canaria market (the details of the estimations are in the Appendix). For instance, the decrease caused by Air Berlin is partially captured by LCC Lauda in Tenerife, Fuerteventura, and Malaga. Such heterogeneity is also shown in the correlations (Table 7). Again, most of the correlations are low, but in the cases of LCC–FSC in Lanzarote and Malaga (higher than 0.60), LCC entry implies heterogeneous responses in different German markets, and the crowding out effect in British markets is less clear in German markets. The details of these markets are depicted in Figures 5–8.
Parameter Estimates of the Interventions of the Trivariate Structural Time Series Models of Other German Markets (2004–2018).
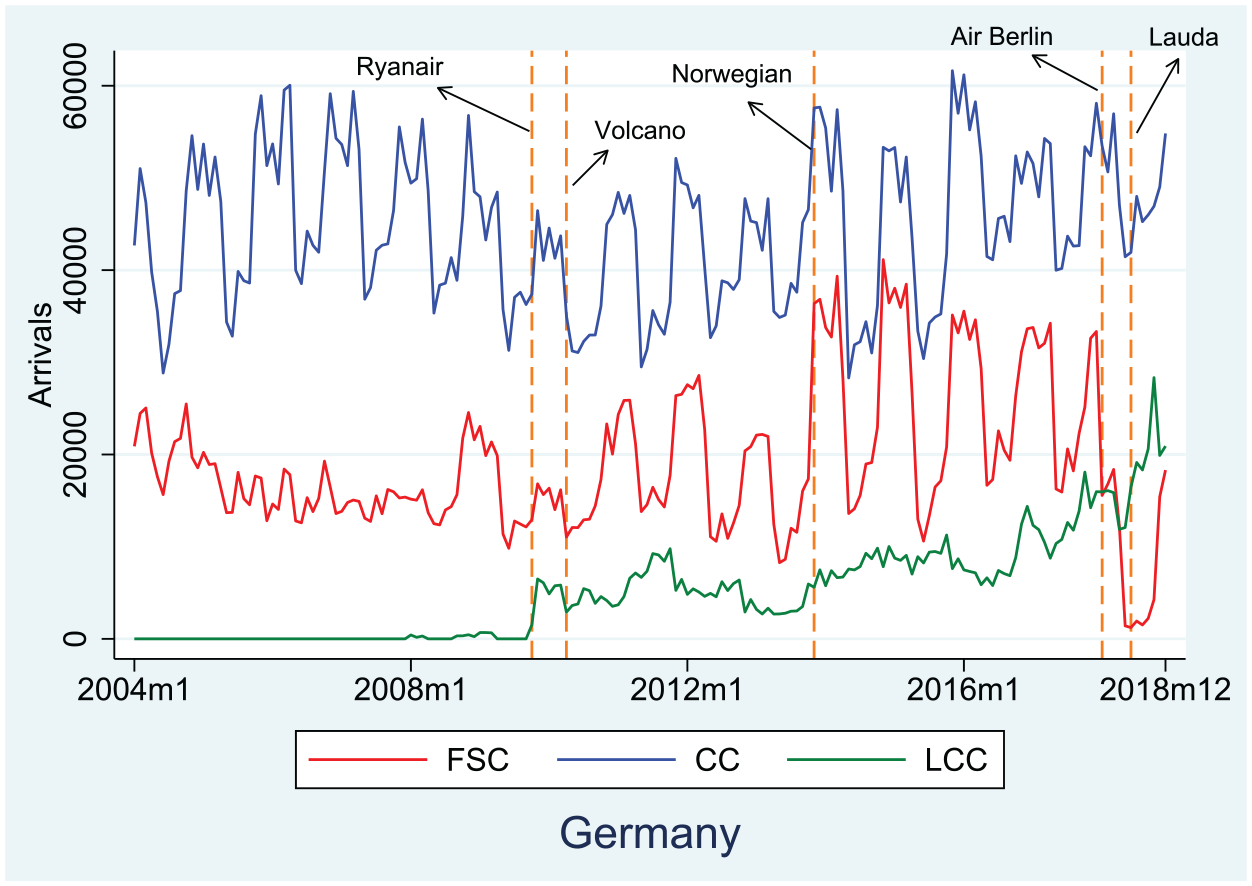
Time Series of Arrivals in the Germany-Gran Canaria Market (2004-2018).
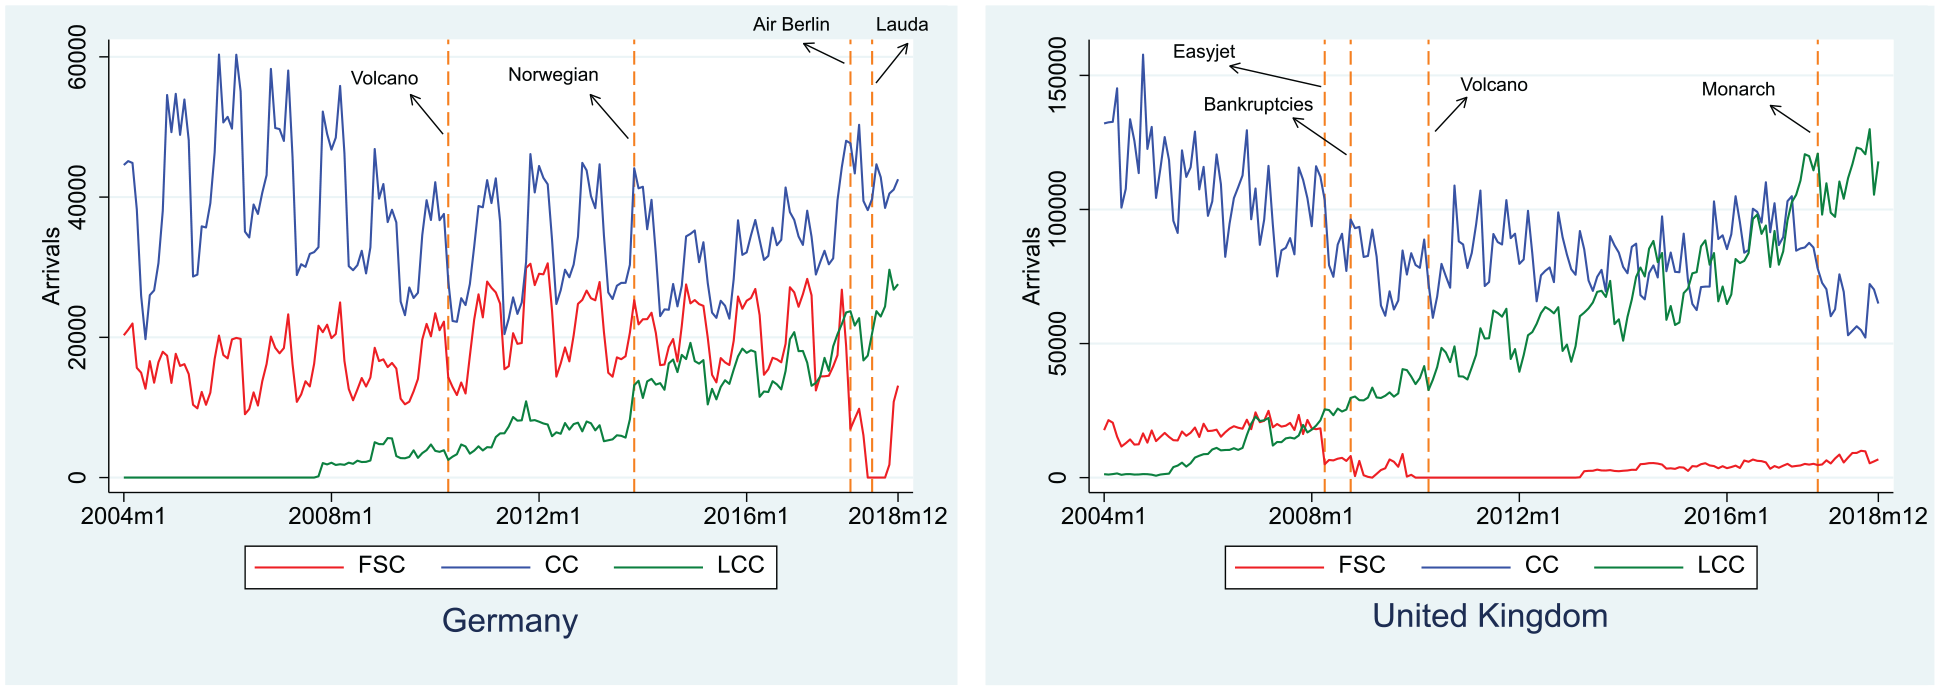
Time Series of Arrivals in the Tenerife Markets (2004-2018).
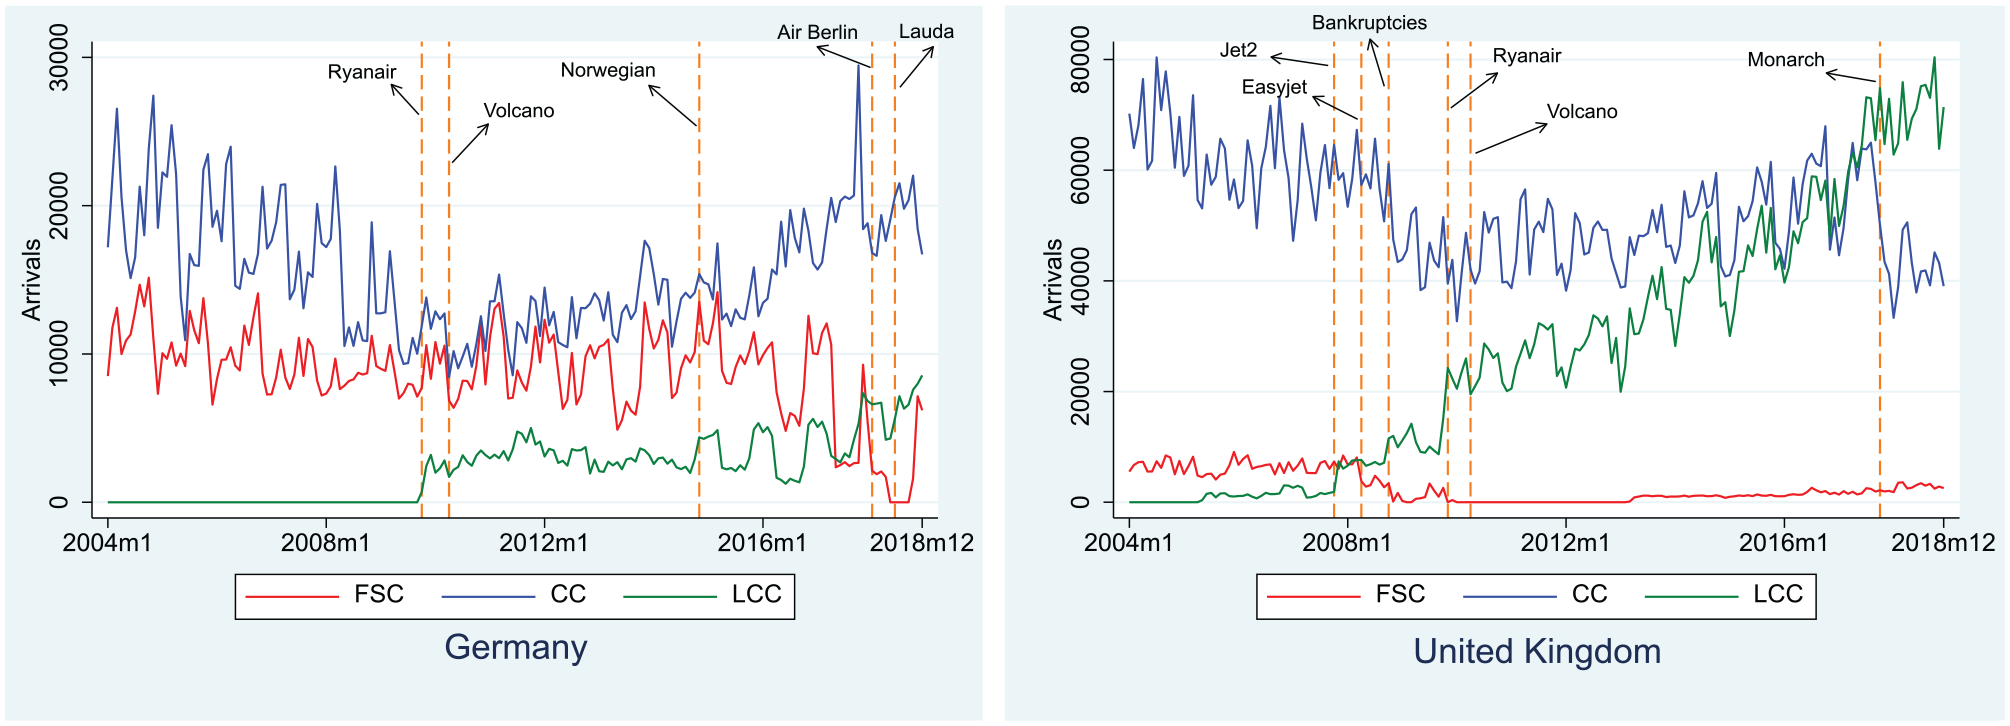
Time Series of Arrivals in the Fuerteventura Markets (2004-2018).

Time Series of Arrivals in the Lanzarote Markets (2004-2018).
Time Series of Arrivals in the Malaga Markets (2004-2018).
Hypotheses
Hypothesis 1: Low-cost carriers entry crowded out full service carriers in a tourism destination
The results for the British markets support the first hypothesis and are based on the key interventions and the negative-level correlations between them. For instance, the mergers and bankruptcies in 2008 implied a reallocation of the market share in favor of LCCs in Fuerteventura and Lanzarote. Moreover, Ryanair entry was very marked in Gran Canaria, where it crowded out FSCs. A similar FSC crowding out effect occurred in Tenerife after easyJet entry. Finally, the correlations have shown negative values for all five markets.
However, the German market has heterogeneous responses after LCC entry. Such entry has not always implied significant decreases in FSCs, but a net growth of the market. Nevertheless, the Air Berlin decrease was partially absorbed by LCCs Lauda in 2018. Moreover, Lanzarote and Malaga showed a high negative-level correlation between LCCs and FSCs.
Hypothesis 2: Low-cost carriers entry has crowded out charter carriers in a tourism destination
In the British market, the main significant crowding out intervention effect occurred in Tenerife after easyJet entry. The remainder of the interventions were not significant. However, the level correlations were negative for all five markets. This finding suggests that LCC entry has crowded out CCs smoothly over time until the eventual collapse of the CC Monarch.
In the German market, such a hypothesis is unclear. The response has been heterogeneous, and overall, the level correlations have been low or have shown a common growth path between CCs and LCCs.
Conclusions
The trivariate structural time series analysis has proven to be a helpful tool for testing the simultaneous relationship among LCCs, FSCs, and CCs. Thus far, the literature has shown the impact of LCCs on the total number of arrivals. However, this study employed a methodology to disentangle the effects of simultaneous impacts and provided estimates of individual responses. The methodology was applied in two origin markets—the United Kingdom and Germany—to assess how they have evolved from 2004 to 2018 in five sun-and-beach tourism destinations in Spain and provides useful information on the degree of reaction of each type of airline. More precisely, our research provides two main results: individual estimates of the short-run impact of entry and exit events on each type of airline, and estimates of level correlations that provide an indicator of the long-run crowding out effect.
Once an LCC enters a market, incumbents’ reactions have been heterogeneous. The main source of heterogeneity is more related to the origin markets than the destinations. Overall, in the British origin market, FSC passengers were usually crowded out soon after LCC entry, whereas CC passengers did not switch so easily. However, over time, the level correlations showed a negative relationship between LCCs and FSCs, and between LCCs and CCs for all five markets studied. The finding suggests that LCC entry crowded out FSCs soon and CCs eventually.
However, the German market differs. The LCC market share is less than half of the British market share, and its entry has shown no significant immediate impact on FSCs or CCs. Similarly, most of the level correlations are low. The only exceptions are the cases of Lanzarote and Malaga between LCCs and FSCs. Overall, no strong evidence of crowding out effects is observed. This finding suggests that LCC crowding out effects cannot be generalized and that their impact depends more on the origin airline market structure than destinations.
One key inquiry posed by government institutions is on the LCC entry impulse. This article has shown that depending on the intensity of the LCC entry, it can be significant. However, the article has also shown the contrary situation, where an airline leaves the market, for example, the case of the exits of the CC Monarch or the FSC Air Berlin. In these cases, the number of passengers lost after exit was not covered by the incumbent airlines. This finding shows a narrow room for maneuver of LCC and provides a striking conclusion: retaining large airlines to operate the route is critical to maintaining long-haul tourist arrivals. Thus, the relevance of policies pursuing the attraction of new airlines to the destination is proven. These policies must be assessed according to the net economic effects based on net arrivals, expenditure per tourist and night, and length of stay. Further research should focus on the assessment of such economic effects by considering the crowding out effect and the policy cost.
Hence, the article has shown the presence of rigidities in the incumbent’s capacity to absorb passengers after the event of airline exit, and resilience of CC incumbents after LCC entry, but not so much for FSCs; and, overall, a short-run net positive impact after LCC entry.
Footnotes
Appendix
Trivariate Structural Time Series Models with Interventions in Malaga (2004–2018).

| United Kingdom | Germany | ||||||
|---|---|---|---|---|---|---|---|
| Full Service | Charter | Low Cost | Full Service | Charter | Low Cost | ||
| Level | 21349.74 | 58001.99 | 207296.24 | Level | 7847.98 | 10035.04 | 4231.75 |
| [0.000] | [0.000] | [0.000] | [0.656] | [0.489] | [0.766] | ||
| Slope | 111.28 | 69.26 | 269.57 | Slope | −126.51 | −8.93 | 23.61 |
| [0.929] | [0.976] | [0.946] | [0.919] | [0.448] | [0.000] | ||
| Seasonal χ2 | 252.24 | 170.91 | 1724.62 | Seasonal χ2 | 422.89 | 2.79 | 620.58 |
| [0.000] | [0.000] | [0.000] | [0.000] | [0.993] | [0.000] | ||
| Volcano | −1975.15 | 1238.67 | −30551.64 | Volcano | −4142.97 | −1295.91 | −3118.88 |
| [0.164] | [0.756] | [0.000] | [0.110] | [0.285] | [0.044] | ||
| Ryanair/ Economic Crisis | −5839.22 | −2453.97 | −601.11 | EasyJet | 4841.89 | −9209.23 | 5241.01 |
| [0.003] | [0.623] | [0.919] | [0.059] | [0.000] | [0.003] | ||
| Bankruptcies | 4486.1 | −7591.29 | −1057.09 | Malaga Terminal | 1851.77 | −392.22 | 4478.13 |
| [0.024] | [0.129] | [0.858] | [0.466] | [0.797] | [0.011] | ||
| Monarch | −192.41 | −25273.49 | −3652.68 | Malaga Runway | 162.01 | 9.67 | 414.04 |
| [0.923] | [0.000] | [0.542] | [0.462] | [0.958] | [0.023] | ||
| Air Berlin | −4423.18 | −619.28 | −824.19 | ||||
| [0.099] | [0.706] | [0.683] | |||||
| Lauda | −3221.96 | −713.41 | 4743.83 | ||||
| [0.228] | [0.666] | [0.021] | |||||
| Normality | 9.54 | 0.37 | 3.43 | Normality | 16.75 | 61.34 | 19.17 |
| [0.008] | [0.831] | [0.180] | [0.000] | [0.000] | [0.000] | ||
| Heteroscedasticity | 0.346 | 0.463 | 0.881 | Heteroscedasticity | 0.708 | 0.065 | 3.904 |
| [1.000] | [0.997] | [0.678] | [0.896] | [1.000] | [0.000] | ||
| Durbin-Watson | 1.766 | 1.567 | 1.465 | Durbin-Watson | 1.783 | 1.551 | 1.441 |
| Serial Autocorrelation | 142.02 | 92.535 | 176.85 | Serial Autocorrelation | 25.451 | 88.445 | 51.705 |
| [0.000] | [0.000] | [0.000] | [0.228] | [0.000] | [0.000] | ||
| R 2 | 0.96977 | 0.96624 | 0.98174 | R2
|
0.94389 | 0.93483 | 0.98165 |
| R2s | 0.17274 | 0.28193 | 0.57913 | 0.32303 | 0.27242 | 0.63773 | |
| p.e.v. | 5.1738 10^6 | 3.1503 10^7 | 6.9114 10^7 | p.e.v. | 8.7651 10^6 | 2.6158 10^6 | 4.6611 10^6 |
Note: p.e.v. = prediction error variance.
Declaration of Conflicting Interests
The author(s) declared no potential conflicts of interest with respect to the research, authorship, and/or publication of this article.
Funding
The author(s) disclosed receipt of the following financial support for the research, authorship, and/or publication of this article: Juan L. Eugenio-Martin acknowledges funding provided by the Spanish Ministry of Economy and Competitiveness Research Grants Scheme ECO2016-80268-R and Ubay Perez-Granja wants to acknowledge PhD funding provided by Universidad de Las Palmas de Gran Canaria under the “Programa Predoctoral de Formación del Personal Investigador de la ULPGC.”