



Abstract
Using regional data encompassing 155 Nomenclature of Territorial Units for Statistics (NUTS) regions across the EU-28 member states, we estimate the effect of tourist arrivals (total, domestic, and foreign) on regional growth over 2000-2018. Our empirical strategy tackles three data properties that cripple common econometric approaches: cross-section dependence, nonstationarity, and the endogeneity of the regressors. In addition to “pooled” models that assume common parameters across regions, we run “heterogeneous” models where parameters are allowed to differ between regions. Results of the pooled estimations show that domestic and total tourism inflows have positively and significantly contributed to growth, and the positive effect of foreign tourism is statistically discernible in regions that are mainly destinations for foreign tourists. Findings based on region-specific regressions reveal that the average impact on regional growth of tourist inflows is positive and significant, and large regional disparities in terms of the growth impact of domestic/foreign tourism exist.
Keywords
Introduction
International tourism plays an important role in worldwide economy. According to the United Nations World Tourism Organization (UNWTO 2019), total export earnings from international tourism were US$1,586 million in 2017 and grew by 4% in 2018. On the other hand, domestic tourism remains the leading form of tourism: in 2017, its contribution to total tourism spending was 73% (WTTC 2018).
This article uses the Solow growth model to investigate the impact of total tourist arrivals, domestic arrivals, and foreign arrivals on regional economic growth in 155 European regional economies across the 28 countries of the European Union (EU) over 2000–2018. The sample we consider in this article is a mix of different Nomenclature of Territorial Units for Statistics (NUTS) levels. The chosen subcountry regions are administrative regions that have an administrative power to implement tourism marketing strategies and policies. The advantage of this approach is that it links geography with policy implementation and management.
Essentially, the article has two objectives: estimating the effects of tourism inflows (total, domestic, and foreign) on regional growth in the EU-28 and examining the extent of potential regional differences in terms of the latter effects. Investigating the economic impact of tourism at a regional level is more informative than a country-level analysis. Indeed, tourism may have a heterogeneous economic impact across regions within the same country, irrespective of its overall impact at the country level. Country-based studies focus on the “aggregate” impact of tourism while remaining blind as to the possible regional heterogeneity. The eventual unevenness of the growth-effect of tourism across regions would reflect relevant regional disparities in terms of social, economic, and natural characteristics. Thus, within the same country, tourism might be beneficial for the growth of some regions, whereas it could adversely affect others. In addition, disaggregating tourism flows into domestic and foreign tourists is key because they usually have different characteristics, consumption behavior, and preferences (Stone and Nyaupane 2019). Such differences would modulate the way they impact regional growth. For example, unlike most foreign tourists, domestic tourists speak the language of the country and are familiar with its transportation system. Moreover, they do not depend on the instruction of the tour operators, may use their own cars, and can move freely in the destination area. Furthermore, contrary to foreign tourists, domestic tourists are rarely attracted by highly commercialized cultural events and culinary places. They are more interested in regular and local events and consume local products (Seckelmann 2002). This suggests that the two types of tourists do not contribute to regional economic growth in the same way.
The novelty of the present study is threefold. First, we carry out an estimation strategy—implemented for the first time in the tourism economics literature—that takes into account three issues that have recently been brought to light in empirical growth analysis but were neglected when investigating the link between tourism and growth. The first two are the cross-section correlation and the endogeneity of the variables. Our empirical approach tackles the latter concerns, yielding unbiased results, without imposing hypothesized structures on the nature, path, and magnitude of cross-region correlations. It thus differs from standard spatial econometrics, controlling mainly for distance-based spatial interdependencies. The third concern is the nonstationarity of the variables: our methodology accommodates this and prevents spurious findings. Second, in the context of regional disparities as to the economic consequences of tourism flows, our empirical setting allows us to run region-specific regressions and obtain region-specific coefficients. The latter reveal regional differences in the growth impact of tourism in terms of its magnitude and sign. This result is important to central and regional authorities since it helps them in setting the right tourism policies and marketing strategies in order to improve the regional growth impact of tourism. Third, our paper expands the geographical breadth of previous literature that tackled the regional economic effect of tourism in Europe. Indeed, this study undertakes a comprehensive analysis of the tourism sector in the EU-28—the most visited region in the world, accounting in 2018 for 50.6% of all international arrivals (UNWTO 2019)—while considering regional disparities. It extends previous studies like Paci and Marrocu (2014) to include Eastern and Southern European countries that joined the EU relatively recently: Cyprus, Czechia, Estonia, Hungary, Latvia, Lithuania, Malta, Poland, Slovakia, and Slovenia (in 2004), Bulgaria and Romania (in 2007), and Croatia (in 2013). These two regions (Eastern and Southern Europe) witnessed a high percentage change in real GDP (respectively 4.72% and 3.71%), total arrivals (respectively, 7.29% and 7.43%), and bed places in the accommodation establishments (respectively, 1.73% and 3.30%)—in per capita terms—between 2014 and 2018. Tourism can therein be used in these countries to catch up the level of standard of living in Northern, Western, and the other Southern European countries.
Our research pinpoints three main results. First, it shows that total and domestic tourist arrivals are significant contributors to regional growth. Second, foreign tourism is found to have a positive and significant effect in regions that especially attract foreign tourists. Finally, regional heterogeneity in terms of the repercussions of domestic and foreign tourism on growth exists across Central, Northern, Southern and Western Europe. The highest effects of domestic tourism are largely centered in Western, Central and Southern Europe (Austria, Bulgaria, Czechia, Germany, Italy, the Netherlands, Romania, and Spain), while the highest effects of foreign tourism are chiefly found in Western and Southern Europe (Croatia, Germany, North of Italy, the Netherlands, Portugal and Spain), Central Europe (Latvia), and Northern Europe (Finland and Sweden).
This article is organized in seven sections. The next section exposes some economic characteristics of the NUTS regions of our sample. The third section discusses the literature review whereas the fourth section presents the empirical model, the methodology, and the variables considered. The fifth and sixth sections go into the findings, while the last section concludes.
Regional Characteristics
We select in this article 155 NUTS regions across the EU-28 member states. 1 The NUTS 2016 classification is considered, and the chosen territorial units listed in Table A1 in the online appendix are “administrative units,” with a local authority that has the power to take administrative or policy decisions. 2
Table 1 shows that between 2000 and 2018, the average of total tourist 3 arrivals per capita in Eastern Europe was 0.66 (66 tourist arrivals per 100 inhabitants), and the average share of domestic arrivals 4 in total arrivals was 62.37%. On the other hand, the average of total tourist arrivals per capita in Western and Southern Europe was higher and equal to 2.46 over the same period. In Western Europe, this high average is driven by domestic tourism: on average over the period, the latter accounted for 66.77% of total tourist arrivals, while in Southern Europe the composition between domestic and foreign arrivals 5 was more balanced. However, if we consider the subgroup of Southern European countries that recently joined the EU (Croatia, Cyprus, Malta, and Slovenia), we notice that the average of total tourist arrivals per capita was 2.56, with a share of foreign arrivals equal to 83%. Finally, the average of per capita total tourist arrivals in Northern Europe was 1.54 and the share of domestic arrivals in total arrivals was 78.85%. This shows clear differences between these four regional blocs in the level and the composition of tourist arrivals.
Average of Tourist Arrivals and Bed Places in Tourist Accommodation Establishments (in Per Capita Terms) over 2000–2018.

Note: New Southern/Mediterranean Europe consists of Southern European countries that joined the EU-28 after 2004: Cyprus (in May 2004), Malta (in May 2004), Slovenia (in May 2004), and Croatia (in July 2013). All Central/Eastern European countries joined the EU either in 2004 or 2007 (Bulgaria and Romania).
A closer investigation of the maps in Figures 1 to 3 reveals clear differences in the spatial distribution of the mean values of real GDP, domestic tourist arrivals, and foreign tourist arrivals—in per capita terms—across the NUTS regions over 2000–2018.

GDP per capita regional distribution.
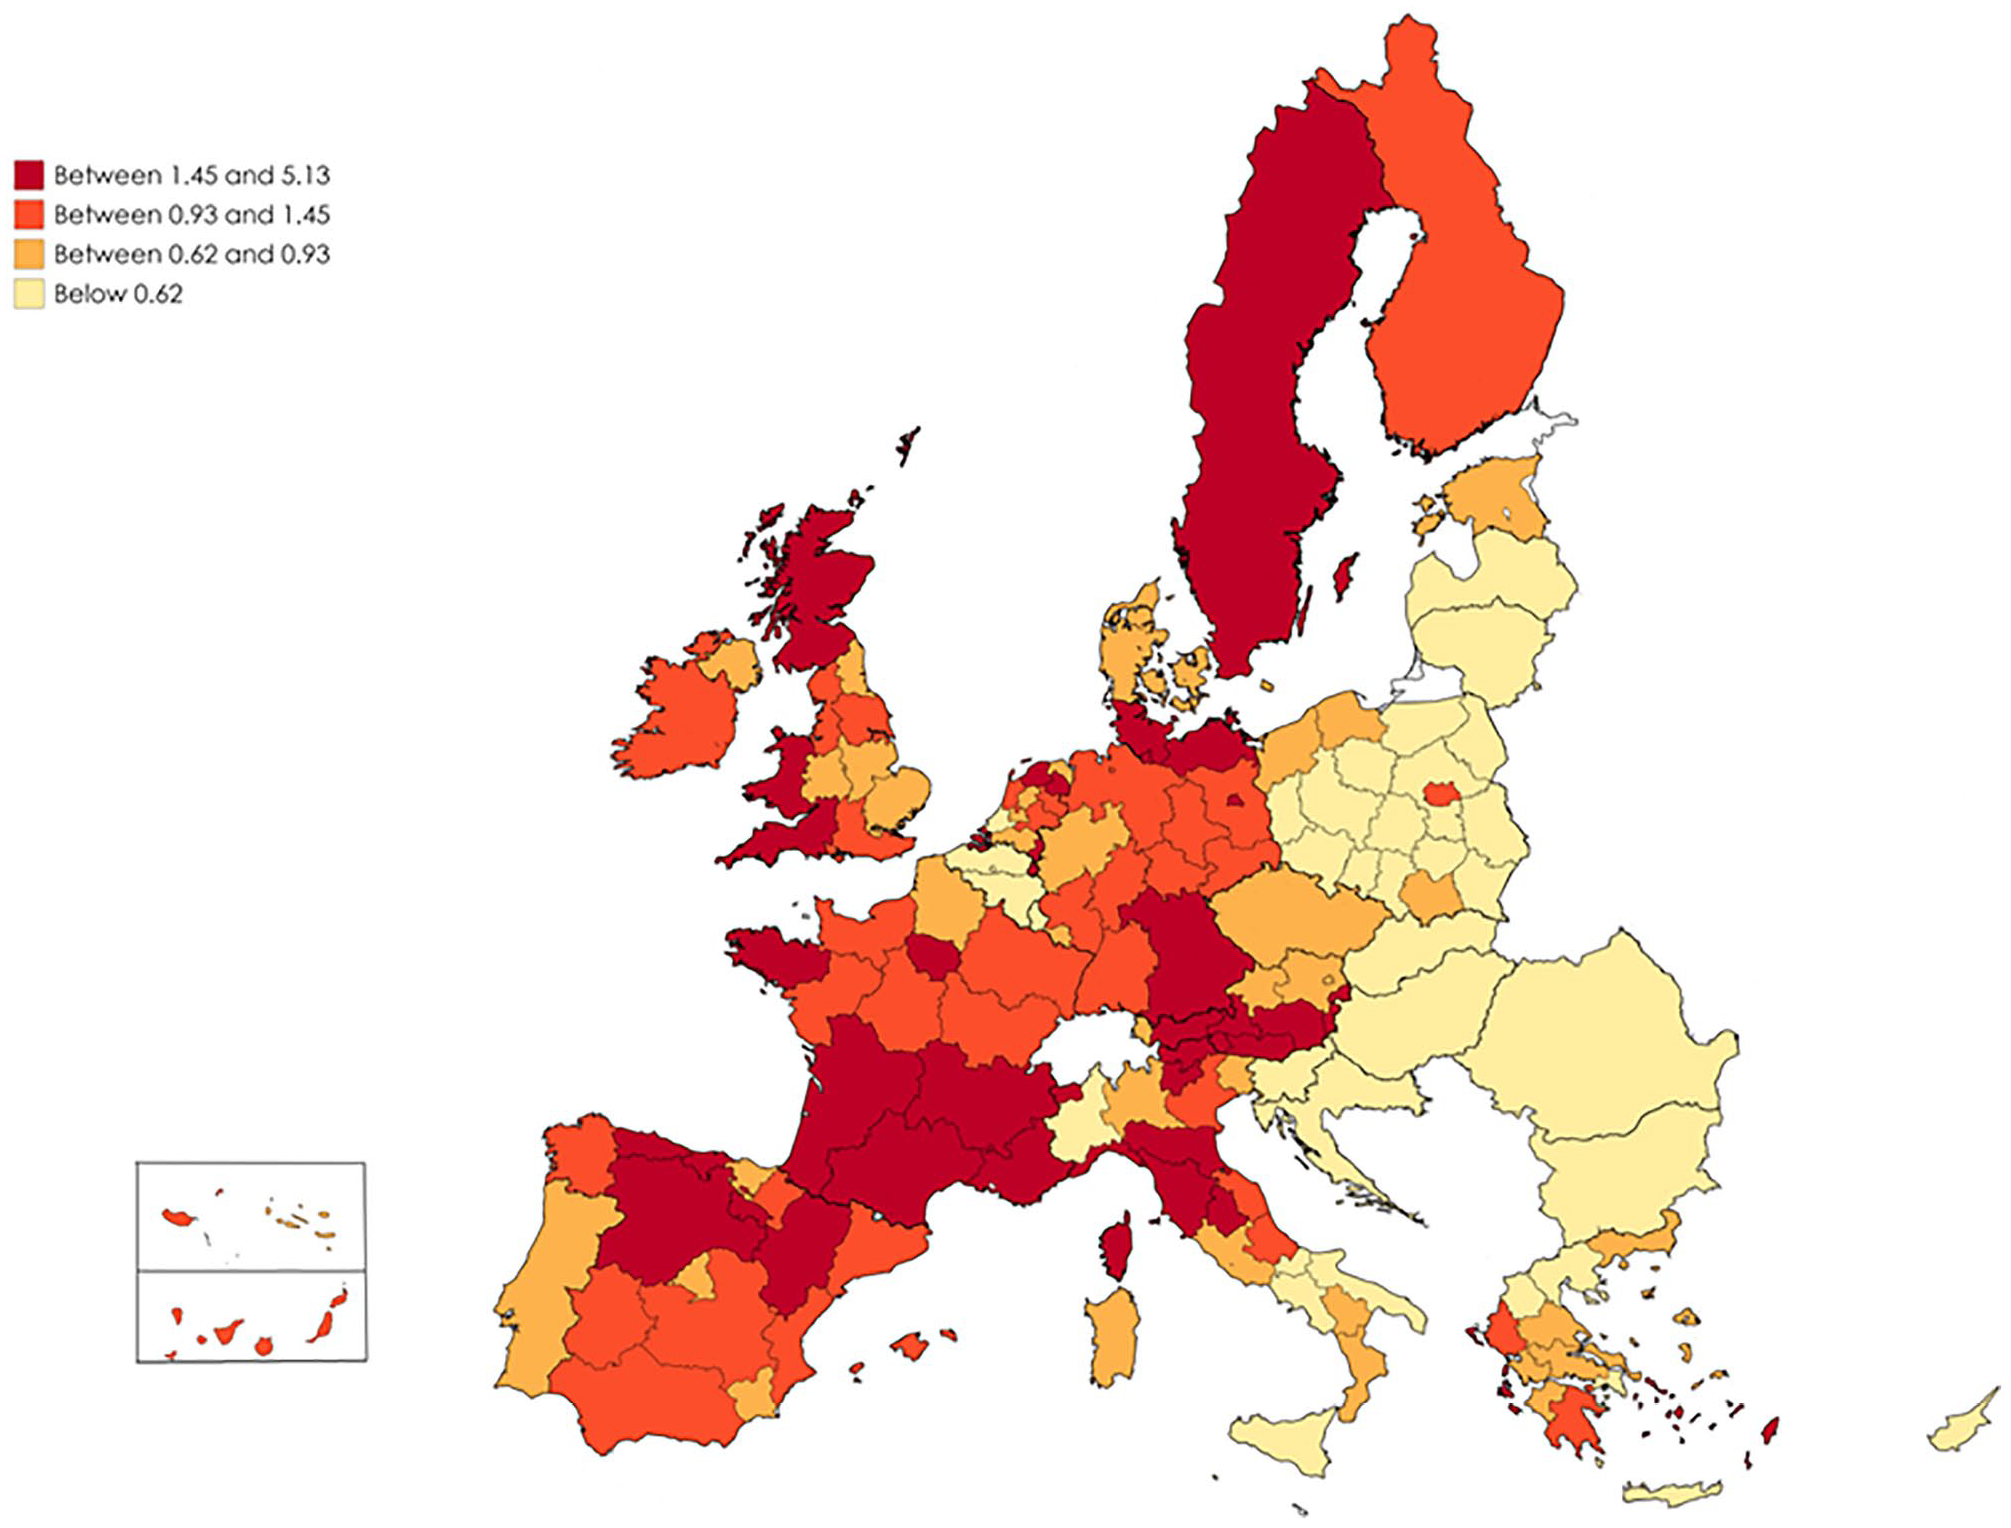
Domestic tourist arrivals regional distribution.

Foreign tourist arrivals regional distribution.
Figure 1 shows that most of the regions in countries in Northern and Western Europe have a moderate or a high real GDP per capita distributed between US$25,000 and US$66,000. This is also the case of Athens, Madrid, and Warsaw with, respectively, an average GDP per capita of US$28,000, US$33,000 and US$46,000. On the other hand, most of the regions in Eastern and Southern Europe have a lower level of GDP per capita (below US$25,000). Clear regional income disparities are noticed in the case of East and West of Germany, North and South of Italy, and Flanders and Wallonia regions in Belgium.
Figure 2 shows differences in the distribution of domestic tourist arrivals per capita. First, in most of the regions in East and South of Europe, the mean value of domestic tourist arrivals per capita throughout the period covered does not exceed 0.93. On the other hand, in most of Northern and Western European regions, this figure exceeds 0.93 and can reach 5.13. Moreover, the highest distribution of domestic tourist arrivals per capita (with a ratio greater than or equal to 1.45) is mainly in western and northern European countries in addition to north of Italy, north of Spain, and some Greek islands. We also notice a clear geographical pattern for domestic tourism: regions with the highest domestic tourist arrivals per capita are in their majority coastal regions, with few exceptions in some mainland regions in Austria, France, Germany, Italy, and Spain. 6 Second, Figure 2 shows disparities at the country level in terms of domestic tourism: (a) in Austria and France, it is denser in the South; (b) it is more dense in the North of Italy, Germany, the Netherlands, and Spain; (c) in the United Kingdom, domestic tourism is higher in Scotland and the West; (d) while in Greece, it is greater in the islands.
Compared to the distribution of domestic tourists per capita, we notice from Figure 3 that foreign arrivals in per capita terms are less dispersed and mainly concentrated in Mediterranean coastal regions and capital cities. In fact, the mean value of foreign arrivals per capita across the period is high and exceeds 0.71 in (a) most of the capital cities of Western European countries; (b) the two small island-countries, Cyprus and Malta, (c) the two Outermost regions (the Canary islands in Spain and the Madeira archipelago in Portugal), (d) and the different islands in the Mediterranean sea attached to France, Greece, and Spain. Figure 3 also shows a moderate to high foreign tourist arrivals per capita distribution (with a ratio greater than 0.39) in the narrow strip of South of Europe starting in Portugal and ending in the center of Italy. Contrary to domestic tourists, foreign tourists seem to be more inclined to travel South. We identified in our sample 39 regions considered to be mostly foreign tourist destinations. 7 Twenty-nine of those 39 regions are located in Western or Southern Europe and hosted around 45% of total foreign tourist arrivals between 2000 and 2018.
Table 2 highlights three interesting findings. First, across the four regional blocs, Central and Southern Europe have known the highest average annual growth rates for total arrivals and real GDP (both in per capita terms) over 2000–2018. Second, in Eastern European countries, the average annual growth rate of per capita foreign tourist arrivals was 7.94% between 2000 and 2004 (before joining the EU) while it registered 6.24% between 2014 and 2018 (after joining the EU). This suggests that even though on average the level of foreign arrivals per capita was low in Eastern Europe (as Table 1 and Figure 3 show), its growth rate was high and steady. As for per capita domestic arrivals, we notice a substantial increase in the average annual growth rate from 2.64% to 7.88% across the two subperiods: domestic tourism seems to have driven the high average annual growth in total arrivals per capita in Eastern Europe after 2014 (7.43%). This was also accompanied with an increase in the accommodation capacity: the number of bed-places per capita increased on average by 3.3% per annum after 2014 (the highest across all regional blocs) compared to only 0.73% between 2000 and 2004. Third, the average annual growth rates of total and foreign tourist arrivals per capita in Cyprus, Malta, Slovenia, and Croatia (“New” Southern Europe) increased between the 2000–2004 period and the 2014–2018 period (from, respectively, 2.66% and 3.39% to, respectively, 7.29% and 8.07%). In addition, the latter period witnessed an increase in the growth rate of bed-places in accommodation establishments per capita: with an average annual growth rate of 1.73% (the second highest among the regional blocs).
Average Annual Growth Rates of per Capita Variables.
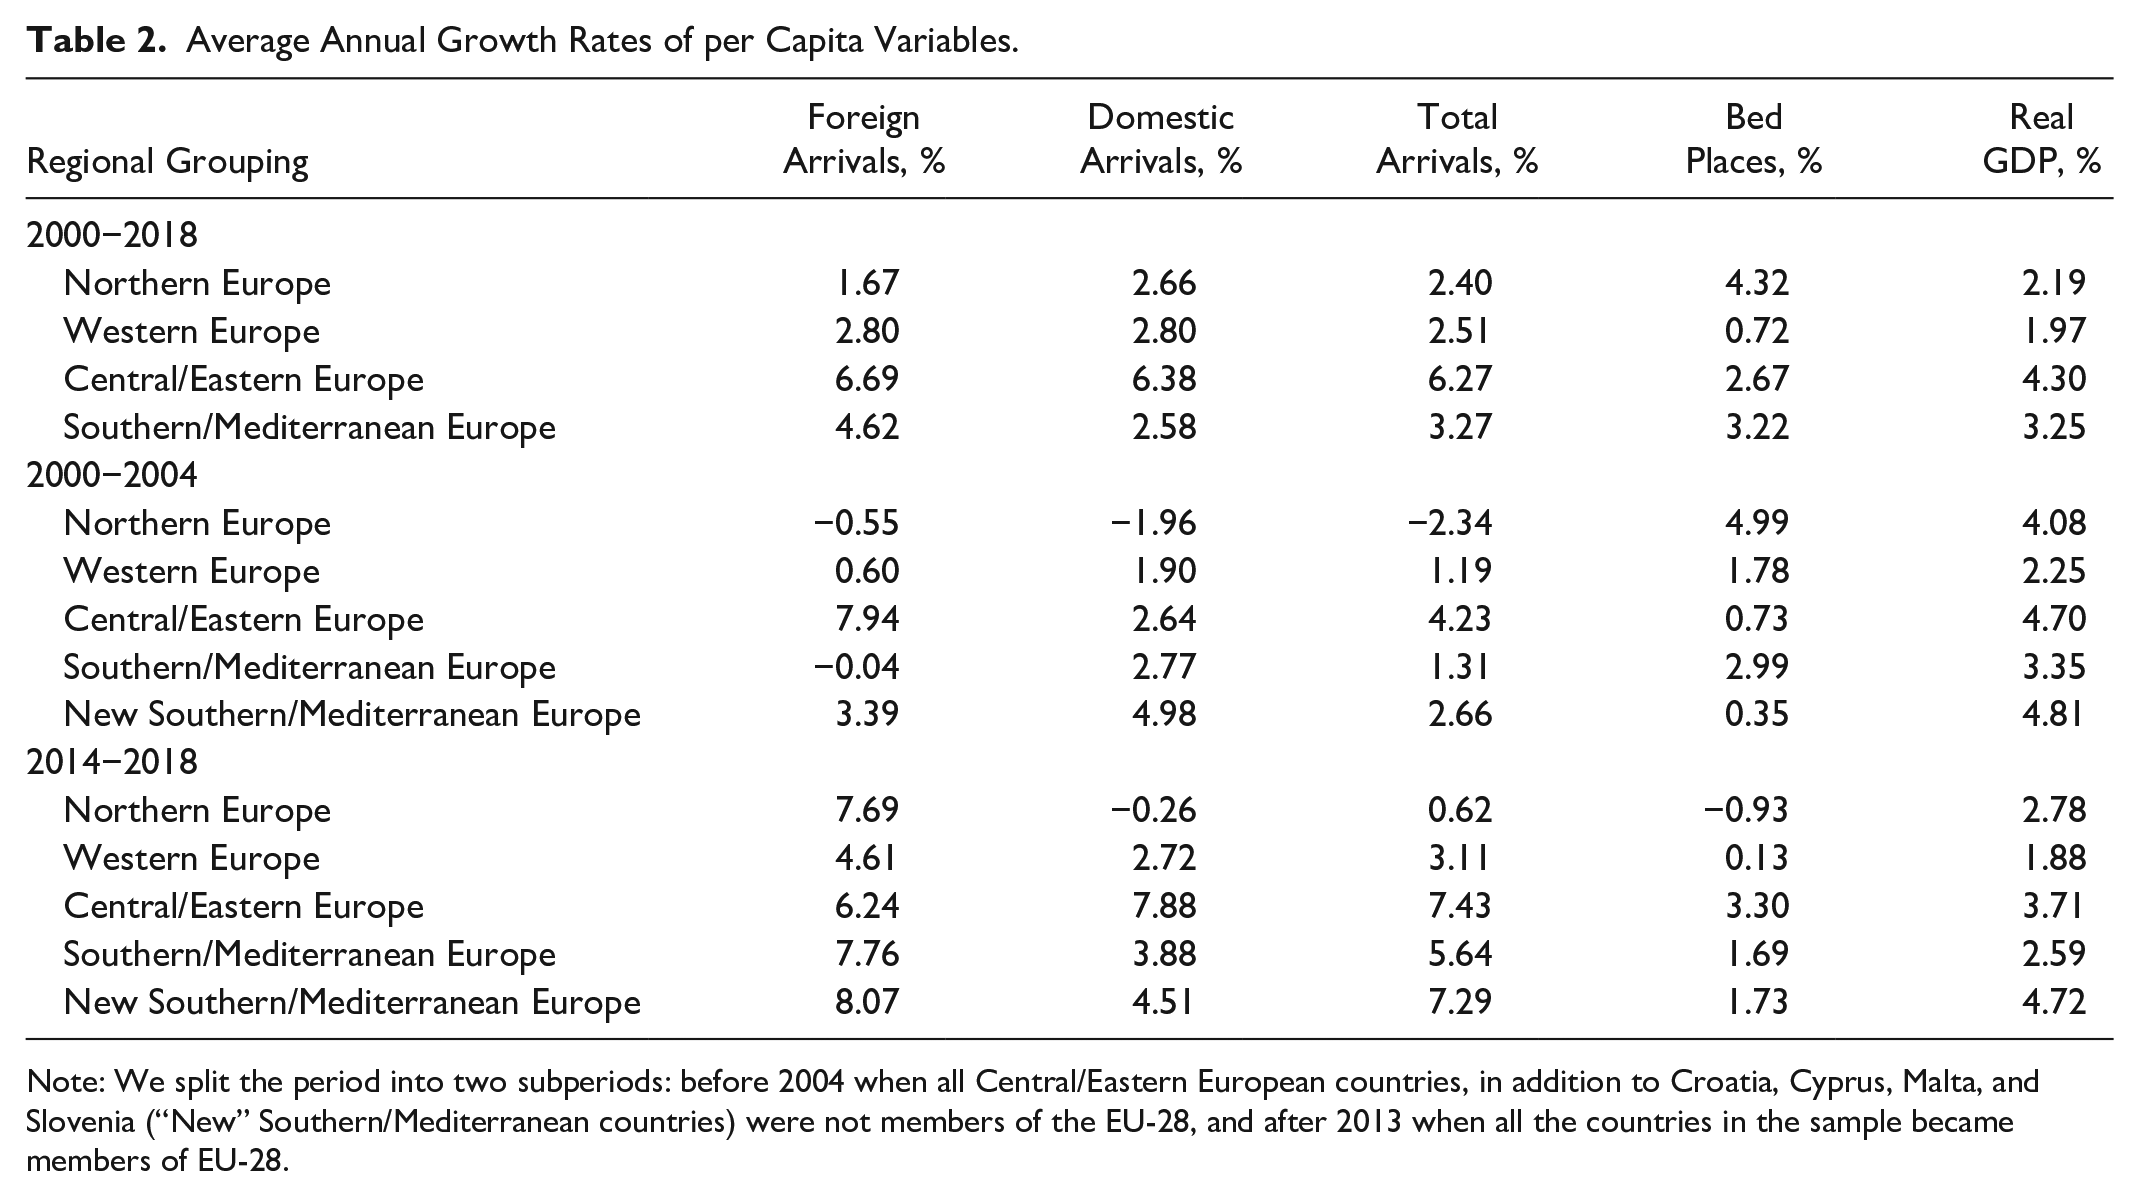
Note: We split the period into two subperiods: before 2004 when all Central/Eastern European countries, in addition to Croatia, Cyprus, Malta, and Slovenia (“New” Southern/Mediterranean countries) were not members of the EU-28, and after 2013 when all the countries in the sample became members of EU-28.
We can hence conclude that the most dynamic countries in terms of tourist arrivals and tourist accommodation capacity, notably during 2014–2018, have been those countries that have recently joined the EU. In this regard, a “catch up” process may be at play between the latter countries and the rest of the EU members.
Literature Review
The first wave of studies investigating the growth-effect of tourism were country-based and mainly considered international tourism (Katircioglu 2009; Proença and Soukiazis 2008; Cortés-Jiménez and Pulina 2010; Massidda and Mattana 2013; Surugiu and Surugiu 2013; Du, Lew, and Ng 2016). Such models driven from the “endogenous growth theory” and the export-led growth hypothesis developed by Balassa (1978) included international tourism in the production function as a nonstandard type of exports. Recent developments in the tourism literature have pinpointed three key shortcomings of the first generation of studies and sought to bridge the gap in this regard.
The first limitation of country-based research is that it neglects domestic tourism. Neglecting domestic tourism could however underestimate the overall impact of the tourism industry on economic growth. This can be thoroughly investigated when the analysis is conducted at regional level. Indeed, the “economic-base theory” explains how tourism activities (including domestic tourism) generate regional income. Underlying the latter theory is its distinction between two types of regional activities: “basic activities” (encompassing activities generating income from extra-regional sources: from the region’s exports of goods and services) and “nonbasic activities” (consisting of local activities generating income from within the region). The theory posits that inflows of external incomes generated by basic activities underpin economic growth at the local level. In this regard, tourists (whether domestic or foreign) feed local markets through external consumer spending (Haddad, Porsse, and Rabahy 2013; Ruault 2017; Poinsot and Ruault 2019) despite uncertainties about its magnitude and its potential crowding-out effect (Blake 2009). Such a conceptual framework distinguishes between international and domestic tourists and both are considered potential sources of income injections in a regional economy.
The second limitation of country-based research is that it overlooks the potential of growth-impacting effects of tourism at a regional level. For instance, the tourism industry may be more advanced in some regions because of their endowment in terms of culture-based activities, science-based activities, and world heritage sites and for being known as “sun, sea and sand” destination vacations (de la Mata and Llano 2012; Patuelli, Mussoni, and Candela 2013; Marrocu and Paci 2013; Cruz 2014; Alvarez-Diaz, d’Hombres, and Ghisetti 2017; Pompili, Pisati, and Lorenzini 2019). The relation between tourism specialization and economic growth is well established in the country-based literature (Brau, Lanza, and Pigliaru 2005, 2007; Sequeira and Nunes 2008). Tourism specialization can be also observed at a regional level, and the tourism specialization and growth nexus would also hold at the regional level. Hence, recently, a new line in the tourism economics literature investigated the impact of tourism on regional growth and found an overall positive impact (Cortés-Jiménez 2008; Proença and Soukiazis 2008; Paci and Marrocu 2014; Li et al. 2016; Kostakis and Theodoropoulo 2017; Liu, Nijkamp, and Lin 2017).
However, tourism can also have adverse effects on regional growth via a flurry of channels (Li et al. 2016; Liu, Nijkamp, and Lin 2017). First, specialization in tourism could lead to a reduced efficiency in the production of goods and services and a lower productivity growth. In fact, compared to technologically progressive activities in which innovation, capital accumulation, and economies of scale play an important role, service activities like tourism are labor-intensive and labor itself is, to a large extent, the end product. Since labor productivity is difficult to raise, specialization in tourism would restrict growth in productivity, which would negatively affect the potential for long-term growth (Baumol 1967; Parilla, Font, and Nadal 2007).
Second, tourism-based economies are in general poorly endowed in qualified human capital. An explanation for the low propensity to train workers in the latter economies can be found in the Heckscher-Ohlin theorem: in tourism economies, qualified workers (the scarce factor) are relatively ill-rewarded while nonqualified workers (the abundant factor) improve their relative income because of the increase in the relative price of tourism service. Thus, specialization in tourism would discourage investments in professional training, which improves workers’ qualifications (Parilla, Font, and Nadal 2007). Tourism-based economies would therein be largely dependent on relatively unskilled human capital with adverse growth effects.
Third, tourism makes intensive use of natural resources, and its comparative advantage largely relies on natural resource endowment (Brau, Lanza, and Pigliary 2007). Moreover, the overtourism phenomenon is typically associated with negative environmental consequences: environmental pollution, destruction of natural resources, and environmental degradation (Kim, Uysal, and Sirgy 2013; Peeters et al. 2018; Zuo and Songshan 2018). Further, overtourism is likely to depreciate natural resources, which would lead to an economic deterioration over the long term because tourism is resource-based (Parilla, Font, and Nadal 2007).
Fourth, an overdependence on tourism could destroy jobs in other sectors, especially in primary industries like farming, fishing, and mining (Luo and Bao 2019). Symptoms of Dutch Disease may result in this case, leading to a distortion of the real exchange rate and a de-industrialization that would have a negative impact on welfare (Chao et al. 2006; Lin, Yang, and Li 2019). It can also lead to seasonal unemployment, mainly in regions where tourism depends on natural and social factors (Trajkov, Biljan, and Andreeski 2016).
A third limitation of country-based studies is their inability to allow for a differential in the impact of domestic and foreign tourist arrivals on regional growth. Yet, possible differences as to the ways each of domestic and foreign tourism affects regional growth are highly likely. For instance, the difference in tastes between guests and hosts is much smaller in the case of domestic tourists than international tourists. Thus, the demand of the former is typically more geared toward local products (Xu 1999). Furthermore, the variety of regional tourism resources and facilities determines the type of tourist arrivals visiting the region: domestic versus international tourists. For instance, cultural endowment (number of museums, world heritage sites, and diffusion of cultural events) is a relevant pull factor for domestic and international tourists (Pompili, Pisati, and Lorenzini 2019) while natural endowments (seaside, weather conditions, beach quality, and mountain tourism) are relevant chiefly for domestic tourists (de la Mata and Llano 2012; Patuelli, Mussoni, and Candela 2013; Marrocu and Paci 2013; Alvarez-Diaz, d’Hombres, and Ghisetti 2017). In addition to this, the demographic structure of the regions would affect the type of tourism among regions. For instance, immigration has been shown to have a significant positive impact on international tourism flows at a country level (Seetaram 2012; Griffin and Dimanche 2017). This argument can be extended to the case of regions. The distribution of the foreign-born residents within and across regions would have differing effects in driving international tourists at a regional level (Shafiullah, Okafor, and Khalid 2019). Also, interregional migration would have a positive impact on domestic tourism (de la Mata and Llano 2012, 2013). Ignoring such regional disparities and ensuing type of attracted tourists (domestic/foreign) would overlook potential differences between domestic and foreign tourism as to their effect on regional growth.
Model, Data and Estimation Strategy
Empirical Setting and Sample Data
Our empirical investigation follows a well-established tradition that employs the augmented Solow model, couched in a dynamic panel data setting. We estimate equation (1) using annual data for 155 regions across the EU-28 member countries over a period of 19 years (2000–2018).

with
Our second specification is similar to equation (1) in every aspect, except that it disaggregates total tourist arrivals into domestic tourist arrivals

Equation (2) enables us to shed light on possible differences in terms of the significance and the magnitude of the economic repercussions of domestic and foreign tourism.
Our empirical specifications reflect the “canonical” counterpart of the augmented Solow model. As such, they do not explicitly consider the effect of other variables that are often added to the model, some of which are time-invariant panel specific while others are time-varying panel based. The main reason is that such data are mostly unavailable at the regional level. However, the combination of panel-specific effects (
Table A1 in the online appendix presents the sample countries along with the number of regions considered across the latter. Compared with research previously undertaken on the regional economic effects of tourism in Europe (Cortés-Jiménez 2008; Marrocu and Paci 2014; Kostakis and Theodoropoulou 2017), our sample is markedly larger and encompasses countries, notably from Eastern Europe, that were not covered in past papers. Table A4 in the online appendix presents key summary statistics based on the data collected across our panel units.
Estimation Strategy
Our empirical strategy considers several estimators with contrasting assumptions concerning the data-generating process of equations (1) and (2). Specifically, the employed estimators differ across two lines of demarcation according to (a) whether they consider a homogeneous (FE, GMM, CCEP) or a heterogeneous (CDMG, MG, CCEMG) impact of a regressor on the growth rate, and (b) whether they hypothesize a common effect (FE, GMM, CDMG) of unobservable shocks across all regions or allow for differences in terms of the effects of shocks across the panels (CCEP, MG, CCEMG). 8 Such a comparative approach is recommended when investigating the relationship between tourism and economic growth since estimates are usually sensitive to the model specification and the estimation techniques (Castro-Nuño, Molina-Toucedo, and Pablo-Romero 2013; Nunkoo et al. 2020).
Pooled estimators: an overview
The pooled estimators assume common parameters across all panels (
Heterogeneous parameters: an overview
The heterogeneous estimators allow for panel-specific growth equations (Eberhardt and Teal 2011). The heterogeneous estimation procedure operates in two stages: at first, region-country–based regressions are estimated through the ordinary least squares (OLS) estimator; then the estimators are averaged across the panels (Eberhardt 2012; Eberhardt and Teal 2013).
Among those estimators, the MG and CCEMG permit a differentiated effect of the unobservables across the panels. While employing the MG estimation, this is done by augmenting the region-specific regressions with panel-specific time trends (
Findings
Preestimation Analysis
Table A6 of the online appendix investigates the cross-section dependence and the time series properties of the data used in our empirical analysis. The table reports the Pesaran (2015) cross-section dependence (CD) test statistics across our variables as well as the corresponding p value for the null hypothesis of weak cross-section dependence. There is evidence of strong cross-section dependence among all our variables as the null hypothesis is rejected. The table also reports the findings of two panel unit root tests, the Maddala and Wu (1999) test and the Pesaran (2007) CIPS test. Both tests suggest nonstationary series in the case of real GDP, the investment ratio, as well as domestic tourist arrivals.
Altogether, the results indicate that some of our variables are stained with cross-section dependence and nonstationarity. This could have some severe implications on the estimation procedure: cross-sectional dependence could lead to biased estimates, while nonstationarity would preclude sound statistical inferences (Pesaran 2006; Kao 1999). Against this backdrop, our empirical strategy employs a number of estimators that are a priori well equipped to deal with the two aforementioned issues.
In what follows, we first report the results of the estimation of equations (1) and (2) assuming pooled parameters, before laying out the findings of the heterogeneous-parameter estimators. In each case, the choice of our “preferred” estimator is chiefly guided by the residuals’ diagnosis: we investigate the residuals’ cross-section dependence (CD test; Pesaran 2015) and time series properties (CIPS test; Pesaran 2007) across all implemented estimations and interpret the presence of cross-sectional dependence and nonstationarity as evidence of misspecification. We also report a goodness of fit measurement: the root mean square error (RMSE).
Results of the Pooled Parameter Estimations
The effect of total tourist arrivals on growth
Table 3 lays out the results of the pooled estimators of equation (1). The estimates corroborate the predictions of the augmented Solow model. Our results show a negative impact for lagged GDP. This suggests the existence of conditional convergence among the regions considered in the sample (Figini and Vici 2010; Paci and Marrocu 2014). Similar to Proença and Soukiazis (2008) and Li et al. (2016), we find that population growth rate reduces the growth rate of GDP. Moreover, education and investment are found to positively impact the GDP growth rate. 9 This result goes in line with the findings of Cortés-Jiménez (2008), Li et al. (2016), Kostakis and Theodoropopoulou (2017), and Liu, Nijkamp, and Lin (2017).
Results of Pooled Models with Total Tourist Arrivals per Capita as Our Tourism Measurement.
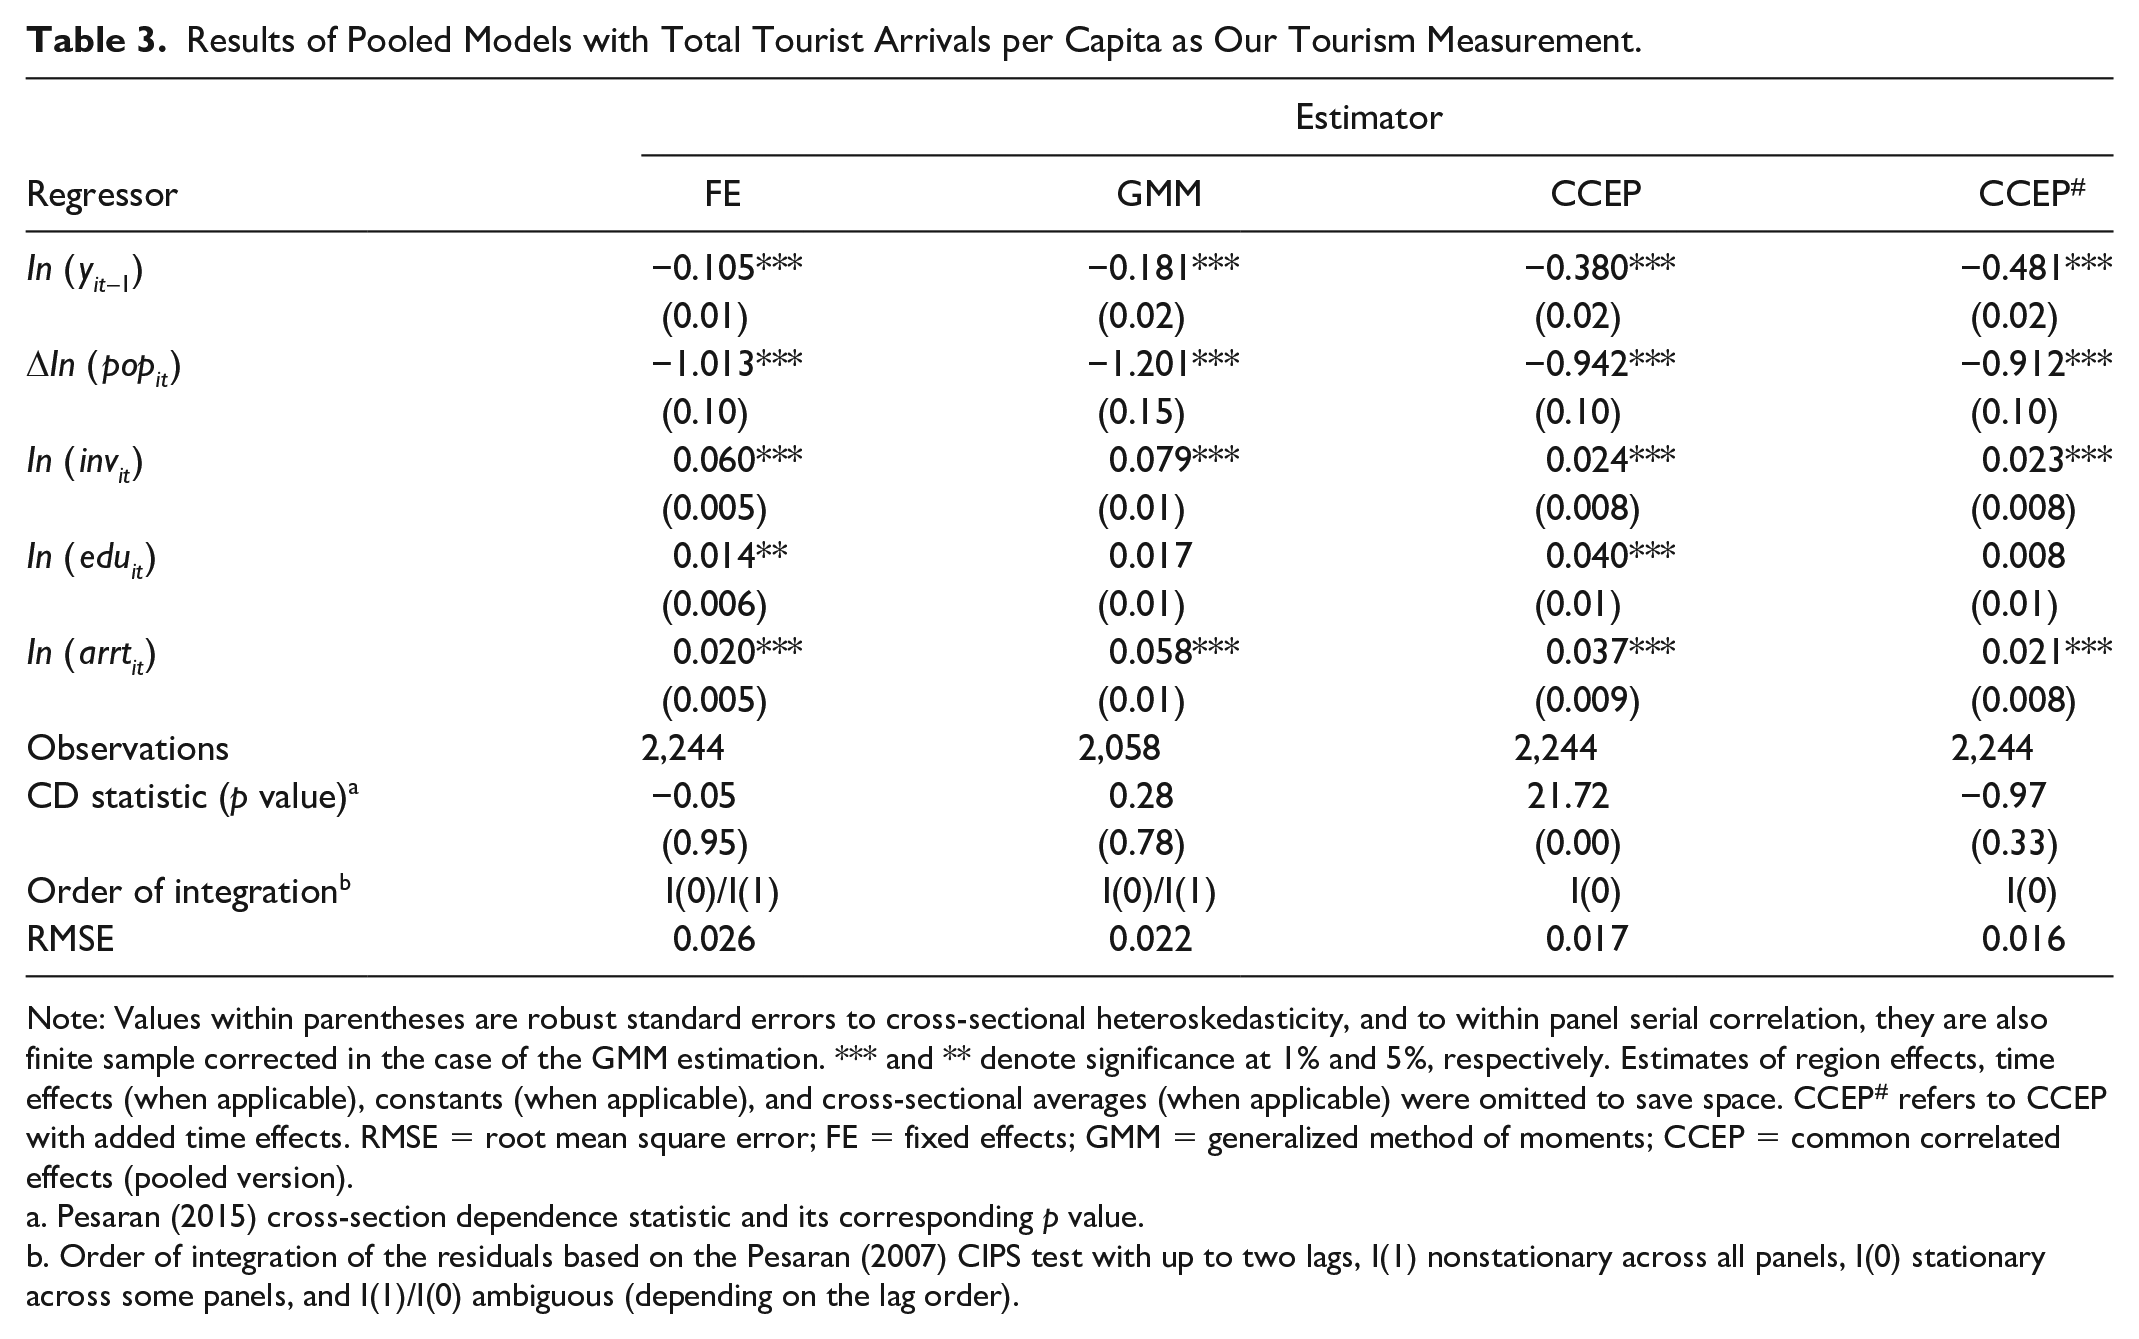
Note: Values within parentheses are robust standard errors to cross-sectional heteroskedasticity, and to within panel serial correlation, they are also finite sample corrected in the case of the GMM estimation. *** and ** denote significance at 1% and 5%, respectively. Estimates of region effects, time effects (when applicable), constants (when applicable), and cross-sectional averages (when applicable) were omitted to save space. CCEP# refers to CCEP with added time effects. RMSE = root mean square error; FE = fixed effects; GMM = generalized method of moments; CCEP = common correlated effects (pooled version).
Pesaran (2015) cross-section dependence statistic and its corresponding p value.
Order of integration of the residuals based on the Pesaran (2007) CIPS test with up to two lags, I(1) nonstationary across all panels, I(0) stationary across some panels, and I(1)/I(0) ambiguous (depending on the lag order).
Before turning the spotlight on the effect of the main variable of interest, tourism, we have a look at the residuals’ diagnostics. The estimators that manage to wipe out strong cross-section dependence are the FE, GMM, and the CCEP augmented with time effects. Unlike the standard CCEP estimator, the former three account for universal shocks with a common effect across all regions. This would point to the fact that shocks that affected our sample over the period covered were largely all-encompassing and have had a homogeneous impact across the regions. The worldwide energy crisis with sharp increases in the price of oil during 2003–2008, and the so-called “Great recession” of 2007–2009 are cases in point. This could also pinpoint the deepening of the economic integration across the EU-28 member states: the implemented policies and measures, at both the country and regional levels, have presumably strengthened the interconnections among the member states over time to such an extent that most of the disturbances have been common across the Union.
Although the FE and GMM estimators seem to address the cross-section dependence appropriately, their residuals are however potentially nonstationary, which precludes sound inference given the likely spurious results. On the other hand, the CCEP as well as the CCEP with time effects yield stationary residuals. Overall, the well-behaved CCEP with time effects’ residuals preclude possible biases and “spurious” results. Accordingly, our preferred estimator is the CCEP augmented with time effects: making place for shocks that could have a nuanced effect depending on the regions (e.g., European debt crisis), as well as universal shocks with a common impact across the latter (e.g., energy crisis).
Our preferred model suggests that a 1% increase in total tourist arrivals would boost regional growth by 0.021%. In view of the most relevant article to the present investigation (Paci and Marrocu 2014), the impact of tourism on regional growth that we found is noticeably smaller in magnitude. 10 At least two factors could be driving this difference. First, our sample of countries is markedly larger than the one covered by the previous study; in particular, it includes 18 countries, notably from Eastern Europe, that were not covered by Paci and Marrocu (2014). Among the latter 18 countries, several are not considered as top touristic destinations and/or relatively lack the relevant geographical/infrastructural/institutional framework, as well as the know-how that would magnify the economic dividends of tourist arrivals. Thus, the lower effect of tourism on regional growth that we pick up is likely reflecting our larger and more diversified sample. Second, while the aforementioned study’s estimation strategy factors in nearby-regional spillovers, it does not properly accommodate shocks that are not geographically clustered and shocks that are common but affecting the panels at varying degrees. In the event that such shocks correlate with the tourism explanatory variable used in the model, the effect of tourism on growth would be biased.
The effects of domestic and foreign tourist arrivals on growth
Table 4 shows the estimation results of equation (2) and some of its variants. The findings validate the predictions of the augmented Solow model in terms of the signs and significance of the lagged value of real GDP, population growth, and the investment ratio; the educational attainment has the expected sign but its significance varies with the applied estimation. Further, all estimators acknowledge a statistically significant and positive contribution of domestic tourism to growth, whereas only the CCEP estimator with no time effects detects a significant effect for foreign tourism (column 5).
Results of Pooled Models with Domestic and Foreign Tourist Arrivals per Capita as Our Tourism Measurements.
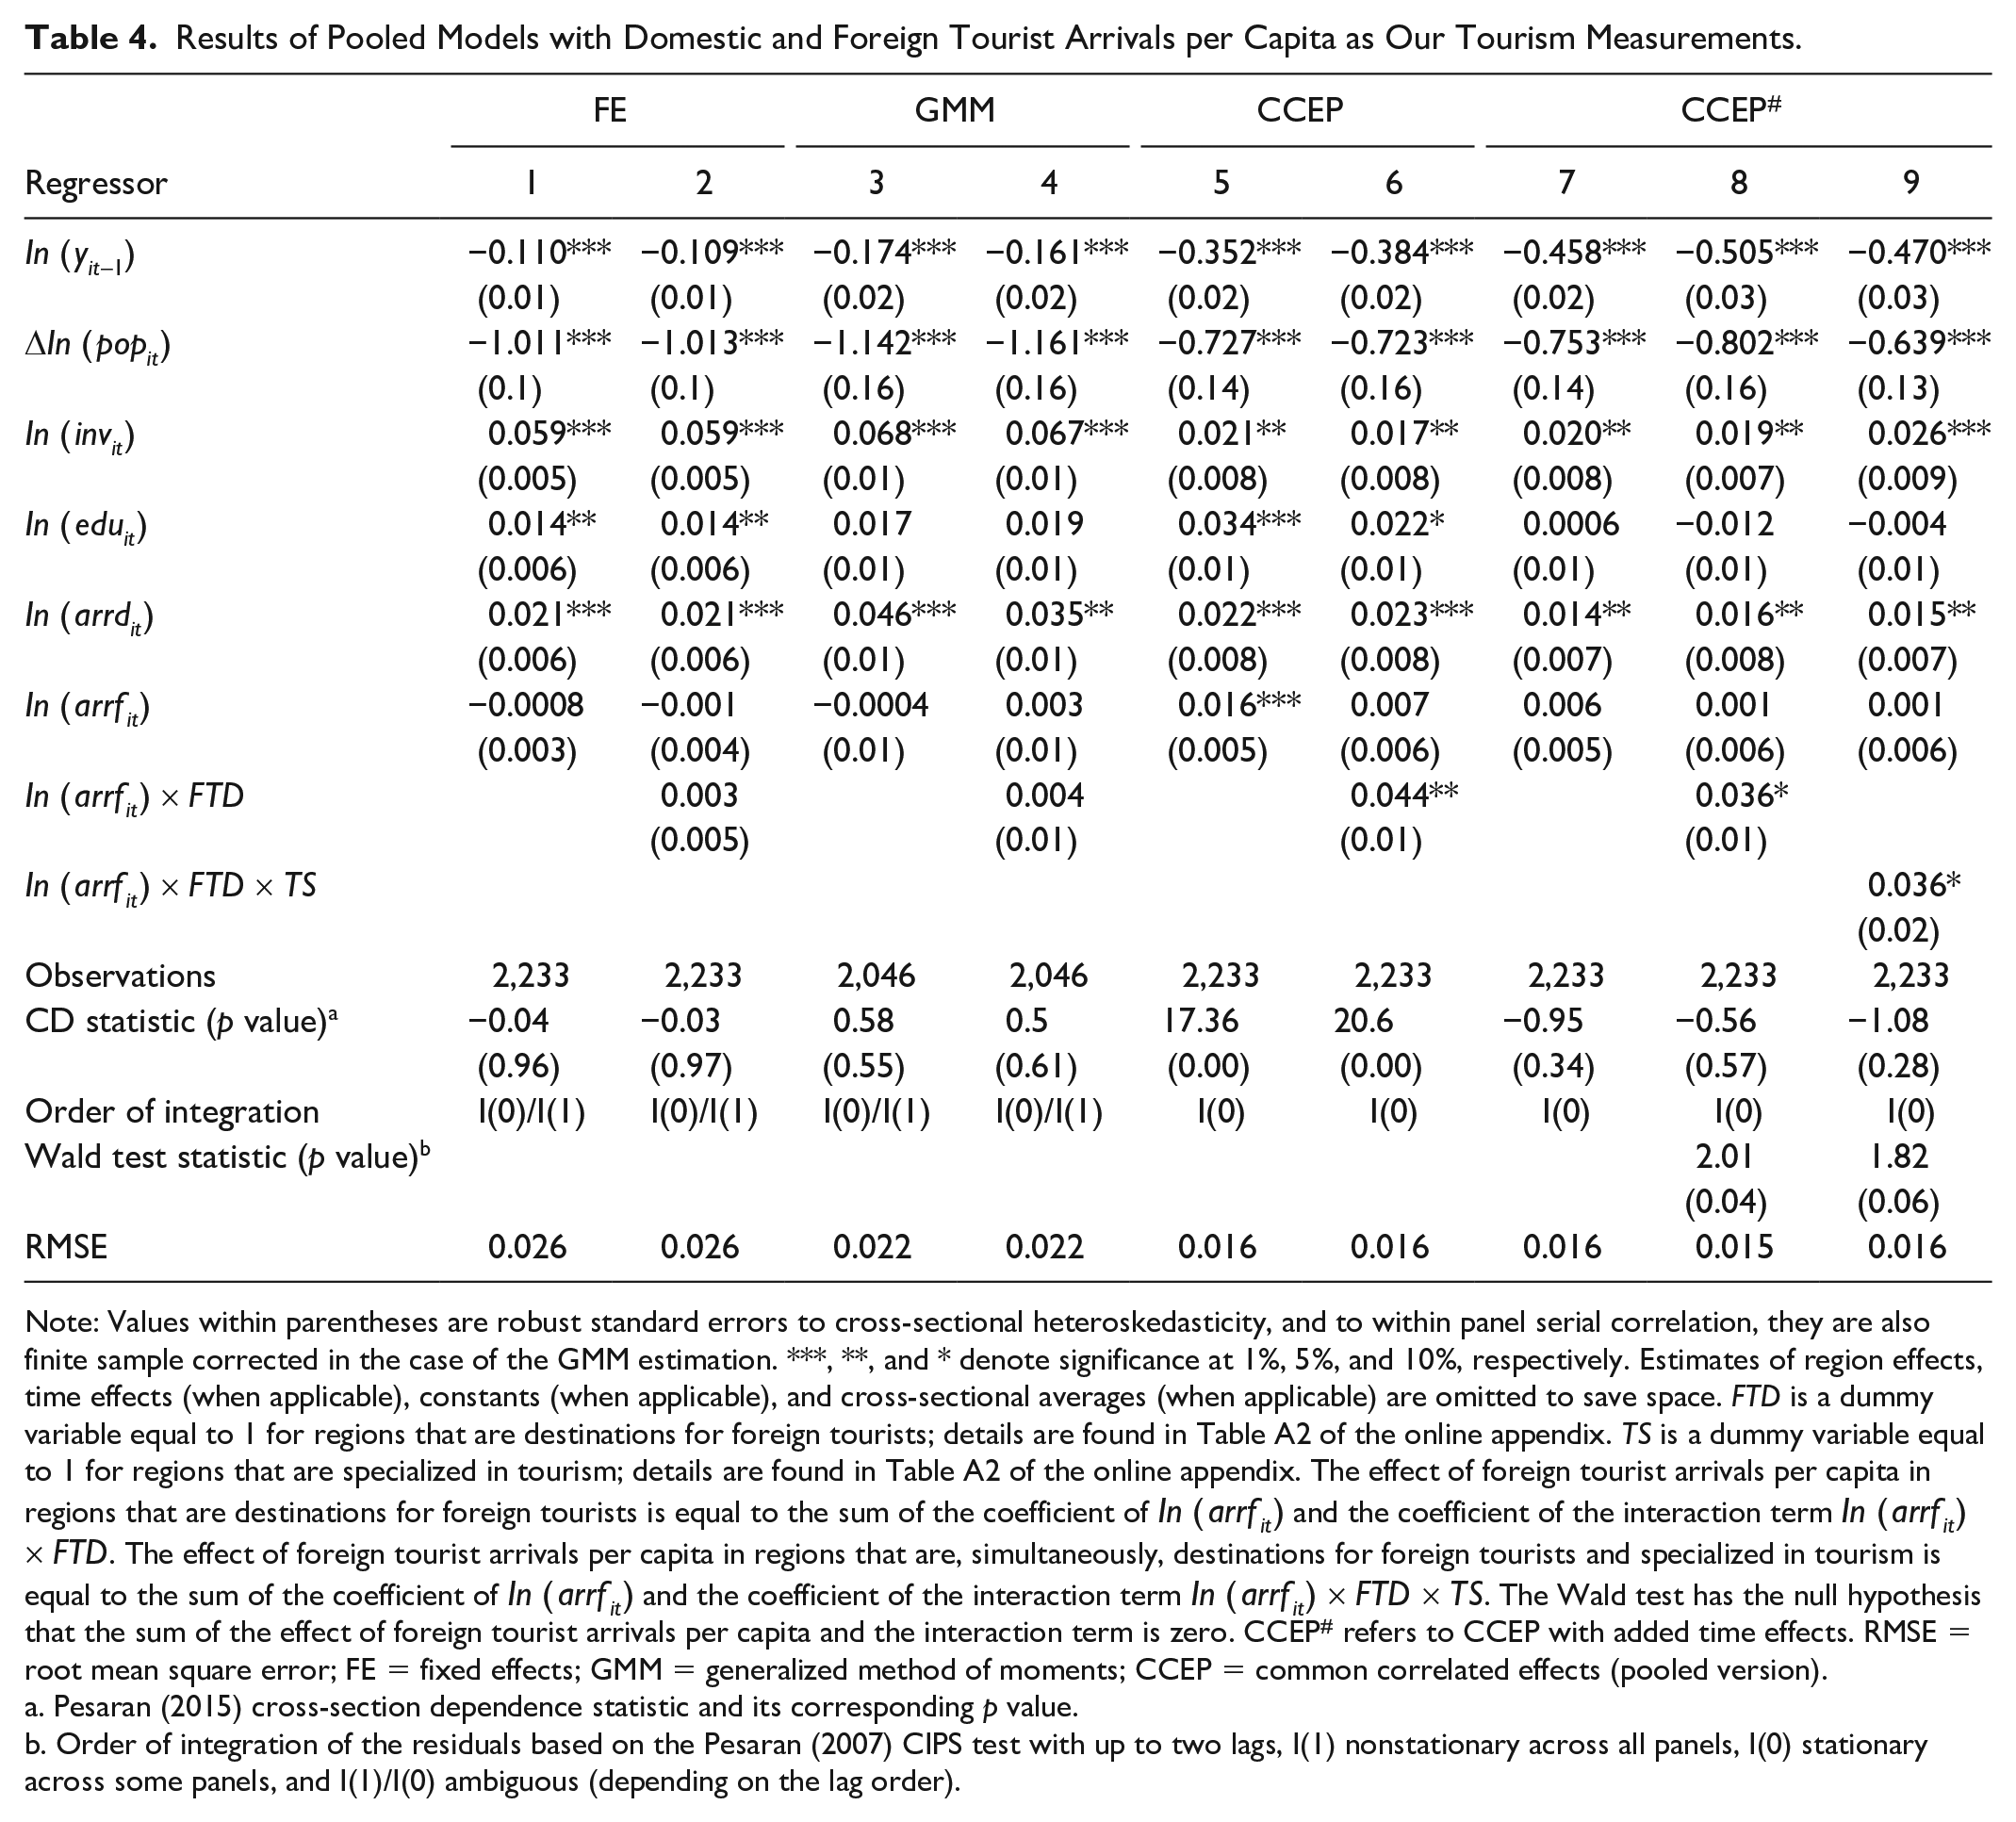
Note: Values within parentheses are robust standard errors to cross-sectional heteroskedasticity, and to within panel serial correlation, they are also finite sample corrected in the case of the GMM estimation. ***, **, and * denote significance at 1%, 5%, and 10%, respectively. Estimates of region effects, time effects (when applicable), constants (when applicable), and cross-sectional averages (when applicable) are omitted to save space. FTD is a dummy variable equal to 1 for regions that are destinations for foreign tourists; details are found in Table A2 of the online appendix. TS is a dummy variable equal to 1 for regions that are specialized in tourism; details are found in Table A2 of the online appendix. The effect of foreign tourist arrivals per capita in regions that are destinations for foreign tourists is equal to the sum of the coefficient of In (arrfit) and the coefficient of the interaction term In (arrfit) × FTD. The effect of foreign tourist arrivals per capita in regions that are, simultaneously, destinations for foreign tourists and specialized in tourism is equal to the sum of the coefficient of In (arrfit) and the coefficient of the interaction term In (arrfit) × FTD × TS. The Wald test has the null hypothesis that the sum of the effect of foreign tourist arrivals per capita and the interaction term is zero. CCEP# refers to CCEP with added time effects. RMSE = root mean square error; FE = fixed effects; GMM = generalized method of moments; CCEP = common correlated effects (pooled version).
Pesaran (2015) cross-section dependence statistic and its corresponding p value.
Order of integration of the residuals based on the Pesaran (2007) CIPS test with up to two lags, I(1) nonstationary across all panels, I(0) stationary across some panels, and I(1)/I(0) ambiguous (depending on the lag order).
The analysis of the residuals suggests the same conclusions put forward when we examined the results of Table 3: the CCEP with time effects shown in columns 7 to 9 is the most appropriate estimator given the cross-sectionally independent and stationary residuals. This suggests the absence of misspecifications owing to the nonstationarity of some variables and/or the presence of strong cross-section correlation. Consequently, our results reveal that domestic tourist arrivals have a positive and significant effect on regional growth, while the effect of foreign tourist arrivals on growth is insignificant.
The insignificant effect of foreign tourism could be reflecting the relative dominance of domestic tourist flows over foreign tourist flows across the regions and the years covered in our analysis: domestic tourist arrivals (across all regions and years) represent around 63% of total tourist arrivals (across all regions and years). It could also be owing to the larger volatility of foreign tourist inflows compared with domestic tourist inflows: the coefficient of variation of foreign tourist arrivals is larger than that of domestic tourist arrivals (respectively, 1.36 and 1.15). Moreover, and as highlighted in the extant literature, some regions with certain geographic, economic, and cultural specificities have mostly attracted foreign tourists. The inflows of foreign tourists are therefore less geographically diffused than the inflows of domestic tourists. As a result, the potential effect of foreign tourist arrivals on growth could be concentrated in some specific regions where foreign tourism might be relatively well developed.
To possibly detect a significant effect of foreign tourist arrivals, we augment equation (2) with an interaction term between foreign tourist arrivals and a “foreign tourism destination (FTD)” dummy variable. The dummy takes the value of 1 for regions where foreign tourist arrivals at the regional level were consistently larger than what they were at the (relevant) country level (details about the FTD are found in Table A2 of the online appendix).
Focusing on the estimator with well-behaved residuals (CCEP with time effects), and on tourist arrivals shown in column 8, we note the following remarks. First, and as was found previously, domestic tourism exerts a significant positive effect on regional growth. Second, the effect of foreign tourism in regions that are not destinations for foreign tourists (when FTD=0) is insignificant. Third, growth in regions that are destinations for foreign tourists (when FTD=1) has been positively impacted by foreign tourist arrivals: a 1% increase in foreign tourist arrivals raises regional growth in those regions by 0.037% (the sum of the coefficient of foreign tourist arrivals and the interaction term). A Wald test suggests that this effect is significant at the 5% level.
As an extension exercise, we created another dummy variable (“tourism specialization” [TS]) equal to 1 for regions identified as “specialized” in tourism. A region is considered specialized in tourism if, relatively to the sample, it consistently had a larger number of beds in tourist accommodation establishments per capita (details are provided in Table A2 of the online appendix). Subsequently, we computed the product of the FTD and the TS dummy variables. A product that is equal to 1 indicates that a given region is, simultaneously, a destination for foreign tourists as well as specialized in tourism. This is a more restrictive selection mechanism (compared to the one solely based on the FTD dummy) as it takes into account concurrently the relative magnitude of foreign tourists arrivals at a given region and the comparative endowment of the region in terms of tourism-related infrastructure. Using our preferred estimator (CCEP with time effects), we re-estimated equation (2) augmented with an interaction term between foreign tourist arrivals and the product of the two dummy variables (FTD and TS). Results, shown in column 9, corroborate the previous findings. A look at the residuals diagnostics and at the Wald test reveals the reliability of our results.
Results of the Heterogeneous Parameter Estimations
The effect of total tourist arrivals on growth
Table 5 presents the results of the heterogeneous parameter estimations of equation (1). As mentioned earlier, those estimates reflect a “bottom-up” approach as they are averages of panel-specific regression-based estimates.
Results of Heterogeneous Models with Total Tourist Arrivals per Capita as Our Tourism Measurement.
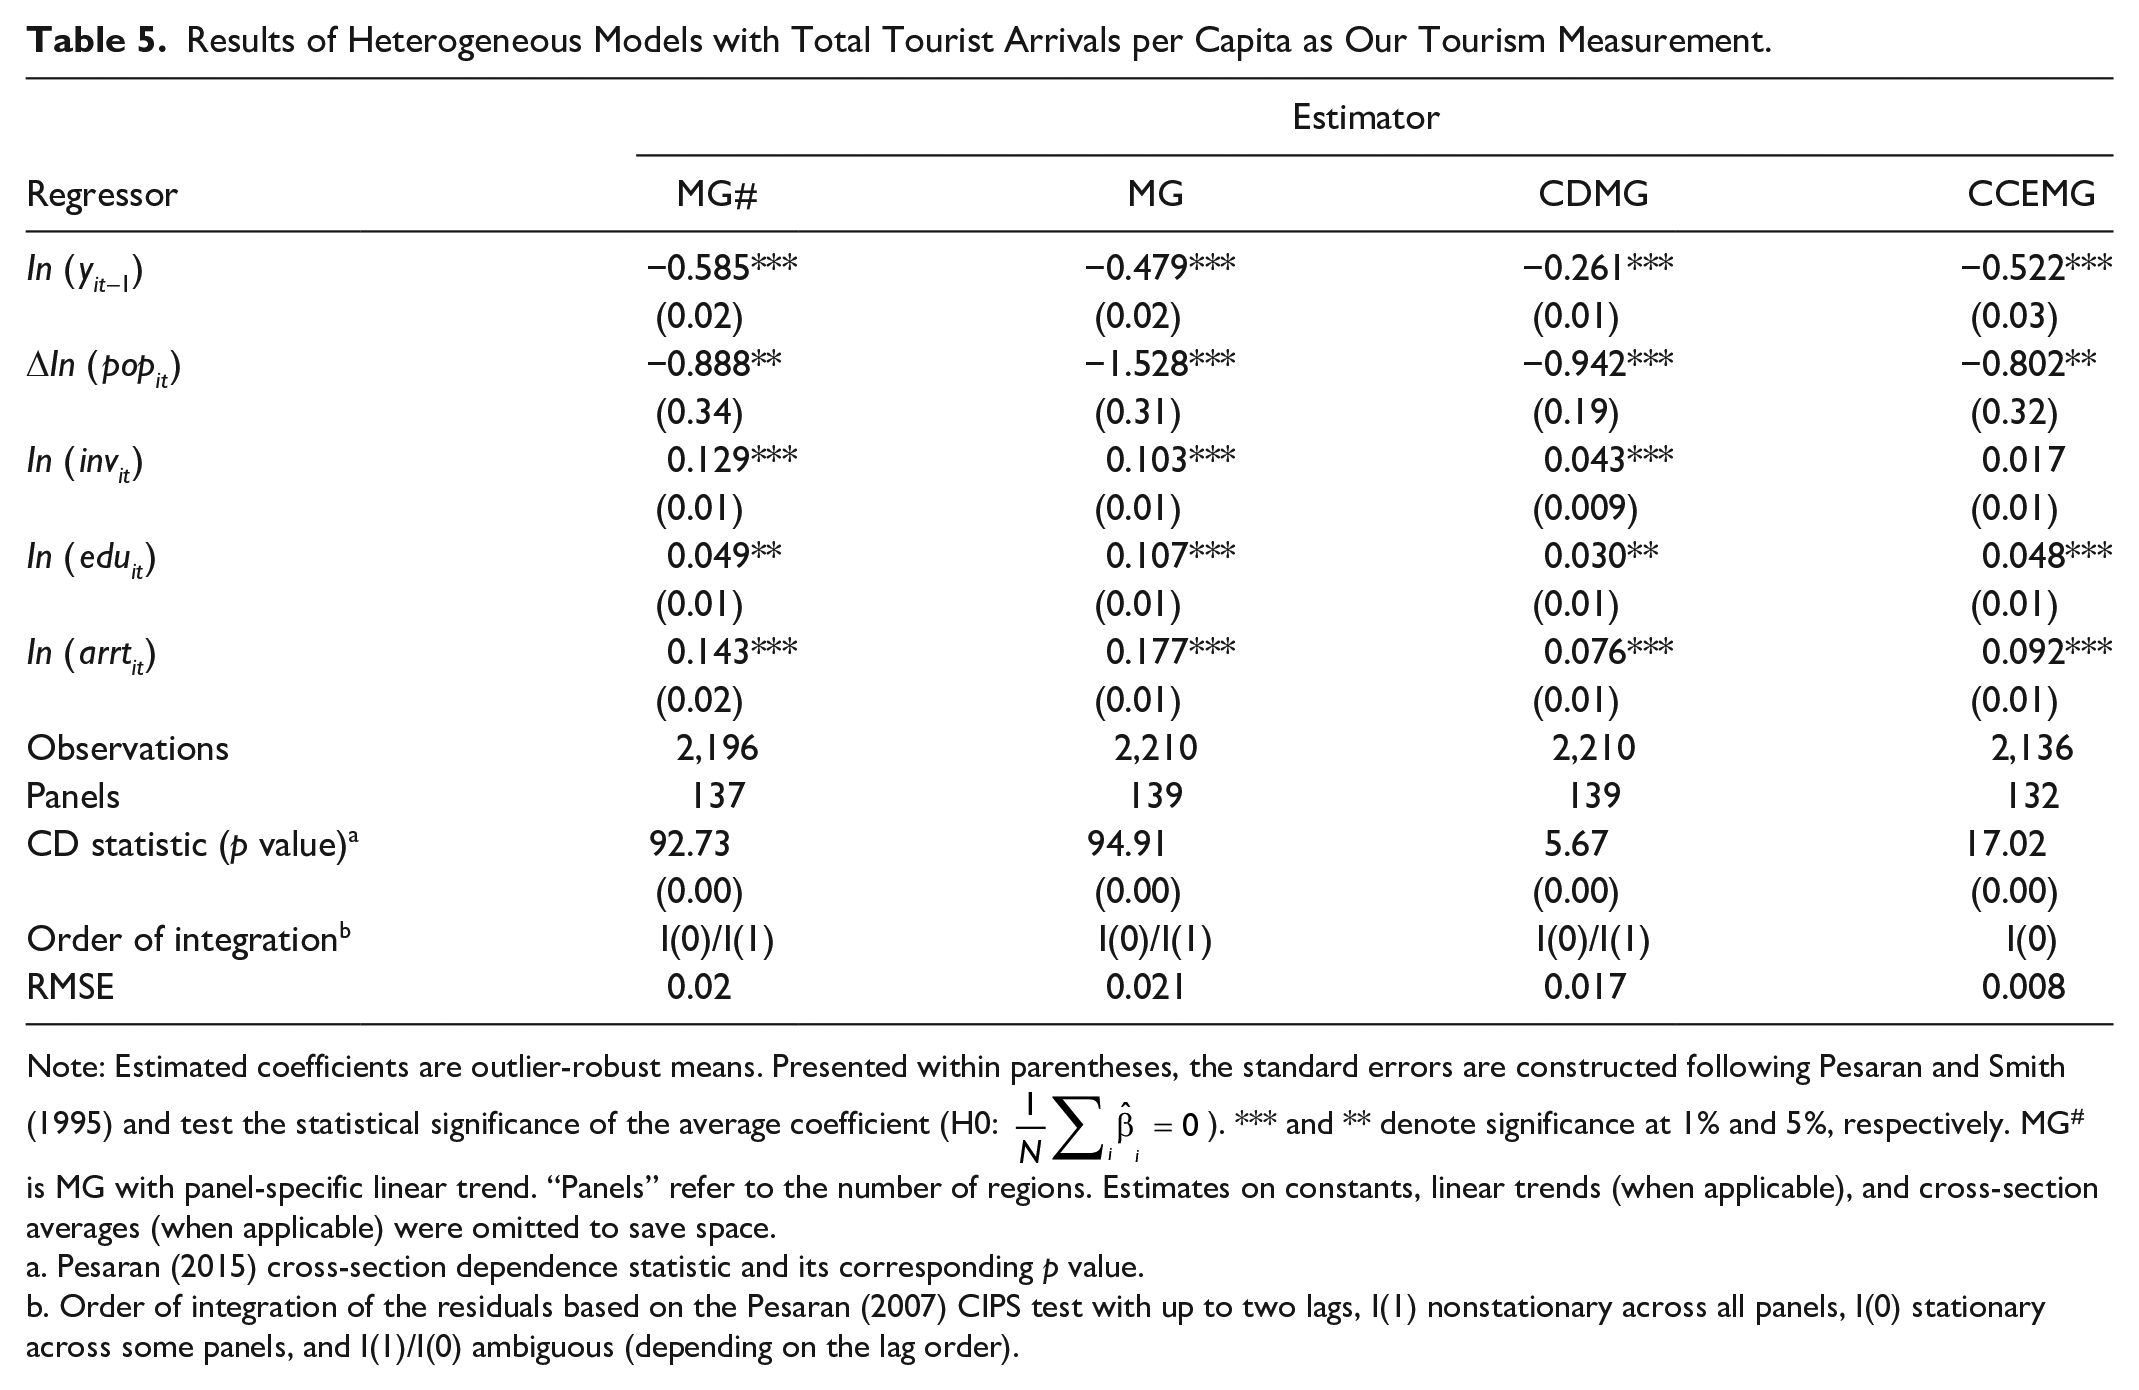
Note: Estimated coefficients are outlier-robust means. Presented within parentheses, the standard errors are constructed following Pesaran and Smith (1995) and test the statistical significance of the average coefficient (H0:
Pesaran (2015) cross-section dependence statistic and its corresponding p value.
Order of integration of the residuals based on the Pesaran (2007) CIPS test with up to two lags, I(1) nonstationary across all panels, I(0) stationary across some panels, and I(1)/I(0) ambiguous (depending on the lag order).
Overall, results lend support to the Solow model, with the expected significant effects of lagged per capita GDP, population growth, investment, and education on growth. 11 Results also confirm the pooled estimation findings associating total tourist arrivals to regional growth, as captured by the positive and significant effect of total tourist arrivals across all estimators.
The residuals diagnostic tests reveal that none of the estimators manages to remove strong cross-section dependence. It is worth recalling the assumptions underlying each of the estimators used: the CDMG controls for universal shocks having the same impact across panels, while each of the MG (with a linear trend) and the CCEMG allows for panel-specific repercussions of shocks. Interestingly, the estimator that comes closer to appropriately controlling for the cross-section dependence is the CDMG (with the lowest CD statistic). This would support our conclusion from the pooled estimators: most of the disturbances that have hit our sample seem to be universal, having largely the same effects across regions.
On the other hand, the residuals diagnosis points to possible nonstationary residuals in the case of the MG and CDMG estimators, which precludes valid inferences. The only estimator with stationary residuals is the CCEMG. In view of the cross-sectionally correlated CCEMG residuals, the CCEMG effect of total tourism inflows is probably biased as it is also taking up the influence of some unobservables. Nevertheless, the stationarity of the CCEMG residuals makes room for suitable conclusions: given the relatively high significance of the estimated impact of total tourists inflows (p value of 1%), the probability of mistakenly rejecting the null hypothesis of no impact of the effect of total tourist arrivals should be fairly small. Consequently, although the CCEMG effect of total tourist inflows is likely biased, its significance is rather confirmed. 12
The effect of domestic and foreign tourist arrivals on growth
Estimates of equation (2) derived from panel-specific regressions are exposed in Table 6. The control variables have the expected signs and, altogether, are significant throughout the applied estimations. 13 With the exception of the CCEMG, all estimators show a positive and significant effect of each of domestic and foreign tourism inflows.
Results of Heterogeneous Models with Domestic and Foreign Tourist Arrivals per Capita as Our Tourism Measurements.
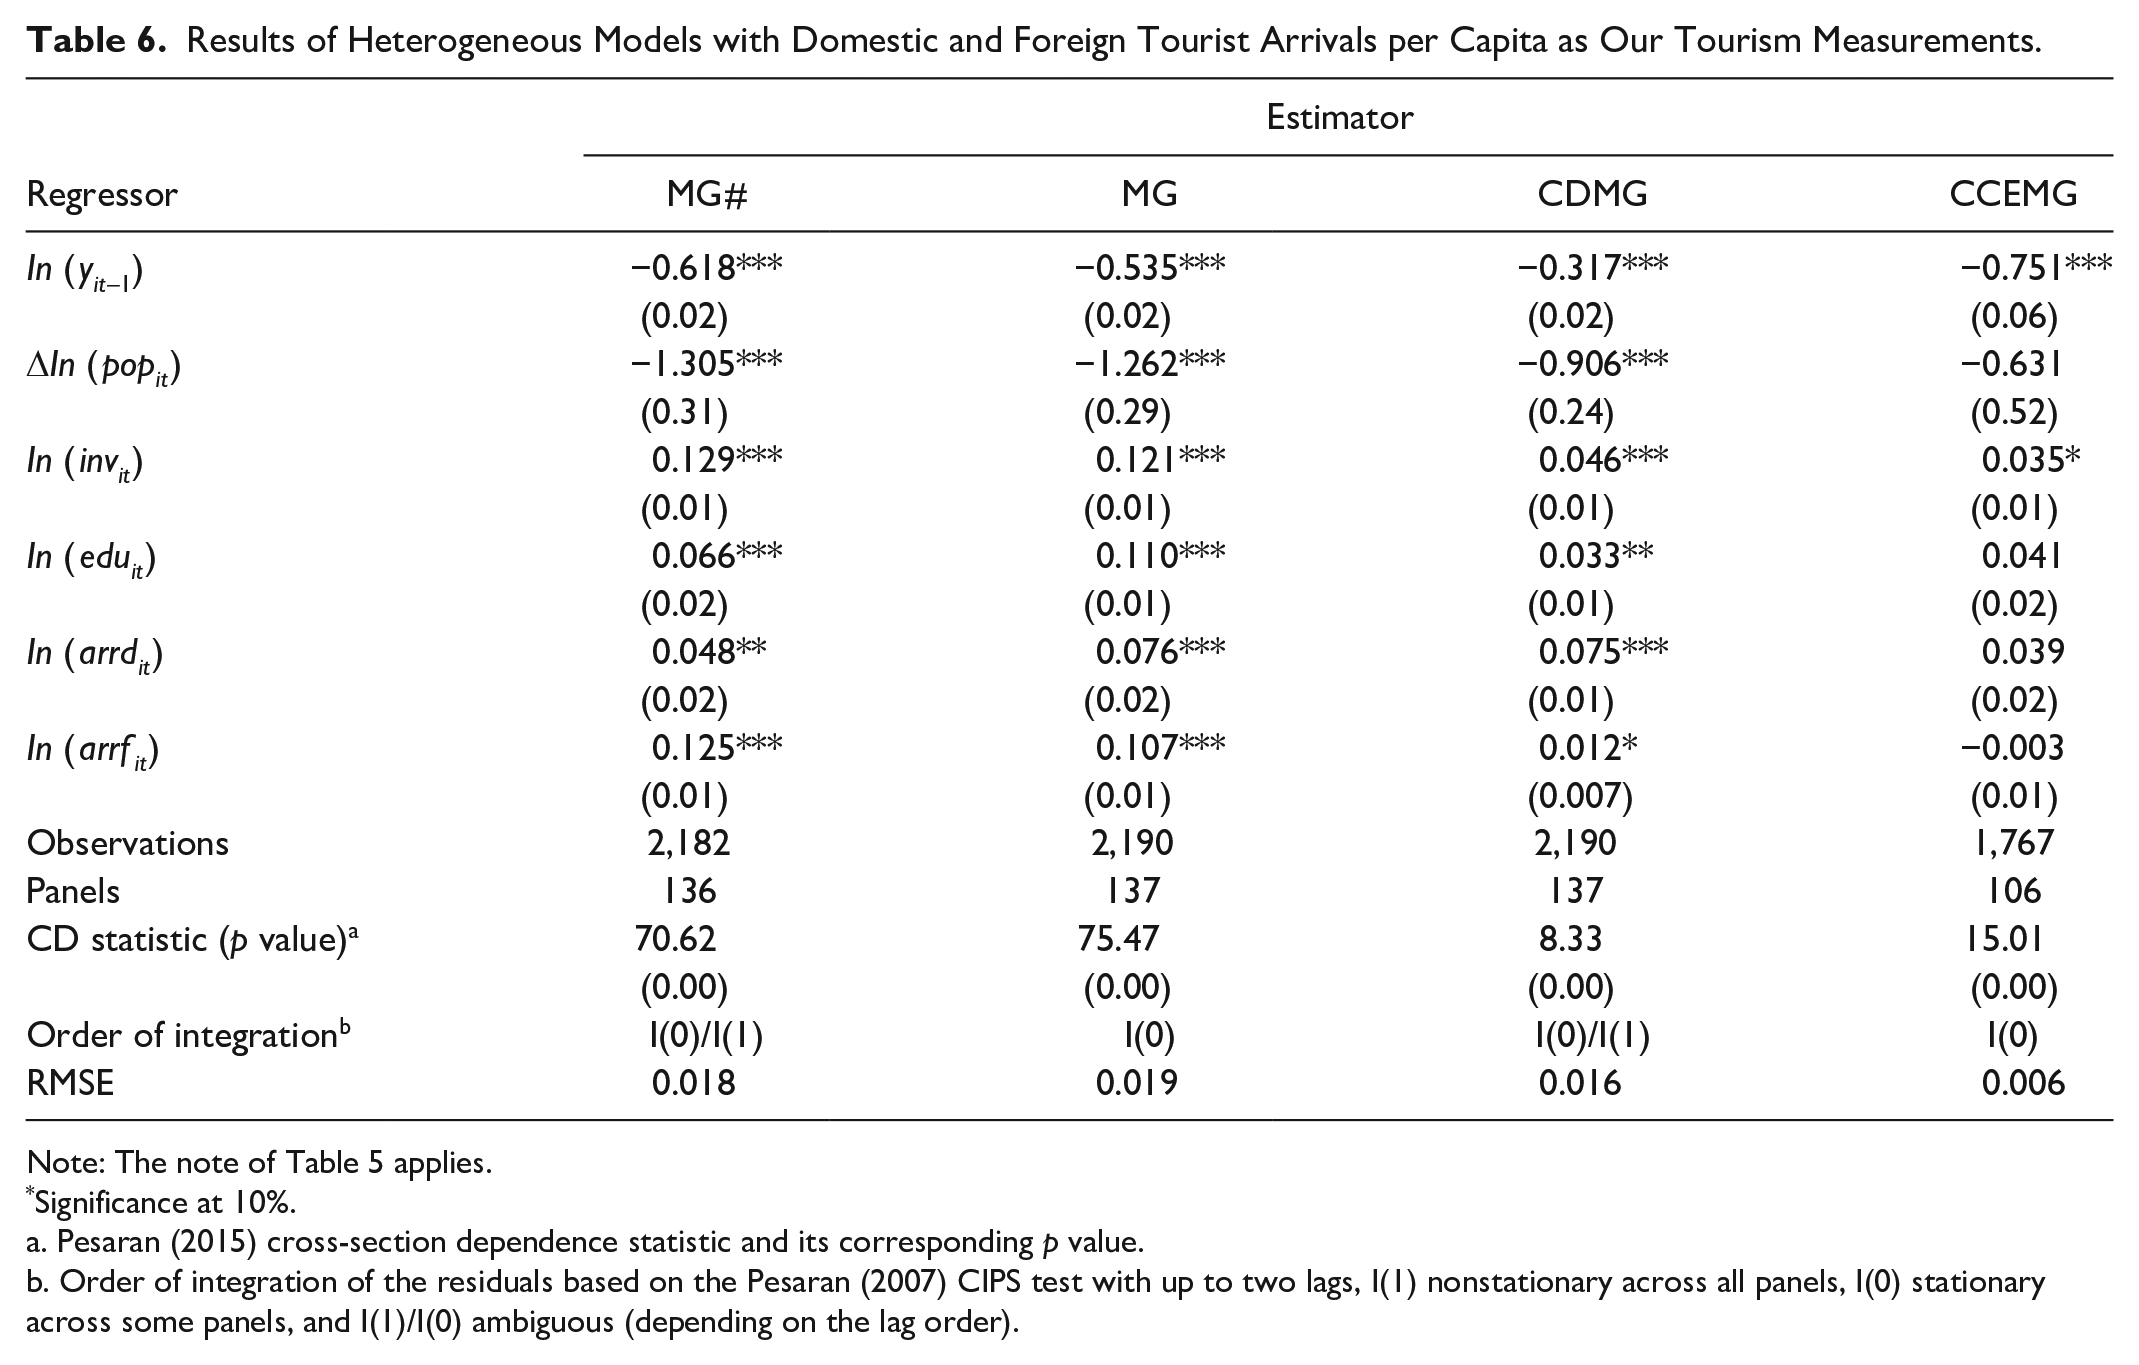
Note: The note of Table 5 applies.
Significance at 10%.
Pesaran (2015) cross-section dependence statistic and its corresponding p value.
Order of integration of the residuals based on the Pesaran (2007) CIPS test with up to two lags, I(1) nonstationary across all panels, I(0) stationary across some panels, and I(1)/I(0) ambiguous (depending on the lag order).
The inspection of the residuals reveals that all estimators yield cross-sectionally dependent residuals. As was the case in the estimation of equation (1), there is evidence that the CDMG estimator copes better with strong cross-section correlation than the rest of the estimators, although it does not manage to wipe it out. The examination of the residuals’ time-series properties identifies two estimators with likely nonstationary residuals: the MG (with a linear trend) and the CDMG. Thus, drawing proper insights from the findings of the latter two estimators is not warranted.
The two estimators with stationary residuals are the MG (excluding the linear trend) and the CCEMG. A critical difference between the two estimations is that the CCEMG is based on a substantially smaller number of regions than the MG (and the rest of the estimators for that matter): the MG covers 31 additional regions. Put differently, the sample of regions covered by the MG estimator constitutes nearly 88.4% of the original sample used in the pooled regressions, whereas the sample on which the CCEMG estimates depend represents 68.4% of the pooled estimations sample. As a result, the MG estimates are presumably more informative than the CCEMG ones. 14 Consequently, the MG (excluding the linear trend) estimator is our favored one. As such, it reveals that each of the domestic and foreign tourist arrivals has a significant positive influence on regional growth. Nonetheless, a note of caution is in order: since the MG estimator does not yield cross-sectionally independent residuals, the impact of each of domestic and foreign tourist arrivals on regional growth is likely biased. Yet, in view of the significance level of each of the two tourism variables (a p value of 2% for domestic arrivals and of 1% for foreign arrivals), the likelihood of erroneously rejecting the null hypothesis of an insignificant effect of either one of the latter variables should be quite modest.
The Impact of Tourist Arrivals and Spatial Heterogeneity
In this section, we make use of the region-specific regressions to exhibit spatial disparities as to the impact of each of domestic tourist arrivals as well as foreign tourist arrivals on regional growth. Specifically, we use the MG results of equation (2) to inspect the spatial dissimilarities in those impacts on regional growth in 137 NUTS regions. 15 We stress the highly descriptive aspect of this section: because of the relatively limited time series dimension of the data, estimates based on panel-specific regressions would not transmit reliable “long term” signals (Eberhardt and Teal 2013).
Spatial Variations in Terms of the Growth Effect of Domestic Tourism
Overall, Figure 4 reveals a positive effect of domestic tourism across most of the regions covered: in 72% of the cases, domestic tourist arrivals have exerted positive economic repercussions. The largest positive effects of domestic tourism have been mostly registered in Southern and Western Europe: domestic tourism has a positive growth impact that exceeds the average reported in Table 6 (0.076) in most of the regions in Southern and Western Europe. Those are advanced economies as per the IMF classification with a high standard of living where people can afford to travel. In fact, research suggests that domestic tourism demand picks up at an income level of about US$35,000 (WTTC 2018). Figure 1 shows that in those regions, the real GDP per capita has reached (or is close to) this threshold, possibly indicating a dynamic domestic tourism industry that would contribute to the high growth impact of domestic tourists. Moreover, more than half of those regions are either capital cities or are well-equipped in tourism accommodation as per our TS index.
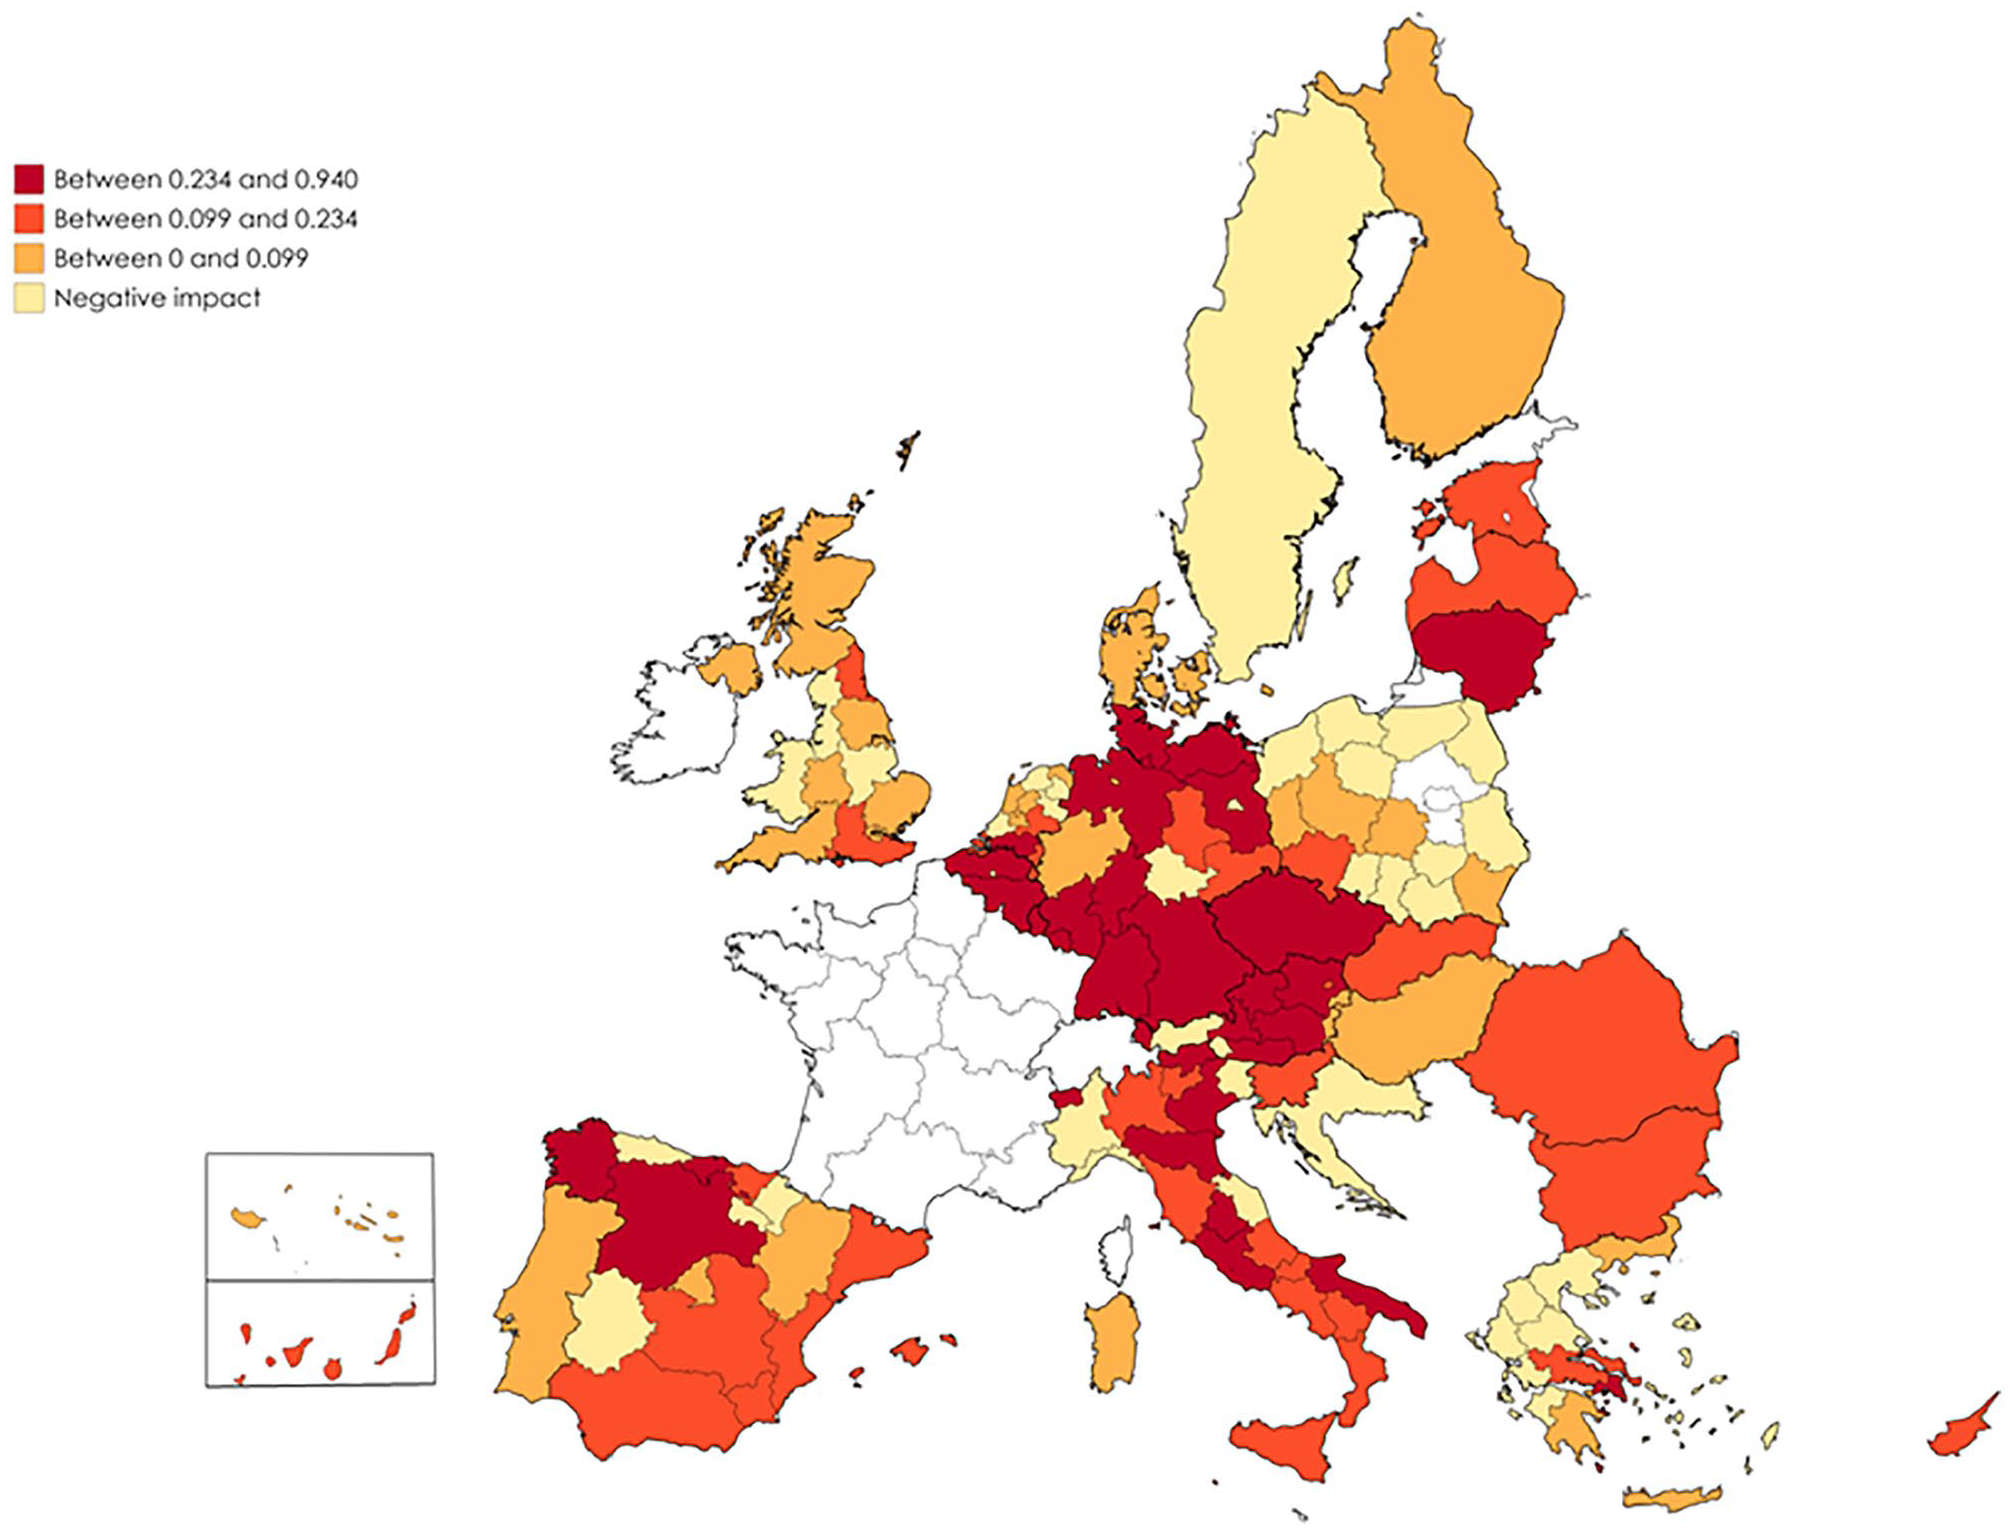
The estimated effect of domestic tourism inflows on regional growth in 137 NUTS regions.
Interestingly, we can also conclude from Figure 4 that most of the regions where domestic tourist arrivals have a negative growth impact or an impact below the average found in Table 6 are mainly located in Eastern and Northern European countries, in addition to the Netherlands and the North of Greece. In fact, we can identify 39 regions where domestic tourism negatively affects regional economic growth, with a marginal impact ranging between −0.001 and −0.45. This result suggests that, even though, on the whole, domestic tourism contributes to economic growth (as shown in Tables 4 and 6), findings from region-based regressions demonstrate that domestic tourism may have an adverse effect on regional growth.
Spatial Variations in Terms of the Growth Effect of Foreign Tourism
In 65% of the regions covered, the growth impact of foreign tourists is positive. A look at Figure 5 reveals that most of those regions are located in the Southern and Western parts of the Iberian Peninsula, as well as the North and the Center of Europe. Figure 5 also shows that in most of those regions, the growth impact exceeds the average found in Table 6 (0.107). In fact, more than half of those regions are either capital cities or considered destinations for foreign tourism (as per the FTD index) or are well equipped with accommodation facilities (as per the TS index). Interestingly, out of the 28 capital cities in the sample, foreign tourism has a positive economic growth effect in 21 cases. Moreover, in 70% of the regions considered destinations for foreign tourism, the impact of foreign arrivals is positive. Figures 4 and 5 show that in 11 of those regions, domestic tourist arrivals have a greater impact on regional economic growth than foreign tourist arrivals. This uncovers marked regional disparities that are masked in Table 6 that shows that the average effect of foreign tourist flows on regional growth is larger than the one of domestic tourism.

The estimated effect of foreign tourism inflows on regional growth in 137 NUTS1 regions.
Figure 5 also shows that the regional growth impact of foreign arrivals is negative or low in many Eastern European regions and some Northern, Southern, and Western regions. In 60% of those regions, the ratio of beds in tourist accommodation establishments to the population was less than the corresponding sample ratio across all years observed, suggesting that those are regions with weak tourism-related infrastructural environments.
Moreover, Figure 5 reveals remarkable disparities within blocs: compared with the rest of the countries within their blocs, the regional growth impact of foreign arrivals is dominantly negative or low in Belgium (vis-à-vis Western Europe), Greece, Italy, and Slovenia (compared to Southern Europe), and the United Kingdom (relative to Northern Europe). We also notice disparities between Italian regions: the positive impact for foreign arrivals is concentrated in central Italy, while it is negative in most of the Northern and Southern regions.
Discussion and Conclusion
Using data encompassing 155 regions throughout the EU-28 member states, we investigate the features and dynamics of tourism inflows, across their domestic and foreign components, over 2000–2018. Moreover, and making use of the augmented Solow setting, we explore the impact of tourism flows on regional growth across the EU-28 member countries. The investigation distinguishes between domestic tourism and foreign tourism while applying several estimators with different underlying assumptions as regards the data-generating process. To our knowledge, this is the first inspection of the characteristics, dynamics, and growth effects of tourist inflows that encloses a large number of European countries, notably after the substantial expansion of the EU’s membership.
An important difference across the estimators employed is their ability (or not) to allow for a differentiated effect of (possibly nonstationary) observables and/or unobservables on economic growth across the regions covered. In this respect, our results show that all estimators that do not permit a heterogeneous impact of either the observable regressors or the unobservable shocks (FE, GMM) yield likely nonstationary residuals, which precludes sound inference. This suggests that the common approach in the tourism/growth nexus literature that adopts estimation strategies that impose a common effect of all observed growth-determinants as well as a homogeneous impact of shocks across all spatial units may not be warranted by the data, notably at the regional level. Indeed, given the large disparities over the inputs used in the production process across regions, it is highly likely that the impact on output growth of a given input would vary with the region considered. Further, in addition to shocks affecting all regions equally, some disturbances might not have a uniform effect on growth across space.
Our estimation strategy includes novel estimators that embrace the regional disparities, relax the rigid assumptions of the standard methodologies to varying degrees, and yield stationary residuals that enable sound conclusions. Among the estimators that assume a common impact of observable regressors on growth across regions (pooled estimators), our favored one—the CCEP (augmented with time effects)—allows for possibly heterogeneous repercussions of latent shocks over space while yielding stationary residuals. Amid the estimators that accommodate idiosyncratic effects of inputs on growth (heterogeneous estimators), our preferred estimators are the CCEMG (in the case of total tourist arrivals) and the MG (in the case of domestic and foreign tourism), both showcasing stationary residuals. Among the aforementioned estimators, the CCEP succeeds in accounting for the cross-section correlation in the data while the CCEMG and MG estimators do not manage to remove it. Insofar as unobserved shocks are possibly driving jointly the error term and the tourism variable in the estimated equations, the CCEMG/MG estimates of the impact of tourism on growth would be biased. This pinpoints the inability of the mean-group based estimators to fully capture the complexity of the process through which unobserved perturbations affect growth. A comparison between the CCEP and CCEMG/MG estimates of the impact of tourism on growth reveals an upward bias in the latter.
Our econometric analysis suggests four key findings: two stemming from the preferred pooled estimator and another two ensuing from the favored heterogeneous estimators. On the pooled estimation front, there is, first, evidence that total tourist arrivals have significantly contributed to regional growth in the EU over the period covered. Second, this seems to be driven by domestic tourist inflows, while the positive impact of foreign tourism is statistically detectable only in regions that have relatively been destinations for foreign tourists. As for the region-based estimations, they first denote a significant and positive impact of tourism, across its two components, on regional growth. Second, region-specific regressions display remarkable differences in terms of the growth-impact of domestic and foreign tourism: while most of the regions have benefited from domestic and foreign tourism, the magnitude of the benefits has differed markedly across regions. Moreover, tourist inflows have negatively affected growth in several cases.
Among the previous studies investigating the relationship between tourism and growth at the regional level in Europe, the most relevant one to the present research is Paci and Marrocu (2014). Our findings share some important similarities with the latter study but also exhibit some dissonances. On the resemblance front, we note the following results: tourism has a significant and positive impact on growth, the economic effect of domestic tourism is larger than that of foreign tourism, and the impact of tourism is not uniform across all regions. As for the dissimilarity, it is mainly encapsulated by our substantially smaller estimated effect of tourism, across its two components, on growth. Two reasons might explain this. On one hand, our sample covers 18 additional countries, among which countries from Central and Eastern Europe as well as Northern Europe that are still lagging in terms of the know-how and the institutional and infrastructural frameworks that would amplify the economic effects of tourism. Thus, our lower estimated impact of tourism on regional growth is likely mirroring our more diversified sample. On the other hand, the estimation approach of Paci and Marrocu (2014) does not properly account for shocks that are not geographically clustered as well as common shocks affecting the entire sample at varying degrees. Since such perturbations are likely to drive the regressors, the effect of tourism on growth found by Paci and Marrocu (2014) is probably biased.
Our empirical inspection bears a number of implications. First, given the significant and positive effect of tourism on growth across most of the regions, tourism, whether domestic or foreign, can be a regional growth-propelling factor irrespective of its impact on a nationwide level. As such, it should acquire a central place in regional development strategies, whether at the regional, national, or supranational level. Second, in a number of regions, tourism seems to be marginally or even negatively associated with growth. This suggests that tourism is not always a growth propeller and that regional development policies gravitating around fostering the tourism industry are not invariably advisable. That is not to say that in such regions authorities should neglect the tourism sector, but that it would be more pertinent to prioritize other sectors that might be more growth conducive. Third, there seems to be a potential for more vivid tourist inflows in several regions, particularly in Central and Eastern Europe as well as Northern Europe in terms of foreign tourism. Indeed, those two regions are lagging behind the rest of the European regions in terms of foreign tourist inflows: compared to the other regions, Central and Eastern Europe and Northern Europe have attracted a relatively low number of foreign tourists on average over the period. Furthermore, the latter two regions are still underdeveloped in terms of tourism-related infrastructure: in per capita terms, the average number of beds in tourist accommodation establishments in those regions remains meager when compared with the rest of the European regions. To realize such a potential, local authorities in Central and Eastern Europe as well as Northern Europe should consider measures that would attract foreign tourists. This would encompass enhancing relevant infrastructures, notably tourist accommodation establishments.
Supplemental Material
sj-pdf-1-jtr-10.1177_0047287520979673 – Supplemental material for Regional Growth, Domestic and Foreign Tourism in NUTS Regions: New Insights from the Old Continent
Supplemental material, sj-pdf-1-jtr-10.1177_0047287520979673 for Regional Growth, Domestic and Foreign Tourism in NUTS Regions: New Insights from the Old Continent by Georges Harb and Charbel Bassil in Journal of Travel Research
Footnotes
Acknowledgements
We are grateful to two anonymous referees who thoroughly examined the original version of the paper. Their insightful comments and suggestions have undoubtedly enhanced the quality of the research and the article.
Declaration of Conflicting Interests
The author(s) declared no potential conflicts of interest with respect to the research, authorship, and/or publication of this article.
Funding
The author(s) received no financial support for the research, authorship, and/or publication of this article.

Supplemental Material
Supplemental material for this article is available online.
Notes
Author Biographies
References
Supplementary Material
Please find the following supplemental material available below.
For Open Access articles published under a Creative Commons License, all supplemental material carries the same license as the article it is associated with.
For non-Open Access articles published, all supplemental material carries a non-exclusive license, and permission requests for re-use of supplemental material or any part of supplemental material shall be sent directly to the copyright owner as specified in the copyright notice associated with the article.
