




Abstract
It is commonly assumed that TV commercials successfully influence affective tourism destination image by coupling positive emotions to a destination. In this study we record emotional responses to destination pictures before and after viewing a destination TV commercial from participants’ brains using electroencephalography (EEG). A control group of participants watched the same destination pictures, and an unrelated TV commercial. Emotion-related event-related potential (ERP) components, the P2 and LPP, were derived from the EEG. For the participants that watched the destination TV commercial, the P2 and the LPP were larger in response to destination pictures after compared to before having watched the TV commercial. This effect was not observed in the control group. In a behavioral version of the same experiment, we did not observe any effects in the self-report data. It is concluded that ERP methodology is a useful tool to complement the toolbox of tourism marketing researchers.
Introduction
Tourism is one of the largest and fastest-growing industries worldwide (UNWTO 2016). At the same time, there is fierce competition among tourism destinations for inbound visitors. Therefore, destination marketing organisations invest heavily in marketing their destination. Despite the rapid growth of Internet-based marketing, TV commercials are expected to remain the most widely used channel to market products and services for years to come (PwC 2015). It is therefore not surprising that substantial numbers of TV commercials are being produced by tourism marketing organisations (such as travel agencies and destination marketing organisations).
As developing and broadcasting TV commercials is a costly and time-consuming process, there is a pressing need for establishing what are the factors that make a TV commercial successful, and for being able to assess the effectiveness of any particular tourism destination TV commercial. Whereas more traditional notions of marketing and decision making (e.g., Fishburn 1981) capitalize on a rational / cognitive basis for making decisions (such as purchase, (re)visit, or recommendation decisions), more recent views emphasize the important role of emotions in decision making (Loewenstein and Lerner 2003; De Martino et al. 2006; McCabe, Li, and Chen 2016; Wattanacharoensil and La-ornual 2019), and consequently, also in marketing (Baggozzi, Gopinath, and Prashanth 1999). In the tourism literature, this development is paralleled by the notion that a destination image—that is, how a tourism destination is being perceived by potential visitors—does not only have a cognitive component, based on attributes and facts about the destination, but also an affective component, based on emotions, values, and feelings (see, e.g., San Martín and Del Bosque 2008; Baloglu and Brinberg 1997; Baloglu and McCleary 1999; Beerli and Martin 2004). We hypothesize that, for a tourism destination TV commercial to be effective, it needs to impinge on the affective component of the destination image, by coupling positive emotions to that destination. The present article examines the case of a TV commercial that markets an established beach destination, in an attempt to determine to what extent a TV commercial is successful in coupling positive emotions to a tourism destination. Theoretically, we are interested in establishing whether the coupling of positive emotions to a destination is a conscious process, or whether this occurs (partly) outside of conscious awareness. This is empirically operationalised by comparing self-report-based measures of emotion (ratings of emotional valence and arousal), which necessitate conscious awareness of the emotional processes, to emotion measurements using EEG, a research methodology borrowed from neuroscientific research that can capture both conscious and unconscious processes (Luck 2014).
Literature Review
Affective Destination Image and Tourist Decision Making
Most research on tourism destination marketing is based on the notion that marketing activities create or alter a destination image that consists of both cognitive and affective components (San Martín and Del Bosque 2008; Baloglu and Brinberg 1997; Baloglu and McCleary 1999; Beerli and Martin 2004). The cognitive component of a destination image involves knowing, understanding, and reasoning about facts and attributes of a destination. The affective component is based on emotions, values, and feelings toward a destination (Pan 2011).
Destination image is known to have a strong influence on travel and recommendation decisions (Chen and Tsai 2007; Echtner and Ritchie 1991). Emotions are a critical factor influencing the choice for a particular destination (Tucker 2009), and there is increasing evidence that the affective component of a destination image is more strongly involved in shaping the overall destination image than the cognitive component (e.g., Baloglu and McCleary 1999; S. Kim and Yoon 2003; Pan 2011).
This view is in line with recent, more general theorizing about the nature of tourist decision-making processes. In contrast to more traditional views on tourist decision making that emphasize rational, cognitive processes and utility maximization, it has been argued that psychological processes, including affective ones, play an important role in shaping decision heuristics (McCabe, Li, and Chen 2016). Choosing between different destinations mostly involves highly complex evaluations of many alternatives, tourists often cannot afford the time and effort to consider all possible alternatives in detail, through a process of elimination by aspects (Tversky 1972) tourists reduce complexity in decision making by basing their decisions on the most desirable destination attributes (for an extensive review of the relevant literature, see Wattanacharoensil and La-ornual 2019). It seems plausible that the most desirable attributes of a destination are the ones that trigger the strongest emotional responses. This is commensurate with evidence from the wider literature on persuasion theory and marketing effectiveness, showing that emotions are crucial components of a consumer’s response to advertising, and that eliciting positive emotions is an important and successful strategy in marketing (Baggozzi, Gopinath, and Prashanth 1999; Geuens, De Pelsmacker, and Faseur 2011; Yoo and MacInnis 2005; Mehta and Purvis 2006; Kover, Goldberg, and James 1995). Therefore, it seems reasonable to conclude that destination marketing that is aimed at influencing affective destination image, for example, by coupling positive emotions to a destination, is more effective in influencing destination choice than marketing efforts that are more cognitively oriented.
Measuring Emotions
Although it has previously been recognized that emotions play an important role in marketing (Baggozzi, Gopinath, and Prashanth 1999), only recently have tourism researchers begun to study the role of emotions in tourism marketing (e.g., S. B. Kim, Kim, and Bolls 2014; Li et al. 2017, 2016; Bastiaansen et al. 2018). At the same time, this development has incited researchers to carefully consider conceptual approaches to emotions and how to measure them. Globally there are two approaches to conceptualizing emotions: Basic, or discrete emotion theory, which regards emotions as qualitatively distinct entities or categories (e.g., Ekman 1992), and dimensional approaches (Russell and Mehrabian 1977), which posit that a limited number of dimensions such as valence (or pleasure), arousal, and dominance can describe the entire spectrum of emotions (for review, see Russell and Barrett 1999; Scherer 2000).
Regardless of the exact theoretical position, a generally accepted definition of emotions is that they consist of short-lived responses to situations that are seen as personally relevant, which are expressed at three levels: the phenomenological, behavioral, and physiological levels. This has implications for how emotions can be measured (for review, see Mauss and Robinson 2009).
Phenomenology can be assessed through self-report, behavior through observation, and physiology through psychophysiological recordings (see, e.g., Chamberlain and Broderick 2007; Bastiaansen et al. 2019). Each of these methodologies have strong and weak points (see Mauss and Robinson 2009 for a detailed discussion). For instance, techniques relying on self-report, such as interviews or questionnaires are easily administered at larger scales, but may be susceptible to social desirability. Furthermore, self-reports may suffer from the inability of individuals to consciously access emotions, and, at least in the context of tourism marketing, from an overestimation of emotion effect (for discussion, see Li et al. 2017; S. B. Kim, Kim, and Bolls 2014). Behavioral measures, such as observer ratings or the analysis of facial expressions can potentially discriminate between different types of emotions, but sometimes lack sufficient sensitivity, especially in situations that elicit mild to moderate emotions. Psychophysiological measures, such as heart rate, skin conductance, facial electromyography (fEMG, which measures facial expression) or electroencephalography (EEG) offer real-time indices of emotions as they unfold over time, but do not differentiate between specific emotions and between positively versus negatively valenced emotions (see also Bastiaansen et al. 2019). In their review, therefore, Mauss and Robinson (2009) contend that these different measures all have partly unique sources of variance, and as a result there is no gold standard for measuring emotions. As such, self-report, behavioral, and psychophysiological data all contribute to understanding emotional responses.
Measuring Emotions in Tourism Marketing Research
Tourism researchers are increasingly interested in exploring the role of emotions in tourism marketing. Notably, the use of psychophysiological measures has been rapidly increasing over the past few years, partly because of the real-time properties that such measures offer (Bastiaansen et al. 2019), such as the potential to identify with high temporal precision which episodes of a commercial are most successful in eliciting emotional responses (Li, Scott, and Walters 2014; Moyle et al. 2017). In one study (S. B. Kim, Kim, and Bolls 2014), heart rate (HR), and skin conductance responses (SCRs) were used as proxies for attention and emotional arousal, respectively, in addition to self-reports. Participants viewed two types of marketing materials (video materials and high-imagery audio materials). While HR did not discriminate between the two types of materials, both SCRs and self-reports were found to be larger for video materials, and the authors conclude that “Psychophysiological-measure studies can provide valuable information that simply cannot be derived from conscious introspection or self-reporting. . . . Only psychophysiological recordings, like those employed in this study, can create a bridge into that system and develop an over-time record of change, time-locked to the delivery of the message” (S. B. Kim, Kim, and Bolls 2014, p. 73). In another study (Li et al. 2016), SCRs, fEMG, and self-reports were measured while participants watched destination advertisements. The results showed that compared with self-reports, both physiological measures better discriminated between different advertisements and between the pleasure (or valence) and arousal dimensions of emotions. These results further validate the use of psychophysiological research methods in tourism marketing. A subsequent study from the same authors (Li et al. 2017) directly compared the effect sizes of self-report data and psychophysiological data in a larger sample of participants while they watched 18 different destination commercials. The effects observed in the physiological data were weaker than those observed in the self-report data. In their discussion, the authors therefore express their concerns regarding the possible overestimation of the effects of self-report data on advertising effectiveness.
Measuring Emotions in Tourism Marketing Using EEG
The above studies all address the relationship between self-report measures and peripheral physiological measures (skin conductance, heart rate, and facial muscle activity). However, one central physiological measure (i.e., a direct measure of brain activity), namely EEG, seems to be particularly well suited for investigating the role of emotions in tourism marketing. When EEG is recorded from participants while they are viewing emotionally salient stimuli, the brain responses that are specifically related to the viewing of these stimuli can be isolated from other brain processes by specific averaging procedures (Luck 2014). The resulting signals, so-called event-related potentials (ERPs), are millisecond-by-millisecond reflections of underlying brain processes that contain peaks and troughs (referred to as ERP components) that have been very carefully related to sensory, cognitive, and emotional brain responses through decades of active research in the field of cognitive and affective neuroscience (see Luck and Kappenman 2011 for a comprehensive review of the literature). Specifically, research into the relationship between EEG and emotions has resulted in literally hundreds of scientific publications (for reviews, see Hajcak et al. 2012; Olofsson et al. 2008). Together, these studies have established in careful detail how the event-related potentials (ERPs) that can be derived from EEG measurements (Luck 2014) are modulated from millisecond to millisecond as a function of emotional valence and arousal (Hajcak et al. 2012; Olofsson et al. 2008). Notably, two components of the ERP have been identified as being robustly sensitive to emotional salience, namely, the so-called P2 (a positive-polarity deflection in the ERP that reaches a maximum over central areas of the scalp 200 ms after the onset of an emotionally salient stimulus), and the Late Positive Potential (LPP, a positive-polarity shift in ERP amplitude that is observed from 300 to 1,000 ms after stimulus onset over the posterior scalp). Both the P2 and the LPP increase in amplitude in response to stimuli that are more strongly valenced (either positively or negatively) and more arousing. It should be noted that the LPP has also been associated with recognition of previously presented stimuli (Rugg and Yonelinas 2003). However, when LPP amplitude increases are observed to co-occur with P2 amplitude increases, this can be seen as convincing evidence that the eliciting stimuli have increased emotional salience (Hajcak et al. 2012). In sum, the amplitude of the P2 and of the LPP can serve as objective measures of the extent to which specific stimuli elicit emotions. Especially when P2 and LPP amplitudes are compared across different categories of stimuli, firm conclusions can be reached about the differences in emotional salience of these stimulus categories.
As of this writing, only one study has explicitly addressed the use of ERPs (Bastiaansen et al. 2018) in tourism marketing research. This study focused on using organic destination movies as a means of destination marketing. In the study, participants either viewed a 10-minute excerpt of a destination movie (In Bruges, featuring the Belgian medieval city of Bruges), or a similar-length excerpt of another movie. Subsequently, they viewed stock pictures of Bruges and stock pictures of a substantially different destination (Kyoto). The authors observed that the pictures of Bruges elicited larger P2 and LPP components, but only for the group of participants that had previously viewed the destination movie. These results were interpreted to indicate that viewing an organic destination movie results in a stronger emotional salience of subsequently presented marketing materials.
However, the study by Bastiaansen et al. (2018) suffers from three shortcomings that potentially limited the generalizability of the findings. First, TV commercials, rather than organic destination movies, are the most common vehicle for destination advertisement. Second, the study did not encompass any measures of self-report, which raises the question of whether similar results could have been obtained using the methodologically much simpler approach of self-report measures. And third, the authors of the study used a fully between-subjects design. Therefore, despite the fact that participants were randomly assigned to one of the groups, it is possible that unthought-of differences between the groups (such as familiarity with the target destination) are at the basis of the observed differences.
The Present Study
The present study constitutes an effort to assess the robustness and generalizability of the findings from Bastiaansen et al. (2018), and extends the findings from both the latter study and the study from Li et al. (2017) by incorporating an explicit comparison of EEG measures and self-report measures. Specifically, the present study centers around a destination TV commercial for Zeeland, a heavily visited beach destination region in the Netherlands. The region features long, sandy beaches fringed with sand dunes, large green outdoor spaces, picturesque, medieval villages and is famous for its seafood-oriented gastronomy. With a total of 981 broadcasts reaching more than 356 million viewers, the TV commercial—complemented with an online strategy—has been credited with increasing both visitor numbers and website visits (a 21% increase in the number of overnight stays from 2012 to 2014, and a 93% increase in unique website visitors after the first year of broadcasting; Zeeland 2015). Participants viewed a set of (both stock and user-generated) pictures of Zeeland, after which half of them (the experimental group) either watched the commercial Land in Zee, while the other half (the control group) watched an unrelated TV commercial (featuring a dairy product). Then, all participants again viewed a (different) set of pictures from Zeeland. In a first experiment, EEG was recorded while participants were watching the pictures both before and after viewing the commercial. In a second experiment, a different set of participants rated each picture (again, both from the set before and from the set after watching the commercial) for emotional valence and emotional arousal following established procedures. Crucial, within-subjects comparisons consisted of the (difference in) amplitude of the P2 and LPP components of the ERP in response to pictures before and after viewing the TV commercial for the EEG experiment, and of the (difference in) self-reported valence and arousal ratings for the pictures before and after viewing the TV commercial for the behavioral experiment. Specifically, the following hypotheses were tested:
1) Watching a tourism destination TV commercial couples positive emotions to that destination, and as a result this increases the strength of the emotional response to subsequently presented pictures of the destination. This is expressed (1) in increased amplitudes for the P2 and LPP components of the ERP in response to pictures after having seen the TV commercial compared to before, and (2) in higher ratings of emotional valence and emotional arousal for pictures after having seen the TV commercial compared to before. These effects are present for the experimental group only.
2) The effect of watching a tourism destination TV commercial is more strongly expressed in self-report data than in psychophysiological data. This hypothesis is addressed by comparing the effects obtained in the EEG experiment and in the behavioral experiment.
Materials and Methods
All data reported in this study were collected between February and September 2015. Our study consisted of three parts. We first conducted a behavioral pretest to calibrate and select the different stimulus materials (pictures, TV commercials) with respect to the emotional responses they elicit. Second, we conducted an EEG experiment in order to collect emotional responses from the brain, both before and after having viewed the TV commercials. Third, we performed another and separate behavioral experiment (apart from the pretest), collecting behavioral ratings (valence and arousal scores), again both before and after having viewed the TV commercials. Designing separate experiments for the EEG and the behavioral measures has the disadvantage that these measures cannot be compared directly, as in a fully within-subjects design. However, the advantage is that this allows for designing the EEG experiment without an explicit rating task. in the EEG experiment we were looking for effects that are truly emotional, and therefore probably partly outside of conscious awareness of the participants. Incorporating an explicit rating task in the EEG experiment might have resulted in a more conscious, cognitive evaluation of the emotional salience of the stimulus materials, which would render the argument that observed effects are truly emotional in nature less powerful. Note that sample sizes in the three experiments are small (n = 23, 50, and 23, respectively) relative to samples typically used for questionnaire-based research. However, these sample sizes are typical for experimental studies using EEG data; the richness of the data collected from each “sample” (participant), which consists of recordings from many electrodes on the scalp (here 32), and many time points around the event of interest (here more than 500), allows for using statistical techniques that yield robust results (see the section on statistical analysis of EEG data).
Pretest
Participants
The behavioral pretest was conducted with a sample of 23 Dutch undergraduate students from a small professional university in the Netherlands. Characteristics of the pretest sample such as age, gender, and field of study were similar to those of the EEG and behavioral experiment sample (12 females, 11 males, age range 18-29, with an average of 21 years).
Stimulus materials
The stimulus materials for the pretest consisted of three short TV commercials and a set of 190 pictures. One TV commercial (“Land in Zee!”) was about Zeeland and had a length of 2 minutes 2 seconds. The second commercial was of Optimel (a dairy producing company), with a length of 2 minutes 30 seconds. The third clip was a commercial from Honda (a car brand) with a length of 1 minute. The latter two commercials were chosen based on their similarities with the first commercial: all three contained playful visual illusions (such as creating visual illusions with foreground / background perspectives) and had light, positive-mood background music matching in style.
The picture stimuli consisted of 190 pictures, both stock photography (99 pictures taken from the online resource “Beeldbank Zeeland,” beeldenbank.laatzeelandzien.nl, a website used by Zeeland’s destination marketing organization) and user-generated pictures (91, taken from the Fan van Zeeland website www.fanvanzeeland.nl. set up by Zeeland Marketing to spur tourists to produce and share attractive photos of destinations and experiences in the Zeeland region). All obtained pictures were publicly shared, and all were taken somewhere in the Dutch province of Zeeland. In order to ensure content validity, pictures were obtained from 5 different categories roughly corresponding to Zeeland’s five unique selling points: beaches (39 pictures), picturesque village scenes (40 pictures), food and other culinary experiences (39 pictures), natural landscapes (38 pictures), and outdoor activities, such as water sports and horseback riding (34) pictures. All pictures were rescaled to optimally fit into a frame of 600 pixels by 600 pixels while maintaining aspect ratio, and luminance was adjusted so that all five subsets were on average equiluminant.
Design and procedure
Participants’ emotional responses to the stimulus materials were quantified as follows: Participants were asked to rate every picture individually on a paper questionnaire that represented two 5-point response scales depicting self-assessment manikins, anthropomorphic figures that portray valence and arousal (see Bradley and Lang 1994 for details of the response scale). Lower scores on these scales denoted lower valence and lower arousal, respectively. Participants were seated in a computer classroom and were shown the stimulus materials on individual screens. For each participant separately, pictures were shown on the screen for 10 seconds, during which they filled in their ratings on the paper questionnaire. This procedure, which closely matches the procedure for generating the ratings of the IAPS database (Lang, Bradley, and Cuthbert 2005) was used for the 190 pictures of Zeeland (presented in random order), and then for the three TV commercials.
Results of the pretest
For each picture, we computed the average rating across the 23 participants, separately for valence and for arousal. Ratings were then averaged across all pictures. Valence ratings showed overall moderately positive scores (mean [M] = 3.45, standard error of the mean [SEM] = 0.023), and arousal ratings showed low to moderate levels of arousal (M = 2.55, SEM = 0.027). For the TV commercials, valence and arousal ratings indicated that all three commercials were quite positively valenced (Zeeland: M = 4.22, SEM = 0.13; Honda: M=3.91, SEM = 0.15; Optimel: M = 4.13, SEM = 0.19) and moderately arousing (Zeeland: M=3.43, SEM = 0.19; Honda: M=3.78, SEM = 0.22; Optimel: M=3.39, SEM = 0.26). The ratings for valence (F2,44 = 1.09, p = 0.346) and for arousal (F2,44 = 1.19, p = 0.315) did not differ for the three commercials. We therefore decided to use the Honda commercial, and not the Optimel commercial, as the control TV commercial in the EEG experiment, based on the argument that there was more content overlap between the Zeeland commercial and the Optimel commercial (both featured many outdoors scenes) than between the Zeeland commercial and the Honda commercial.
EEG Experiment
Participants
Fifty participants, students from a large university in the Netherlands, took part in the EEG experiment. All were right-handed, had normal or corrected-to-normal vision and hearing, did not use any psychoactive medication, and had no history of neurologic trauma. Before the start of the experiment, participants gave their written informed consent in accordance with ethical research standards. Participants were randomly assigned to either the experimental group or the control group. Six participants (three from each group) were excluded from further analysis because of excessive artifacts in their EEG recordings (Luck 2014). Therefore, the final sample consisted of 44 participants: 22 in the experimental group (11 females, mean age 20.6) and 22 in the control group (15 females, mean age 20.2). All participants had the Dutch nationality.
Design and procedure
Participants were randomly assigned to one of two groups (n=23 for each group), experimental (Zeeland) and control (Honda).
After having read the written instructions and given their written informed consent, participants were prepared for the EEG recordings and were familiarized with the EEG lab and equipment. They were seated in a dimly lit and sound-attenuating room, approximately 70 cm in front of a computer screen. Participants were instructed to sit in a relaxed position and to refrain from excessive head, body, and eye movements (including eye blinks), in order to avoid generating electrical artifacts (noise) that would be picked up by the EEG recording system.
The set of 190 pictures from Zeeland was split in two sets of 95 pictures (evenly distributed over the five different content categories, see the Stimulus Materials section). Participants in both groups first saw one of the two sets of 95 pictures. Order of presentation of the pictures within the set was randomized for each participant separately. Each of these 95 trials started with a black screen (150 ms), followed by the presentation of a picture (1000 ms). Then the picture disappeared from the screen, and three asterisks (white on a black background) appeared in the center of the screen for 1850 ms, indicating that the participant was allowed to blink. After every 19 pictures, the word “Pauze” appeared on screen, indicating that the participants could take a minibreak. The minibreak ended when a participant pressed a button on a button box in front of them, after which a new block of 19 pictures started.
After 5 such blocks, totaling 95 pictures, participants were allowed a short break, after which the participants in the experimental group viewed the Zeeland commercial, and the participants in the control group viewed the Honda commercial. After the commercial, the second set of pictures was presented to the participants in random order, in a way identical to the first set. Within each group, the order of presentation of the two picture sets was counterbalanced across participants so as to avoid order effects.
Participants had no other task than to passively view all stimulus materials, and the experimenter monitored both the participant (through a video connection with the EEG recording room) and the EEG signals throughout the experiment to ensure that participants were indeed viewing the stimulus materials.
EEG recordings
EEG signals were recorded from 32 standard locations on the scalp (see the black dots in Figures 2 and 4), using active Ag–AgCl electrodes (BioSemi, Amsterdam, the Netherlands) mounted in an elastic cap, and two additional electrodes placed on the mastoids. EEG was amplified in a frequency range between DC and 102 Hz (which is the typical frequency range of EEG signals) and digitized at a sampling rate of 512 Hz. Two additional electrodes served as an electrical reference (common mode sense [CMS] active electrode) and ground (driven right leg [DRL] passive electrode).
Vertical eye movements were monitored by placing additional electrodes in a bipolar derivation above and below the right eye, and horizontal eye movements were monitored by placing additional electrodes in a bipolar derivation on the outer canthi of both eyes. These electrodes measured electrical activity originated from eye movements (the so-called electro-oculogram, or EOG), and were used in the offline analysis to detect whether or not participants were refraining from eye movements and were actually watching the computer screen. Recording parameters for the EOG electrodes were the same as for the EEG electrodes.
EEG data analysis
Initial data analysis was performed with the software package Brain Vision Analyzer (Brain Products GmbH, Germany). EEG was re-referenced off-line to an average of left and right mastoids and bandpass filtered (0.01–30 Hz, 48 dB/octave). The continuously recorded EEG signals were then segmented into time segments of 1350 ms around the onset of each picture, consisting of a 150 ms prestimulus interval and a 1200 ms poststimulus interval in which the response to each picture could be identified. Then all segments were visually inspected for eye movement, muscle, and other artifacts that may have contaminated the true EEG signal, and segments containing artifacts were discarded from further analysis (10.2% of all the segments on average, which is a typical rejection rate for EEG experiments ). Next, a baseline correction was performed by subtracting, per segment, the average amplitude in the 150 prestimulus time window from all time points in that segment. This procedure corrects for offset differences between segments that would bias the subsequent averaging across segments. For each participant, the remaining EEG segments were then averaged separately in two categories: pictures presented prior to the TV commercial (Pre) or following the commercial (Post). This resulted in ERPs, at 32 electrode positions, for each picture category and each participant. These participant averages constitute the input for the statistical analyses (see below). Finally, the data were averaged across participants, separately for both the experimental and control groups. These grand averages were used for the graphical representation of the data only.
Statistical analyses of EEG data
The statistical analysis focused on the amplitude differences in two well-established ERP components known to be sensitive to modulations in emotional salience (for review, see Hajcak et al. 2012): the P2 component, from 175 to 225 ms after picture onset, and the LPP component, from 300 to 1,000 ms after picture onset.
The statistical significance of the difference in the amplitude of these three ERP components between conditions was evaluated by a cluster-based random permutation approach (Maris and Oostenveld 2007), implemented in the MATLAB toolbox Fieldtrip (Oostenveld et al. 2010). This nonparametric statistical analysis approach is designed for EEG and MEG research, and tests comparisons between 2 conditions, or groups. Crucially, it elegantly handles the multiple comparisons problem (which is substantial for the present data, given that we have 32 EEG channels to compare for each pairwise comparison). It naturally takes care of interactions between conditions and electrodes by identifying clusters of significant differences between conditions or groups in the spatial dimension, and effectively controls the type I error rate for multiple comparisons. Here is a brief description of the procedure. For more details, the reader is referred to Maris and Oostenveld (2007).
First, for every data channel (electrode), a simple dependent samples t test (for within-subjects comparisons) or independent samples t test (for between-subjects comparisons) is performed for a relevant contrast between 2 conditions. This yields p values that are not corrected for multiple comparisons. All t statistics that do not exceed a preset significance level (here 5%, two-tailed) are zeroed. Clusters of adjacent nonzero data points are computed, and for each cluster a cluster-level test statistic is calculated by taking the sum of all the individual t statistics within that cluster. Next, a null distribution is created as follows. Subject averages are randomly assigned to one of the two conditions (or groups) several times (here 2,000 times), and for each of these randomizations, cluster-level statistics are computed. For each randomization, the largest cluster-level statistic enters into the null distribution. Finally, the actually observed cluster-level test statistics are compared against the null distribution, and observed clusters falling in the highest or lowest 2.5th percentile are considered significant.
As said, the cluster-based random permutation procedure inherently allows only for pairwise comparisons. Therefore, we defined the following comparisons in order to test our hypotheses:
- Within-subjects comparison of each of the ERP components (P2 and LPP) before (pre) and after (post) exposure to the TV commercial for the experimental (Zeeland) group.
- Within-subjects comparison of each of the ERP components before (pre) and after (post) exposure to the TV commercial for the control (Honda) group.
Behavioral Experiment
Participants
For the behavioral study, we only used an experimental group, in order to verify whether the effects observed in the experimental group of the EEG experiment (see Results section) could be replicated with behavioral data. Twenty-three participants (students from the same professional university as the pretest took part in the experiment (15 females, mean age 21). All had normal or corrected-to-normal vision and did not use any psychoactive medication. Before the start of the experiment, participants gave their written informed consent, in accordance with ethical research standards.
Design and procedure
Participants’ self-reported emotional responses to the stimulus materials were quantified by a procedure that closely matches the procedure for generating the ratings of the IAPS database (Lang, Bradley, and Cuthbert 2005). Participants were seated in a computer classroom and were instructed about the ratings as described in the IAPS technical manual (Lang, Bradley, and Cuthbert 2005). They were asked to rate all of the 190 Zeeland pictures (see section on stimulus materials) on two 9-point response scales depicting self-assessment manikins, anthropomorphic figures that portray valence and arousal (see Bradley and Lang 1994 for details of the response scale), according to the following procedure: Participants were seated in a computer classroom and were shown the stimulus materials individually using the open-source stimulus presentation software OpenSesame (Mathôt, Schreij, and Theeuwes 2012). For each participant separately, pictures were shown on the screen one by one, and valence and arousal ratings were collected, in the following temporal sequence: First, the picture was displayed for 1,000 ms, after which the response scale for valence was added below the picture for another 2,000 ms. Then, the participant’s response (pressing one of the numbers 1–9 on the alphabet keyboard) was collected during a maximum of 5,000 ms, after which a time-out was reached (nonvalid response). After the response (or the time-out), the response scale for arousal replaced the valence scale below the picture for 2,000 ms, and the response for the arousal score was collected, again for a maximum of 5,000 ms.
The 190 Zeeland pictures were divided into two equal blocks of 95 pictures each. Blocks were identical to the two stimulus blocks in the EEG experiment. Participants rated the first block of 95 stimuli, after which they watched the TV commercial of Zeeland. Then, they rated the second block of pictures. As for the EEG experiment, within each block the order of presentation of the pictures was randomized for each participant. Also, the order of the blocks was counterbalanced across participants in order to avoid possible order effects.
Statistical analysis
For a statistical analysis of the valence and arousal ratings before and after the Zeeland commercial, we computed for each picture the average rating across the 23 participants, separately for valence and for arousal. Ratings were then averaged across all pictures, separately for the pre–TV commercial picture block and for the post–TV commercial picture block. Finally, two dependent-samples t tests were performed, one comparing the valence ratings before and after the TV commercial, and one comparing the arousal ratings before and after the TV commercial.
Results
EEG Experiment
Zeeland group
The Event-related potentials (ERPs) to the Zeeland pictures presented before and after the experimental (Zeeland) TV commercial are given in Figure 1.

Top: Electrode labels and positions arranged topographically on a top view of the scalp. The data from the two highlighted electrodes are displayed in the bottom part of the figure. Bottom: Grand-average (N=22) event-related potential (ERP) time courses for the Zeeland pictures averaged over two representative electrodes (P3 and P4) for the experimental (or Zeeland) group, before and after viewing the Zeeland commercial. Shaded areas around the ERP time courses represent the standard errors around the mean; rectangular shaded areas indicate the time intervals used in the statistical analyses, and correspond to the P2 (175-225 ms post-stimulus) and LPP (300-1,000 ms poststimulus) components.
The cluster-based random permutation analyses comparing the different ERP components before and after the Zeeland commercial indicate that both the P2 component (p=0.045) and the LPP components (p=0.0150) are larger for pictures presented after the Zeeland commercial than for those presented before the commercial. Figure 2 shows the scalp topographies for these components, the scalp topographies of the pre–post differences, along with the cluster of electrodes for which these effects are significant.
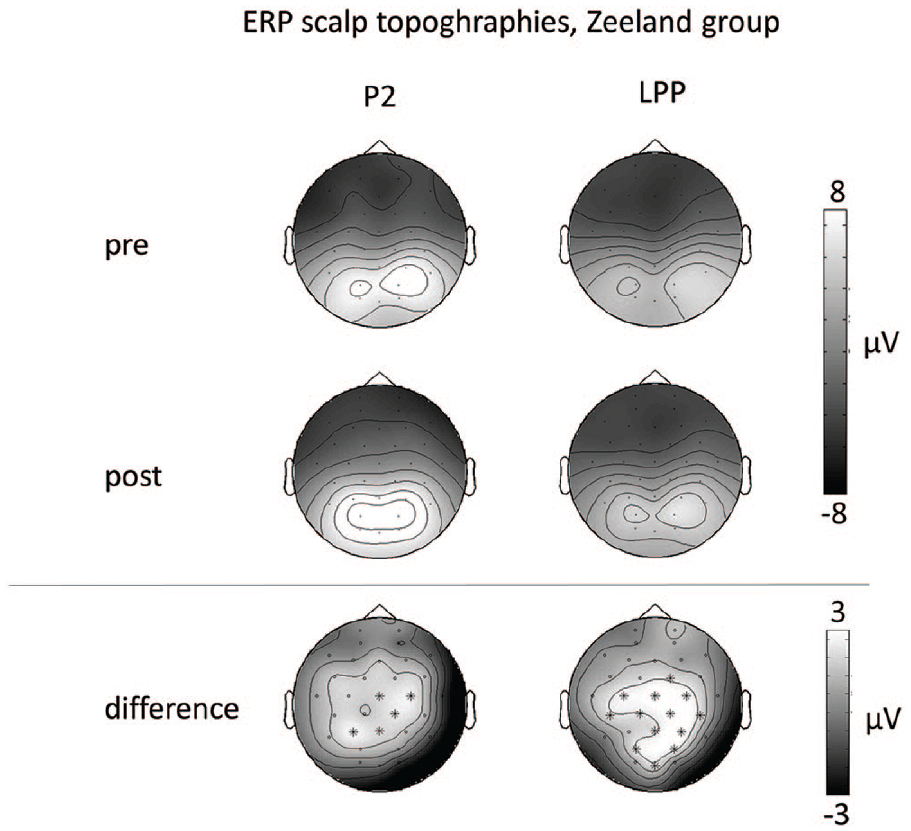
Grand-average ERP scalp topographies for the two ERP components, before (top row) and after (middle row) the Zeeland commercial. The bottom row shows the differences in the pre- vs postscalp topographies, with asterisks indicating the electrodes that are included in the significant clusters for each component.
Control group
The ERPs to pictures from Zeeland before and after the control (Honda) commercial are presented in Figure 3.

Grand-average event-related potentials (ERPs) for the Zeeland pictures the control (Honda) group (N=23), before and after viewing the Honda commercial. Figure layout is identical to that of Figure 1.
The cluster-based random permutation analyses comparing the different ERP components before and after the Honda commercial indicate that no significant differences are observed before and after the commercial both for the P2 and for the LPP (p = 0.13 and p = 0.15, respectively, for clusters with the lowest p values in these analyses). Figure 4 shows the scalp topographies for the two components, the scalp topographies of the pre–post differences, along with the cluster of electrodes for which these effects are significant.
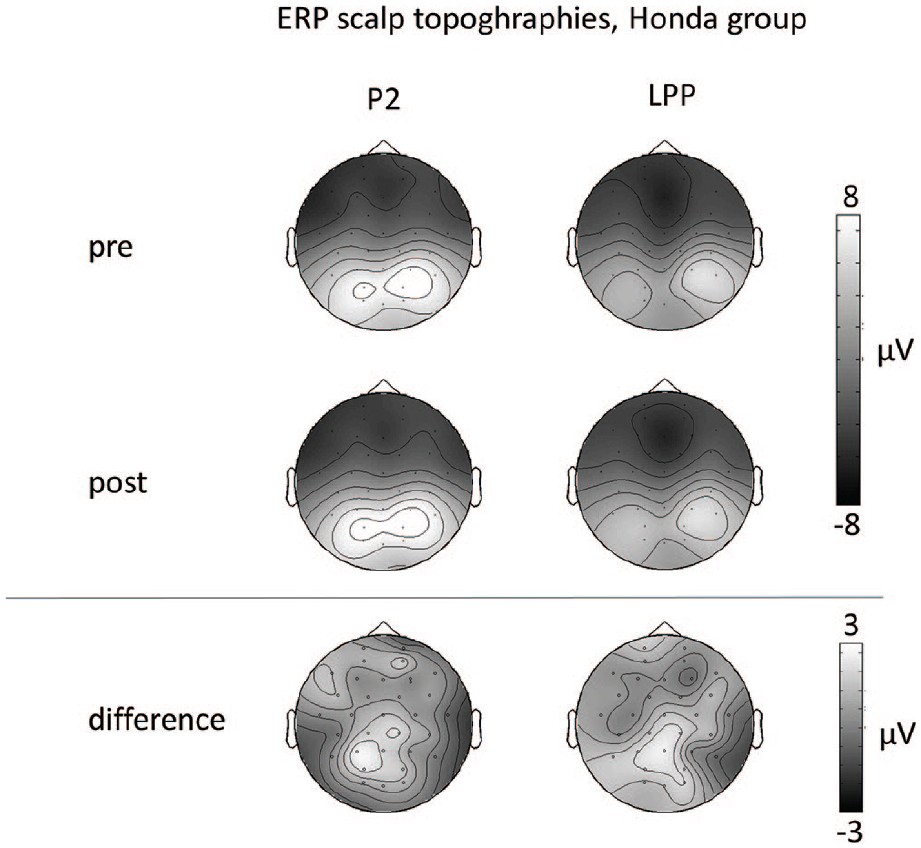
Grand-average ERP scalp topographies for the P2 and LPP components, before (top row) and after (middle row) the Honda commercial. The bottom row shows the difference scalp topographies. Note that no significant differences were observed between the P2 and LPP before and after viewing the Honda commercial in the control group.
Behavioral Experiment
The behavioral data showed that the Zeeland pictures elicited moderately positive valence scores, both prior to (M = 6.09, SD = 0.74) and following (M = 6.04, SD = 0.90) the viewing of the TV commercial from Zeeland. Arousal scores were low to moderate, again both before (M = 4.33, SD = 0.96) and after (M = 4.38, SD = 1.05) the TV commercial. Valence and arousal scores are graphically depicted in Figure 5. Crucially, the t tests indicated that both valence scores (t22 = 0.566, p = 0.577) and arousal scores (t22 = −0.357, p = 0.725) were not different before and after viewing the commercial.

Valence and arousal scores for the rating of pictures preceding (pre) and following (post) viewing the TV commercial from Zeeland. Error bars indicate the 95% confidence intervals.
Discussion
In this study, we performed an EEG and a behavioral self-report experiment, in order to determine the suitability of EEG-based event-related potentials (ERPs) for assessing how effective TV commercials promoting a tourism destination are in coupling a positive emotion to that destination. Further, we sought to establish the sensitivity of ERPs in this respect, in comparison with self-report measures of emotional valence and arousal.
In the ERP analysis, we focused on two ERP components that have previously been established to be sensitive to the emotional salience of visual stimuli (for review, see Hajcak et al. 2012), the P2 and the LPP. For both these components we observed significant differences in the amplitude before compared to after viewing the TV commercial, with larger amplitudes (corresponding with a stronger emotional response) being observed after having watched the TV commercial. This was true only for the group of participants that watched the Zeeland TV commercial, not for a comparable control group that watched an unrelated (yet otherwise comparable) TV commercial. In the behavioral experiment, we did not observe any differences in self-reported emotional valence and emotional arousal between pictures presented before and after viewing the Zeeland TV commercial.
Before concluding that the results from the EEG experiment support the hypothesis that watching a tourism destination TV commercial couples positive emotions to that destination, two alternative interpretations of the observed ERP effects (increases in P2 and LPP amplitude ) must be considered. First, late positive potentials like the LPP, besides being predominantly associated with emotional responses, have previously been associated with recognition of previously presented stimuli (Rugg and Yonelinas 2003). One may argue that the LPP increase merely reflects recognition of Zeeland images for the group of participants that had just watched the Zeeland TV commercial. Such an interpretation is unlikely, however, as it would not explain why in addition to the LPP, the P2 component also increases in amplitude for the Zeeland group. Modulations in amplitude of the P2 component have been unequivocally related to increased emotional responses (Hajcak et al. 2012). Therefore, the co-occurrence of amplitude increases both in P2 and LPP components clearly favors an interpretation of these effects in terms of increased emotional responses to the Zeeland pictures after having watched the Zeeland commercial.
Another alternative interpretation of the observed results is that watching the destination TV commercial activated a cognitive repertoire of vacations in the Zeeland group, and the increased emotional responses are a result of that, rather than of coupling emotions to the destination Zeeland. Although we cannot exclude this interpretation on the basis of the present study, the results of an ERP study in which watching an organic destination movie (Bastiaansen et al. 2018) induced increases in P2 and LPP components in response to a subsequent picture set indicates that this explanation is unlikely. In that study, the control group of participants watched an organic destination movie featuring a different destination than the target destination; hence, this should also have activated a cognitive repertoire of vacations. However, in Bastiaansen et al. (2018), P2 and LPP effects were only observed for the group of participants in which the destination movie and the subsequent picture set featured one and the same destination.
We can therefore conclude that the results from the EEG experiment support our first hypothesis, stating that watching a tourism destination TV commercial couples positive emotions to that destination. The null findings from the behavioral experiment however are not in line with this hypothesis. With regard to our second hypothesis, stating that the effect of watching a tourism destination TV commercial is more strongly expressed in self-report data than in psychophysiological data, we conclude that our results are in clear contradiction with this hypothesis, as no differences in self-reported emotional valence and emotional arousal were observed between pictures presented before and after viewing the Zeeland TV commercial.
Overall, our results clearly show that, at least in the current experimental paradigm, ERP measures of emotional salience are more sensitive in capturing the subtle process of coupling a positive emotion to a destination (and hence influencing affective destination image), than self-report measures. Together, these results constitute an important and useful step toward subsequent studies: the basic effect we anticipated has been observed over a pre-conscious time span, which allows for subsequent experimentation including more fine-grained manipulations that will serve to determine the different factors that make a TV commercial effective (such as the multisensory nature of the commercial, the effects of storytelling, or the differences between professionally designed commercials and user-generated video).
The differential sensitivity between EEG and self-report measures is in contradiction with previous findings (Li et al. 2017), who observed self-report measures of emotion in tourism advertising to be larger than psychophysiological measures. There are substantial differences however, between the experiment by Li et al. (2017) and the present study, which may potentially explain the different results.
For one, in the current study we used a central psychophysiological measure (i.e., EEG, a direct measure of brain activity), as opposed to Li et al. (2017), who used peripheral psychophysiological measures (i.e., SCRs and fEMG, which indirectly measure the influence of the central nervous system onto the peripheral nervous system). This seems to suggest that EEG may be a more sensitive measure of the effectiveness of tourism destination marketing than SCRs and fEMG, although we would like to emphasize that a comparison of the results of two individual studies is insufficient as a basis for drawing definitive conclusions on the matter. A second difference between the study by Li et al. (2017) and the present study is that in the former, physiological measures were obtained during the viewing of the TV commercials, while in the present study we compared responses to pictures of the destination before and after viewing the commercial. While this may in part explain differences in the results between the two studies, it is relevant to note that both approaches have advantages and disadvantages. The approach by Li et al. (2017) of measuring physiological responses during the commercial allows for identifying with excellent time resolution which parts of the commercial are more or less emotionally engaging. Therefore, this approach is particularly well suited for evaluating commercials and for giving advice on how to improve them. In contrast, the present “before and after” approach may be a better measure of the effect of watching a tourism destination TV commercial on affective destination image, and as such it is well suited for establishing the effectiveness of the commercial. More puzzling however is that in the present study we observe a null effect of the TV commercials on the self-report ratings of valence and arousal, whereas Li et al. (2017) found that self-reported effects were present, and even larger than physiological effects. This is surprising, as the self-report measures in the present study and that of Li et al. (2017) were exactly the same (i.e., valence and arousal ratings based on self-assessment Manikins, taken from Bradley and Lang 1994). One crucial difference may be that in the present study, ratings were obtained over a large set of picture stimuli, whereas in the Li et al. (2017) study, ratings were obtained for the TV commercials themselves. It is unclear at present, however, how this would explain the differences in the results between the two studies, and further empirical efforts should specifically address the relationship between self-report and physiology in more detail.
We want to emphasize an important limitation of using physiological measures in tourism marketing research. Physiological data (be it central or peripheral measures), however time-accurate and sensitive they may be, are proxies of emotional engagement, but do not differentiate between positively and negatively valenced emotions (with the possible exception of measures of facial expressions, such as facial EMG, which aim to capture positive and negative valence with varying degrees of success (Tan et al. 2016; Struiksma, van Boxtel, and van Berkum 2018). Therefore, any study that uses physiological measures such as EEG or SCRs in an attempt to evaluate the effectiveness of tourism destination marketing materials needs additional measures in order to determine unequivocally whether the experienced emotions are positively or negatively valenced. In the present study, we collected self-report data for the pictures and the commercials in the pretest (with scores ranging from 3.45 to 4.22 on a 5-point visual-report valence scale) and in the behavioral experiment (with scores around 6 on a similar, 9-point scale). These data indicate that overall, our marketing materials were associated with positive valence, from which we conclude that our physiological measures of (the differences in) emotional engagement most likely reflect positively valenced emotional engagement. However, the more fundamental issue here is that physiological measures are used to circumvent the validity issues that are associated with the use of self-reports, while at the same time one needs some form of self-report (be it quantitatively, as in the current study, or qualitatively, for example, through interviews or participant observation) in order to validate the directionality of emotional valence. At present, there does not seem to be a proper way out of this issue (see also Mauss and Robinson 2009). A safe strategy therefore is to collect different measures of emotion and to interpret these by triangulating the results of the different measurements.
Another limitation of the present study is that we do demonstrate an effect of a destination TV commercial on affective destination image, but the effect is only being probed just a few minutes after having viewed the commercial. While short-lived emotional responses may be instrumental in shaping tourist decision heuristics (McCabe, Li, and Chen 2016; Wattanacharoensil and La-ornual 2019), follow-up studies should aim at addressing the temporal extent of the observed effect (i.e., does it persist for a day, for a week, or even longer). Research on destination image formation (e.g., Baloglu and McCleary 1999; Kim and Yoon 2003; Pan 2011) has established that positive emotions are instrumental in shaping a positive affective destination image, which in turn has been demonstrated to have a strong influence on travel and recommendation decisions. We therefore argue that our approach is useful in evaluating destination marketing effectiveness. Although we admit that the present study does not directly measure how positive emotions influence attitude toward the destination and subsequent travel and recommendation behavior, we feel that we can safely build on the previously established knowledge in our field on these relationships. However, follow-up studies should more directly address the predictive value of the currently used ERP measures in influencing relevant outcomes such as willingness-to-recommend or revisit intentions.
Finally, another limitation is that we cannot exclude that the Zeeland commercial might have been inherently more pleasurable than the Honda commercial. Although the valence and ratings of these two commercials are similar, we cannot exclude the possibility that these ratings were not sufficiently sensitive to capture the more subtle and unconscious emotional differences between the two commercials. Further experimentation in which the emotional valence and arousal of the destination marketing materials is assessed through a triangulation of behavioral and psychophysiological measurements is needed to rule out this possibility.
Despite the different limitations and methodological considerations, the present study does demonstrate that EEG-based event-related potentials can be used as a concrete tool for evaluating the effectiveness of tourism destination TV commercials in influencing affective destination image, which is known to have a strong influence on travel and recommendation decisions (Chen and Tsai 2007; Echtner and Ritchie 1991). We understand that EEG and ERP methodology is fairly new to the field of tourism, and that in the day-to-day operations of marketing researchers there may be hesitations to adopt this methodology. At the same time, technological developments (both in terms of hardware and of software) make EEG and related ERP methods increasingly affordable, and accessible to nonexperts. This is further evidenced by the rapid emergence of consulting firms who are making a day-to-day activity of ERP studies for many marketers. We do believe that these favorable developments, combined with promising results on the usefulness of EEG in tourism marketing, may function as a sufficiently strong impetus for larger, and innovation-minded tourism marketing research groups to incorporate EEG in their toolbox. With the increased accessibility and ease of use of EEG recording devices and EEG analysis software, ERPs constitute a useful addition to the toolbox that is available to the tourism marketing researcher.
Footnotes
Declaration of Conflicting Interests
The author(s) declared no potential conflicts of interest with respect to the research, authorship, and/or publication of this article.
Funding
The author(s) received no financial support for the research, authorship, and/or publication of this article.
