
Abstract
This article provides an approach to the geographic and quantitative interpretation of tourism intensification, drawing on the concepts of fractals, and fractal dimension (D). Exploring tourism intensification in Lisbon, we first present a geographic construct that represents the spatial layout of tourism based on crowd-contributed spatial signatures advocating a collective sense of the “tourist city”. Then, we assess the tourism-related intensification patterns, based on the estimation of D, for different years. Significant statistical associations can be found between D and tourism intensification across the urban space. Intensification on tourism cores is more homogeneously distributed, yet it evolves into a more compact form of spatial organization. On the other hand, there is a decline in the degree of homogeneity of tourism intensification from tourism cores to the periphery. This approach has also proved useful for exploring tourism intensification in destinations at different hierarchical levels, such as in Lisbon and Oporto metropolitan areas.
Keywords
Introduction
Tourism is deeply involved with the physical, functional, and social components of the city (Gospodini 2001; G. Ashworth and Page 2011; Saarinen, Rogerson, and Hall 2017). The tourist pressure loaded on urban systems, in most cases, overlaps and interplays with other mobilities and place consumption practices (Edensor 2001), while posing enormous challenges in exploring tourism places, venues, and activities (Füller and Michel 2014; Richards 2011). This issue becomes a crucial factor in the broader context of tourism intensification, especially in urban settings, where there exist limitations regarding methodological approaches for tracking the evolution of the tourism phenomenon over time and space, as well as tourism-induced urban changes (Shoval 2018; G. Ashworth and Page 2011; Freytag and Bauder 2018; Saarinen, Rogerson, and Hall 2017). These limitations rely on the quantification and measurement approaches commonly used to understand the spatial dynamics of tourism in urban destinations (Pearce 2013; Saraniemi and Kylänen 2010; Novy 2018).
The geographic dimension of tourism is often analyzed considering two major factors—spatial concentration and colocation—supported in the conceptualization of industrial districts and clusters (Pearce 2013). Both concepts suggest the classification of urban areas with a touristic appeal into tourism “districts” or tourism (spatial) clusters, which essentially arise from agglomeration and the clustering of tourism-related activities. Such spatial classification implies the existence of “homogeneous” areas where tourism is perceived as a dominant function with (though not always) a notion of clear boundaries. Although this approach is not intended to separate tourism from the wider sociospatial environment (Dredge 1999; A. A. Lew 2017; A. Lew and McKercher 2006), these “bounded spaces” represent a kind of organizational unit for urban spaces that facilitates the management and planning of initiatives. For instance, district boundaries can serve as a spatial delimitation to collect statistical information. However, this generic knowledge appears to reflect a focus on mapping the features of urban tourism consumption and production, and the related spatial differentiation (Saarinen 2004; Saraniemi and Kylänen 2010), rather than to advance the understanding of the spatial organization of tourism in cities.
In most studies reflecting on tourism dynamics over space, the analysis of tourism vibrancy (i.e., tourist pressure and tourism activities) has relied on measurements of spatial concentration that describe the agglomeration of tourism activities through density degrees (see, e.g., Batista e Silva et al. 2018; Salas-Olmedo et al. 2018). Tourism features are aggregated into larger spatial units (using reference areas), and the spatial association between such areas is driven by means of a contiguity constraint or distance thresholds. In doing so, the measurement depends on the measuring scale, which is restricted to a single distance threshold, or to spatial adjacency. However, the applicability of a single distance threshold is questionable when the geographic system (the spatial distribution of tourism features) is characterized by varying degrees of concentration.
Furthermore, tourism vibrancy and intensification in urban areas cannot be objectively quantified if the measurements depend on spatial aggregations, as in most quantitative analyses that use city blocks, census blocks, or any other reference grid to aggregate individual data into larger spatial units. In the process of spatial aggregation, it is often assumed that tourism features are uniformly distributed across a given area. However, this is an important issue, particularly when conducting spatial analysis (Jiang and Liu 2012; Batty 2012), since the underlying spatial heterogeneity of urban tourism may vary across scales and, therefore, may not coincide with the static representation of aggregating units (e.g., city blocks or grid units from reference grids). In the context of measuring the spatial concentration of tourism activities, this means that the measurements will be partially influenced by the shape and scale of the aggregating unit, as exemplified by the Modifiable Areal Unit Problem (MAUP) (Openshaw 1983).
The importance of developing new approaches to examine the spatial organization of tourism is evident. Current research is more focused on mapping travel behavior and tourist nodes but with little attention paid to transition dynamics (over space and time) associated with tourism development (G. Ashworth and Page 2011; Shoval 2018). More work is needed to study tourism intensification as a means to comprehend the changes in tourist destinations over time; for instance, to understand the interplay between tourism and urban transformation that fosters changes in certain neighborhoods (Novy 2018; García-Hernández, De la Calle-Vaquero, and Yubero 2017; Cocola-Gant and Gago 2019).
This article attempts to develop an alternative approach for identifying patterns of tourism intensification in urban areas, building on the ideas from fractals and fractal dimension (Mandelbrot 1967; Batty 2012). Accordingly, the spatial arrangement of tourism-related activities is analyzed by means of fractal dimension (D). The fractal dimension refers to a measurement of the degree of space-filling, used to examine the patterns of spatial distribution of tourism features. To this end, we put forward a generic representation of the spatial layout of the “tourist city”, underpinned by the notion of “natural cities” (Jiang and Liu 2012; Jiang and Miao 2015). Then, we assess tourism-related intensification patterns in urban areas, based on the estimation of D for different years.
This approach provides a better understanding of the underlying heterogeneity of geographic space and related tourism activities. Instead of describing the spatial agglomeration of tourism activities through their degree of concentration (using density measures or traditional spatial concentration indexes), the application of D to characterize the spatial configuration of tourism leads to the comprehension of the space-filling process of tourism activities across the urban space, from disperse to more compact forms. Hence, D provides more information about the spatial distribution of tourism features. This method is more robust, making it possible to know how tourism-related urban functions organize spatially at different scales. This is the main contribution of this study. We develop an application of D for assessing the structural patterns that arise from the spatial organization of tourism activities.
In contrast to the extensive research using metrics of spatial concentration to explain the spatial distribution of tourist and tourism activities (see, e.g., Chua et al. 2016; Encalada et al. 2017; Gutiérrez et al. 2017; D. Li, Zhou, and Wang 2018; Martí, García-Mayor, and Serrano-Estrada 2020), this approach is unbiased with respect to arbitrary changes to any spatial classification and, thus, allows us to overcome limitations of the so-called MAUP. This approach is, therefore, devoted to solving the scale-dependent problem, as the analysis is not based on any spatial aggregation, nor does it use a proximity constraint to interpret the spatial association between tourism elements.
Our contribution proposes the systematic and empirical analysis of tourism intensification in cities. This approach provides an alternative way to monitor tourism intensification as well as to objectively compare tourism performance between different areas. Although our focus is on urban areas, we claim that this alternative approach has great potential to explore tourism intensification patterns in other destinations and at broader scales of analysis.
The study is driven by the availability of large data sets that provide information about the tourism supply-side and demand at a finer spatial resolution. We explore tourism intensification in the city of Lisbon, as well as in the Lisbon (LMA) and Oporto (OMA) metropolitan areas, as these are the urban destinations of excellence in Portugal, where the dynamics and intensification of the tourism phenomenon became more evident, and also because they are pivotal gateways for international tourist arrivals. Furthermore, we explore tourism intensification in mainland Portugal. At the city level, we use visitor space–time footprints from social media (i.e., geotagged photos retrieved from Flickr) as elucidative traces of their spatiotemporal behavior in 2012 and 2017 as well as data on the accommodation supply, available from Airbnb, in 2015 and 2017. At a larger scale, we use data from existing local accommodation operating as tourism service providers and registered in the National Registry of Local Accommodation (RNAL), in 2015 and 2019.
The remainder of this article is structured as follows. The following section discusses traditional approaches based on the delineation of homogeneous areas and introduces the proposed approach and how it leads to a new spatial layout of the “tourist city”. The third section presents a brief description of the data, as well as the methodology to identify patterns of tourism intensification. The fourth section outlines the results from the fractal analysis at both the city and regional levels. The final section summarizes the contributions and discusses the findings.
The Spatial Layout of a Tourism Destination Based on the Notion of “Natural Cities”
Traditional approaches for grasping the geographic dimension of destinations (e.g., tourism districts) rely on the concepts of industrial districts and clusters (Pearce 2013), in which the delineation of homogeneous areas results from patterns of spatial concentration and the colocation of tourism activities. The spatial arrangement of tourism features determines the spatial extent of such “districts”, while other properties associated with tourist activities and space use define the role of districts within the broader urban fabric, according to its functionality; for instance, tourist–historic districts, tourism business districts, and ethnic precincts. This approach is widely accepted in tourism research and has been used in a number of studies describing tourism districts (denoting a distinctive geographic area within a larger urban area) using similar terms, such as “urban tourism precincts” (Edwards, Griffin, and Hayllar 2008) and “tourist bubbles” (Judd and Fainstein 1999).
The mapping of a tourism destination using a scale-dependent representation adopts the delineation of boundaries but, in most cases, a proper definition of the spatial layout remains vague, as the spatial extent of such homogeneous areas is often generalized and poorly defined. The definition of tourism places as spatial units is often problematic because of the methodological concerns that arise in the delineation of boundaries (Saraniemi and Kylänen 2010; Saarinen 2004; Hernández-Martín et al. 2016). Specifically, the main limitation of mapping tourism based on homogeneous and discrete areas is that the boundaries are often not easily established. At present, there is no consensus about the spatial delineation of tourism places or destinations, such as the alleged tourism districts or precincts (Edwards, Griffin, and Hayllar 2008), and the “tourist city” (Judd and Fainstein 1999; G. J. Ashworth and Tunbridge 2000), in terms of either methods or criteria (Saraniemi and Kylänen 2010), and researchers have struggled with their geographic representation and meaning (Saarinen 2004).
Furthermore, the conventional delineations that advocate discrete areas may not agree with the “fluid geographies” of urban tourism production and consumption. The delineation of boundaries refuses the continuum of space and praxes emerging in the nexus between tourism precincts and the urban space with lesser tourism-related activity. For tourists, the administrative limits or district’s boundaries are not necessarily meaningful (Saarinen 2004), as they conceive activities imbricated with the everyday urban experience (Richards 2011). As denoted by some authors (Freytag and Bauder 2018; Füller and Michel 2014; Novy 2018), tourist mobility and place consumption involve places, venues, and activities located elsewhere from the so-called tourism districts.
In a broader geographical context, tourism is not spatially concentrated in discrete areas but, instead, unevenly distributed across the urban space. From a broader urban perspective, a set of interlinked tourism places (Baggio and Cooper 2010; Dredge 1999), such as tourism sites or districts, within an urban area may reflect the geographic construct of the city as a destination and, therefore, resemble the spatial layout of the “tourist city”. Here, the emphasis is to go beyond the view of cities (as tourism destinations) as units of analysis, commonly considered as single-aggregated “places” of origin and/or destination.
The term “natural cities” (Jiang and Liu 2012; Jiang and Miao 2015) advocates the fundamental thinking from the wisdom of the crowd (Surowiecki 2004) and describes cities using individual information that collectively determines an intelligible representation of the geographic space. As for natural cities, our approach to unveil the spatial layout of destinations (e.g., the “tourist city”) relies on a bottom–up approach, in which destinations can be outlined from massive quantities of geographic information about both the tourism supply-side and demand. “Natural cities” may be regarded as a good proxy for real cities (e.g., statistical cities) and can help provide new insights into the evolution of city systems (Jiang, Yin, and Liu 2015; Jiang and Miao 2015; Long et al. 2018).
It is known that people and sensors have been producing large amounts of data, revealing interesting aspects of how cities function (Kitchin 2013; González-Bailón 2013). Similarly, the use of digitally enabled sources of data (e.g., from Location-Based Social Media [LBSN]) plays an important role in offering possibilities to codify local knowledge for understanding urban sociospatial processes (Jenkins et al. 2016; Shelton, Poorthuis, and Zook 2015; Chen et al. 2019). For instance, LBSN data have yielded several advantages for the quantitative interpretation of tourists’ spatial–temporal behavior, tourist mobility, and tourist place consumption at different hierarchical levels (J. Li et al. 2018; Martí, Serrano-Estrada, and Nolasco-Cirugeda 2019).
The spatial layout of city tourism is, therefore, constructed from crowd-contributed spatial signatures reflecting geographic space and sociospatial relations (Jenkins et al. 2016; Shelton and Poorthuis 2019; Longley, Adnan, and Lansley 2015), which together constitute a collective sense of the “tourist city”. This approach refers to an alternative means, in which the geographies of tourism cities emerge from extensive crowd-contributed data representing the accommodation supply and tourism demand. The underlying principle following this geographic representation makes use of interlinked tourism places—which can be tourist sites and tourism districts—to design a larger destination, as does any individual place. Accordingly, the recurrence of tourist activity (e.g., leisure and recreation, food and beverage services, and accommodation) at certain locations forms the basis of a collective (spatial) sense of a given tourism place.
Based on the concept of “natural cities”, we leverage the granularity of nontraditional data to revisit the complex spatial layout of tourism that is likely to resemble the “tourist city”. This approach allows for an alternative means to refer to the geographic dimension of a tourism destination, in terms of its spatial structure. More precisely, the geographic representation of a tourism destination is not driven by means of delineated areas, which are often based on administrative boundaries. Instead, our approach identifies the spatial layout of a destination based on the relation between tourism elements (e.g., peer-to-peer accommodation), operationalized through the physical distance between such features. This approach enables to assess to what extent local interaction between different tourism elements gives rise to a wider structure. Through this generic representation of tourism places, we can systematically determine the spatial layout of tourism destinations (e.g., tourism districts, the “tourist city”). The method for deriving the spatial layout of tourism is further developed in the next sections.
Measuring Tourism Intensification: A Fractal Analysis
In urban geography, fractal analysis has allowed researchers to gain insights into the spatial organization of urban areas (Batty 2012; Batty and Longley 1994). For instance, the application of D to the study of urban morphology has enabled the comparison of built-up patterns and urban forms between cities. Another application of fractal analysis has also shown the value of measuring D for understanding urban growth (Long et al. 2018; Encarnação et al. 2012) and urban land use changes (Feng and Chen 2010).
In this article, we propose an alternative approach that can shed light on the geographic and quantitative interpretation of tourism vibrancy and intensification, drawing on the concepts of fractals and scaling. We claim that the presented geographic representation of city tourism, which is based on the notion of “natural cities”, can be treated as a fractal and, thus, cannot be described with traditional measures such as length, area, volume, or density. On the contrary, it can be better characterized by looking at the fractal or scaling structure of the spatial layout itself. Scaling denotes the property by which a geographic feature, when examined at increasingly finer scales, is seen to be statistically self-similar (i.e., the underlying pattern tends to resemble itself at a variety of scales). The self-similarity property can be interpreted by the recurring presence of tourism features that are more spatially agglomerated. In this line, it is the self-similarity property that makes visualization of the structure of tourism cities conceivable. A fractal descriptor can span distinct measurement scales. In other words, changing measurement scales will not lead to different measurement results. This approach also avoids any process of spatial aggregation since the measurement is reliant on individual data.
Therefore, tourism is described by reflecting on the self-similarity property of the city tourism spatial layout, using the fractal dimension. Specifically, the fractal dimension is used to assess the degree of space-filling of tourism activities within a destination. The patterns of tourism vibrancy characterized by D are essentially different from the patterns given by density measurements. The fractal-based method advances the understanding of tourism dynamics over space since it can distinguish the spatial alignment of tourism activities, indicating whether they are more prone to dispersion or compactness. Then, changes in D can reflect differences in the spatial distribution and concentration of tourism elements.
The fractal dimension can be estimated with the use of different methods. To obtain D, we use one of the most widely applied methods in spatial analysis (Shen 2002; Batty and Longley 1994), the standard box-counting method, which is a measure of how the occupied area increases as the scale increases. Roughly, the values of D range from 1 to 2, and D <1 indicates isolated features. As D becomes closer to 2, it represents a very convoluted shape, much like a two-dimensional surface with a higher degree of space-filling. The D values are interpreted together with the length of the network (derived from the spatial layout), indicating whether the spatial distribution tends to be more dispersed or more concentrated toward compactness. Higher values of D denote areas where tourism vibrancy is denser while having a greater intensity, when compared to other areas of the “tourist city”. Otherwise, D may function as an indicator of tourism-related shrinking areas.
Material and Methods
The approach to measuring tourism intensification in urban areas is outlined in the following: First, we put forward a generic representation of the city tourism spatial layout, based on the notion of “natural cities”. The spatial layouts were built separately using data from Flickr, Airbnb, and RNAL that correspond to two distinct periods (t0 and t1). Then, each spatial layout was segmented using a regular grid, and we estimated the local fractal dimension by calculating D for each new segment. This process was repeated for the resulting spatial layouts for t0 and t1. Finally, tourism intensification was denoted by changes in D values between t1 and t0, for the corresponding segments.
Furthermore, we identified groups of segments where fractal behavior tends to be similar over space and time. The groups were derived using an implementation of the k-means clustering algorithm. By analyzing the changes of D distribution in such groups, we can further understand tourism intensification and how it differs from one area to another. The clustering analysis helped to obtain a better interpretation of results; however, the focus of the proposed approach relies on the estimation of the fractal dimension.
Data
Visitor Data Set
The data set consists of approximately 20,300 geotagged photos uploaded to Flickr in 2012 and 2017. The data were collected using the Lisbon city boundaries. First, we downloaded all photos available on Flickr. Then, we identified city visitors using a time-based classification (Girardin et al. 2008; Encalada et al. 2017) that takes as a reference the average length of stay of international guests in the destination. All Flickr users with photos posted over less than 4 days were considered as visitors. We use the geospatial references of the photos as a proxy of the spatial behavior of visitors within the destination. Segmentation into local and visitor data sets was possible, as photo records were available jointly with other attributes, such as time stamps, photo ID, and user ID. Repeated users with online activity over more than one year were also removed from the data set. The digital footprints corresponded to approximately 1960 visitors. To follow the changes in tourism intensification patterns over time—t0 and t1—we used data from two distinct years. In this line, geotagged data from Flickr corresponded to the earliest (2012) and latest (2017) records available from the original data set.
Peer-to-Peer Accommodation Data Sets
The Lisbon data set contains 5,653 Airbnb rentals in 2015 and 16,925 in 2017. We used data packages from TomSlee 1 and InsideAirbnb. 2 According to data contributors, the information corresponded to the available supply of peer-to-peer accommodation at the moment of data collection. Information was gathered from several days within a year. We merged all data sets corresponding to 2015 and 2017, separately. For each year, we compared the rentals in different data sets and selected only the distinct ones. We also compared other attributes, such as the number of guests that each rental can accommodate (NAC), and coordinates (latitude and longitude). We selected the maximum values of NAC for matching rentals, to obtain an estimate of the total accommodation supply available on Airbnb (Table 1). Coordinates from repeated rooms were compared to verify whether they matched, and nonmatching records were removed.
Annual Count of Accommodations in Lisbon, from 2015 to 2016.
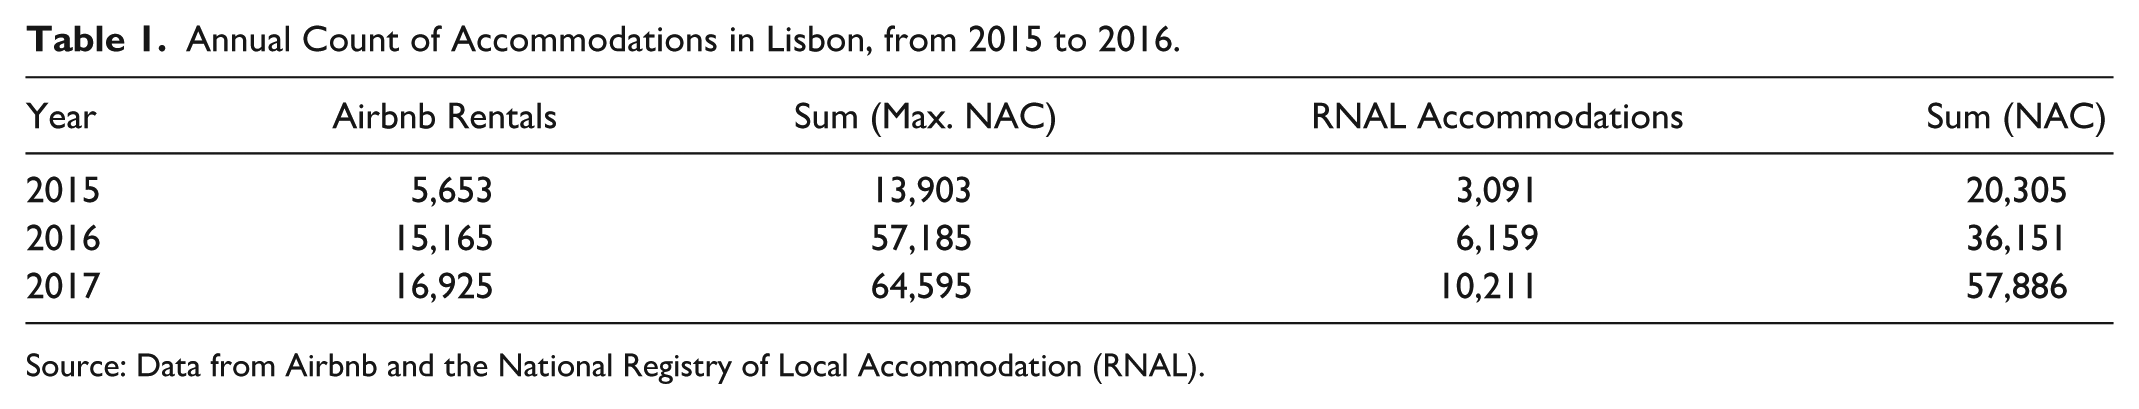
Source: Data from Airbnb and the National Registry of Local Accommodation (RNAL).
The data set corresponding to metropolitan areas in 2015 consisted of 4,369 and 1,383 accommodations in LMA and OMA, respectively. In 2019, it consisted of 23,722 in LMA and 9,190 in OMA. We segmented accommodations by year with reference to the opening day. All suppliers registered in the RNAL from 2000 to 2015 were considered for the first year of analysis, and similarly for 2019.
We also present data from the RNAL at the national level. The Portugal data set consisted of 22,867 suppliers in 2015 and 76,130 in 2019. The selection of data from such years was done mainly to reflect changes in tourism vibrancy in two distinct periods. Accommodation data from Airbnb and the RNAL corresponded to the earliest and latest records available from those two data sets.
Crowdsourcing the Spatial Layout of the “Tourist City”
To obtain the spatial layout, we refer to the method for deriving “natural cities” (Jiang and Liu 2012; Jiang and Miao 2015). Based on individual observations, we constructed a triangular irregular network (TIN) which satisfied the Delaunay triangle criterion. To form the network, point features were linked to neighboring nodes with a series of edges. The nodes represent the precise locations of tourists and accommodations within the destination, whereas the edges represent the spatial relations between concomitant physical locations that are often assumed to be spatially distinct from one another. At the collective level, the TIN is shaped by a higher concentration of edges in areas with a higher presence of tourists or a greater supply of peer-to-peer accommodation.
Once the TIN was constructed, we obtained an overall view of the spatial layout. However, a meaningful outline emerged by applying the head–tail division rule (Jiang 2015). As observations tend to be more concentrated in some areas as opposed to evenly distributed across the destination, the statistical distribution of TIN edges expresses the fact that smaller edges are much more numerous than larger ones, indicating a heavy-tailed distribution. The head–tail division rule takes the average length of the overall TIN edges as reference, in order to split the spatial layout into a set that includes only the edges below the average (tail) and excludes the edges above the average (head). As a result of this data partition, the spatial layout can be objectively reconfigured by expressing the ensemble of edges composed by the tail.
The idea behind the partition rule is a data-driven technique for defining a kind of envelope of the spatial layout without distorting its underlying (spatial) hierarchy. Although the resulting set may include several patches, it needs to be regarded as a sole unit that constitutes the whole spatial layout. In the resulting spatial layouts, the tourism cores and other well-separated tourist spots surrounding those cores can be clearly identified.
Differing from the original geographic representation of “natural cities”, we suggest that the spatial layout of tourism should remain as a set of edges, instead of seeing it as a continuous surface reproduced by spatial patches. This representation stresses the ties between different elements, which are established by either the tourist’s locations or the accommodations, as an indicator for understanding tourist space. For this, we assume that tourism vibrancy will not fill the urban space. Then, the total length of the network may give us an idea of the extent to which tourism fills the space it occupies (similar to the notion of a space-filling curve).
For the case of Lisbon city, the spatial layouts were built based on data from visitors’ digital footprints (Flickr) and peer-to-peer accommodation (Airbnb). We further derived the spatial layouts using data about the accommodation supply in metropolitan areas, and in mainland Portugal, obtained from the RNAL. The spatial layout of tourism can be easily derived using GIS-based tools. The resulting networks (TINs) for Lisbon city, metropolitan areas, and mainland Portugal are available in the supplementary material.
Measuring Tourism Intensification: ht-index and Standard Box-Counting
Two methods are applied for measuring the fractal behavior that provide complementary insights on the fractality of tourism and its intensification patterns: the ht-index and the standard box-counting method. The former is more focused on the global level and detects the scaling patterns of the resulting geographic features. This index allows us to determine whether the spatial layout can be treated as fractal. With the latter, we measure the fractal behavior in different areas that have been previously segmented using a regular grid. Other methods for estimating the fractal dimension include the mass radius and dilation (Keersmaecker, Frankhauser, and Thomas 2003). Similarly, some metrics have been proposed for characterizing the fractal nature of geographic features, for example, the ht-index, the CRG index, and the RA index (Gao et al. 2017). For this study, the ht-index was selected because it is linked to the head–tail division rule used to derive the spatial layout of tourism. Respectively, the box-counting method facilitates the application of the fractal dimension to the spatial layout represented by vector data. Both methods are briefly described in this section.
The calculation of the ht-index is given by the head–tail division rule. In Figure 1, the edges in the TINs show a heavy-tailed distribution. This scheme divides the data into two unbalanced parts, with most edges having shorter lengths and a minority of edges with longer lengths (called the “head”). The index is calculated by iteratively performing the division rule on the head parts, until the division is no longer unbalanced (i.e., the number of edges included in both the head and the tail is similar). We consider it to be an unbalanced division when the head part represents no more than 30% of the overall observations. The value of the index is given by one plus the number of iterations. A higher ht-index value indicates a higher scaling hierarchy in the underlying (spatial) structure of the geographic feature.
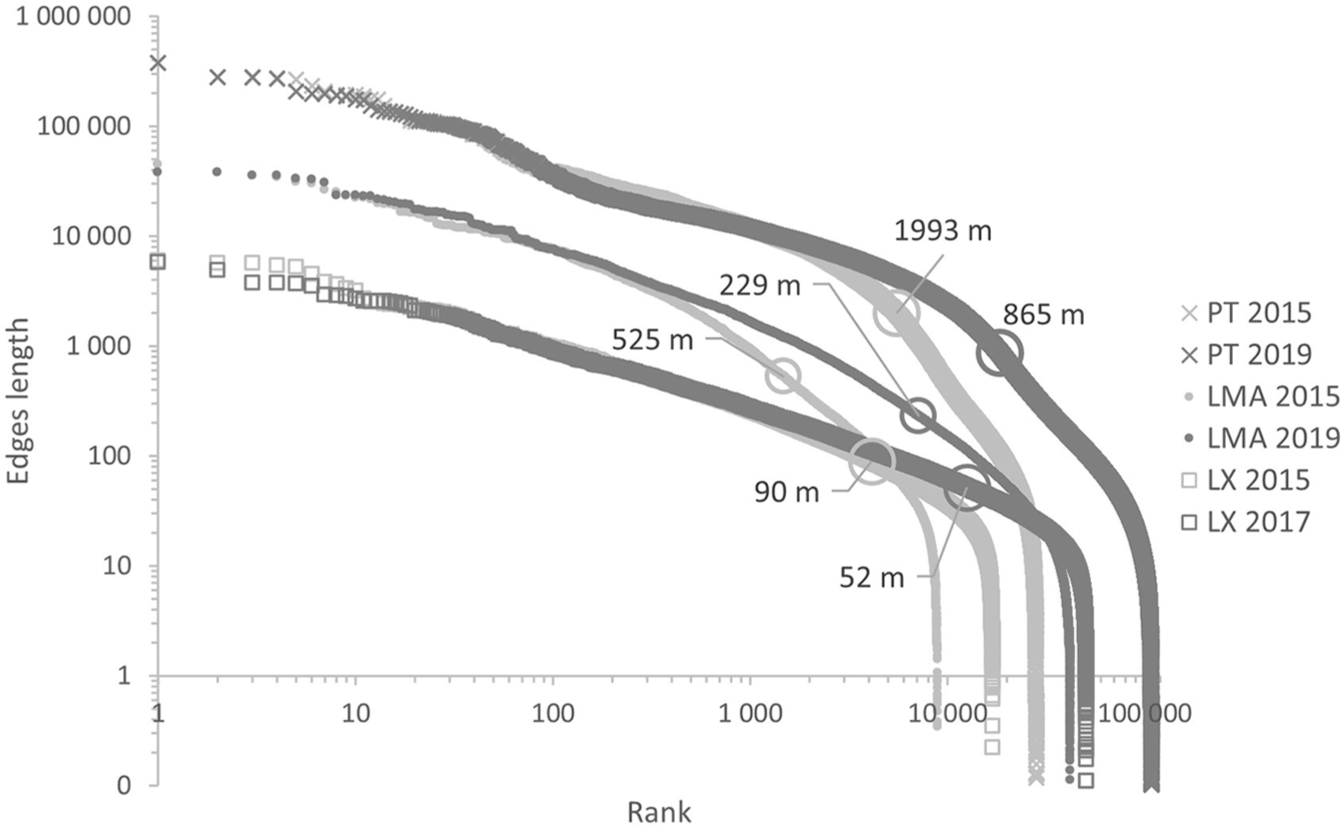
Distribution of edges derived from TINs representing the spatial layouts of tourism, based on data from the accommodation supply for Lisbon (LX), Lisbon metropolitan area (LMA), and mainland Portugal (PT). Circles denotes the cut-off distance (in meters) used to derive the corresponding spatial layouts.
The box-counting method is straightforward. First, it begins by covering an area with grids of different mesh sizes (s). Then, it counts the number of units that intersect an object (N), for all grid sizes. By plotting log(N) versus log(s), it is possible to verify whether it fits a logarithmic linear regression. D is given by the absolute value of the slope of the fit line. To ensure that the pattern fits the fractal law, we consider only D values when the coefficient of regression (R2) ≥ 0.99.
In this study, we assess tourism intensification by comparing the fractal behavior of tourism between two different periods (t0 and t1). Before applying the box-counting method, the spatial layouts were segmented using regular grids overlapping the study areas. The new segmented areas encompassed approximately 16,384 m2 in Lisbon, and 1 × 10⁶ m2 in metropolitan areas and mainland Portugal. Then, we estimated local fractal dimensions by calculating D for each new segment, and for the corresponding spatial layouts representing tourism vibrancy at t0 and t1, separately. We adopted five scales to run the box-counting. At the city level, we used boxes with sizes ranging from 128/2 to 128/32 m. In the metropolitan areas and mainland Portugal, the box sizes ranged from 1,000/2 to 1,000/32 m. We ran the calculation using GIS-based tools.
Clustering Analysis for Interpreting Tourism Intensification in Different Areas
Once the D values were estimated for distinct periods, we identified groups of segments sharing similar fractal behavior by an application of k-means clustering. The measure of tourism intensification in such clusters could be derived by looking at the changes in D values between t0 and t1. Therefore, the D distributions at t0 and t1 were compared for each cluster. We performed the clustering analysis using the D values jointly with the spatial references of the corresponding segments (i.e., the coordinates of each segment’s centroid). For this, D and the coordinates were normalized between 0 and 1, based on a minimum–maximum normalization. The outcomes of this clustering analysis indicated zones with similar intensification processes. We used the tclust R package (Fritz, García-Escudero, and Mayo-Iscar 2012) to perform the clustering analysis, because it can handle noisy data and provides graphical exploratory tools to help make interactive choices concerning the selection of the number of clusters and trimming the outliers.
The main value of the clustering is not the determination of binary boundaries between clusters (or zones); instead, it is the facilitation of geographic reading and interpretation of tourism intensification. As denoted in the silhouette plots (Appendixes A and B), the clusters may include some doubtful assignments (i.e., a segment may correspond to one or another cluster); however, most of these segments are spatially located in the cluster frontiers. This is due to the fuzzy transition between neighboring clusters. A further discussion on the improvement of cluster assignment is outside the scope of this study.
Results
General Patterns of Tourism Intensification
Figure 1 shows the distribution of edge lengths derived from TINs and demonstrates the cut-off (in meters) that defines the resulting spatial layouts. The long-tailed distributions indicate that there are more small edges than large ones, which result from many spatially agglomerated observations. We found that there is a downward trend of the cut-off values for determining the corresponding spatial layouts in different years, and at different hierarchical levels. This points to a greater increase in the number of local accommodations that are located within or closer to areas where the number of existing units was already relatively higher.
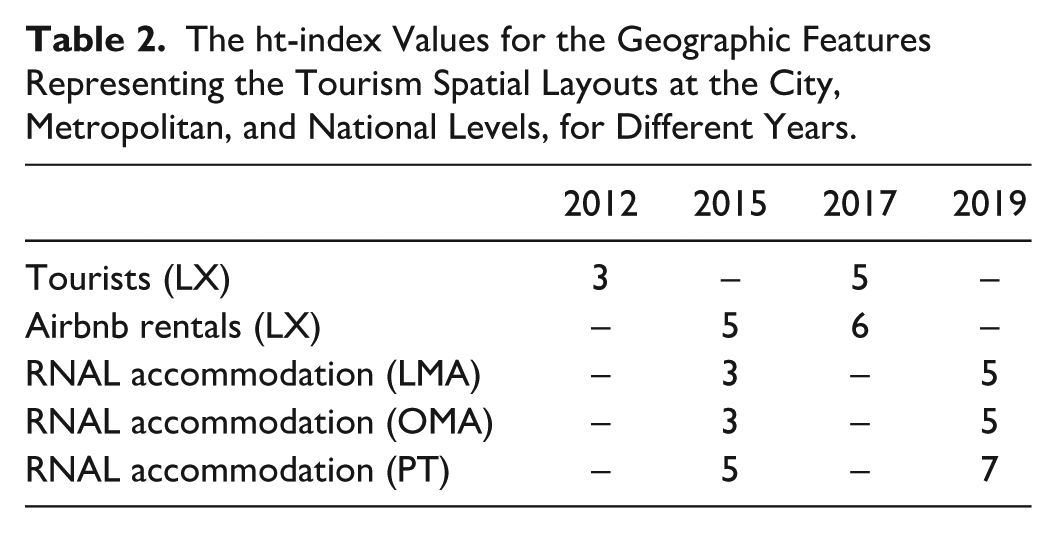
The ht-index results indicate that there existed a recurring pattern that formed a scaling hierarchy (Table 2). In all cases, the scaling pattern recurred many times (i.e., ht-index values ≥ 3), demonstrating that the resulting geographic features portray a fractal pattern. The increases in ht-index values indicate a clear functional development related to tourism activities, at the city, regional, and national levels. This suggests that tourism features are getting more clustered and complex, denoting a spatial organization that is highly self-similar (Table 2 and Figure 2). Accordingly, it has been verified that tourism activities are strongly organized around a central cluster. The comparison of D values across time (Figure 2) has shown that the evolution of tourism vibrancy was progressively self-organized around such alleged cores (e.g., tourist-historic districts, tourist-business districts), and that tourism places (e.g., cities at a wider level, and tourism districts) became denser in recent years. In addition, this provides some evidence that tourism intensification is accompanied by a self-structuring process that appears to reflect a tendency of homogenization and fragmentation.
The ht-index Values for the Geographic Features Representing the Tourism Spatial Layouts at the City, Metropolitan, and National Levels, for Different Years.

Fractal dimension (D) and the occupied space of tourism activities. D and length of the network for corresponding segments, at t0 and t1. Tourism demand (Flickr data) and accommodation supply (Airbnb data) in Lisbon (LX); accommodation supply from the National Registry of Local Accommodation (RNAL) in Lisbon (LMA) and Oporto (OMA) metropolitan areas, and in mainland Portugal (PT). Only segments with R2 ≥0.99 are represented in the charts.
Figure 3 shows the spatial distribution of D values corresponding to segments overlapping Lisbon area, for different years. D values of those segments overlapping main areas from tourist cores had a significant increase in intensity. In the most recent years, segments with higher D values ≥1.7 are much more numerous and show greater spatial coverage (Figure 3, right panels), indicating a deeper agglomeration of tourism services (e.g., accommodation) and a higher spatial concentration of tourists within these areas. Moreover, tourism expansion to neighboring areas leads to a continuous reconfiguration of the spatial layout. This contrasts with the static and discrete understanding of what constitutes tourism delineated areas (e.g., tourism micro-centralities). Segments with D values around 1 indicate those areas where tourist pressure and peer-to-peer accommodation emerged with a greater degree of dispersion, mostly aligned to peripheries and marginalized areas.
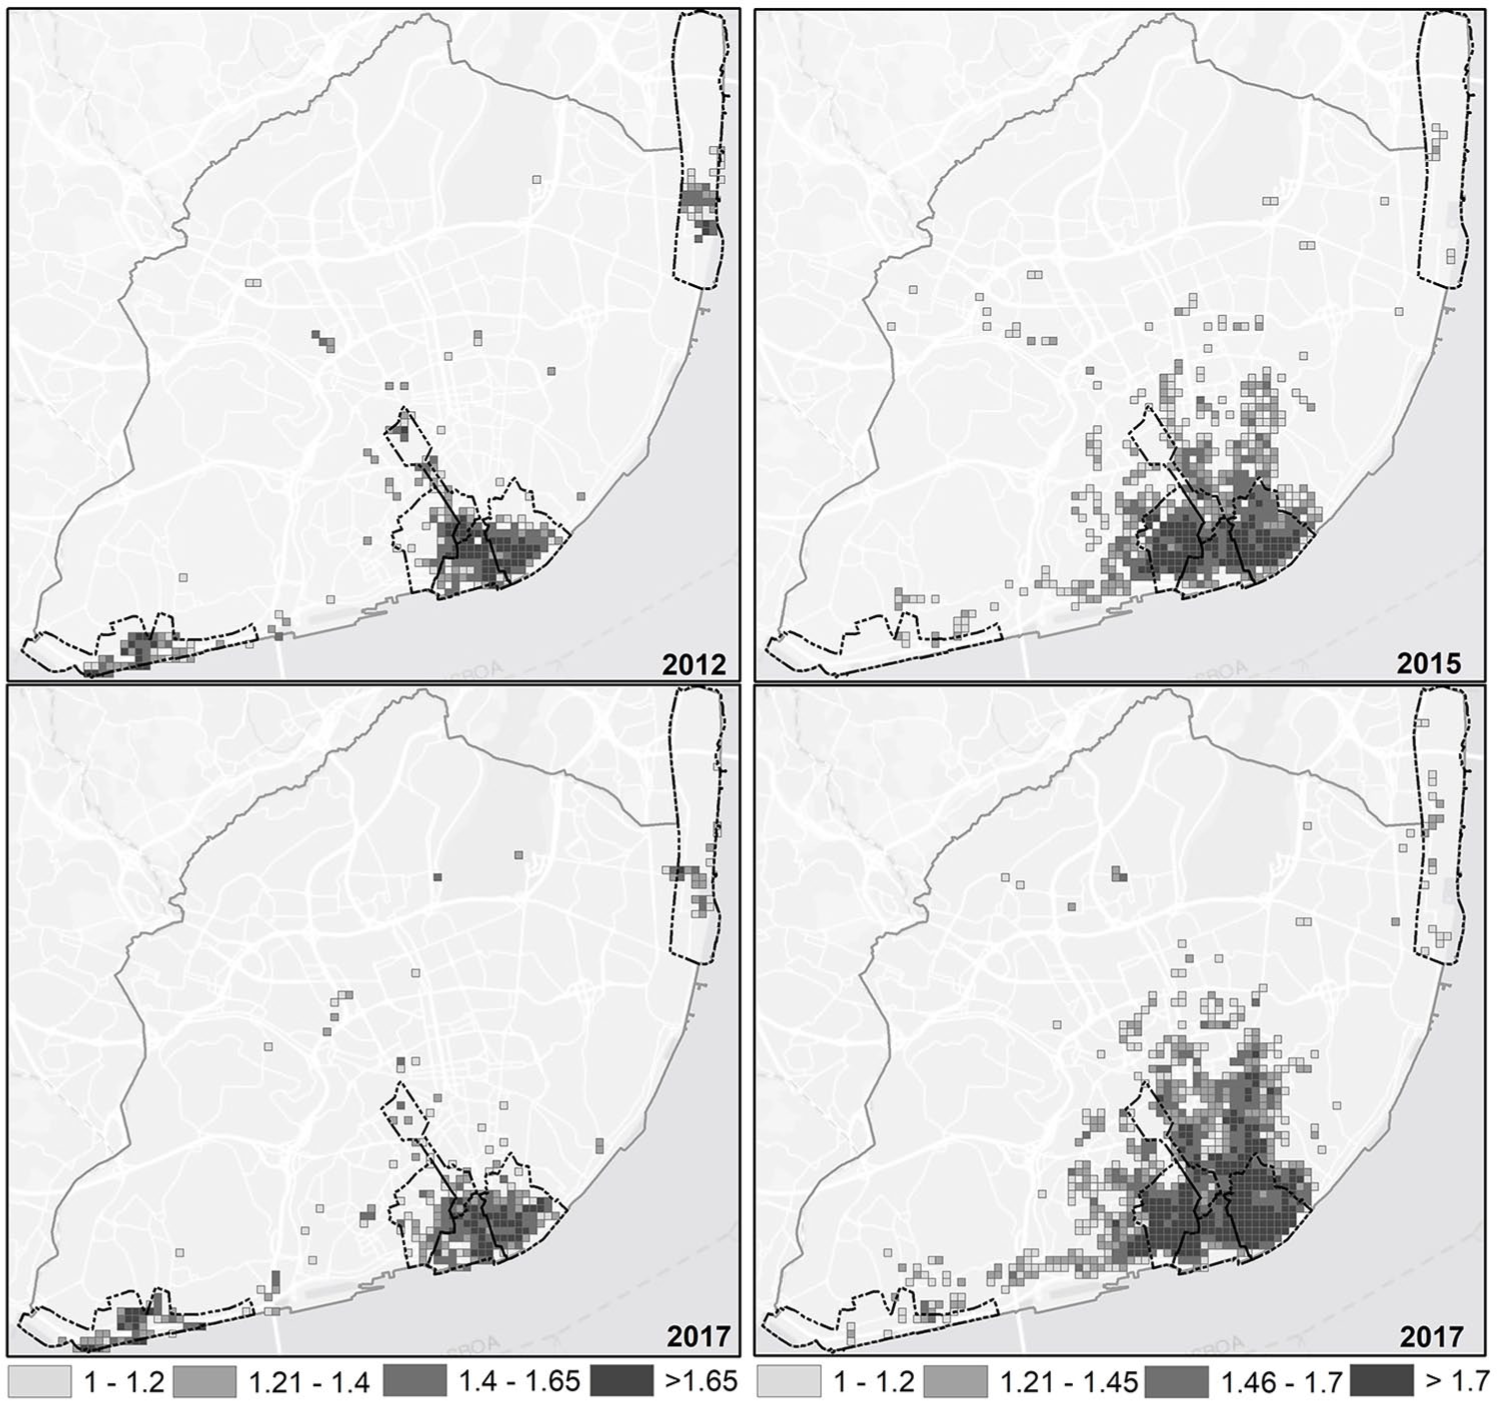
Fractal dimension (D) of tourism in Lisbon, based on tourists’ digital footprints from social media—Flickr data (left panels) and accommodation supply data from Airbnb (right panels). Segments with D <1 are not displayed. Dashed lines refer to Tourism micro-centralities, and the gray line refers to the city boundaries.
At a wider level, the accommodation supply and tourist presence increasingly occupied the urban space, with a vibrant intensification in cores and a clear expansion to “inner” areas, sometimes spatially disconnected from tourist nodes. Tourism vibrancy showed an increasing pressure on urban areas over the years. Specifically, the growth of the accommodation supply seems to be more intense in urban areas, leading to a higher level of compactness (Figure 4A). This was indicated by the greater D values obtained from the analysis of the local accommodation supply (RNAL) in the last year (2019), for instance, in segments that overlapped the statistical cities (Figure 4).
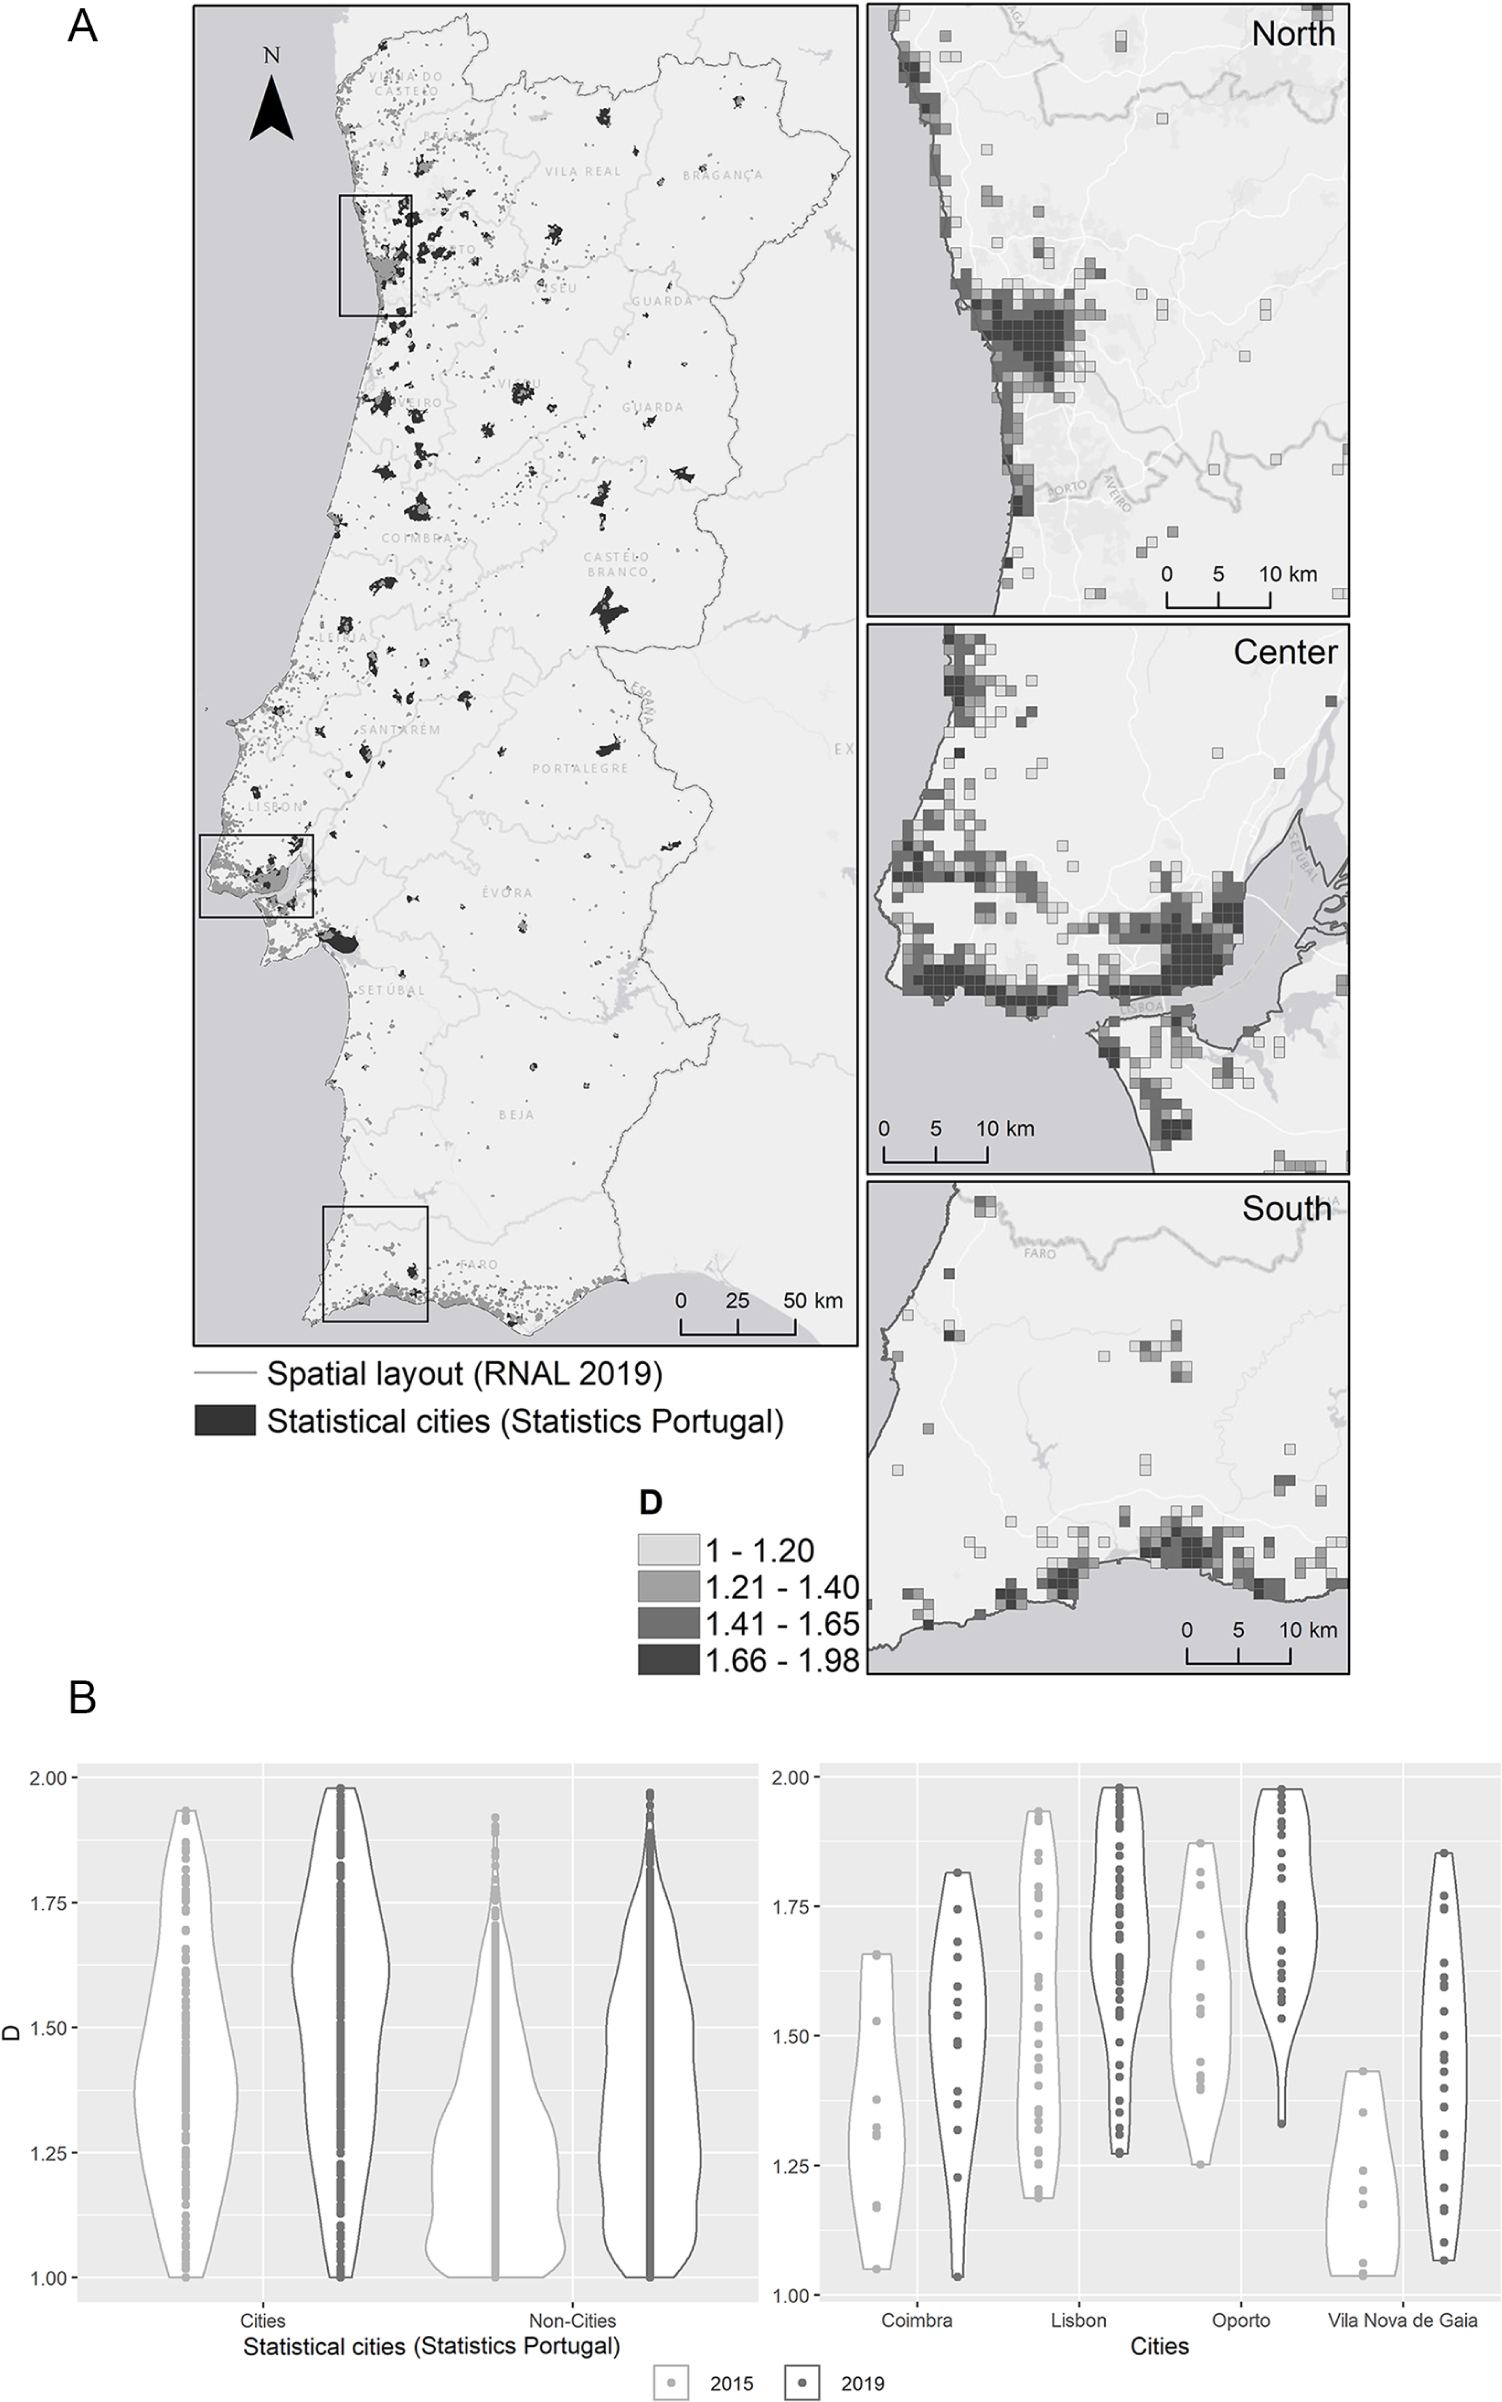
(A) Tourism spatial layout for mainland Portugal, using data from the accommodation supply available on the National Registry of Local Accommodation (RNAL) in 2019 (left panel). Fractal dimension (D) of tourism in 2019 (right panels). Segments with D <1 are not displayed. (B) Tourism intensification in cities. D values associated to the spatial concentration of the local accommodation supply (from RNAL) in mainland Portugal, at both timestamps. Left panel: Segments that overlap Portuguese statistical cities—Cities; and outside the perimeter of statistical cities—Non-Cities. Right panel: Segments that overlap 4 statistical cities. Segments with D <1 are not included in the charts.
Up to this point, it has been shown that tourism vibrancy presents fractal behavior in space, with some evidence for nonlinear behavior in time (Figure 2). However, these characteristics were more pronounced when exploring urban areas (Figure 4B).
Tourism Intensification in the “Tourist City”
During the observation periods of this study, the D values showed a substantial upward trend (Figure 3). In Lisbon, tourism activity emerged with a polycentric spatial structure that portrays the three main cores overlapping the historic center, Parque das Nações (North) and Belém (South). Clusters from tourist demand and peer-to-peer accommodation suggest that tourism increasingly conquered the urban space, from the cores to the periphery. Still, the outcomes verify the appropriation and recent tourism intensification in liminal spaces surrounding the tourism cores and scattered throughout peripheral city blocks. Tourist pressure extended beyond tourism districts, for example, to marginalized areas with no prior tourism appeal that, instead, were more prone to the local city users (Figure 3, left panels).
Tourism vibrancy did not appear to be reducing within these three cores. The spatial distribution of peer-to-peer accommodation was more concentrated, becoming more compact in the city center than in the other two cores (Figures 3, right panels). Furthermore, there was a clear expansion to neighboring areas, where the D values point toward an increase in the number of local accommodations and a higher spatial concentration.
Clusters, where the segments showed a similar fractal behavior over space and time, are depicted in Figure 5. The tourist pressure over the city center and the southern axis were noticeably different from the northern axis of Lisbon (Figure 5, left panels). Clusters 1 and 3 presented higher D values and, thus, such areas denoted a greater intensification of tourism. In turn, intensification in Parque das Nações (Cluster 4) resembled more the pattern observed in the “inner” sites (Cluster 2), which tended to be more spatially dispersed (or constrained to particular sites).

Patterns of tourism intensification in Lisbon, based on tourists’ digital footprints from social media—Flickr data (left panels) and accommodation supply data from Airbnb (right panels). Clustering using D values jointly with spatial references of the corresponding segments. Violin plots show D distributions at t0 and t1.
Significantly, the fractal behavior of the peer-to-peer accommodation supply appeared to be more dynamic, even in adjacent areas. Despite the spatial contiguity of those segments overlapping the central core, the variation in the corresponding D values suggests different intensification processes. The results indicate that tourism in the areas located on the east side of the central core had intensified with a greater degree of space-filling than those on the west side. This denotes that tourism accommodation on the east side of the central core was developed with a higher level of compactness (Figure 5 (right panels) and Figure 6). Furthermore, Cluster 1 indicates recent expansion to the northeast “inner” areas, in which intensification was still pronounced, and the local accommodations tended to be more homogeneously distributed across segments. D values in segments located outside of the central core indicate a higher degree of space-filling in areas situated on the southern axis of the city. The development of tourism accommodation in the southern axis (Cluster 4) appeared to be less fragmented than that in Cluster 2 that overlapped the northern axis of Lisbon city (Figure 5 (right panels) and Figure 6).

Patterns of tourism intensification in Lisbon. D and (log) length of network of corresponding segments from clustering analysis (Figure 5, right panels). Accommodation supply data from Airbnb in 2015 (circles) and 2017 (triangles).
Tourism Intensification in Lisbon (LMA) and Oporto (OMA) Metropolitan Areas
In a broader context, the resulting clusters (Figure 7) pinpoint an intensified spatial agglomeration of local accommodation in tourism hubs (e.g., Lisbon, Cascais, Oporto) that stand apart from their surrounding tourist destinations. As expected, the intensification becomes less pronounced (e.g., segments presenting a lower degree of occupied area together with lower D values) as we move away from these hubs.
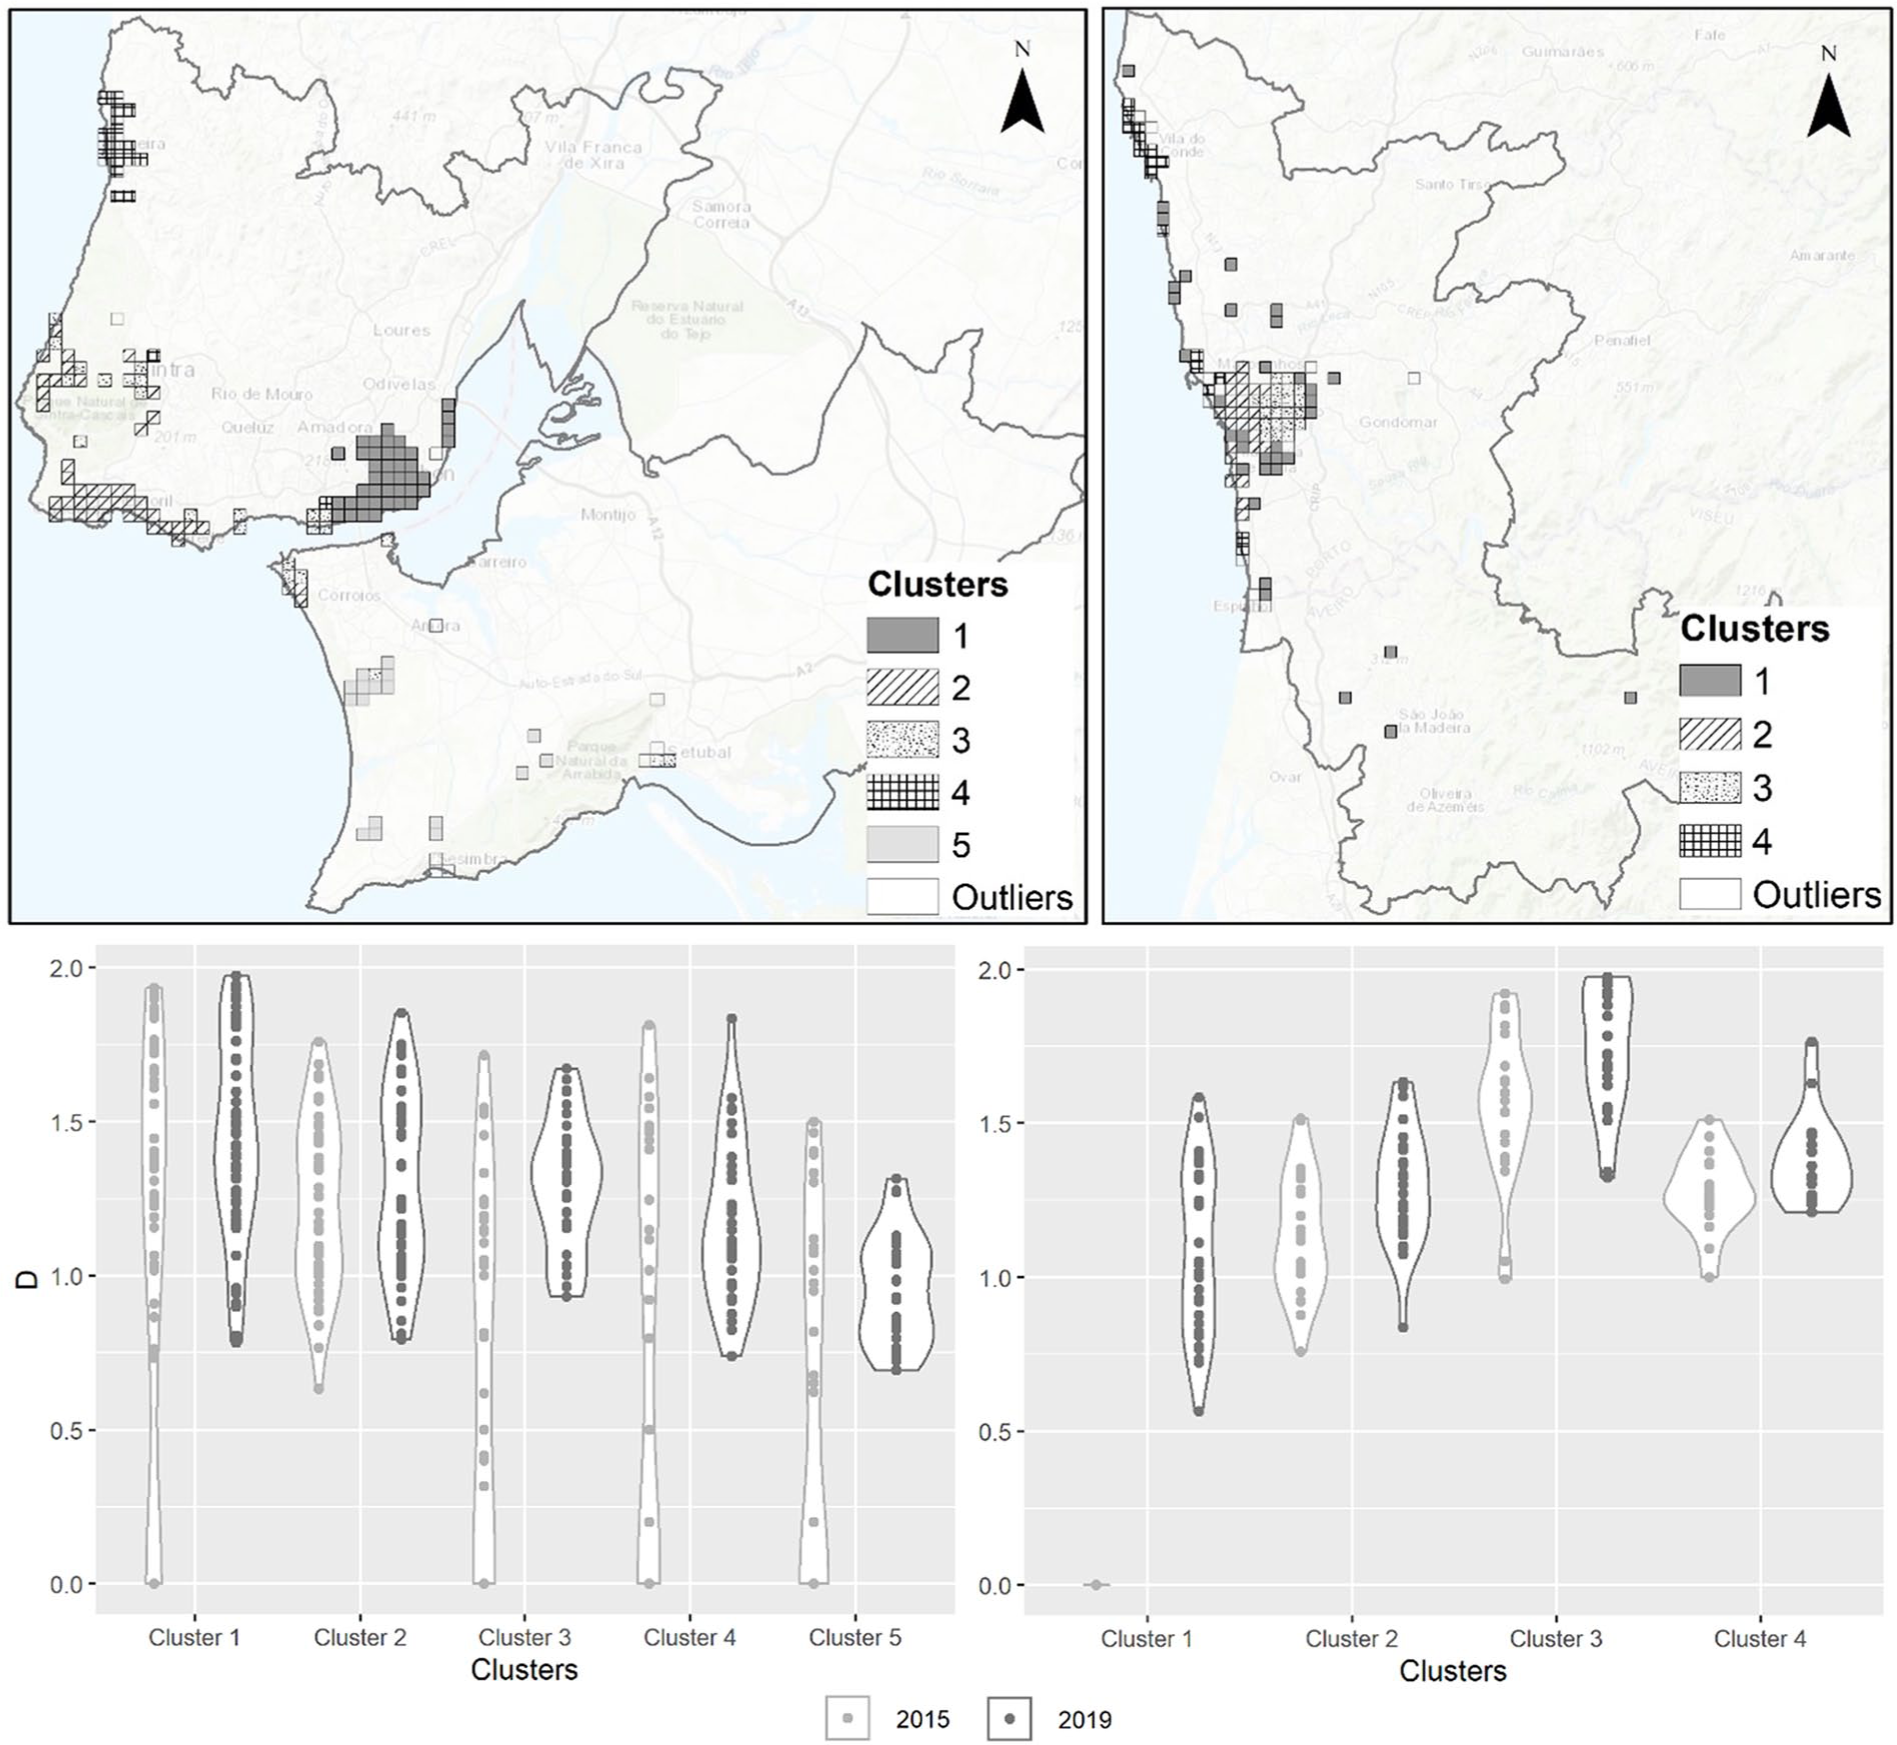
Patterns of tourism intensification in the metropolitan areas of Lisbon (left panels) and Oporto (right panels). Clustering using D values jointly with spatial references of the corresponding segments. Violin plots show D distributions at t0 and t1. Gray lines refer to the administrative limits of the corresponding metropolitan areas.
At the metropolitan level, the intensification of the accommodation supply exhibits a large-scale spreading. Areas with low D values (Figure 7) denote the fragmented, but still intense, expansion of tourism activities to newer areas, in particular, in the north bank of LMA and in the “inner” areas of OMA. Furthermore, there were a significant number of segments where the accommodation supply seemed to develop with more dispersion, such as in the south bank of LMA and the north part of OMA.
The segments overlapping the city of Oporto (Figure 7, right panels) indicate different intensification processes in the east (Cluster 3) and west (Cluster 2) parts of the city. Cluster 3 presents segments where intensification was more prone to compactness, in contrast to other clusters. Cluster 1 represents latent areas with significant D values in 2019 (Figure 7, right panels), indicating the emerging development of tourism and related services in the peripheries of OMA over more recent years.
The metropolitan areas showed different intensification processes, in terms of their spatial arrangement. Both regions achieved larger frequencies of higher D values, suggesting the existence of areas where peer-to-peer accommodation services have been established with a higher level of compactness. However, the former (overlapping the LMA) displayed a process of spatial spread in different areas over the northern and southern banks of the LMA. On the contrary, it seems that the intensification of the local accommodation supply in OMA was more homogeneously distributed and spatially constrained to the urban perimeter of the central agglomeration. Overall, the increasing consolidation of the accommodation services of metropolitan areas was verified.
Discussion
A wide range of analytical methods have been proposed to analyze both morphological and functional aspects of cities (Encarnação et al. 2012; Long et al. 2018; Batty 2012). In tandem with these methods, we have suggested an alternative approach to analyze the evolution of tourism phenomenon in complex urban destinations.
It is worth emphasizing that the proposed spatial layout is intended to represent tourism geographies differently. Rather than focusing on the spatial extent of tourism vibrancy within a destination, the resulting geographic features represent a city’s comprehensive layout, in which a higher concentration of edges demonstrates advances in the tourism-related city functional dimension. To an extent, it portrays a geographic construct of attributes (from the tourism demand and supply-side), feature behavior and interactions, along with processes and functions that are directly associated with the city tourism system. At the same time, it leads to a quantitative interpretation of tourism vibrancy without being constrained to any spatial scale. Our analysis provides insights towards an alternative conceptualization of tourism spatial processes, as opposed to the scale-driven rationale embedded in delineated tourism areas (Dredge 1999; A. Lew and McKercher 2006; Hernández-Martín et al. 2016).
This new way of abstracting the “tourist city” is also supported by the fact that cities have been producing reliable data (Kitchin 2013) about “city users” (e.g., tourist and locals) and their contexts (Longley, Adnan, and Lansley 2015). The idea of using individual-based data (from tourism demand and accommodation supply) as signatures to study tourism dynamics relates to the bottom–up processes that characterize urban transformation and development (Batty 2012; Shelton and Poorthuis 2019; Chen et al. 2019), as well as tourism planning and place-making (A. A. Lew 2017). Tourism places are perceived by a collective sense arising from the street-level experience to a wider understanding at the neighborhood, district, or city level (Jenkins et al. 2016; Shelton, Poorthuis, and Zook 2015). Accordingly, we can examine the spatio-functional structure of tourism in cities from its basic units, and it is their spatial interaction that alludes to an emergent structure. Although the data tend to represent the supply–demand system, we are aware that this study guides a partial overview of tourism vibrancy and intensification—in this regard, incorporating individual data from related sources such as Twitter and Foursquare, as well as data denoting other tourism features (e.g., restaurants on TripAdvisor), would be beneficial (Salas-Olmedo et al. 2018; Gutiérrez et al. 2017; Martí, García-Mayor, and Serrano-Estrada 2020).
The spatial patterns of city tourism production and consumption display a fractal structure and, thus, can be described using the fractal dimension (D). Accordingly, changes in D over time can provide empirical evidence of tourism dynamicity in space and time. We associate the fractal dimension with different spatial patterns of tourism intensification. Nonetheless, D can also be associated with successive stages of tourism development.
Therefore, tourism intensification can be examined through the estimation of D and the change of its value over time. However, we are aware that the spatial arrangement observed in each segment may differ while exhibiting similar fractal dimensions. It is noteworthy that the occupied space (denoted by the length of the network) of tourism activities in a given area and its fractal dimension show an exponential positive relationship. In terms of tourism intensification, it seems that tourism-related urban spaces tend to change over time, with more fractal behavior (an increase in the value of D) accompanying a relative increase in the degree of space-filling (the occupied area). The observed patterns are associated with the structure of the spatial organization of tourism. The importance of this alternative approach is that it provides a concrete method of measuring tourism intensification over time.
The measurement of D is intended to advance the geographic interpretation of tourism vibrancy and intensification, by denoting the spatial alignment of tourism features over space. Specifically, D is more effective than traditional measures (i.e., area, density, etc.) in assessing the structure of tourism-related urban spaces. Higher D values denote that tourism areas are relatively denser and reflect a process towards compactness (Figure 8). At the same time, a higher D reflects an increased occupied space by tourism activities (e.g., peer-to-peer accommodation) which can be indicative of areas facing impacts produced by tourism intensification.
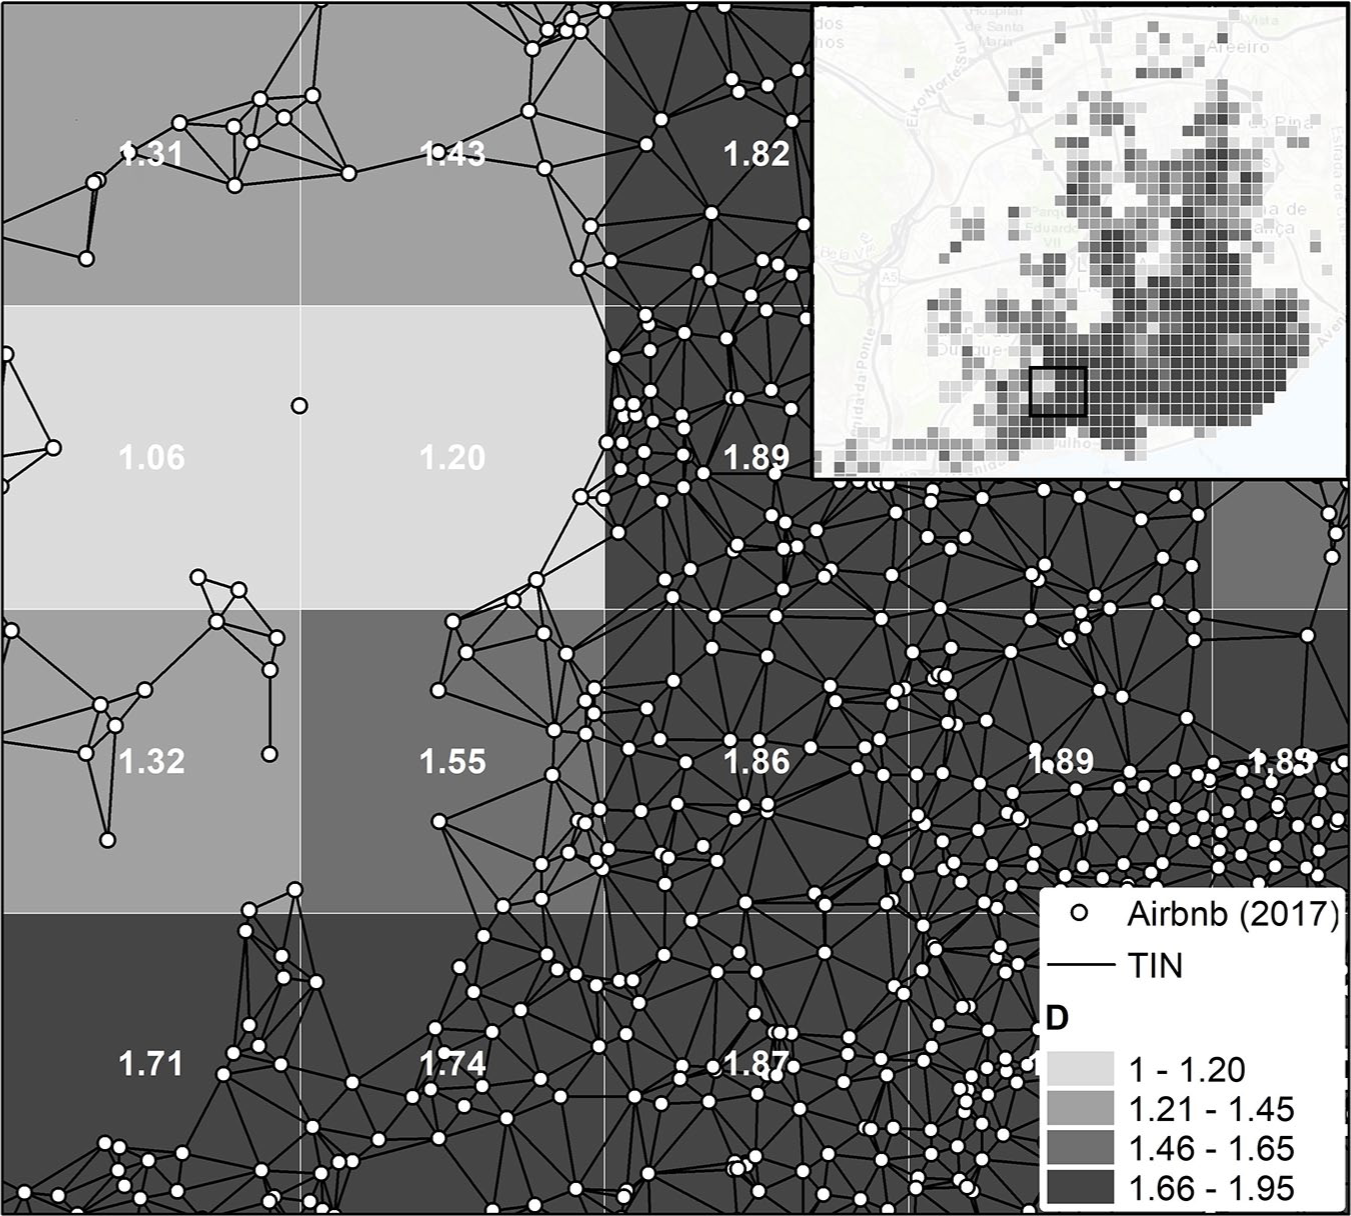
Local fractal dimension of segments overlapping tourism areas in Lisbon. Point features represent the geo-location of local accommodation supply from Airbnb in 2017. Line features refer to the edges of the TIN that represent the spatial layout, and the grid refers to the segmentation of the spatial layout into smaller subareas.
This approach allows for a more accurate comparison of tourism performance between distinct areas since the comparison is not built merely in terms of magnitude, but also considering the spatial arrangement of target features. The results of this study indicate that the spatial structure of tourism is characterized by a more disperse tourism vibrancy emerging in the periphery, while the cores become more compact. Different intensification patterns were verified even in adjacent areas, which refer to the dynamicity of tourism over space (Figure 8).
Furthermore, empirical findings can provide useful information toward understanding the inherent spatial processes that determine the geographies of tourism, while leading to a comprehensive picture of tourism within a destination. It has also gradually gained relevance and consensus among researchers that the implications associated with the tourism intensification are manifested not only in consolidated urban destinations but also in other types of tourist destinations: smaller cities, coastal areas, island contexts, or even in some rural areas. This approach has also proved useful for exploring tourism intensification in destinations at different hierarchical levels, such as the case of metropolitan areas.
Conclusion
The functional aspect of tourism has been suggested to play a key role in the overall performance of the city system. Nonetheless, the sensitivity of the tourism spatial structure to the spatial scale of analysis introduces some challenges when analyzing an increasingly intertwined use of space, for instance, in urban destinations. Traditionally, the use of the conceptual meaning of density supporting a direct relationship between tourism vibrancy (i.e., tourist pressure and tourism activities) and the occupied space is not as relevant when a linear relationship is assumed; in particular, when the city tourism spatial layout is considered in terms of patterns of continuity and fragmentation.
This article seeks to contribute to the existing research in the following ways. First, this work contributes to the development of metrics to understand the spatial distribution of tourism vibrancy. The tourism intensification over space is investigated using an objective measurement approach that can characterize the (spatial) agglomeration of tourism activities. In this article, we generalized the spatial agglomeration of city tourism via fractal dimension. Significant statistical associations can be found between the fractal dimension and tourism intensification across the urban space. Different intensification processes, in terms of magnitude and spatial structure (more prone to dispersion or compactness), were verified, even in adjacent areas. Despite the fragmented morphology of the urban fabric, intensification in tourism cores is more homogeneously distributed, yet evolves into a more compact form of spatial organization. On the other hand, there is a decline in the degree of homogeneity of intensification from tourism cores to the periphery. Intensification surrounding tourism cores becomes more fragmented and the expansion is sometimes spatially discontinuous and dispersed. Second, this research contributes to framing the analysis of tourism intensification from a quantitative perspective. Outcomes constitute empirical evidence of changes in tourism vibrancy and their (often) geographical biases. Significantly, this further allows for the identification and comparison of distinct areas that portray different spatial patterns of tourism intensification. Our approach can assist practitioners to identify which urban areas are experiencing a relative increase (or decrease) in tourism vibrancy and which spatial pattern is associated with it. In this line, this approach may help future research in exploring the evolution of tourism space consumption and its relationship with urban development, regeneration, and tourism-driven gentrification. Finally, this research emphasizes the relational nature of tourism places within a destination, as well as the “fluid” geographies of tourism across the urban space. Our findings indicate that tourist activity and tourism-related services (e.g., peer-to-peer accommodation) spread beyond the alleged tourism districts while continuously reshaping the city tourism geographies. This raises further questions about the “static” geographic representation of tourism-delineated areas, which often dominates research analysis and planning. Outcomes also support earlier empirical research about “new” dynamics in the urban tourist experience.
Measurement of tourism vibrancy drawing on the ideas from fractal geometry and scaling may lead to the conception of models for the statistical simulation of tourism development in different destinations, at the city or regional level. Fractal analysis is suitable for understanding urban tourism and the growth of tourism activities over time. It would be interesting to apply fractal analysis to other destinations, in order to verify whether other spatial forms of tourism intensification exist. Observed patterns on tourism intensification over space can be studied together with changes in the morphology, and function, of urban areas to provide more insights about the city system and its association with tourism development. The observed properties from the tourism spatial organization may contribute to modeling intradestination tourism intensification and to obtain predictions on the behavior of the city’s tourism system. In addition, this alternative approach can be used to explore and compare the spatial consequences of tourism development in cities, as well as to benchmark their tourism performance.
Footnotes
Appendix A
Appendix B
Acknowledgements
The GEOMODLAB (Laboratory for Remote Sensing, Geographical Analysis and Modelling) of the Centre of Geographical Studies/Institute of Geography and Spatial Planning provided the computational infrastructure support for this research.
Declaration of Conflicting Interests
The author(s) declared no potential conflicts of interest with respect to the research, authorship, and/or publication of this article.
Funding
The author(s) disclosed receipt of the following financial support for the research, authorship, and/or publication of this article: This work was supported by the Institute of Geography and Spatial Planning (IGOT) and Universidade de Lisboa (BD2016), and the Fundação para a Ciência e a Tecnologia (SFRH/BD/147552/2019).