
Abstract
The article investigates the economic contribution of tourism to the GDP. We review background methodologies, systematically collect data for EU countries, and develop a sound and ready-to-use procedure for computing indirect and total economic impacts. The routine is then applied to selected destinations for which a minimum standard in the quality of data from Tourism Satellite Accounts and Input–Output tables is met. Methodologically, the article provides a tool for estimating the total contribution of tourism to output, gross value added, and employment. Empirically, the comparison of results across EU economies shows a high degree of heterogeneity in the tourism share to GDP, which is critically discussed. Our procedure delivers a key tool to researchers, industry leaders, and policy makers willing to investigate income and employment consequences of scenarios differing in the evolution of tourism demand, something of high relevance in the COVID-19 era.
Introduction
The importance of estimating the economic impact of tourism and its contribution to gross domestic product (GDP) and gross value added (GVA) is paramount, so much that policy briefs, industry reports, and scientific articles often start by providing figures about the share of GDP stemming from tourism. Nevertheless, most of the available evidence comes from noncoordinated studies on individual countries, using data that rarely satisfy the international standards set by UNWTO (United Nations World Tourism Organization) in tourism satellite accounts (TSAs). Comparable and coordinated figures on the share of tourism in GDP are regularly published by the WTTC (World Travel & Tourism Council), but the opacity surrounding the methodology and the data used (e.g., WTTC estimates the economic contribution of tourism also for countries not publishing TSAs) make their work of political appeal but of dubious scientific interpretation.
Over the last 20 years, the TSA has become the standard for measuring tourism consumption and for computing the share of tourism to domestic output and GVA. However, it is well known that TSAs only assess the direct economic impact. When moving to indirect and induced impacts, the lack of a sound methodological framework leads to a blurred area where different approaches coexist and where international comparisons are difficult. This study aims to help fill this gap and advance the exploitation of official sources of data (i.e., data computed by National Statistics Offices [NSOs]) by providing a methodological routine able to semiautomatically compute the indirect and the total (direct and indirect) share of tourism to domestic output, value added, and employment, when TSAs, Input–Output (I-O) tables, and employment (or wage) data are published according to international standards. The article focuses on the countries belonging to the European Union (EU), as this is one of the richest areas of the world (its overall GDP, including the UK, was $18,455 billion in 2019, 21% of global GDP) and the most developed tourism region (counting for 520 million of international arrivals, 36% of global flows in 2019). Noticeably, its countries produce firsthand high-quality data gathered by NSOs that are supervised by Eurostat, the EU Statistics Office.
Within this framework, the article has three main goals: (1) to scan TSAs and I-O tables for all EU countries (including the United Kingdom, which was still part of the EU at the time of this research) to review findings and highlight gaps in data availability, reliability, and comparability; (2) to develop a sound algorithm to semiautomatically compute indirect and total impacts of tourism and apply it to a pilot set of countries for which data allow it; and (3) to compare and discuss figures on the economic impact of tourism in the EU, thus providing a statistical tool able to inform stakeholders, practitioners, and policy makers and guide policy analysis in tourism.
The current work contributes to the literature in many respects. Methodologically, the article addresses the lack of a systematic framework in computing the total contribution of tourism to output, GVA, and employment. Empirically, the comparison of results allows us to critically discuss the high degree of heterogeneity in the tourism share of GVA across EU economies. Practically, the present procedure provides a key tool to researchers, industry leaders, and policy makers willing to investigate income and employment consequences of scenarios characterized by different trends in tourism demand, something that can be simulated using our tool and that can be of high relevance in the COVID-19 pandemic age.
The impact of any economic activity can be broken down into direct, indirect, and induced effects. In this article, only direct and indirect effects are considered, hence excluding the measurement of induced effects. We understand that the setting of an algorithm able to add induced effects to the computation of the total impact would be a top priority for research, and a straightforward extension of this work. However, such a task requires more detailed data on consumption patterns, something that is not available at the present stage, thereby leaving it to future research.
The rest of the article is organized as follows: the second section reviews the methodologies used in measuring tourism impacts and classifies the case studies of TSA estimation recently published. The third section discusses data-related issues that are relevant for the computation of indirect and total impacts of tourism. The combined findings of the second and third sections are key to identifying the most appropriate methodology to develop and the most suitable countries to study, given the quantity and the quality of available data: this is the scope of the fourth section, where the economic impact of tourism for the set of countries under investigation is estimated and presented. The fifth section carries out a general discussion, highlighting policy and industry implications and suggesting future extensions of this research. The intelligibility of the article is linked to the data files and to the technical description of the routine that has been developed in-house, which are available in the Supplemental Material available online.
Estimating the Economic Impacts of Tourism
Any act of consumption, including the ones stemming from tourism, produces economic effects on total production, value added, employment, taxes, imports, etc. Focusing on the generation of income, the most important macroeconomic indicator of economic activity, we can distinguish three impacts: (1) the direct impact, given by the value added generated when producing the final output; (2) the indirect impact, which considers the value added generated in the activities upstream, serving the final output; (3) the induced impact, measuring the value added generated downstream, by production-generated wages and profits spent on domestic production. When tourism expenditure computed in TSAs is merged with I-O tables, standard I-O multipliers can be computed. Generally speaking, the ratio between the total impact and the direct effect is the multiplier: type I multipliers consider—at the numerator—the sum of direct and indirect effects, while the type II multipliers include induced effects as well.
The computation of the economic impact of tourism is complicated because, from an economic perspective, tourism is a demand-driven activity and not an industry (Candela and Figini 2012, p. 46). Hence, it does not appear in the System of National Accounts (SNAs). The fact that tourism is not readily available in official statistics is explicitly recalled, among others, by Eurostat (2019a). Specific information from the demand side (tourism surveys) and from other industrial and statistical sources must hence be collected and elaborated, something that is done in the TSAs (for more details, see Eurostat 2016; United Nations 2010; UNWTO 2010). Tourism activities included in the TSA are reported in Table 1, which compares the classifications of Eurostat (left-hand column) and UNWTO (right-hand column). The merging of expenditure-based information with data from the SNA allows the computation of the share of domestic output stemming from tourism, as a whole and for each of the products of Table 1. The TSA also allows subtracting the value of intermediate consumption to calculate the value added generated by tourism and its share to GVA (which roughly proxies the GDP).
– List of Products Reported in the TSA.
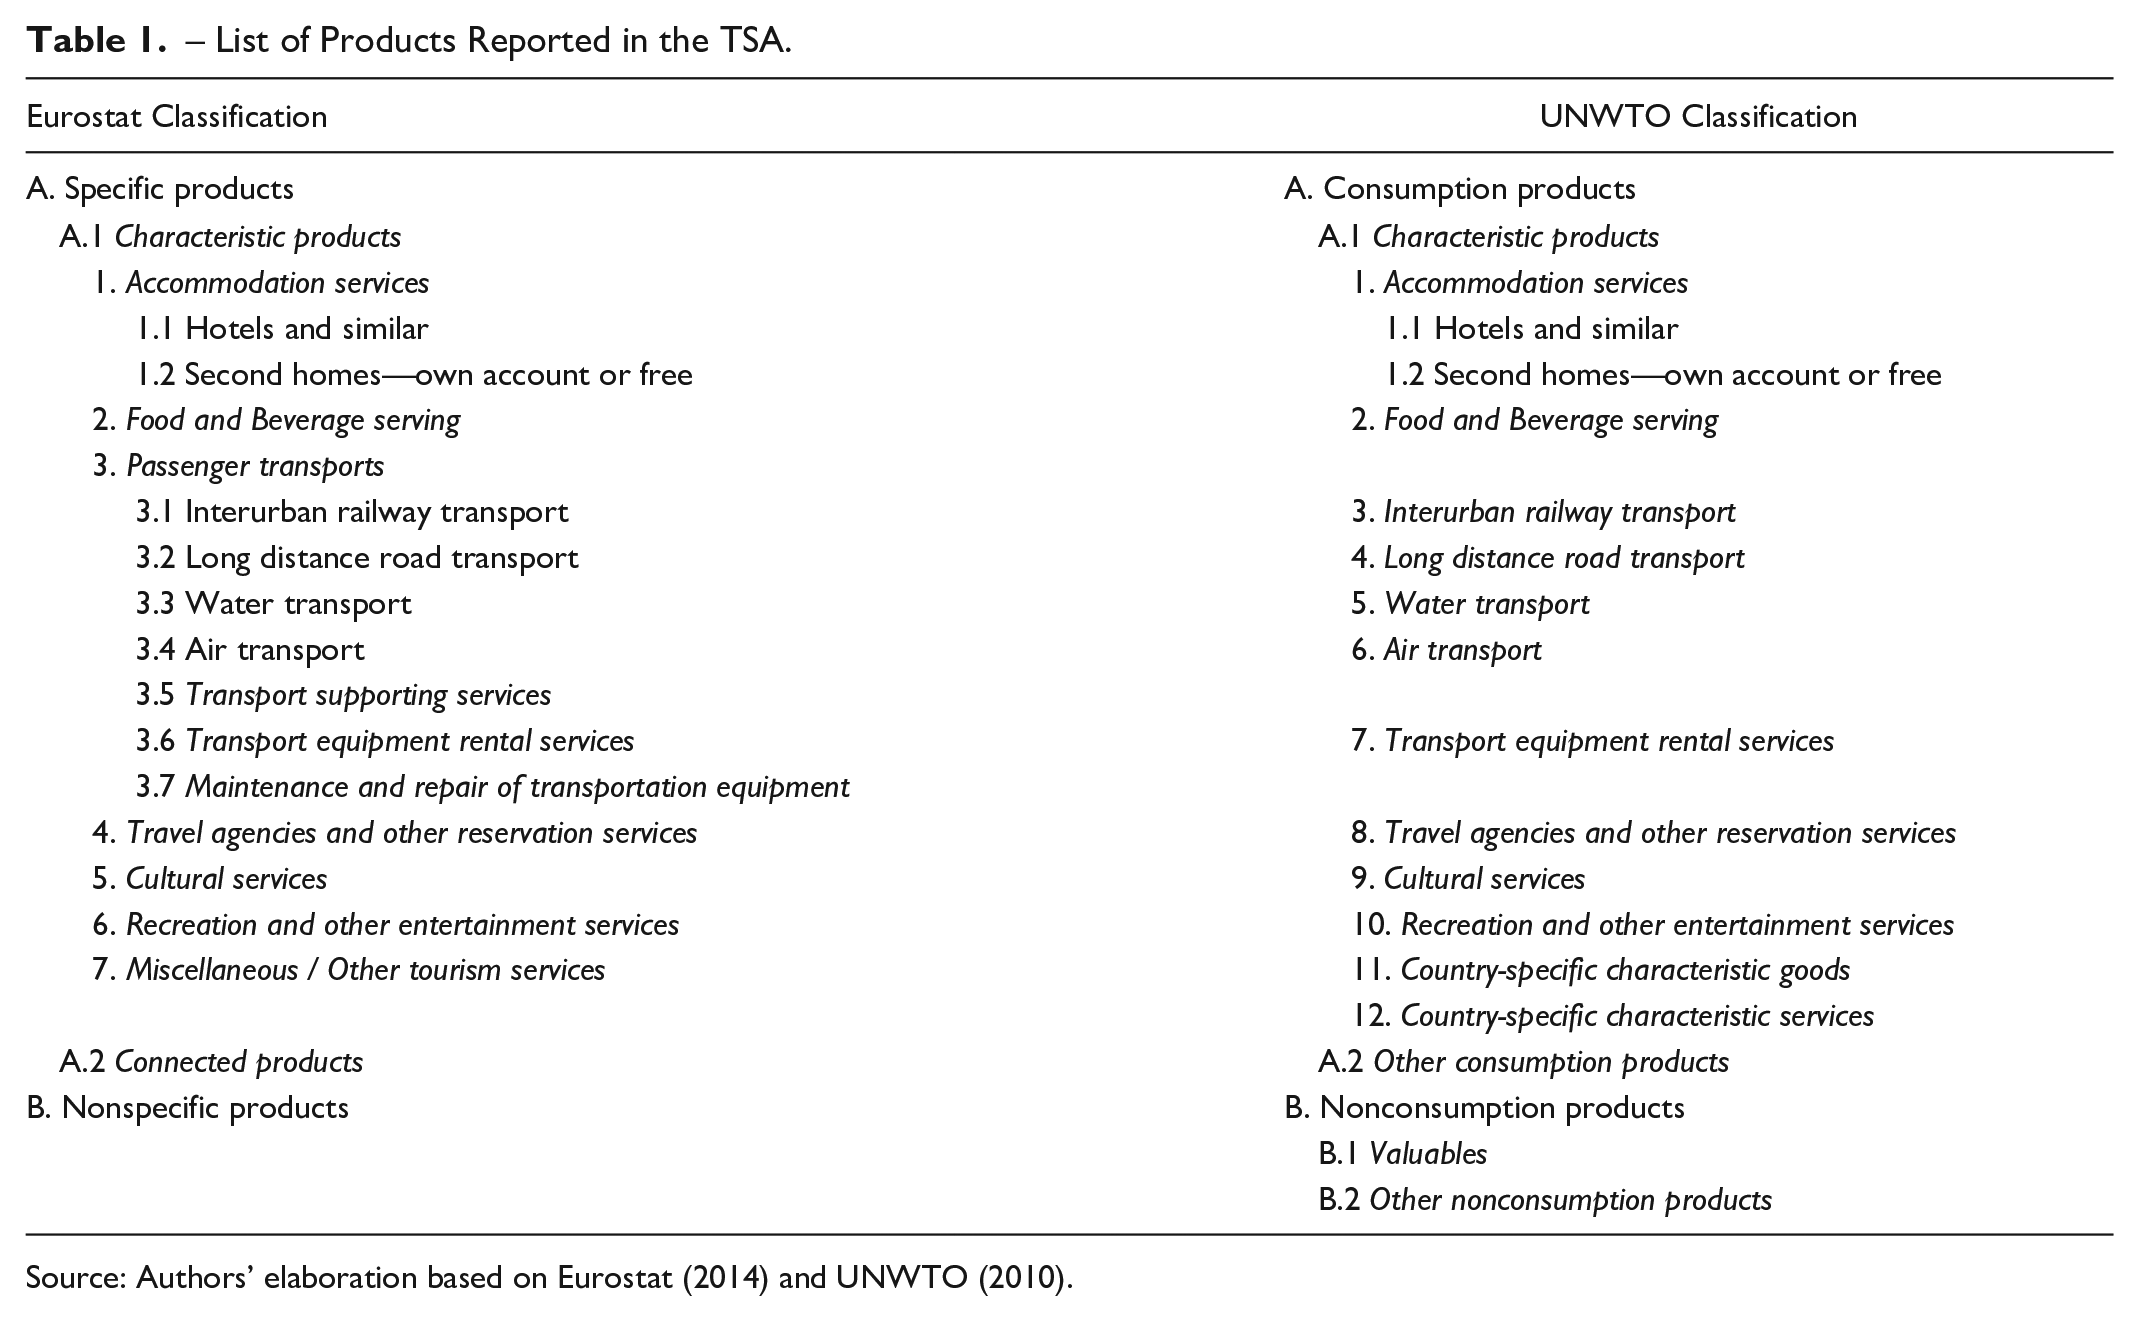
Source: Authors’ elaboration based on Eurostat (2014) and UNWTO (2010).
Values computed in the TSAs only refer to the direct economic contribution of tourism. The assessment of indirect, induced, and total impacts needs further calculations, which involve the use of I-O models or computable general equilibrium (CGE) models. An extensive scientific and policy-related literature has been tackling (particularly in the 1990s and in the 2000s, starting with the seminal works of Briassoulis 1991 and Fletcher 1989) the methodological discussion on the pros and cons of I-O models compared with CGE (among many, see Dwyer, Forsyth, and Spurr 2004, 2007; Frechtling 2010, 2011; Klijs et al. 2012).
Both approaches (I-O and CGE) include restrictive assumptions on the functioning of the economy. The most important limitation of the I-O model is that technical coefficients and consumption proportions are fixed. Moreover, an exogenous shock (e.g., on incoming tourism) does not have effects on prices, production or employment diversion are excluded, and only production and employment creation/destruction can be assessed. An extension of the I-O model is the social accounting matrix (SAM), which provides a more precise estimation of indirect impacts by considering the distributional consequences. However, SAM data are not widely available.
On the contrary, CGE relaxes the assumption of non-scarcity of resources, hence including price changes and crowding-out effects in the analysis. However, other strong assumptions are considered in CGE models: the assumption of market-clearing prices (which implies competitive economies and full employment of all resources); the reliability of proper elasticity estimates to be inserted into the Cobb-Douglas production and utility functions; and the hypothesis of fixed international prices. All these assumptions lead astray from reality and produce results that can be highly questionable.
Practically, it is generally accepted that I-O models can be used to assess the short-run effect of exogenous shocks when technology and prices are given, while CGE models are more precise in determining the full dynamics of shocks in the long run, when price adjustments, changes in technology, and crowding-out effects are taken into consideration. For this reason, it is usually found that CGE multipliers are lower than I-O multipliers when a comparison is made. On a different matter, both methods are time- and resource-consuming as they require a considerable effort of data collection and organization. Eurostat and the NSOs mainly invest in I-O tables, while CGE models (which require specific assumptions about economic agents’ behavior) are usually developed by government departments or private research institutes.
Recent literature evaluates the properties and limitations of TSAs (Dupeyras 2009; Libreros, Massieu, and Meis 2006; Smeral 2006) and aims at extending the existing methodology in ways that allow the tackling of its major limitations. Among others, proposed approaches focus on decreasing the time necessary for TSA building through the use of web-based data (Wu et al. 2018); nonlinear I-O models to overtake the hypothesis of linearity (Klijs, Peerlings, and Heijman 2015; West and Gamage 2001); dynamic CGE models to investigate the economy’s path to the new equilibrium (Blake 2009); I-O models (Kim, Kratena, and Hewings 2015) or CGE models (Li et al. 2017) integrated with econometric techniques; intercountry I-O tables (Timmer et al. 2015); interregional I-O models (Haddad, Porrse, and Rabahy 2013).
An extensive literature applies TSA methodology to country-specific cases. In this stream, articles can roughly be divided into three groups.
The first is a group of articles where TSA data are mixed with either an I-O or CGE model (in a few cases, with SAM) to produce estimates of the total economic impact of tourism and of the tourism multipliers. The contribution of these articles is twofold. First, they provide valuable information on the importance of tourism within each country; second, they deliver policy indications on the overall impact of tourism shocks under alternative scenarios. Among the many, a few interesting articles deal with European countries: Germany (Ahlert 2008), the United Kingdom (Cooper and Wilson 2002; Blake 2009), the Netherlands (Heerschap et al. 2005), and Austria (Smeral 2006).
The second group of articles deals with regional TSAs; see, among many, Benyon, Jones, and Munday (2009); Dwyer, Forsyth, and Spurr (2003); Frent and Frechtling (2020); Jones, Munday, and Roberts (2003); Polo and Valle (2008); Zhang, Madsen, and Jensen-Butler (2007). These articles extend the rationale of TSAs to specific administrative regions within countries, a relevant topic for regional economists and statisticians working in NSOs. These studies share the same pros and cons of the first group of articles, with the additional issue of building reliable regional I-O tables and TSAs through both the breaking-down of existing national data and the bottom-up collection of data through ad hoc surveys of local tourism demand.
The third group includes a few case studies where TSAs have been used to estimate the economic impact of specific events, either at the macro level (the Olympic Games in China, Li, Blake, and Cooper 2011; the lifting of economic sanctions in Iran, Pratt, and Alizadeh 2018) or at the micro level (the impact of the Guggenheim museum in Bilbao’s economy: Plaza, Galvez-Galvez, and Gonzales-Flores 2011; the importance of yachting tourism in Greece: Diakomihalis and Lagos 2008). These articles highlight the richness of information included in TSAs and the variety of specific applications that can be developed, all with relevant local policy implications.
This article mainly contributes to the first strand of literature, merging I-O tables and TSA data to develop and offer a semiautomatic routine for computing indirect and total impacts of tourism activities when disaggregated data are available in a specific format. However, we also contribute to the third strand, by showing how the proposed routine can be applied to estimate the consequences of exogenous shocks, such as the one due to the COVID-19 pandemic.
Data and Methodology
I-O tables, describing the economic relationships (sales and purchases) between different economic sectors and between producers and consumers of a country, are used for computing the technical coefficients employed in the I-O model and for estimating the impact of economic activities. I-O tables are computed at least every five years and published by NSOs within the EU statistical framework. Their use for studies on European countries is guaranteed, as they are available on the Eurostat website in data format, although with a lag (of 3–4 years). CGE models are also very complex and expensive to build. As their utility is mainly in forecasting economic impacts of alternative future scenarios, CGE models are usually developed in private research centers and/or government departments, implying that their mathematical form, equations, and estimated parameters often remain private information. The lack of publicly available CGE data for EU countries hence drives us to the use of I-O for estimating tourism economic impacts.
Among the 28 EU member countries (at the time of the study, the UK was still in the EU), the availability and the quality of tourism data are very diverse and often problematic. First, as the compilation of TSAs is a voluntary activity and is not yet included in the legal framework of Eurostat, there is no obligation for the NSOs to produce TSA tables or reports. Consequently, for most EU countries TSA data are only available irregularly and with a relevant lag of publication (of at least 3 years). Second, there are no common indications on how data should be published: only a few countries publish (some of) the 10 TSA tables in data format, while most countries only publish the main figures in summary reports or ad hoc tables (Eurostat 2016, 2019b). On top of that, Eurostat does not include TSAs in its online data warehouse. Third, intra-EU comparability is strongly jeopardized by the lack of strict guidelines on how to compile TSAs. Although methodological guidance for the compilation of TSAs is included in the “Implementation Manual on TSA” (Eurostat 2014; see also United Nations 2010 and 2018), different countries resort to alternative approaches to treat, among other things, domestic business tourism, second homes, and consumption of noncharacteristic tourism products.
According to the public availability of TSA data, EU countries can be classified as follows:
Group 1: Countries publishing TSA tables online, in data format, for one or more years: Austria, Bulgaria, Czech Republic, Estonia, Finland, Italy, Portugal, Romania, Slovenia, Spain, and United Kingdom. However, in some of these countries (e.g., Austria, Bulgaria, Spain) data are not available in the typical TSA format specified by UNWTO, making the integration with I-O tables difficult.
Group 2: Countries producing TSAs but publishing results only in summary tables, reports, or press releases: Belgium (for the Flemish region only), Croatia, Denmark, France, Germany, Hungary, Latvia, Lithuania, Malta, Netherlands, Poland (some data are available in a working paper), Slovakia, and Sweden.
Group 3: Countries not producing TSAs, to our knowledge (if data are produced, they are not publicly available): Cyprus, Greece (a pilot study has been published in 2019), Ireland, and Luxembourg.
At the EU level, European TSAs do not exist, and the results of individual countries are periodically collected and compared in a summary report (Eurostat 2016, 2019b). This classification of countries in three groups is evolving, as statistical offices continuously change how data are collected and published. Moreover, the main purpose of this review is to check which TSA data are available to be used by independent and external researchers, without the need of asking for ad hoc data and/or permission from NSO officers. In this respect, TSA data for countries in group 1 above can be used (with limits and caveats mentioned above), while TSA data for countries in groups 2 and 3 are not fit for further statistical analysis.
Among countries of group 1, the Czech Republic, Italy, and Portugal have been selected for this pilot study for two reasons (time and resource limits did not allow to estimate tourism impacts for more countries). First, these three countries present a quasi-optimal structure of TSA data to be integrated with I-O tables. They publish TSA tables in data format (Excel and/or CSV) according to the recommended UNWTO classification and with detailed TSA tables 5 and 6, which are fundamental to compute the indirect effects. Second, the choice of these countries also allows us to showcase the different importance that tourism can have in the economy. We investigate a large country, which is also an important tourism destination (Italy, ranked fifth worldwide for inbound arrivals, UNWTO 2019); a small but tourism-intensive country (Portugal, ranked among the top 20 countries in the world in terms of the ratio between inbound arrivals and local population); and an emerging destination (the Czech Republic, where inbound arrivals increased by 58% between 2010 and 2017, a much higher rate than Europe and Central/Eastern Europe where, over the same period, arrivals respectively increased by 38% and 37%; UNWTO 2019). The Czech Republic is mainly characterized by cultural tourism in its capital city, Prague, that counts for 36.6% of the total arrivals of the country (Czech Republic Statistics Office 2021).
Operationally, to compute the economy-wide implications of tourism flows, it is necessary to merge (1) data from TSA tables 4 and 6, presenting tourism expenditure in each product category and for each type of visitors (day-trippers, tourists, inbound and domestic visitors); (2) data from TSA table 10, providing the number of arrivals and overnight stays for each category of visitors; and (3) data from detailed I-O tables. Moreover, to estimate the employment effects, data on sectoral employment and wages are also needed. While TSA tables come from NSO websites, I-O tables and employment data are available from the Eurostat data warehouse.
Research for this article is aimed at developing a routine for semiautomatically computing the indirect and total impact of tourism when a minimal set of TSA data is available in a specific template. The routine is implemented using Microsoft Excel and will allow future researchers to analyze other countries as soon as data will be available and organized according to the template. We redirect to the online supplementary files for the technical description of the routine (Supplemental Material S1) and the Excel files of the pilot countries used for this work (Czech Republic, Italy, and Portugal; Supplemental Material S2).
The routine considers two hypotheses and simplifications to compute indirect and total effects:
The additional income generated by tourism is not spent within the economy on further consumption or investment. In other words, we consider direct and indirect impacts only, not including induced effects, which would further boost the estimation of the total contribution of tourism.
An important share of tourism expenditure reported in the TSAs refers to the group “A2. Other Consumption Products” and cannot be attributed to core tourism products (this aggregate includes general shopping, gasoline, etc., and counts for 20%–30% of tourism consumption, depending on the country). Hence, this expenditure cannot be reconducted to any industry or product of the I-O tables for the computation of impacts. To avoid a consequent underestimation of indirect and total impacts, in the proposed routine we assume that the multiplicative effect of characteristic tourism products expands to noncharacteristic and other products in the same proportion.
Results
The analysis of the literature (carried out in the second section) and considerations regarding the quality and quantity of available data for EU member countries (third section) lead us to select the combined use of I-O and TSA as the methodology for estimating the indirect and the total economic impact generated by tourism. This is done in the next subsection below, presenting the results of the original procedure developed for this work and applied to the Czech Republic, Italy, and Portugal. Before that, the following subsection provides a review of the direct contribution of tourism to output, GDP, and employment in EU member countries, mainly aggregating and commenting data available in national reports and online data sets, in an effort of systematization and update of Eurostat (2016, 2019b).
The Direct Contribution of Tourism to Output, GVA, and Employment in the EU and Its Member Countries
This subsection collects, checks, and organizes available data, a review that highlights two important caveats: first, as recalled in the previous section, there are yet no unique guidelines for computing and presenting the direct economic impact of tourism. Hence, cross-country comparisons might be biased by different approaches used by NSOs in addressing specific issues. Second, some of the aggregates (e.g., domestic output, domestic supply, GDP, GVA) presented within TSAs often have discrepancies with SNA data, either because of different approaches used in different departments of the same NSO or because of mere errors in the computation of the values. It will be outlined in due course when figures are considered “suspicious.”
Table 2 summarizes TSA core results: the estimation of the direct contribution of tourism, measured in absolute values and as the ratio between tourism value added (TVA) and GVA (this ratio is usually reported in the last column of TSAs; Table 6). Figures for 2015 or nearby years are reported: while in some countries more recent data are available (up to 2018), the choice of 2015 allows the greatest degree of comparability and aggregation across EU countries. The share of tourism ranges from 2.1% of Romania to a staggering 10.9% of Croatia. The ratio for France is very high (7.3%) but is likely to be biased by errors of computation or reporting, as the original document (DGE 2016) states that TVA is equal to tourism consumption, which is technically impossible. A similar problem applies to Hungary. Figures of GVA reported in Table 2 are the ones published in national TSA reports: in a few cases, this value is noticeably different from the figure reported in the Eurostat database (http://appsso.eurostat.ec.europa.eu/nui/show.do?dataset=naida_10_a10&lang=en). When the Eurostat estimate is replaced, the tourism share changes noticeably in a few countries (e.g., from 7.3% to 8.1% in France and from 2.7% to 3% in Lithuania).
TVA (in Absolute Values and as a Share of GVA) in the 28 EU Member Countries.
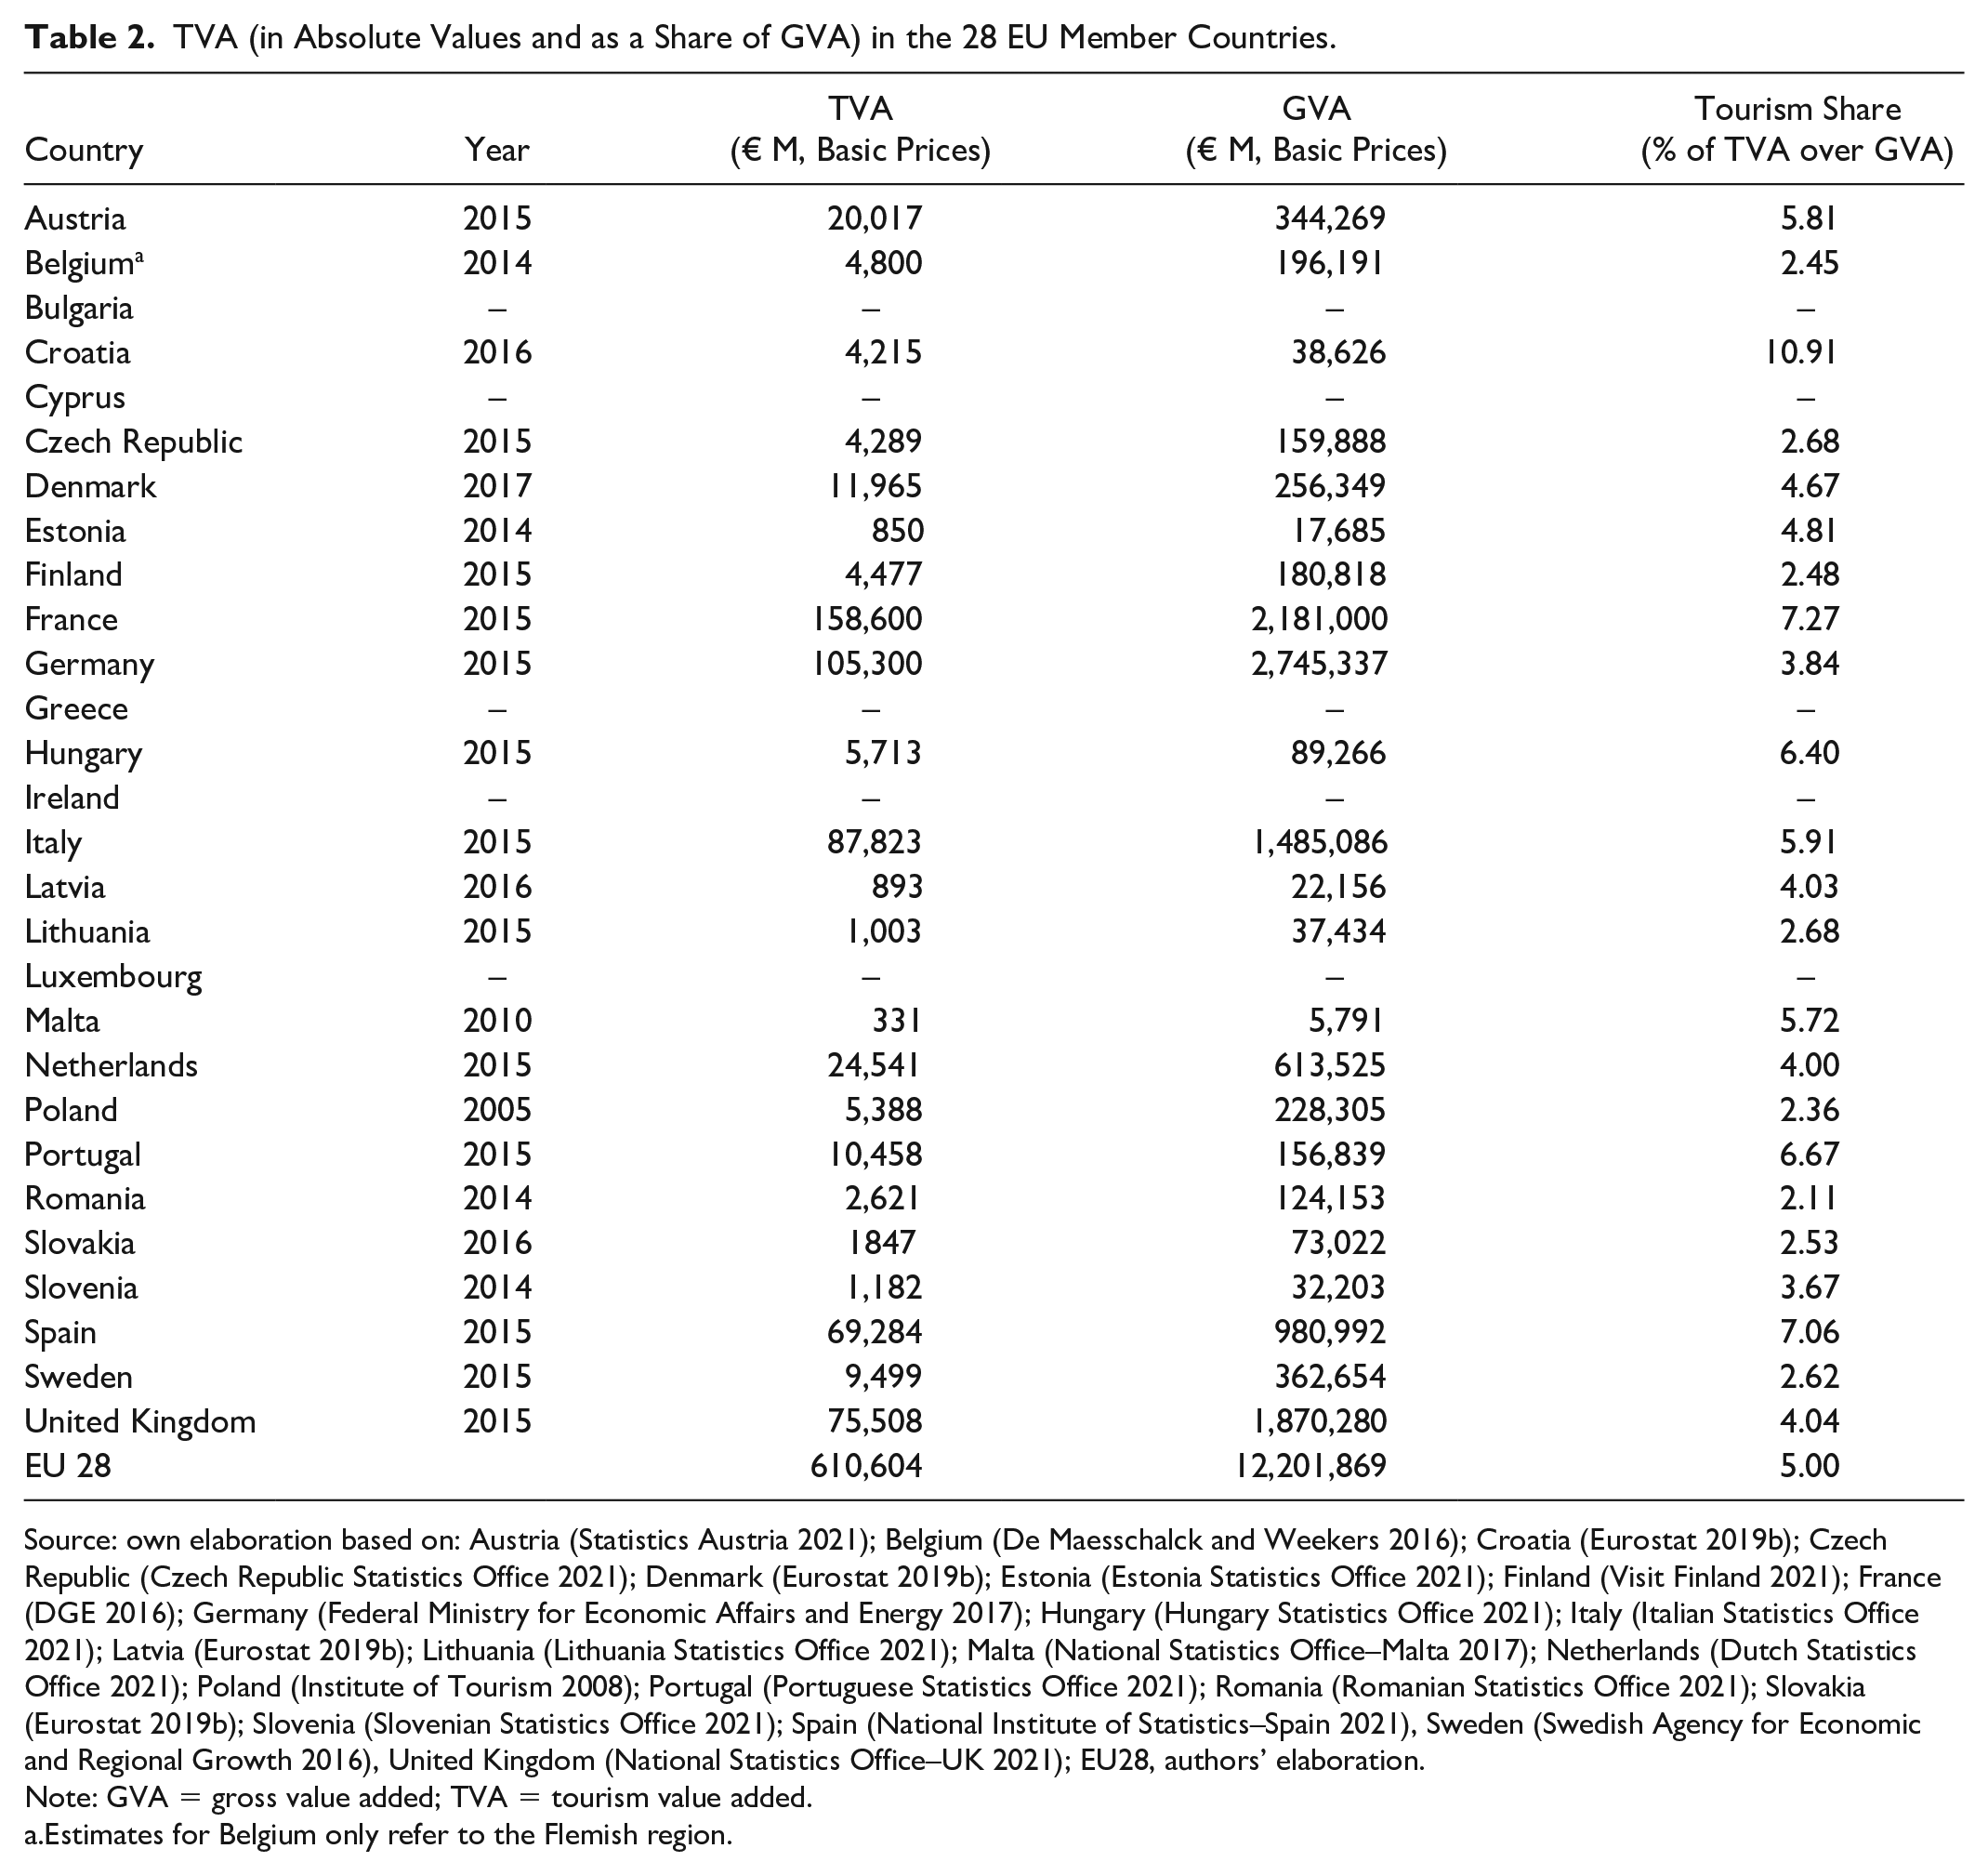
Source: own elaboration based on: Austria (Statistics Austria 2021); Belgium (De Maesschalck and Weekers 2016); Croatia (Eurostat 2019b); Czech Republic (Czech Republic Statistics Office 2021); Denmark (Eurostat 2019b); Estonia (Estonia Statistics Office 2021); Finland (Visit Finland 2021); France (DGE 2016); Germany (Federal Ministry for Economic Affairs and Energy 2017); Hungary (Hungary Statistics Office 2021); Italy (Italian Statistics Office 2021); Latvia (Eurostat 2019b); Lithuania (Lithuania Statistics Office 2021); Malta (National Statistics Office–Malta 2017); Netherlands (Dutch Statistics Office 2021); Poland (Institute of Tourism 2008); Portugal (Portuguese Statistics Office 2021); Romania (Romanian Statistics Office 2021); Slovakia (Eurostat 2019b); Slovenia (Slovenian Statistics Office 2021); Spain (National Institute of Statistics–Spain 2021), Sweden (Swedish Agency for Economic and Regional Growth 2016), United Kingdom (National Statistics Office–UK 2021); EU28, authors’ elaboration.
Note: GVA = gross value added; TVA = tourism value added.
Estimates for Belgium only refer to the Flemish region.
The contribution of tourism is available for 22 countries (plus the Flemish region of Belgium). Total TVA for those countries is equal to €610.6 billion, which is roughly the size of the Dutch economy and around 5% of the European economy for which data are available (Table 2, last row). As we do not expect that countries with missing data modify the overall picture, we can estimate that in the pre-COVID-19 era the direct contribution of tourism in the EU accounts for roughly €750 billion (€737 billion is the 5% of GVA for EU-28, which is €14,744 billion in 2019).
TVA is the outcome of the TSA and is computed starting from tourism consumption, which is the sum of inbound tourism expenditure, domestic tourism expenditure, and other types of consumption (mainly the value inputted for the services provided by second homes to owners and the value of collective services provided by the public administration). Tourism consumption is TVA plus intermediate consumption and is usually reported in the second-last column of TSA Table 6. It is presented here in Table 3, together with domestic output (GVA plus intermediate consumption) and the ratio of tourism consumption over domestic output. This ratio goes from 1.5% of Poland up to 9.7% of Croatia.
Tourism Consumption (in Absolute Values and as a Share of Domestic Output) in the 28 EU Member Countries.
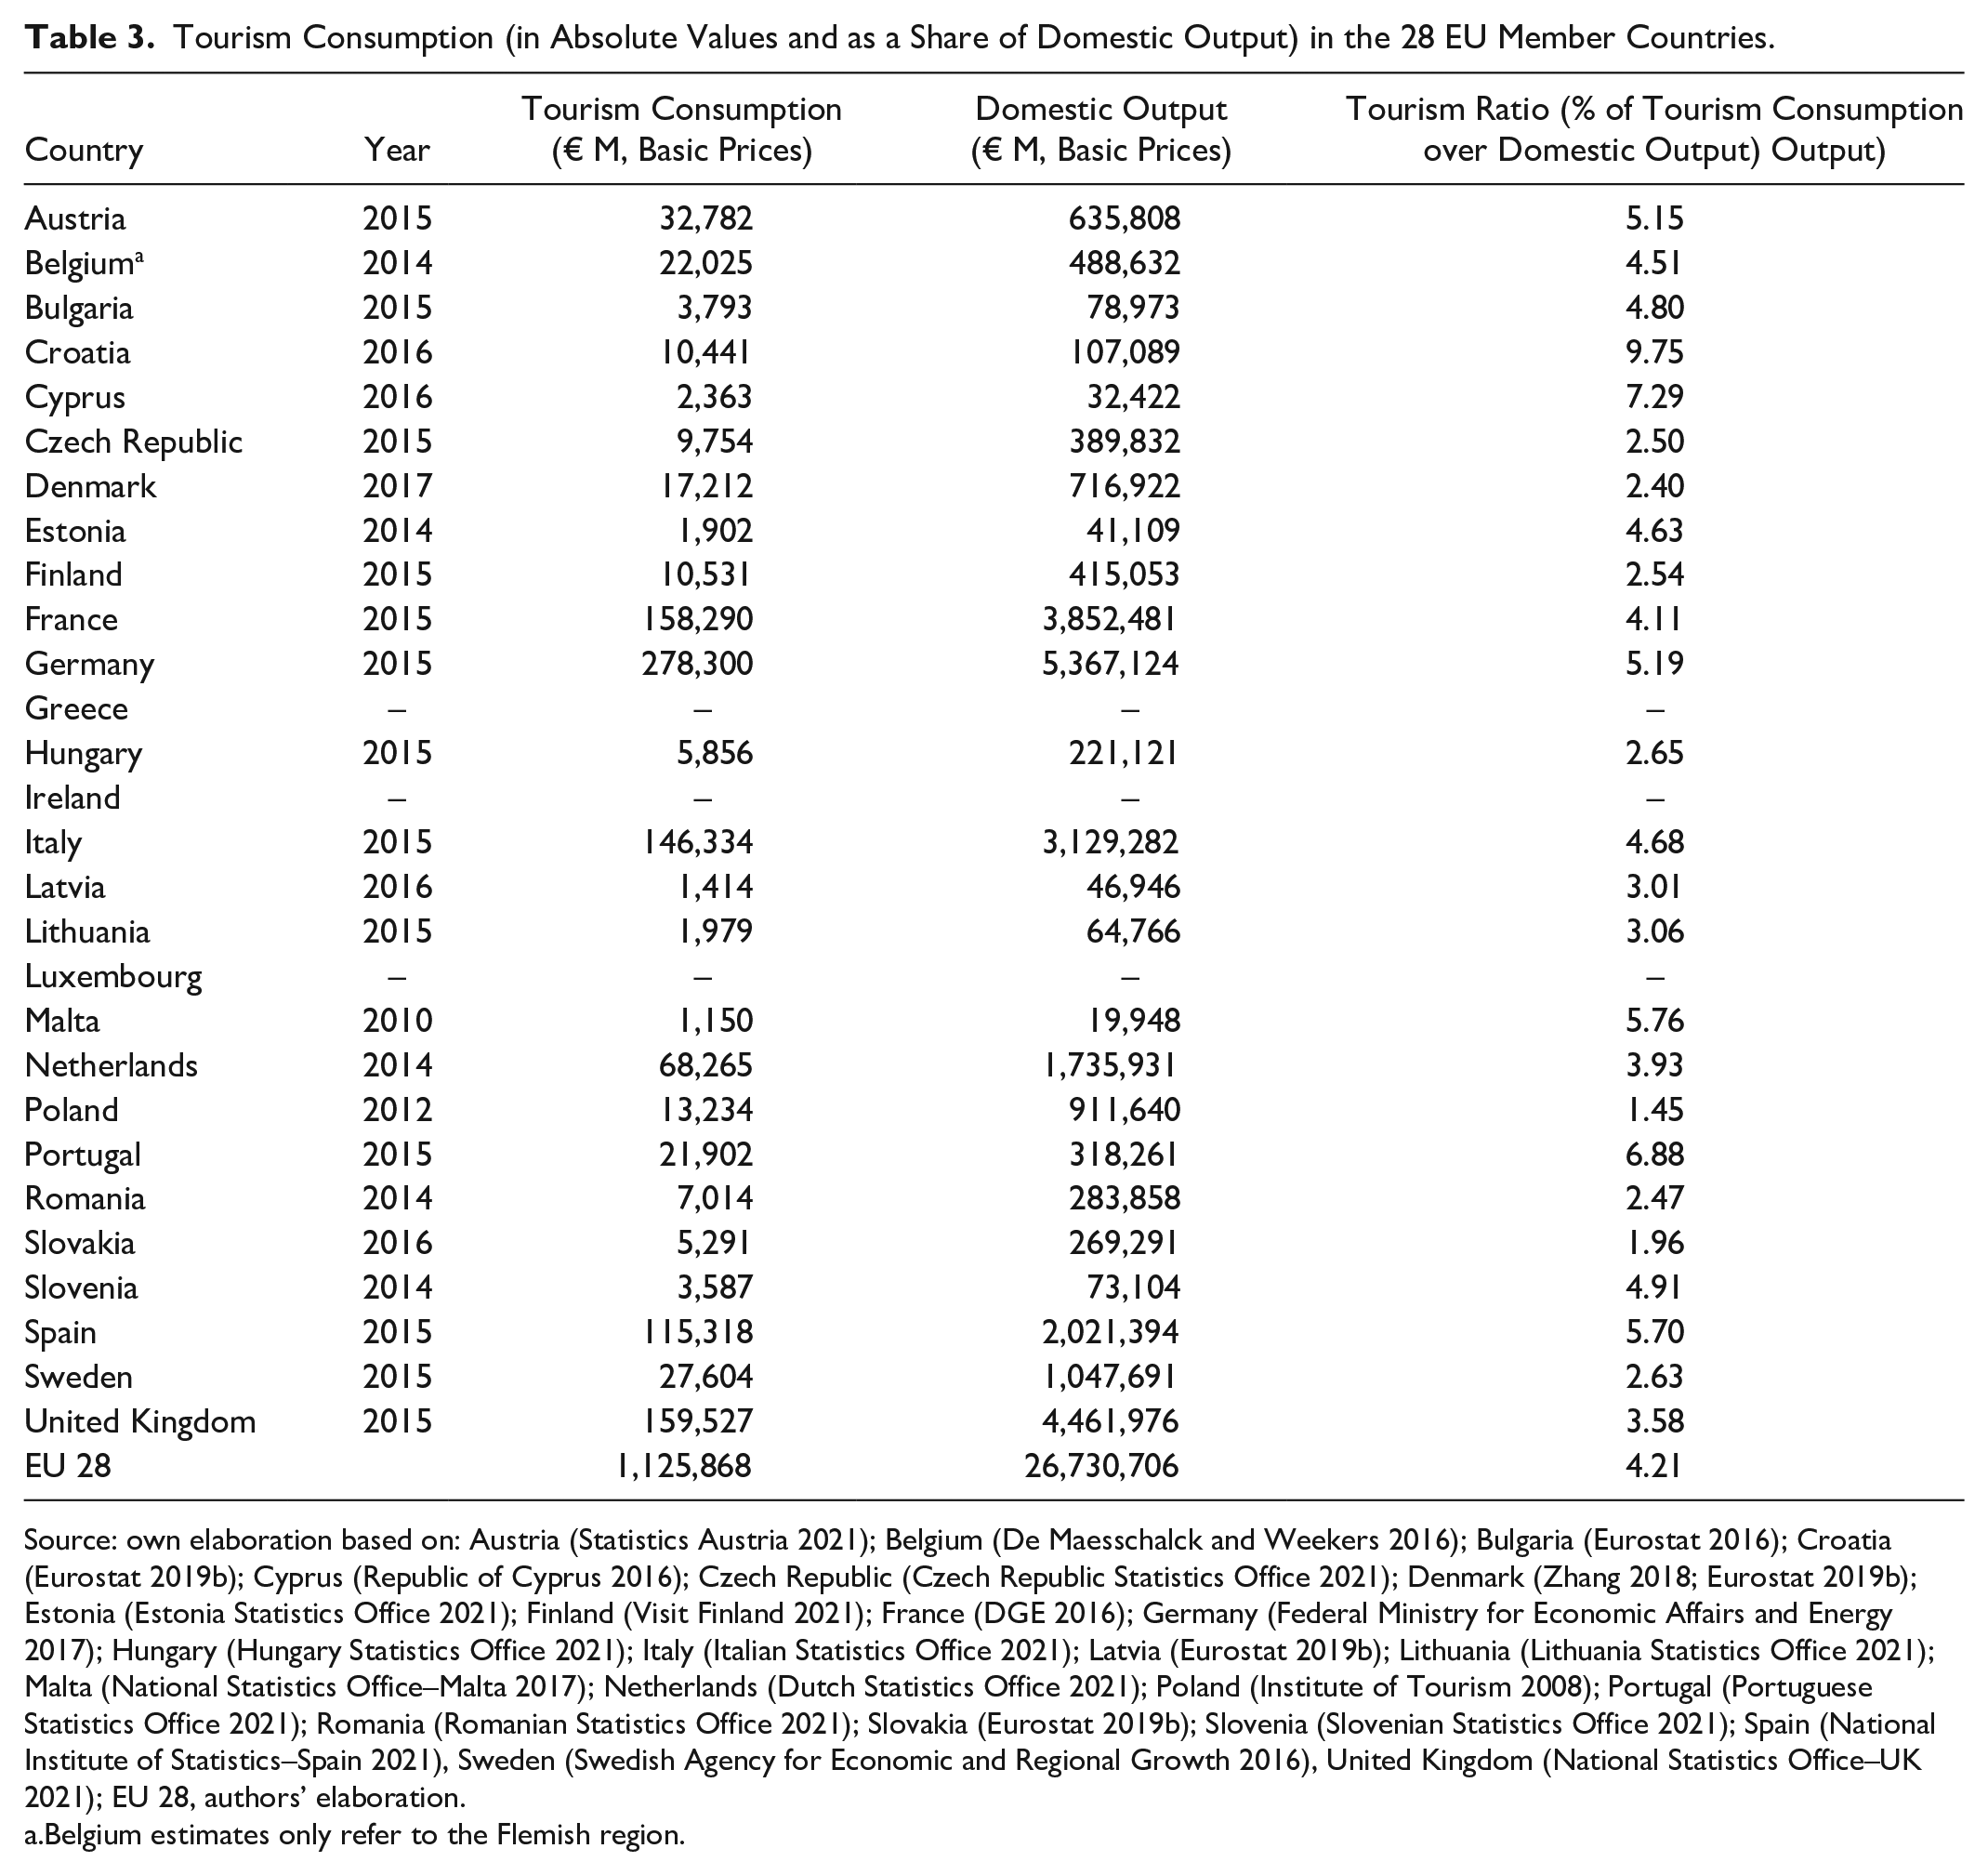
Source: own elaboration based on: Austria (Statistics Austria 2021); Belgium (De Maesschalck and Weekers 2016); Bulgaria (Eurostat 2016); Croatia (Eurostat 2019b); Cyprus (Republic of Cyprus 2016); Czech Republic (Czech Republic Statistics Office 2021); Denmark (Zhang 2018; Eurostat 2019b); Estonia (Estonia Statistics Office 2021); Finland (Visit Finland 2021); France (DGE 2016); Germany (Federal Ministry for Economic Affairs and Energy 2017); Hungary (Hungary Statistics Office 2021); Italy (Italian Statistics Office 2021); Latvia (Eurostat 2019b); Lithuania (Lithuania Statistics Office 2021); Malta (National Statistics Office–Malta 2017); Netherlands (Dutch Statistics Office 2021); Poland (Institute of Tourism 2008); Portugal (Portuguese Statistics Office 2021); Romania (Romanian Statistics Office 2021); Slovakia (Eurostat 2019b); Slovenia (Slovenian Statistics Office 2021); Spain (National Institute of Statistics–Spain 2021), Sweden (Swedish Agency for Economic and Regional Growth 2016), United Kingdom (National Statistics Office–UK 2021); EU 28, authors’ elaboration.
Belgium estimates only refer to the Flemish region.
The ratio of tourism consumption over domestic output should be roughly equal to the share of TVA over GVA, as they both discount intermediate consumption. A discrepancy in the two ratios for the same country is a relevant economic signal: if the ratio between the two value-added figures is higher than the ratio between the two output measures, it means that intermediate consumption is lower for tourism than for the rest of the economy, indicating that, ceteris paribus, €1 spent in tourism generates more GVA than €1 spent in the rest of the economy. Building on this interpretation, Figure 1 shows the ratio (in percentage terms) between TVA and tourism consumption: the higher the share, the better the sector translates the €1 spent by tourists in €1 of income. The ratio is low (below 40%) in countries such as Belgium, Germany, Malta, Netherlands, Romania, Slovakia, Slovenia, and Sweden and quite high (around 60%) in Austria, Denmark, Italy, Latvia, and Spain. As already mentioned, figures for France and Hungary are omitted because they are likely to stem from an incorrect estimate of either tourism consumption or TVA.
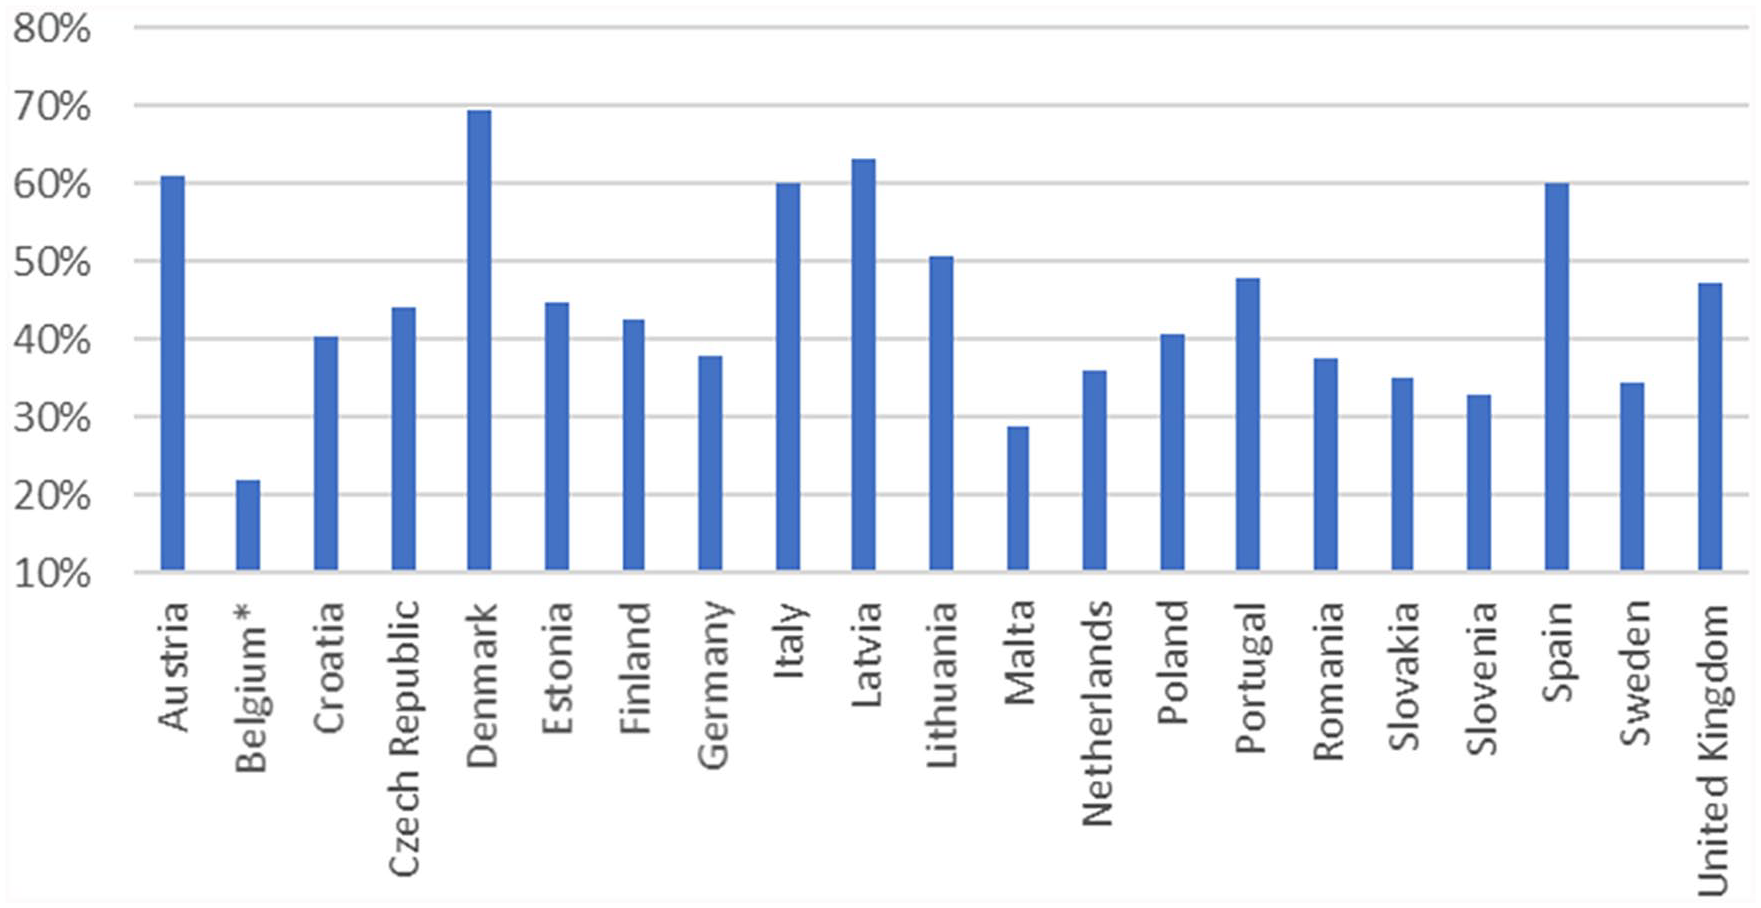
Tourism value added as a share of tourism consumption.
When it comes to the job market, tourism’s overall contribution to total employment in EU countries is around 6%–7%, providing more than 1 million full-time-equivalent (FTE) jobs in France, more than 2 million in Spain, and employing more than 3 million people in Germany. In terms of share of total employment, tourism contributes to as little as 3% of total employment in the United Kingdom up to 10% in Hungary (although data for this country might not be reliable, as already emphasized).
The Indirect and Total Contribution of Tourism to Output, GVA, and Employment in Selected Countries
As previously recalled, indirect and total economic effects of tourism are not regularly computed in EU countries. The only available information comes from technical reports and data published by the NSO of Austria (Statistics Austria 2021), Germany (Federal Ministry for Economic Affairs and Energy 2017), Estonia (Estonia Statistics Office 2021), and Spain (National Institute of Statistics–Spain 2021). Results for these four countries are reported in Table 4, together with the Czech Republic, Italy, and Portugal, the pilot countries for which values are estimated through the routine developed in-house to operationalize this computation and described in Supplemental Material S1.
Inspection of Table 4 allows to highlight that the indirect impact of tourism is very relevant for European economies, generating GVA up to €65 and €76 billion respectively in Italy and Germany: in relative terms, the indirect impact of tourism ranges from 1.5% of GVA in Austria and 4.7% in the Czech Republic. Countries widely differ in the ratio between direct and indirect effects: there are cases where the indirect economic impact is much lower than the direct impact (Austria, 26%); intermediate cases (Estonia, 51.5%; Portugal, 56.6%; Spain, 60.4%); cases with stronger indirect impacts (Germany, 72.2%; Italy, 74.1%, up to the Czech Republic, with 159%). Net of specific issues related to the structure of data in different countries, differences are probably triggered by the different production structure of tourism, as the better it is integrated with the rest of the domestic economy, the higher the triggered indirect impact.
A Comparison of European Countries.
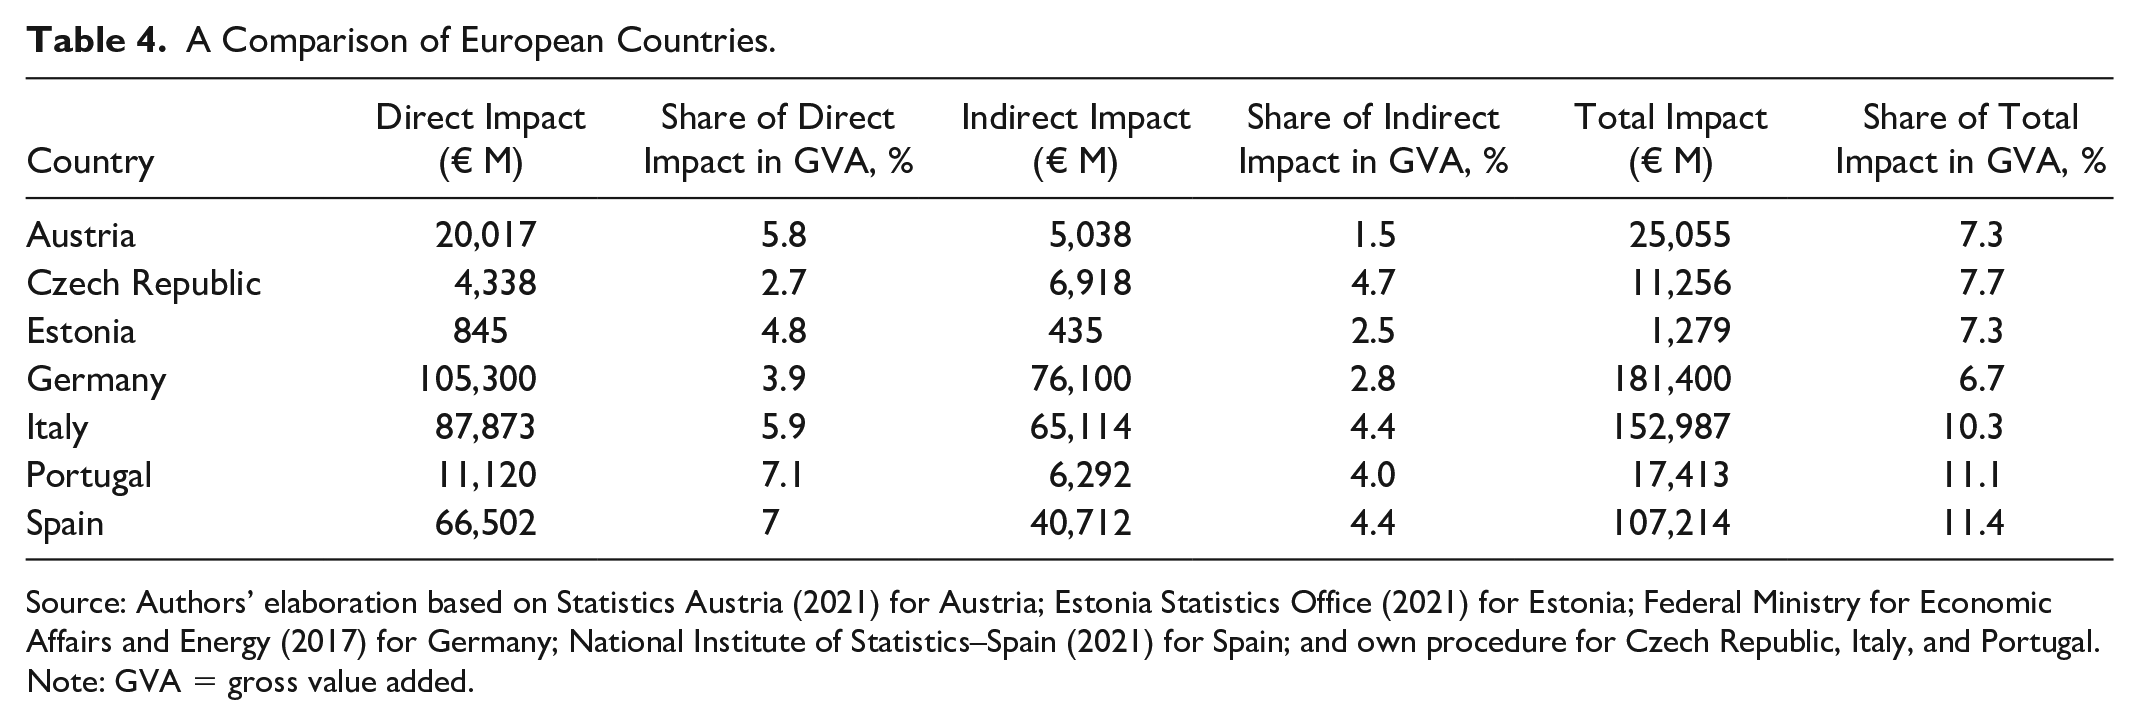
Source: Authors’ elaboration based on Statistics Austria (2021) for Austria; Estonia Statistics Office (2021) for Estonia; Federal Ministry for Economic Affairs and Energy (2017) for Germany; National Institute of Statistics–Spain (2021) for Spain; and own procedure for Czech Republic, Italy, and Portugal.
Note: GVA = gross value added.
The total (direct + indirect) impact of tourism accounts for 11.4% of GVA in Spain and 10.3% in Italy, two of the top five destinations in the world for the number of incoming tourists. The share is also high in another important (although smaller) destination (Portugal, 11.1%), while for countries not among the top destinations the share is 6%–7% (7.3% in Austria and Estonia, 6.7% in Germany, and 7.7% in the Czech Republic).
These figures also allow us to produce a rough estimate of a “textbook” tourism multiplier, measured as the amount of GVA generated by €1 spent in tourism (technically, the numerator of the income multiplier). In short, this multiplier is computed as follows:
the values of expenditure in different tourism products are obtained from the TSA tables, and assigned to the related production sectors (dj);
Leontief’s inverse matrix
the scalar resulting from the product between the
by summing over all sectors (
finally, a measure of value added generated per €1 spent in tourism is easily obtained by dividing by total expenditure:
The multipliers presented in Table 5 are computed for the expenditure of, respectively, inbound tourism, domestic tourism, total tourism, and the sum of inbound and domestic tourism only (hence excluding the other components of tourism consumption reported in TSA table 4).
A Rough Estimate of the Tourism Multiplier.
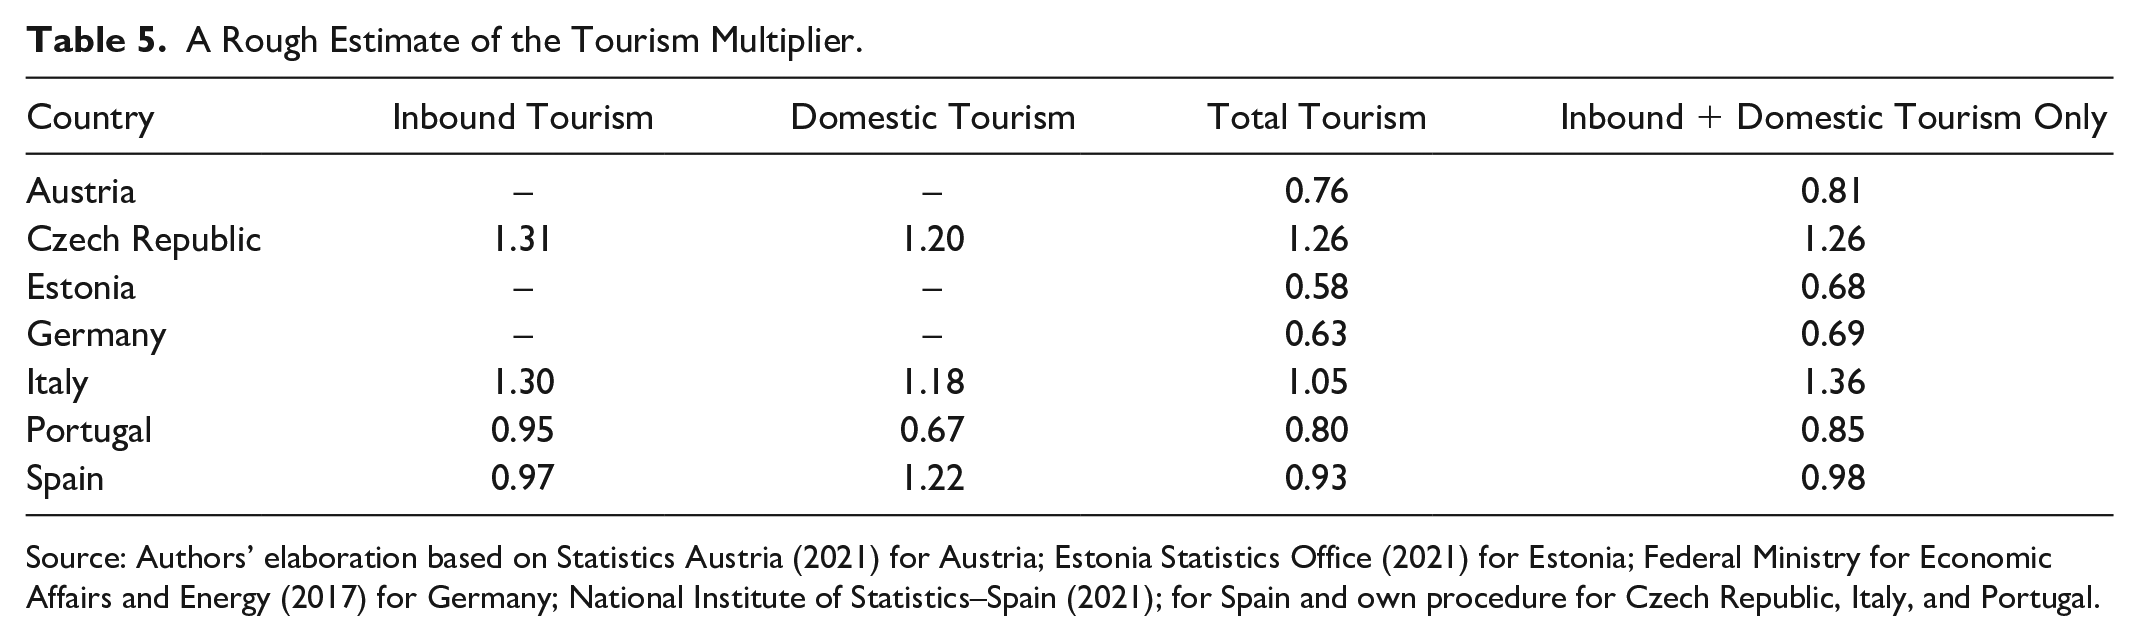
Source: Authors’ elaboration based on Statistics Austria (2021) for Austria; Estonia Statistics Office (2021) for Estonia; Federal Ministry for Economic Affairs and Energy (2017) for Germany; National Institute of Statistics–Spain (2021); for Spain and own procedure for Czech Republic, Italy, and Portugal.
If we focus on the multiplying impact of total tourism (second-last column of Table 5), it can be observed that values are higher than 1 for the Czech Republic and Italy, and very close to 1 for Spain. Multipliers are around 0.6–0.8 for the other countries (0.58, Estonia; 0.63, Germany; 0.76, Austria; 0.80, Portugal). There are two explanations for the divergence in multiplying impacts: first, in the latter group of countries, there might be more leakages (the diversion of funds from the circular flow of money within the economy), probably because of the higher share of imports or foreign-owned businesses than in the first group of countries. Second, in the group of countries with a low multiplier, the productive structure of tourism might be based on sectors with low value added.
The last column of Table 5 computes the multiplier stemming from the real expenditure of inbound and domestic tourists only, hence excluding consumption derived from second homes and public administration consumption. Since they are computed on a smaller expenditure base, multipliers are higher reaching, in the case of Italy, the value of 1.36. The lowest multipliers are still in Estonia and Germany.
It is also interesting to break down total impacts in the components of inbound and domestic tourism (first two columns of Table 5). The “inbound tourism multiplier” is higher than the “domestic tourism multiplier” for three of four countries for which impacts can be computed. This is not surprising, as inbound tourism is an export, stemming from “new” currency flowing into the country, while for domestic tourism money is diverted away from other forms of domestic consumption. The only exception to this pattern is Spain, where the multiplier of domestic tourism (1.22) is higher than the one of inbound tourism. It would be very interesting to look more closely into the data of Spain and Italy, two countries alike in terms of geography, size, economic development, and importance of tourism within the economy, to explain such difference. A possible explanation stems from the different spending structures of inbound tourism: Spain has a relatively higher number of tourists arriving within holiday tours organized by international agencies. It is well known that “package tourists” generally spend relatively more on goods that are imported, generating leakages from the domestic economy, and diminishing the value of tourism impacts. In Italy, on the contrary, the share of foreign tourists spending on local goods is much higher (think of food, wine, fashion), thereby pushing up the value of the multiplying impacts. The dependence of tourism consumption from imported goods is also the likely reason for the low multiplying impacts for Portugal, a small and open economy.
Once sectoral data on employment, number of hours worked and total wages are available, the routine developed in-house also allows the computation of total and multiplicative effects on employment. This elaboration is more complex, not only for the quantity of data to be considered but also for the lack of precise meta-data in statistical sources, especially regarding the distinction between employees and self-employed and between the number of jobs and the number of full-time equivalent positions. The main results are presented in Table 6 where, for each of the three pilot countries, total and disaggregated figures (by inbound/domestic and by direct/indirect) are presented.
Direct, Indirect, and Total Employment Effects.
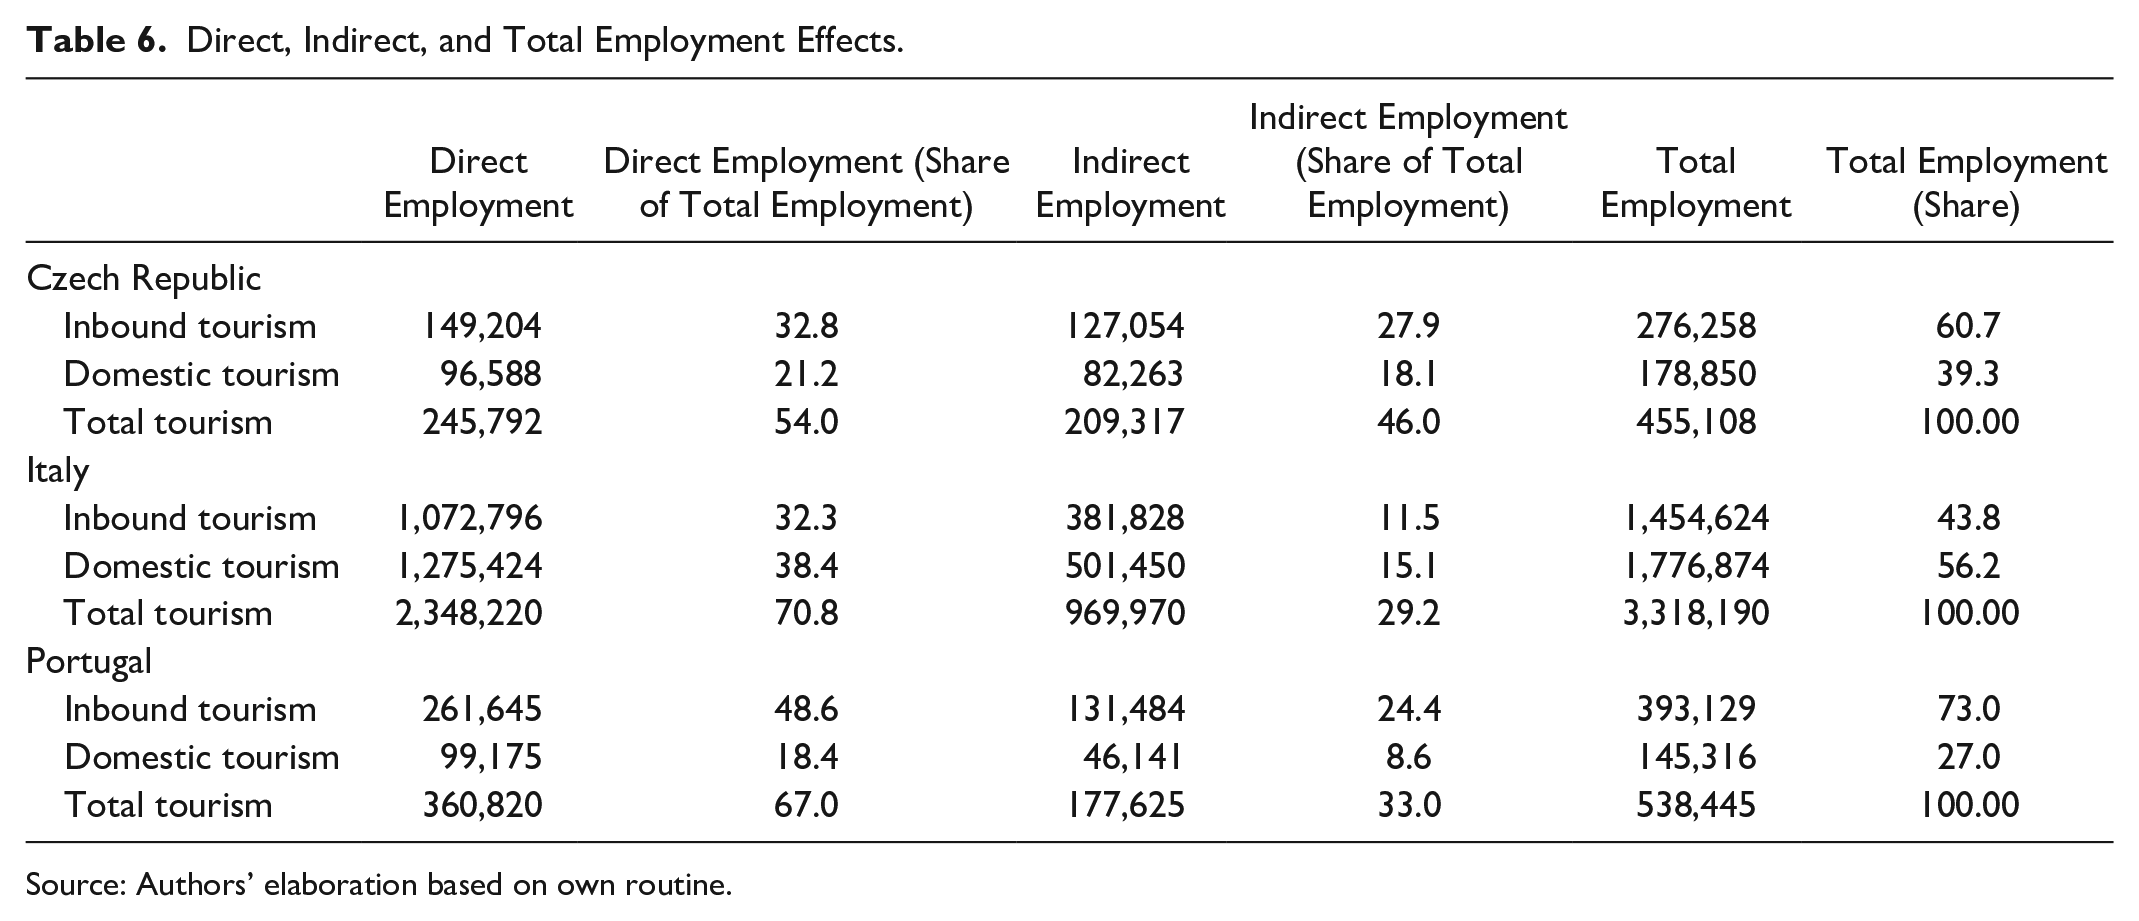
Source: Authors’ elaboration based on own routine.
In the Czech Republic, the number of jobs directly linked to tourism is estimated to be 245,792. The algorithm built in our routine allows us to compute 209,317 other positions generated through the indirect impacts, bringing the total (direct and indirect) employment impact of tourism close to 455,000 jobs. Inbound tourism is the most important contributor to employment, counting for 60.7% of total jobs. In Italy, jobs directly created in tourism are 2,348,220. Adding 969,970 other positions that are indirectly stimulated, the total employment impact of tourism surpasses three million (3,318,190) jobs. Inbound tourism and domestic tourism contribute almost equally to employment, the former counting for 43.8% and the latter for 56.2% of total jobs. Moving to Portugal, the number of jobs directly linked to tourism is 360,820, to which 177,625 indirect positions can be added, bringing the total (direct and indirect) employment impact of tourism to 538,445 (13.4% of total employment). Inbound tourism is the most important contributor, counting for 73% of total jobs.
Discussion and Policy Implications
This article proposes and develops a semiautomatic routine to compute indirect and total impacts of tourism using I-O and TSA for countries where a minimum standard of data is available. The procedure is applied to a pilot set of EU countries (the Czech Republic, Italy, Portugal), to investigate the economic contribution of tourism to GDP and employment. Findings are compared to other EU countries for which data are available (Austria, Estonia, Germany, Spain), this way highlighting key issues for the future EU tourism policy agenda. They are related to data availability and dissemination, intra-EU comparison of findings, and implications for tourism policy. After the discussion of these three issues, the article concludes with a few words on the future directions of investigation.
Data Availability and Dissemination
A complete understanding of tourism in the EU cannot be achieved without an appropriate step forward in how TSA data are collected, organized, and disseminated. We highlight three points of attention. First, the production of TSAs should be included within the legal framework of Eurostat: the NSOs of EU countries should be required to produce and publish TSAs at least every 3 years, with a publication lag of no more than 3 years (namely, TSAs for 2021 should be available no later than December 2024). TSAs should also be coordinated with I-O tables, to allow a perfect matching and timing between these two accounting tools. As the I-O models are based on assumptions of constant technical coefficients and of price stability, they are consistent with the “short-run” of the economic theory. Innovation and inflation dynamics require that I-O tables (and TSAs, which are built on that) are recomputed no later than every 3–4 years to provide an updated picture of production relationships.
Second, the dissemination of TSAs should be standardized and include a summary report of the main findings and a technical file with a common template. We suggest using the spreadsheet format, one file for each TSA, each file including one sheet for each TSA table. More specifically, we suggest (1) a full correspondence between the product categories reported in the file and the tourism products listed in Eurostat and UNWTO TSA methodological framework and recalled in Table 1 of this article; (2) rigidity in the template: values of the same economic aggregate should always be placed into the same cell, without any altering of the file structure. This would accelerate further elaboration, facilitate the integration with I-O tables, and simplify the replication of results. Our proposal for such a file is available in the online supplementary material (Supplemental Material S2) for the three pilot countries of our investigation (the Czech Republic, Italy, and Portugal); (3) the same information included in the file should also be available in the NSO database to be retrieved online and embodied in the data set tree of Eurostat, thereby facilitating intra-European analysis and comparison.
Third, an extra effort should be made to standardize the approach in dealing with the issue of what is behind the aggregate “Other / Non-specific / Connected products” of TSA tables (see Table 1). As this value is 20%–25% of total tourism consumption, its understanding is key for the accurate computation of economic impacts. Without a precise description of this aggregate, it cannot be imputed to any specific product or industry in the I-O tables, being either lost or normalized through strong assumptions when estimating indirect effects. A similar harmonization is needed for dealing with item 1.2 reported in Table 1 (services for the use of second homes).
Intra-EU Comparison of Findings
This study highlights that EU countries are highly heterogeneous in the economic impact of tourism: income stemming from €1 of additional tourism expenditure ranges from €0.58 of Estonia and €0.63 of Germany to €1.05 of Italy and €1.26 of the Czech Republic. Multiplying effects are higher for inbound tourism, with the relevant exception of Spain. Similar differences are also found in employment effects: there are countries where most jobs are generated by inbound tourism (Portugal, the Czech Republic), and others where the most important contribution comes from domestic tourism (Italy).
Differences stem from the peculiarities of the tourism product, which varies across countries in terms of quantity of local goods consumed by tourists, and for the intensity of the sectoral linkages. Given such diversity in the countries that have been investigated, we ring a warning bell in estimating results for the missing regions by simply averaging out countries’ findings. This would be misleading and likely to introduce biases.
Policy Implications
Not only the procedure developed for this study is a useful accounting device, but it can also become an important policy tool for industry leaders and policy makers, as it easily allows the estimation of direct and indirect economic impacts (on output, GVA, and employment) of exogenous shocks of demand. Tables 7 and 8 report the estimated impacts of, respectively, one million additional tourists (either inbound or domestic) and one million additional overnight stays in the three investigated countries, via the variation of tourism expenditure.
The Impact of 1 Million Additional Tourists (Either Inbound or Domestic) on Output, GVA, and Employment.
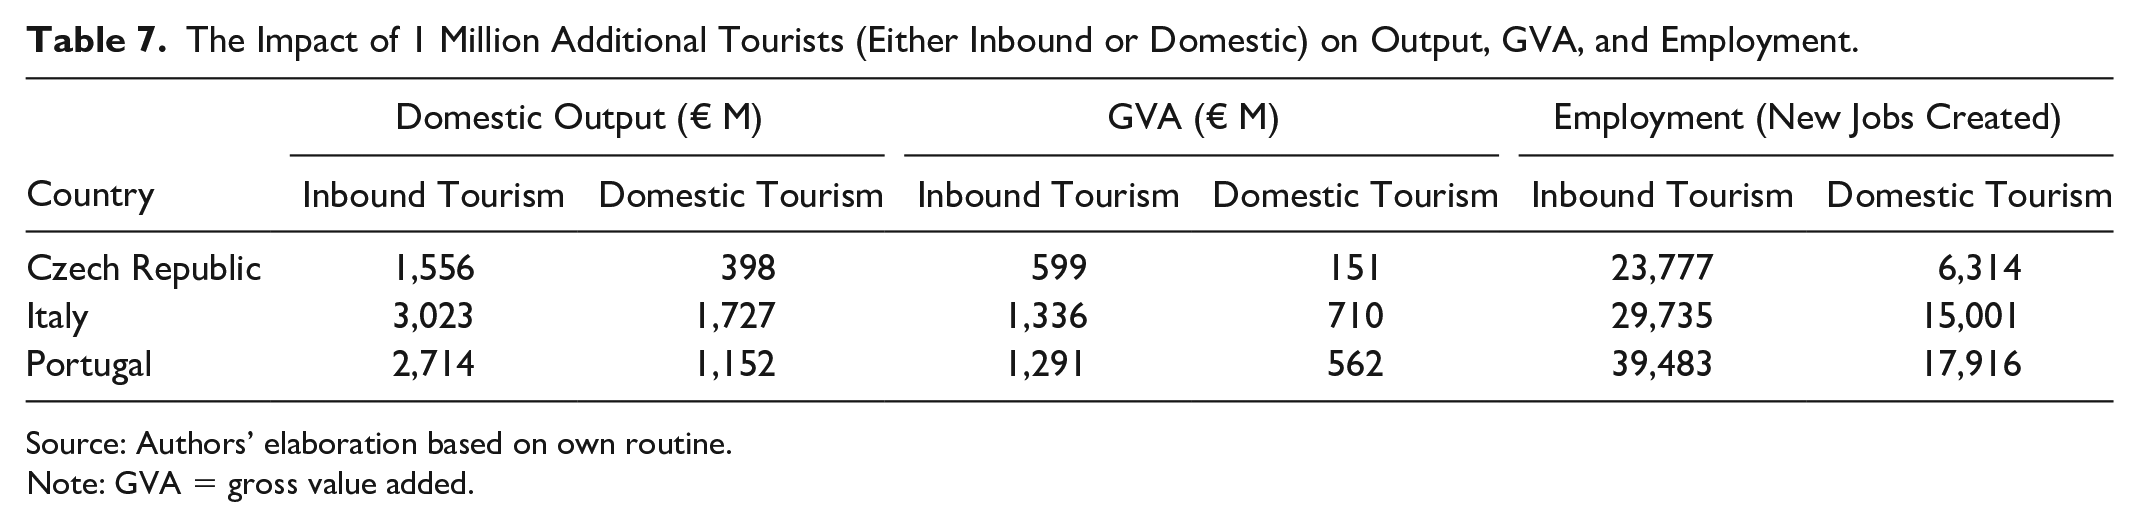
Source: Authors’ elaboration based on own routine.
Note: GVA = gross value added.
The Impact of 1 Million Additional Overnight Stays (Either Inbound or Domestic) on Output, GVA, and Employment.
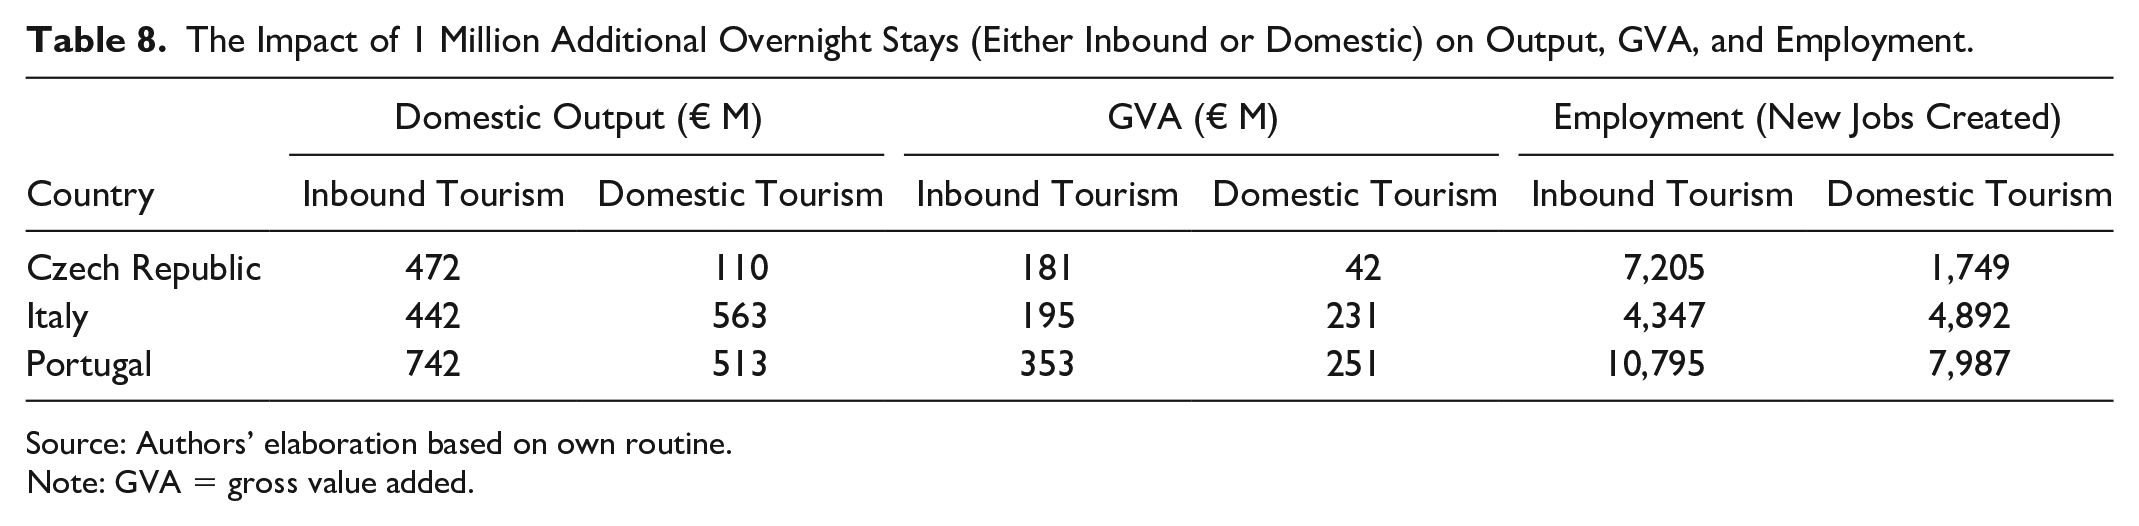
Source: Authors’ elaboration based on own routine.
Note: GVA = gross value added.
The scenarios depicted in Tables 7 and 8 raise three comments. One, destinations for which tourism is an important share of GDP (9%–10% of GVA, Italy and Portugal) show a much higher marginal impact of additional tourists (particularly inbound) than the Czech Republic. For example, one million additional inbound tourists create around €1.3 billion GVA in Italy and Portugal, but only €0.60 billion in the Czech Republic (Table 7, third column).
Two, the impact of additional inbound tourism is always much larger than the impact of additional domestic tourism (compare columns 3 and 4 of Table 7), mainly because of the longer length of stay of inbound tourists. Table 8, which presents the impact per overnight stay, builds a different scenario. It is interesting to notice, among other things, that the marginal impact of one million inbound overnight stays is much larger in Portugal (€353 million) than in Italy (€195 million) and that, in the case of Italy, one million additional domestic overnight stays (€231 million) become more valuable than one million additional inbound overnight stays (€195 million).
Three, one million additional domestic tourists would generate 6,314 new jobs in the Czech economy, much less than the 23,777 new positions generated by one million additional inbound tourists for the same country (Table 7, last two columns). The respective numbers are 15,001 and 29,735 for Italy, and 17,916 and 39,483 for Portugal. Again, this supports findings that the structure of tourism expenditure and the sector linkages differ considerably across countries. As the employment impact of additional tourists is very large in Italy and Portugal for both inbound and domestic tourism, this suggests that tourism is particularly labor-intensive in these economies.
As a general matter, what is important is not the numeric simulation per se, but the easiness of estimating scenarios differing for their tourism dynamics. This becomes of paramount importance when dealing with events like the COVID-19 pandemic. While stakeholders and policy makers have been struggling to estimate the impact that health measures and travel bans have on the economy, our routine is an easy-to-use tool to evaluate the potential impact of the lockdown. To provide an example, let us consider Italy, one of the main epicenters of the pandemic in the early months of 2020. According to UNWTO estimates, international tourism was estimated to fall between 60% and 80% in 2020 (UNWTO 2020). While the precision of the estimates is beyond the scope of this article, the routine herein developed can determine the economic cost of the drop in tourism arrivals.
Table 9 applies the UNWTO scenario to the Italian case by considering a fall of 70% in inbound tourism, to which a further 25% fall in domestic tourism is added: in fact, it is likely that domestic tourism has a stronger resilience than international tourism, also because many residents have been substituting outgoing with domestic trips, because of travel restrictions and other forms of limitations (e.g., quarantines requested to foreign visitors). Feeding this scenario into our routine translates into a total loss of €71.1 billion for Italy, of which €41.3 billion is the direct impact and €29.8 billion is the indirect impact. Inbound tourism contributes to a loss of €50 billion, while domestic tourism brings a loss of €21.1 billion. If the direct economic loss of €41.3 alone is considered, to avoid double-counting, this is 2.3% of Italian GDP. According to official estimates of the Italian Government (MEF 2020), Italian GDP would fall at least by 8% in 2020; hence, tourism would contribute to about 30% of this loss, five times its share of the GDP. Again, the easiness to build and evaluate these scenarios is of paramount importance for policy makers and stakeholders facing exogenous shocks.
The Estimated Cost of the COVID-19 Pandemic for the Tourism Sector, Italy (€ Billions).
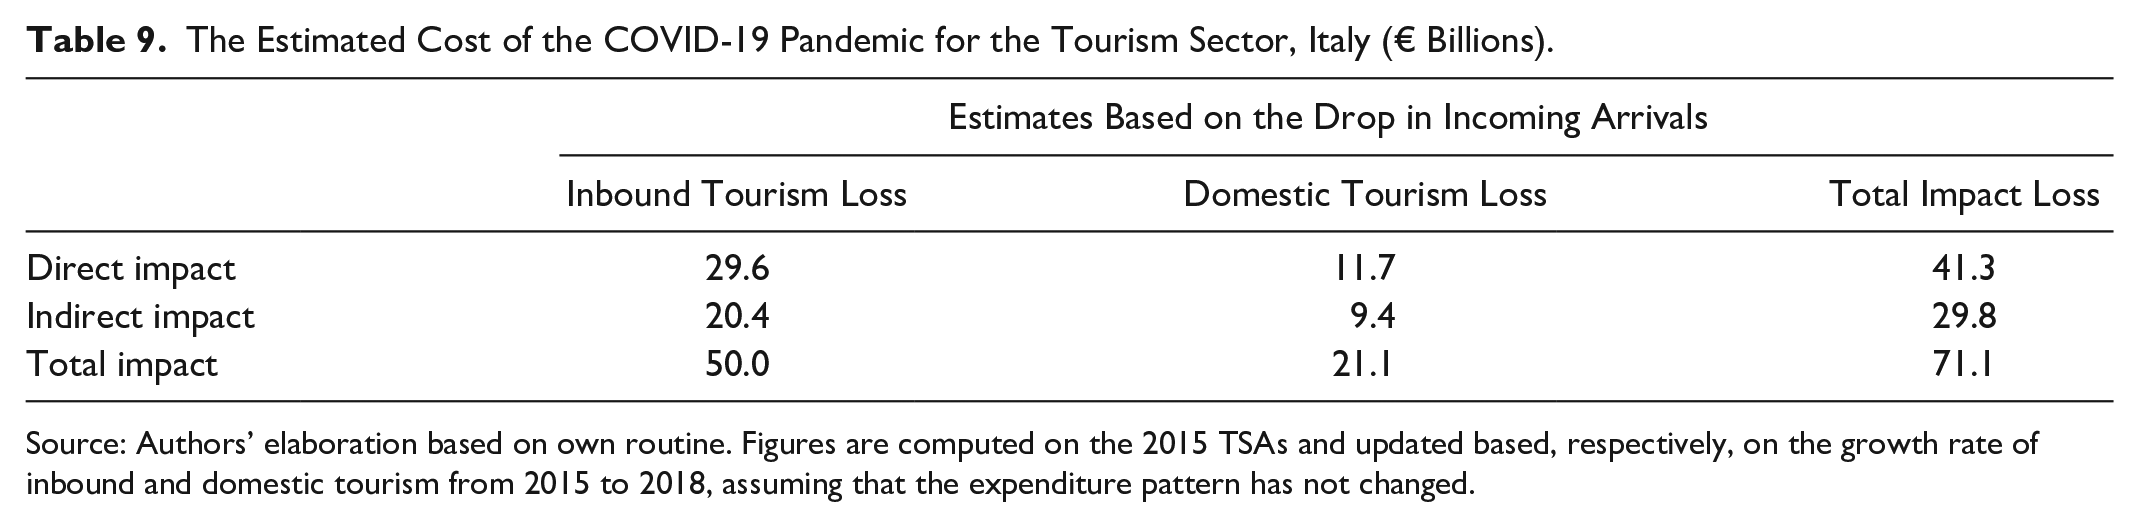
Source: Authors’ elaboration based on own routine. Figures are computed on the 2015 TSAs and updated based, respectively, on the growth rate of inbound and domestic tourism from 2015 to 2018, assuming that the expenditure pattern has not changed.
Future Directions of Investigation
The last word is dedicated to the future paths of investigation on this topic. Three are the priorities: First, a recent joint project of OECD and WTO has been aiming at breaking down the total amount of GVA generated by consumption activities, adding foreign GVA to the typical “domestic” GVA measured in I-O tables. The project is leading to the development of a rich intercountry I-O table (ICIOT) including 63 countries (plus, as residual, the rest of the world) and 34 economic sectors. The database, which has recently been mirrored by the project FIGARO of Eurostat, opens enormous possibilities for the measurement of trade in value added (TiVA) to identify where in the world GVA has been triggered by activities of consumption carried out in the reference economy. The TiVA approach traces back the value addition of each industry and country in the production chain and allocates it to the source industries and countries. The ICIOT sheds light on how the export of a country generates value added not only domestically but also in those countries producing intermediate inputs for such export. The use of ICIOT tables, which is now in its infant and experimental stage, is likely to be one of the most promising issues of research in international trade (and in tourism economics) of the next few years.
A second priority, especially for statistics offices, is the harmonization of tourism data collection, something that would also enable the routine developed in this study to extend the computation of the total impact of tourism to other countries. In an ideal scenario, with TSA tables produced and published according to the suggested format by all NSOs, the direct, indirect, and total economic impacts of tourism in the whole EU could be calculated. Given the high degree of integration of European economies, and the ever-increasing relevance of EU economic policy initiatives and reforms (e.g., the Recovery Plan for the postpandemic era), this task is of paramount importance for providing policy makers with correct figures on the importance of tourism in generating a recovery in income and jobs.
Finally, a more thorough investigation of the linkages between tourism and the other economic sectors that indirectly gain from tourism is needed: in this respect, the routine developed for this study is promising for two reasons: first, sector-by-sector impacts can be computed and compared within and between countries; second, a future extension of the routine could also allow adding induced-effect impacts to the total estimation, thereby allowing the computation of type II multipliers.
Supplemental Material
sj-xlsx-1-jtr-10.1177_00472875211028322 – Supplemental material for Estimating the Economic Impact of Tourism in the European Union: Review and Computation
Supplemental material, sj-xlsx-1-jtr-10.1177_00472875211028322 for Estimating the Economic Impact of Tourism in the European Union: Review and Computation by Paolo Figini and Roberto Patuelli in Journal of Travel Research
Supplemental Material
sj-xlsx-2-jtr-10.1177_00472875211028322 – Supplemental material for Estimating the Economic Impact of Tourism in the European Union: Review and Computation
Supplemental material, sj-xlsx-2-jtr-10.1177_00472875211028322 for Estimating the Economic Impact of Tourism in the European Union: Review and Computation by Paolo Figini and Roberto Patuelli in Journal of Travel Research
Supplemental Material
sj-xlsx-3-jtr-10.1177_00472875211028322 – Supplemental material for Estimating the Economic Impact of Tourism in the European Union: Review and Computation
Supplemental material, sj-xlsx-3-jtr-10.1177_00472875211028322 for Estimating the Economic Impact of Tourism in the European Union: Review and Computation by Paolo Figini and Roberto Patuelli in Journal of Travel Research
Footnotes
Acknowledgements
The authors would like to thank Ovidiu Ene for inspiring the research and for providing valuable feedback during the different stages of the research project. We are indebted to participants to the Workshop on Tourism Statistics held at Eurostat headquarters, Luxembourg, October 10, 2018, and to Anastasia Arabadzhyan for insightful discussion about the reality of tourism data.
Declaration of Conflicting Interests
The author(s) declared no potential conflicts of interest with respect to the research, authorship, and/or publication of this article.
Funding
The author(s) disclosed receipt of the following financial support for the research, authorship, and/or publication of this article: Research for this article has been financed by contract GRO-SME-17-C-091a/C of the European Commission, Executive Agency for Small and Medium-Sized Enterprises (EASME).
Supplemental Material
Supplemental material for this article is available online.
Author Biographies
References
Supplementary Material
Please find the following supplemental material available below.
For Open Access articles published under a Creative Commons License, all supplemental material carries the same license as the article it is associated with.
For non-Open Access articles published, all supplemental material carries a non-exclusive license, and permission requests for re-use of supplemental material or any part of supplemental material shall be sent directly to the copyright owner as specified in the copyright notice associated with the article.