



Abstract
Tourism is a powerful economic driver for communities, but there are dangers of overtourism in tourism-dependent destinations. The study proposes an approach to detect early signs of overtourism by integrating census and industry data with residents’ perceptions of tourism benefits. The indicators include industry performance, its economic impacts, and indirect measures related to quality of life. The public perceptions are collected through surveying four different tourism-dependent communities in Florida. We found that in general local residents are highly positive about the tourism industry benefits to their communities, yet many respondents would like the tourism levels reduced. Especially concerning are negative sentiments toward tourism among the younger population groups and racial minorities. The findings are interpreted as early signs of overtourism.
Introduction
The success of the tourism industry is defined by a variety of stakeholders: destination management, tourists, business operators, government, and importantly local communities (Zhang, Inbakaran, and Jackson 2006). The community support is often taken for granted as it had been long accepted that tourism brings numerous benefits to hosting communities by promoting their economic growth and development (Jenkins 1991; United Nations World Tourism Organization [UNWTO] 1980). Recently, however, more evidence has pointed at growing dissatisfaction with tourism industry amongst the people living in tourism-dependent communities. Indeed, in 2018 the term “overtourism” meaning “excessive numbers of tourists, causing undesirable effects for the places visited” made its way into the Oxford English Dictionary as noted in Minihane (2019) and subsequently was nominated “the Word of the Year.” 1
In the 2010s, the famous Krippendorf’s (1984, as cited in Krippendorf 2010, 107) call for “rebellious tourists and rebellious locals” necessary for implementation of sustainable and ethical tourism policies was reinterpreted as an early warning for tourism industry. Indeed, over the past decade the “rebellious” residents of multiple popular tourism destinations have forced local policymakers to adopt policies limiting tourism in their areas. Signs of overtourism are evident in many popular destinations worldwide. In Barcelona, the locals were demonstrating against tourists on its streets and beaches, even vandalizing rental bicycles and sightseeing buses (Leadbeater 2017). In Venice, citizens were blocking the passage of cruise ships, effectively forcing the city to cap the number of cruise ship dockings. In New Zealand newspapers, locals have been complaining that their favorite natural attractions are overrun with international visitors, urging the government to act.
The Factiva 2 global news search for the term “overtourism” shows an explosive growth from 100 news articles in 2017 to 1,294 in 2019. Even in Covid-19’s 2020, there were 812 overtourism publications. A closer look at a publication sample, however, reveals that the majority of the articles considered overtourism from the perspective of the tourism industry (mostly discussing cruises), tourists (mostly discussing beach pollution), nature protection (e.g., in the Galapagos), or conservation of architectural heritage (e.g., the Great Wall of China). At present, very few destinations are recognized for their overtourism problem from the locals’ point of view. For example, Fodor’s Travel “No list” 3 includes only 13 such destinations: Venice, Machu Picchu, Amsterdam, Koh Tachai (Thailand), Santorini (Greece), Isle of Skye, Easter Island, Dubrovnik, Mallorca, Barcelona, Big Sur (California), Angkor Wat, Bali, and Hanoi’s Old Quarter. Evidently, the destinations are put on this and similar lists when the situation with overtourism is already dire and difficult to reverse.
The combination of positive and negative factors impacting local communities subjected to tourism development is sometimes referred to as a “development dilemma” (Telfer and Sharpley 2007). When resolved, this dilemma leads to a compromise or trade-off between the benefits of tourism development such as generation of job and services and negative consequences that come with it, such as a loss of traditional ways of life and overcrowding (Sharpley 2014). How well this compromise has been formulated and communicated to the public and whether it has been accepted by residents is reflected in the balance of residents’ perceptions and satisfaction after weighing the costs and benefits and is vital for the overall success of tourism development in the area (Andriotis and Vaughan 2003). In the tourism academic literature, research on the host communities’ perceptions of tourism amounts to over 1,000 publications in three leading tourism journals, that is, Tourism Management, Annals of Tourism Research, and Journal of Travel Research (Sharpley 2014) only. Tourism impacts have been classified as economic, socio-cultural, and environmental, direct and indirect (Crotts and Holland 1993), and the Social Impact Assessment (SIA) framework (Vanclay 2003) to measure the tourism impacts on local communities has emerged. Residents’ perceptions of these impacts on their communities have been found to vary considerably between genders, age, and income groups, social statuses, employment types, and many other characteristics.
In this paper, we maintain that the early signs of overtourism include an emerging discontent of the residents with tourism in their geographical areas even when the traditional measures of tourism impacts are still positive and traditional signs of overtourism such as antagonism of locals (Doxey 1975) are barely visible. Methodology-wise, we utilize the SIA framework (described in Section 2.2), enhancing it with a formalized, data-based approach to detect the early signs of that discontent by comparing the top-down objective indicators of tourism impacts from industry and government statistics with bottom-up subjective perceptions of the residents obtained through public surveys. Here, we use the term “top-down” as a shorthand for data sources presenting the “official” industry and government’s perspectives, while the “bottom-up” data represents the locals’ grassroots perspective. Note that we consider the TripAdvisor hotel review rating a “top-down” data source since it (1) represents the tourists’ rather than locals’ perspective and (2) is routinely used by the industries to benchmark their performance. Our approach utilizes a data fusion method defined as combining “data from multiple sensors and related information from associated databases to achieve improved accuracy and more specific inferences than could be achieved by the use of a single sensor alone” (Hall and Llinas 1997). The tourism dependency is usually defined in economic terms such as the ratio of per capita lodging receipts or the overall travelers’ spending to per capita personal income (Harvey, Hunt, and Harris 1995; Royer, Mccool, and Hunt 1974), and other indices describing the share of tourism industry in the number of businesses, employment, income, GDP, and similar measures. Following this definition, we consider multiple measures of industry performance (e.g., hotel room inventory), both direct (e.g., tourism tax), and indirect (e.g., income inequality), in assessing tourism impacts. The approach identifies the most pressing areas of residents’ discontent as well as communities and populations the most disengaged with tourism. Consequently, it would allow elected officials and tourism industry leaders address concerns of the public.
The rest of the paper is structured as follows. Section 2 presents the typology of indicators for assessing the impacts of tourism development on communities, as well as factors that are influential for residents’ perceptions of value that tourism brings to their livelihood. The section also introduces the SIA framework as the foundation on which the proposed approach is built. The literature is summarized in Supplemental Appendix 1. Section 3 describes the overall research design, study areas, and collected data. Analyses of the top-down measures of tourism impacts are provided in Section 4, while Section 5 presents the results pertaining to the bottom-up measures. Section 6 integrates the results obtained with bottom-up and top-down measures and interprets which communities and population segments are the most affected. Finally, Sections 7 and 8 summarize the findings and their implications for tourism development. While the approach is demonstrated on Florida communities, it can be applied to any tourism-dependent community, thus effectively making the approach generalizable.
Literature Review
Tourism Impacts on Local Communities
Investigation of tourism impacts on hosting communities is one of the most important components in tourism planning and destination management; thus, a considerable scholarship has been developed in the field (for a list of the most popular topics in tourism scholarship, see Kirilenko and Stepchenkova 2018). Among those aspects, one can identify three major groups of benefits and concerns (Wall and Mathieson 2006): economic impacts, socio-cultural impacts, and environmental impacts. Importantly, these impacts drive both the positive and negative changes in multiple aspects of life in tourism-dependent communities (Kim, Uysal, and Sirgy 2013; Wall and Mathieson 2006). A review of the key literature has been conducted by the authors in each area of research. The tabulated results with full references to the surveyed literature are provided in Tables S1-1, S1-2, and S1-3 of Supplemental Appendix 1, describing the economic, social-cultural, and environmental impacts of tourism to local communities, correspondingly.
In brief, economic impacts include positive effects of employment opportunities (Ap and Crompton 1998; Liu, Sheldon, and Var 1987; Rasoolimanesh et al. 2017; Vargas-Sánchez, Plaza-Mejía, and Porras-Bueno 2009), increased standard of living (Andereck and Nyaupane 2011; Rasoolimanesh et al. 2017), new investment (Andereck et al. 2005), revitalized business activities, and overall economic growth (Choi and Sirakaya 2005; Huh and Vogt 2008). Negative effects in the economic sphere are increases in property taxes, goods and services costs, and land price (Oviedo-Garcia, Castellanos-Verdugo, and Martin-Ruiz 2008; Rasoolimanesh et al. 2017). Besides the economic impacts, “tourism is contributing to social changes in value systems, individual behavior, family structure and relationships, collective lifestyles, safety levels, moral conduct, creative expressions, traditional ceremonies and community organizations” (Fox 1977, 27). On a more “tangible” social level, tourism boosts the upgrade of recreational facilities and infrastructures, with an alongside rise in traffic congestion, crowdedness, crime, and other social problems (Almeida García, Balbuena Vázquez, and Cortés Macías 2015; Andereck et al. 2005; Brunt and Courtney 1999). The cultural impacts include positive effects of revitalized interest to local and global cultures (Andereck et al. 2005; Milman and Pizam 1988) and negative effects of disrupting influence on traditional cultures (Fredline, Deery, and Jago 2006; Marzuki 2011). Finally, environmental impacts are associated with positive effects on public awareness of environmental protection and the physical appearance of communities, while increased pollution, depleting natural resources, and pressures on wildlife are considered negative effects (Akis, Peristianis, and Warner 1996; Almeida-García et al. 2016; Fredline, Deery, and Jago 2006; Yen and Kerstetter 2008).
Indicators of Tourism Impacts: SIA Framework
While measuring the economic impacts is usually straightforward and relevant data are abundant, measuring the environmental and especially the socio-cultural impacts of tourism is more involved. According to Esteves, Franks, and Vanclay (2012), the field of the social impact assessments (SIA) was established in the 1970s in response to the US National Environmental Policy Act (NEPA), with considerable further scholarship (Esteves, Franks, and Vanclay 2012) contributing to the contemporary SIA framework (McCombes, Vanclay, and Evers 2015; Vanclay 2003; Vanclay et al. 2015). Importantly, SIA does not mandate a specific set of social well-being indicators, but rather it is a “processes of analyzing, monitoring and managing the intended and unintended social consequences, both positive and negative, of planned interventions and any social changes processes invoked by those interventions so as to bring about a more sustainable and equitable biophysical and human environment” (Vanclay 2003, 6). The process results in a set of indicators measuring the direct and indirect impacts on people’s way of life, culture, community, environment, health and wellbeing, personal and property rights, perceived safety, and others (Brent and Labuschagne 2006). For example, a US Environmental Protection Agency review (US EPA 2014) listed 50 such indicators. Between those, the following were utilized the most: general attitudes toward the researched issue; employment and income opportunities; employment and income equity for minority groups; perceptions of risks, health, and safety; concerns about traffic, noise, odors, scenery, and land misuse. Notably, the list also includes indicators of equity, inclusion, and diversity, as those are basic principles for development (Vanclay 2003, 2006). These indicators can be found through surveys or using secondary data as thoroughly described by Brent and Labuschagne (2006).
In tourism, SIA helps to objectively identify impacts of tourism industry on communities using various indicators of economy, society, and environment (Kim, Uysal, and Sirgy 2013) and is based on the measurements of tourism impacts on the community as well as the residents’ perceptions of tourism value as discussed in Sections 2.1 and 2.2. An exemplary case of SIA application was provided by McCombes, Vanclay, and Evers (2015) who utilized the SIA framework to measure an impact of a Bulgarian walking tour company on local villages. The authors found direct effects from generation of employment, fees to local attractions, and increased incomes to local businesses. They also identified multiple indirect effects such as greater appreciation of local culture, feelings about rapid cultural changes, increased number of young adults staying in community, litter, and trail erosion.
In the area of our study (Florida, USA), Crotts and Holland (1993) applied the SIA framework to investigate social impacts of tourism and hospitality industry on rural counties. The authors identified direct and indirect impacts using the following indicators: tourism and recreation sales tax; retail sales; income in manufacturing, agriculture, per capita, and per household; share of families living below poverty line; index of health, recreation and personal service; number of residents per physician; price index; index of housing costs; index of food costs; local government debt; forestry harvest; water use; water treatment discharges; and crime rate. We used this study and previous SIA applications in tourism to identify the list of top-down indicators of tourism industry impacts on Florida communities.
Influential Factors in Resident Perceptions of Tourism Development
Sharpley (2014) provided a thorough review of scholarship devoted to the factors, extrinsic, and intrinsic, that affect residents’ perceptions of tourism development, which we summarize below. The extrinsic factors refer to the stage and density of tourism development (Vargas-Sánchez, Plaza-Mejía, and Porras-Bueno 2009), type of tourist visiting the locale, and seasonality (Sheldon, Var, and Var 1984). The less economically developed a destination is, the more positively the opportunities presented by tourism are perceived (Lepp 2007). With the development of the tourism sector and increased density of tourists, positive attitudes toward tourism decline; however, the evidence is contradictory, as positive attitudes toward economic benefits may outweigh the concerns (Butler 1980; Lepp 2008; Sheldon and Abenoja 2001; Vargas-Sánchez, Plaza-Mejía, and Porras-Bueno 2009). In addition, the demographic background of tourists, such as nationality, may affect the locals’ perceptions (Johnson, Snepenger, and Akis 1994; Sheldon, Var, and Var 1984; Smith 1977).
The main intrinsic factors are personal proximity to the sector as well as temporal, spatial, and demographic aspects. Working in the tourism sector was found to improve attitudes toward tourism (Brougham and Butler 1981; Wang and Pfister 2008). The greater proximity to the tourism zone, the more negative are perceptions of tourism, which can be mitigated by economic dependency on tourism (Jurowski and Gursoy 2004; Sharma and Dyer 2009). Interaction with tourists is positively correlated with support for tourism, though this varies with the nature of contact and the type of tourist (Andereck et al. 2005; Teye, Sirakaya, and Sönmez 2002). The community attachment such as the length of residency has ambiguous and sometimes contradictory influence on perceptions of tourism (Andereck et al. 2005; Gursoy, Jurowski, and Uysal 2002; Sheldon, Var, and Var 1984; Woosnam 2012; Woosnam, Norman, and Ying 2009). Studies have also associated certain socio-demographic characteristics with positive/negative attitudes; however, most conclude that such variables do not explain variations in resident perceptions of tourism (Haralambopoulos and Pizam 1996; Huh and Vogt 2008; Tosun 2002).
Study Design
The overall design of the study is presented in Figure 1. To investigate the tourism value and impacts on tourism-dependent communities, the study combines two perspectives. One is the top-down measures of tourism performance as reflected in the tourism and accommodation industry economic, socio-cultural, and environmental indicators. The other is the bottom-up subjective perceptions of residents about the impact of tourism development on life in their communities.

Study design. STR, Inc (STR.com) is a provider of market data on hotels worldwide.
Study Areas
Florida is the largest tourism destination worldwide, receiving over 131 million domestic and international visitors in 2019 4 and adding over $89 billion to Florida economy (Visit Florida 2018). Tourism supports 12.7% of Florida employment, including almost one million direct jobs such as in the hotel, food, and entertainment sectors (Visit Florida 2018). In general, Florida’s tourism is considered a great success (Visit Florida 2018), and the overtourism issues are rarely discussed. Indeed, between Factiva’s 2,052 news articles that mentioned overtourism, we found only one publication that discussed overtourism problem from the perspective of Florida’s residents (Grimm 2011). The author writes that “disgustingly happy [tourists exacerbate] . . . the mundane day-to-day miseries endured by us [Fort Lauderdale locals].” Even then, this publication targets only the “unwanted subset of tourists” such as cruise visitors, while asking for “richer, more sophisticated, less-apt-to-vomit-in-the-street class of tourist.” Therefore, it was especially appropriate for the purpose of this study to see whether the method we propose can determine the early signs of overtourism in tourism-dependent Florida communities.
The study concentrated on four distinct, geographically diverse areas of tourism concentration (Figure 2): Miami, Orlando, St. Augustine, and Florida Panhandle. These areas depend on tourism to a large extent in their overall wellbeing and development while representing different types of tourism. Specifically, the following reasoning was used in making the selection:
Orlando: the top city for domestic tourists and the theme park tourism destination;
Miami: the top destination for international tourists and the beach and urban tourism destination;
St. Augustine: a medium-size community hosting a large number of domestic tourists; the oldest city in the continental US and the most significant historic destination in Florida;
Florida Panhandle: popular budget family-friendly beach destination which is recovering after a devastating impact of hurricane Michael in 2018.

Study area in Florida, USA.
Confirming this selection of tourism dependent communities, 33%–55% of survey participants responded that they were working in tourism industry at some point of their local residency.
Top-down Measures of Tourism Development
Following the SIA framework, the top-down measures of the value of tourism and accommodation industry for local communities included multiple measures of industry performance and its impacts on local communities, especially in terms of social responsibility and inclusion. The performance of local accommodation industry had three dimensions: quantity, attractiveness, and quality. The social inclusion was represented by indicators such as economic resources, employment, income, poverty, education, health, security and justice, equality (Atkinson and Marlier 2010), and broader societal wellness indicators such as crime rate, health, and well-being of the community (Colburn and Jepson 2012; Cunningham and Beneforti 2005). The data was extracted from the respective federal, state, or private sources and then aggregated at the county level (67 counties). In addition, hotel industry performance data (number of hotels and hotel rooms), was provided for the selected geographical areas by STR, Inc, a company tracking market data on hotels worldwide. The full list of employed indicators and their data sources is provided in Supplemental Appendix 1.
Most of the data is not normally distributed, with a few counties responsible for the majority of accommodation properties. To account for highly skewed indicator distributions, power transformation was applied to all indicators with exception of the percentage of female- and minority owned businesses. For the latter, only the counties with significant presence of tourism industry (defined as at least 200 hotels; N = 35) were selected. A list of tourism performance indicators (Table 1) created through the literature review as described in Section 2 was used to generate a geodatabase of economic and socio-cultural indicators characterizing Florida geographic regions and population. The same list was used to conduct a survey distributed to samples of local respondents in four study areas as described in the next section.
Tourism Performance Indicators.

Bottom-up Measures of Tourism Impacts: Survey
The questionnaire (Supplemental Appendix 2, based on Andereck et al. 2007) data were collected at a zip code level through Qualtrics Market Research Services (www.qualtrics.com/research-services/); the questionnaire was distributed to 1,688 participants over the period of June 15–July 10, 2020. After quality control, we excluded those respondents with very short completion time t (t < t- - 2σ), residing outside the area of interest, providing identical answers (straightlining), failing attention check, and completing lesser than 41% of the survey. The filtering left 1,236 surveys (73%), including 1,196 fully completed surveys. For representativeness control, the demographic profile of respondents was compared to respective US Census data and was found similar for gender, education, and income; however, there were moderate deviations in terms of ethnicity and age, limiting generalizability of results. A total of 61.9% of respondents resided in their current area for 10 years or longer. During their residence, 42% of respondents had worked in the tourism and hospitality industry, either holding a permanent position (13%), part-time jobs (19%), or various positions at various times (10%). The respondents’ profile is provided in Table S3-1 of Supplemental Appendix 3.
Fused Measures of Tourism Performance
Our approach to measuring tourism impact on community well-being is based on comparison of the top-down data representing the governments’ and industries’ perspectives and bottom-up data representing the local residents’ perspective. To compare both perspectives, we joined the top-down and bottom-up measures of tourism industry performance. For the top-down measures, we computed: (1) The accommodation industry performance, which combines the number of properties in a location with guests’ satisfaction; (2) Direct impact of tourism industry on community, which combines percentage of GDP coming from tourism industry, taxes, employment, and employment equality measures; and (3) Five indirect impact measures of economic health, racial and gender equality, safety, education, and health.
These indices were computed in the following way: first, the indicators (Table 3) were retrieved on county basis. Then, these indicators were transformed into the Z-scores. Then, indicators were averaged into measures. Finally, the measures were aggregated into the dimensions. For example, the accommodation industry performance dimension was found as following: the Z scores for the number of hotels and room inventory in the county were averaged into the quantity measure, the number of TripAdvisor comments—into popularity, and the review ratings—into the quality of tourism industry measures. Then, these three measures were averaged into the accommodation industry performance dimension for each county.
For the bottom-up indices, we computed: (1) The perceptions of the direct tourism impact on employment and economy computed as the mean of questions Q4 and Q5 (Supplemental Appendix 2) and (2) Perceptions of the direct tourism impact with same five measures as described in top-down measures: economic health (mean of questions Q9_1–9_8), racial and gender equality (Q11_6, 11_7), safety (Q10_1–10_3 and 10_9), education (Q11_5), and health (Q11_1 5 ). A seven-point [−3, 3] Likert-type scale was used to measure perceptions. Hence, the top-down measures estimate the conditions in study areas in relation to the rest of Florida, while the respective bottom-up measures estimate whether the residents perceive tourism impacts as positive or negative.
Results: Top-Down Indicators of Tourism Development
Industry Performance
The hotel and room inventory, the number of hotel reviews on TripAdvisor and the mean rating of online hotel reviews were used as proxies for tourism and accommodation industry performance. Note that the two of the study focus areas (Orlando and Miami) are the highest in terms of the number of rooms and reviews, while Panhandle is moderate-high and St. Augustine is moderate-low (Figure 3), demonstrating that the focus areas represent a variety of tourism dependent communities. All inventory and review number measures on industry performance are highly correlated (R = 0.95–0.99). We merged individual indicators into a single composite accommodation index.

Indicators of accommodation industry performance. For data sources see Table S1-4 in Supplemental Appendix 1.
Direct Measures of the Tourism Industry Impacts
The distribution of the direct measures of the tourism industry impact on local communities are illustrated by Figure 4. Notice that the tourism related sectors in the study focus areas provide 10%–20% of employment (employment rate plate) and up to 18% GDP (GDP rate plate). Similar to the tourism industry performance measures, the payment ratio, GDP rate, and employment rate are well correlated (R = 0.72–0.87). We merged individual indicators into a single composite direct impacts index.

Indicators of direct tourism impact. (A) Taxes. (B) Wages coming from tourism industry to total wages. (C) GDP coming from tourism industry to total GDP. (D) Employment in tourism industry to total employment. For data sources see Table S1-4 in Supplemental Appendix 1.
Indirect Measures of the Tourism Industry Impacts
The indirect measures of tourism industry impact include indicators related to social equality, income and wealth, safety, education, and health in local communities. Notably, many of these measures are well correlated with the performance of tourism and accommodation industry, demonstrating a larger effect of industry on community well-being beyond just tourism jobs and taxes (Table 2). Not surprisingly, tourism industry affects wealth of the hosting community such as income (R = 0.66) and house value (R = 0.80) and reduces unemployment (R = −0.41) and poverty (R = −0.61). Interestingly, it also moderately correlated with educational attainment (R = 0.40). Overall, the composite index of tourism industry performance is well correlated with the composite index of direct impacts (R = 0.70) and moderately correlated with the composite index of indirect impacts (R = 0.51). Spatial distribution of the indices is presented on Figure 5.
Correlation Between Indirect Impact of the Tourism Industry on Communities and the Composite Measures of Industry Performance and Direct Impact of Tourism Industry.
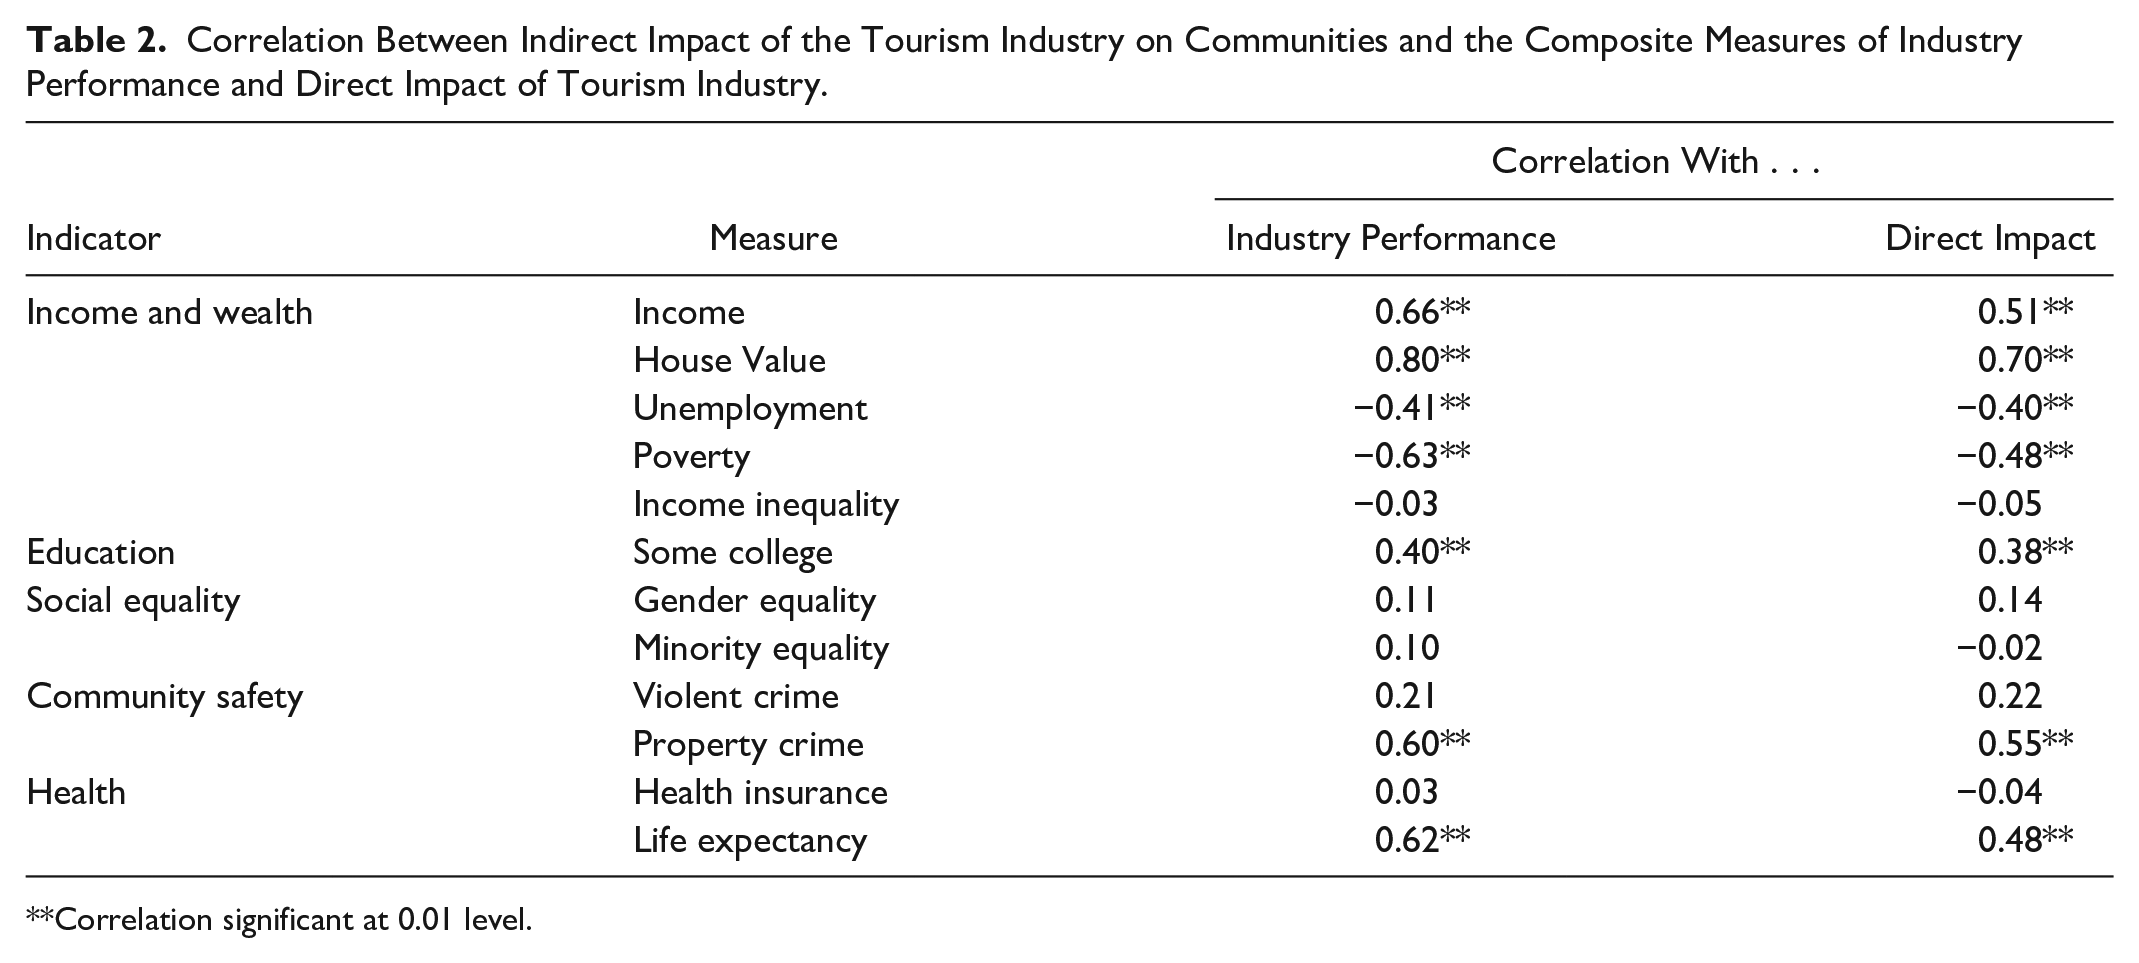
Correlation significant at 0.01 level.

Spatial distribution of composite indicators of tourism and accommodation industry performance (left), direct (center), and indirect (right) measures of community economic and social wellbeing.
Top-down Measures of Tourism Industry Impacts in Study Areas
Data shows that the tourist areas of Florida selected for our study are highly distinct from the rest of the state in all dimensions excluding the equality measures (Table 3). This includes not only the indicators of industry performance (almost one standard deviation [std] above the state mean) and direct tourism industry impacts such as tourism taxes per resident (0.6 std above the mean), but also many indirect measures of education, safety, health, etc.
Top-Down Measures of Tourism Industry Performance and Tourism Industry Impact on the Communities in Four Areas of Interest.

Note. The units are the number of standard deviations above or below state average. The positive values would correspond to desirable direction. See Supplemental Appendix 3 for separate study areas and data sources.
Results: Bottom-Up Measures of Tourism Impacts
General Attitudes Toward Tourism
Overall, 87.3% respondents perceived tourism as a benefit for their respective areas of residence. The majority (69.1%) perceived tourism as important or very important to the economy of their area. Similarly, 64% recognized importance of tourism for job creation (important and very important). Sixty-five percent considered the number of tourists in their area before the Covid-19 outbreak to be a good or very good thing (Table 4).
Residents’ General Attitudes Toward Tourism (%).

This perception of tourism, however, differs among the study areas as evident from the ANOVA test. That includes differences in perceptions of the importance of tourism for economy (F = 4.96, p = .02), job creation (F = 5.65, p = .01), and in perception of the pre-Covid tourism volume (F = 3.26, p = .21). Notably, we did not find differences in perceptions of tourism as benefit or a draw-back (F = 0.96, p = .41) and aspirations for the after-Covid tourism volume (F = 0.80, p = .50). Specifically, the residents of Miami area have the lowest perceptions of the importance of tourism for economy (statistically significant for comparison with Orlando [p = .004] and in Panhandle [p = .025] as estimated by Tukey’s HDS). Similarly, Miami residents have the lowest and the residents of Orlando have the highest perceptions of the importance of tourism for job creation. The differences between Orlando with Miami and Panhandle are statistically significant (p = .001 and .006, respectively). Finally, the residents of Miami are the most likely to say that the pre-Covid-19 numbers of tourists are bad. The difference in favorability of residents’ perception of the importance of tourism seem to be attributable to two factors: the dependence of employment on tourism and the gravity of Covid-19 impact on tourism in the area (Table 4, two bottom rows). The percentage of residents welcoming more tourism is however in inverse relation to their perception of the importance of tourism sector for their communities, which we interpret as the early signs of overtourism effect. In general, while the residents of all areas understand the importance of tourists, they do not want to see further growth and a significant percentage of residents want fewer tourists.
Between the various dimensions of tourism impact, economic benefits are overwhelmingly positive for locals (Figure 6A), especially in expanding opportunities for local ownership in sectors catering for tourists, better shopping, restaurants, and hotels, economy strength and diversification, and generation of tax revenue. The impacts on community safety and health are not so encouraging (Figure 6B and C), with an increase in traffic, crowding in public places, littering, and reduced air quality and green space. Notably, there is high variability between the areas, with Florida Panhandle area being subjected to more negative impacts including increased drug and alcohol abuse and crime. Local residents were also concerned with tourism impacts on risks to their health, possibly in connection with Covid-19 related risks. Notably, the highest health concerns were reported by residents of Panhandle and St. Augustine, who also reported high dissatisfaction with crowding in public places.
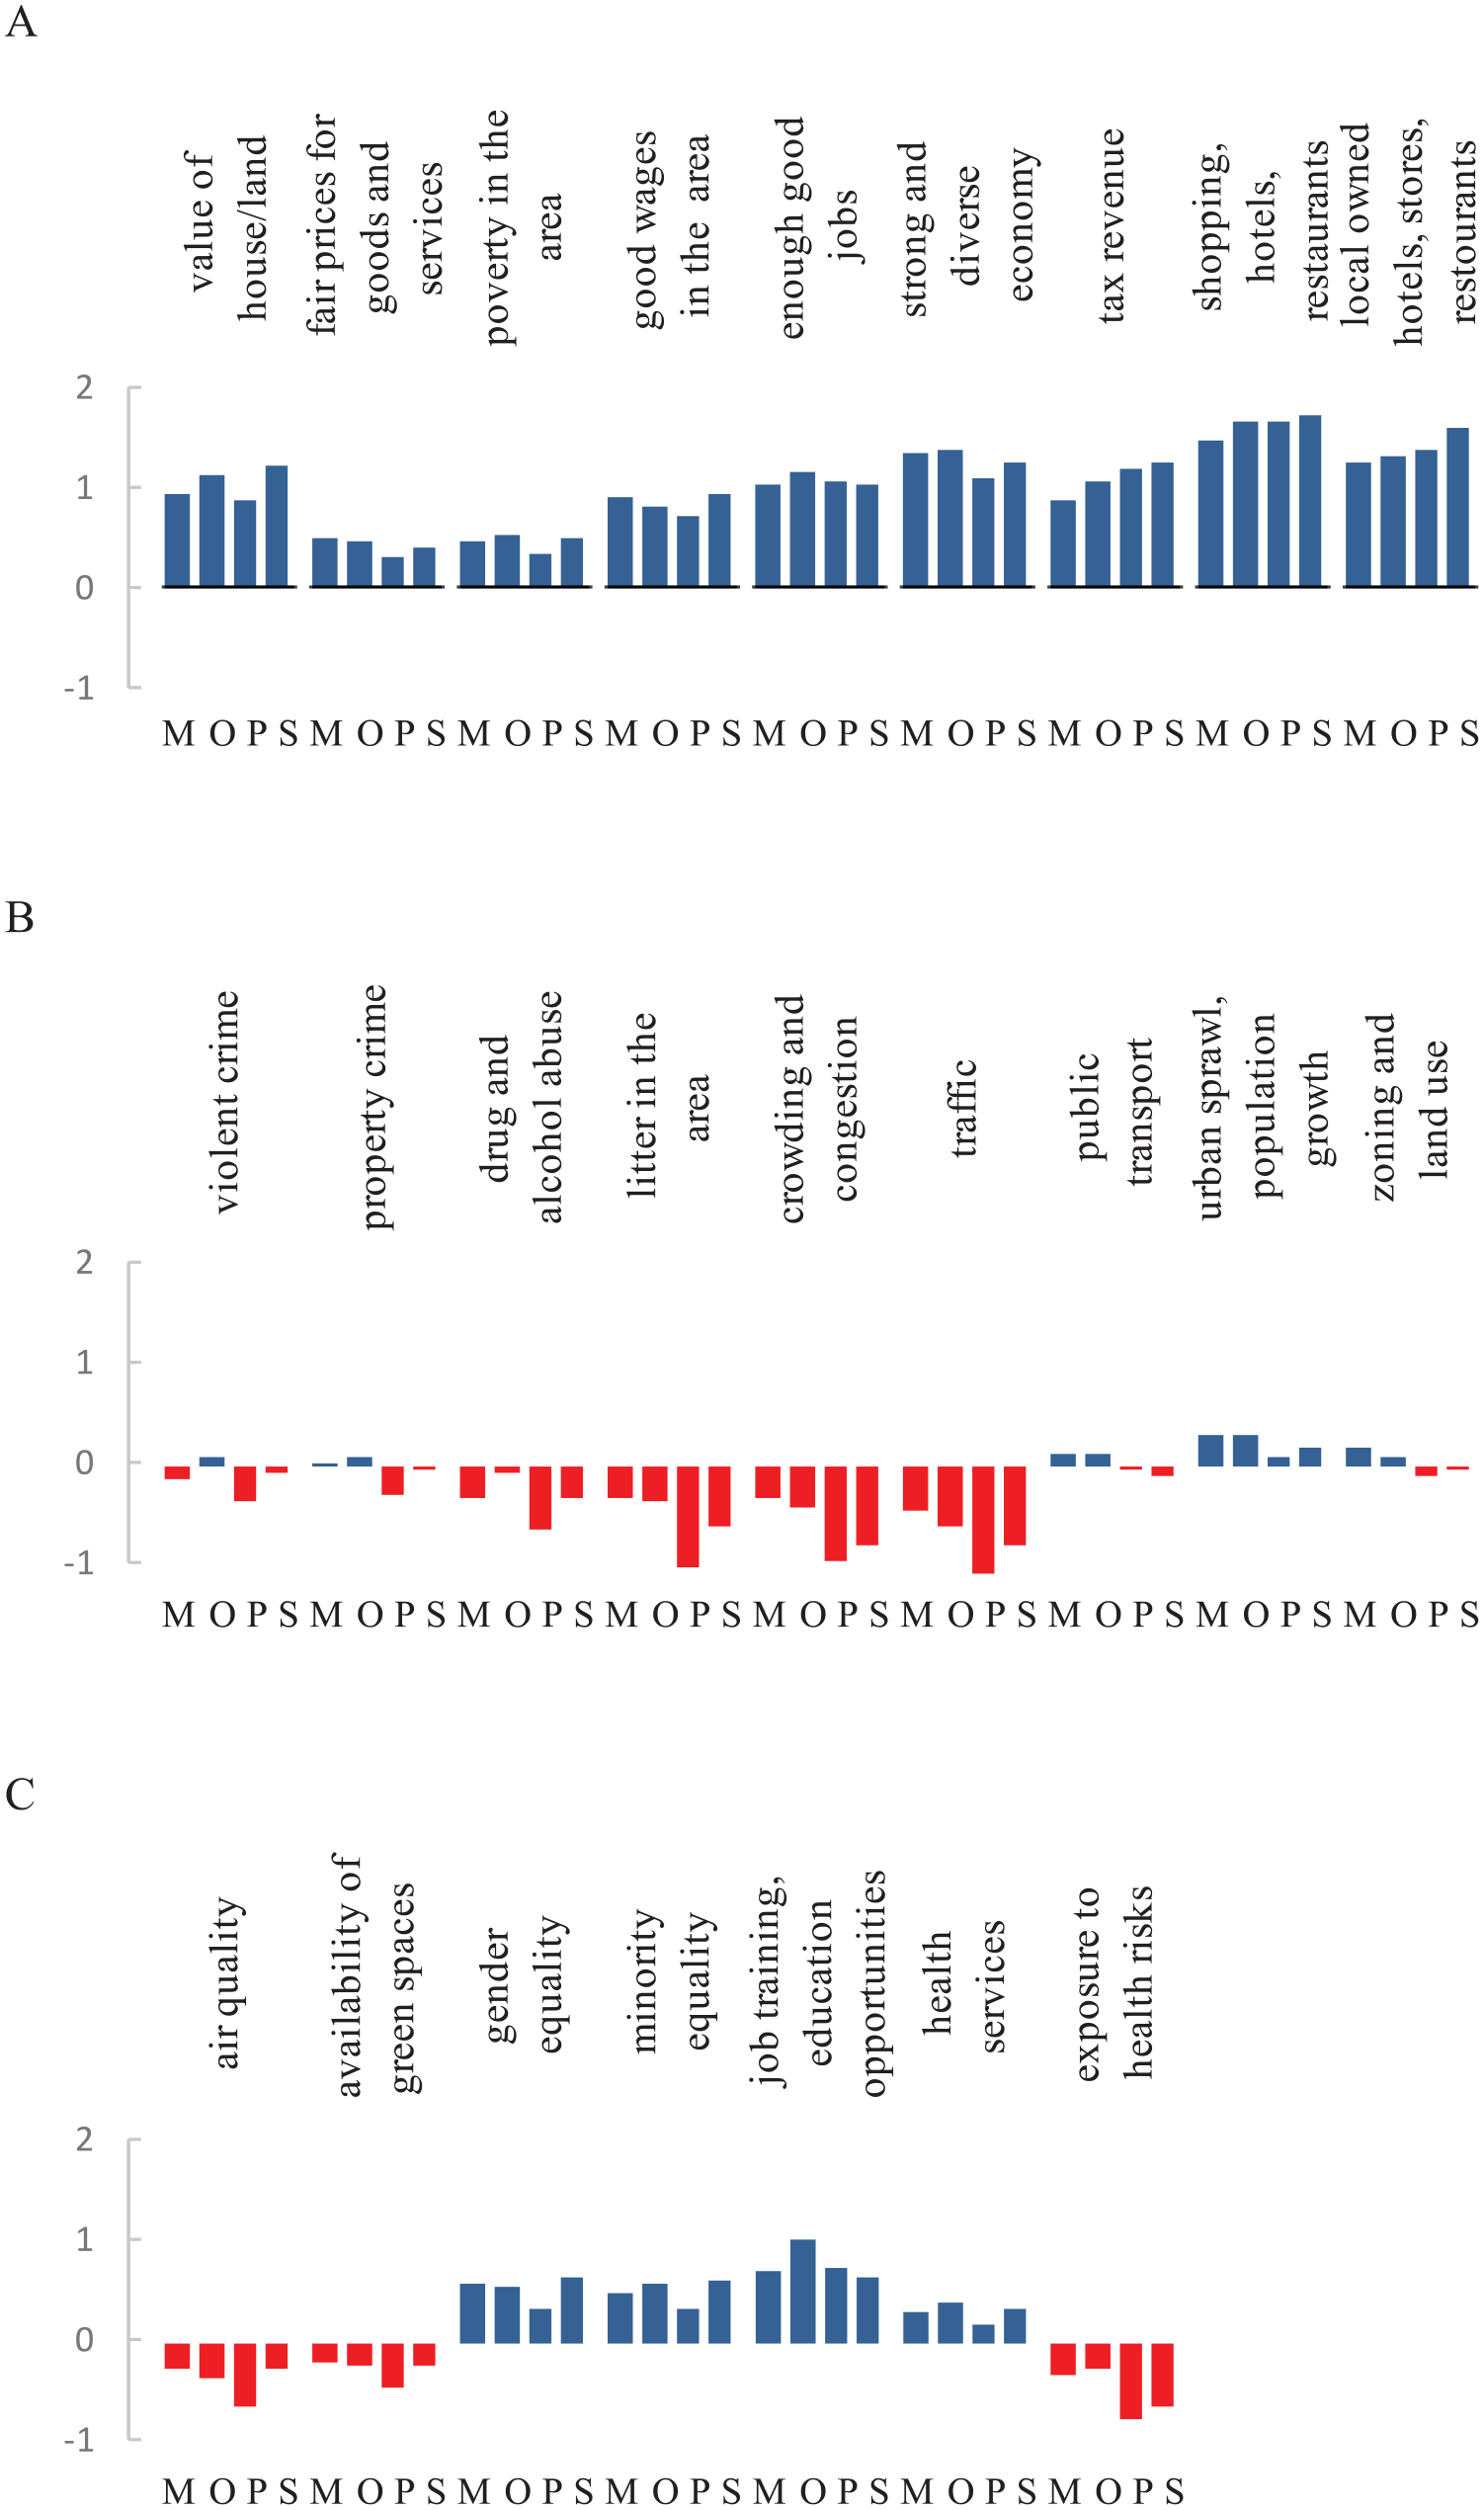
Comparison of perceived benefits/drawbacks from tourism development in Miami (M), Orlando (O), Panhandle (P), and St. Augustine (S) study areas on a scale from −3 (strongly negative) to +3 (strongly positive). (A) Economic benefits. (B) Safety, traffic and infrastructure impacts. (C) Environment, diversity, education and health impacts.
Overall, Florida Panhandle residents had by far the worst perceptions of direct and indirect benefits coming from tourism industry to their communities (Table 5). This is also the only area where the overall impression of tourism impact on the safety, traffic, and infrastructure dimension and the environment, diversity, education, and health dimension was negative. In terms of the economic benefits, the best perceptions were coming from St. Augustine residents; however, they were also the second worse in the safety, traffic, and infrastructure dimension and the environment, diversity, education, and health dimension, while Orlando was the best in those two dimensions. The differences between the regions in the two latter dimensions are statistically significant.
Ranking of the Study Areas in Three Dimensions of Tourism Benefits as Perceived by Residents.

Perceptions of Tourism Benefits by Demographic Groups
We found statistically significant differences between gender, age, income, and race groups in their perceptions of tourism benefits for their communities. In summary, the following groups have the lowest opinions of the impact of tourism industry in their areas: females, younger residents, and Black Floridians. The best perceptions were demonstrated by respondents who fall in the high-education and the high-income brackets, which is in agreement with general understanding of inequality in distribution of tourism benefits among the host population (Table S1-1 in Supplement Appendix 1). This section provides specifics of these differences; ANOVA test was used, with Tukey HSD for post-hoc comparisons.
The gender of respondents affects their perception of the economic benefits of tourism (F = 6.00, p = .014), the safety, traffic, and infrastructure dimension (F = 26.95, p < .001), and environment, diversity, education, and health dimension (F = 40.81, p < .001). Female Floridians tend to have slightly less positive perceptions of the economic benefits of tourism, have significantly worse perceptions on tourism impact on the safety, traffic, and infrastructure dimension, and have significantly less positive perceptions on tourism impact on the environment, diversity, education, and health dimension. The difference between genders is especially large in perceptions the negative impacts on traffic, overcrowding, air quality, health risk exposure, and green space availability.
The age of respondents affects their perception of the benefits of tourism including economic dimension (F = 10.70, p < .001), safety, traffic, and infrastructure dimension (F = 2.49, p = .030), and environment, diversity, education, and health dimension (F = 2.62, p = .023). Young Floridians, especially those younger than 25 years old tend to have the worst perceptions of tourism benefits for their communities including fair prices, poverty, job creation, wages, strong economy, as well as minority and gender equality. They also tend to perceive more negative impacts on public transportation, urban sprawl, population growth, land use, air quality, and green space availability.
The education of respondents affects their perception of the economic dimension of tourism benefits (F = 8.90, p < .001): the higher educated Floridians are more appreciative of the economic benefits of tourism. We did not find evidence of education influencing perceptions of other dimensions of tourism impacts on communities.
The income of respondents affects their perception of the economic dimension of tourism benefits (F = 4.94, p < .001): the higher earning Floridians are more appreciative of the economic benefits of tourism. They are also more appreciative of the environment, diversity, education, and health dimensions (p = .001). We did not find evidence of income influencing perceptions of the safety, traffic, and infrastructure dimension.
The race of respondents affects their perception of the economic benefits of tourism (F = 6.64, p < .001) and the safety, traffic, and infrastructure (F = 4.24, p = .005). Black Floridians tend to have less positive perceptions of the economic benefits of tourism compared with White Floridians (p = .003), while the perceptions of Latino Floridians are only slightly less positive than those of Whites. White Floridians also report a significant negative impact of tourism on the safety, traffic, and infrastructure dimension (p < .001), which was not observed in Black and Latino population. Finally, White (p = .005) and Latino (p = .001) Floridians perceive positive impacts of tourism on the environment, diversity, education and health dimension; in Black population this effect is only marginally significant (p = .071).
Fusion of the Top-Down and Bottom-Up Perspectives on Tourism
Notably, the composite top-down index of the direct tourism impact on local communities is positive for all tourism related communities we studied (Table S1-4 in Supplemental Appendix 1), with the mean score Z = 0.82. The direct impact of tourism is especially large for Orlando area (Z = 1.3 corresponding to the 90th percentile of all Florida counties). The respective measures show that residents are well aware of the significance of tourism industry with 65% (in Miami) to 75% (in Orlando) of survey respondents believing that tourism is important or very important for their community (Table 4).
The pattern of indirect impacts of tourism is more intricate (Table 5). Overall, the bottom-up and top-down measures are well correlated (partial correlation 0.74 controlling for the direct industry impact). The tourism dependent areas are well above the state average in terms of the economic health such as employment, people living in poverty, or income, and residents of those areas are overwhelmingly connecting those advantages with tourism industry (“Economic health” lines of Table 6). Similarly, residents’ perception of positive tourism impact on health risks are well in agreement with the top-down measures. The perceptions of equality, safety, and education opportunities, however, deviate between the top-down and bottom-up data.
Comparison of Top-Down and Bottom-Up Measures of Indirect Impact of Tourism on Four Florida Communities.

Note. Top-down measures are Z-values; a value of 1 means that the respective area is better than 84% of all Florida counties. Bottom-up measures are 7-point Likert scale [−3, +3].
For example, St. Augustine residents’ perception on tourism impact on safety in their area is strongly negative, while the top-down data shows low level of crime relatively to the state average. This mismatch is mostly due to residents perceiving tourism leading to drug, alcohol abuse, and litter in the area. In reverse, St. Augustine residents perceive a strong positive impact of tourism on gender and racial equality in the area, while objectively their area is trailing the rest of the state in those dimensions.
Notably, those perceptions have strong association with the race of respondents (Figure 7). Black respondents in large cities tend to have much worse perceptions of tourism impact on their communities in all dimensions, while perceptions of other races were similar. Overall, we found that the residents’ awareness of the value of tourism for their areas is well in agreement with the top-down index of tourism impact for direct, but not for the indirect impacts.

Comparison of the bottom-up measures of indirect tourism impact in four areas of study.* The top-down measure is shown for qualitative comparison.
Discussion
Top-down measures based on objective data from governments, industry, and social media demonstrate that tourism brings many benefits to tourism-dependent Florida communities. In turn, survey respondents in the study areas overwhelmingly support tourism industry, at least at the first glance, especially for its importance for economy and employment. Tourist destination residents are also positive about the indirect benefits that tourism brings. Even the critical of the overtourism impact Grimm (2011) notes that his hometown “Fort Lauderdale enjoys a number of very nice shops, bars and restaurants . . . that a town of 183,000 could hardly support without millions of visitors.” In unison with this sentiment, the most positively assessed item in our survey is availability of retail shops, hotels, and restaurants. This general perception of the positive sides of tourism impact on local communities is in agreement with the literature summarized in Table S1-1 in Supplemental Appendix 1, in addition, we did not detect major discontent with economic impacts considered as negative in literature (Table S1-1 in Supplemental Appendix 1) such as higher living costs and property value.
The respondents demonstrate high level of support to the notion that tourism is beneficial not only for the economic health of their communities (60%), but also for education (54%), health services (37%), and even equality in business ownership (41%). These results agree with the top-down objective data indicating that the areas with significant tourism development perform better than average in economic health (Z = 0.63), education (Z =0.81), and health (Z = 0.46). Other non-economic tourism impacts such as environmental costs, traffic increase, and crime, are assessed negatively, which concurs with earlier research (Tables S1-2 and S1-3 in Supplemental Appendix 1). Adding to the literature, we found higher discontent with those issues in female respondents.
The analysis, however, also reveals that despite recognition of the value of tourism industry, one third of respondents would like to decrease the number of tourists in their communities. Even among those who recognize tourism as beneficial, 29% would like to see fewer tourists. We suggest that the disconnect between the recognition of the role of tourism for communities, supported by the statistics and industry data, and the appeal to reduce the number of tourists indicates hidden discontent with tourist numbers and signals overtourism in local populations. Indeed, a considerable percentage of population is unhappy with the drawbacks of tourism, such as: litter, increased traffic, and crime, among other issues (Figure 6B). The top-down data supports these perceptions, for example, showing a sharp increase in property crimes in the tourism areas. Thus, while in general the positive impacts prevail and are recognized by the population—which signals that Florida is indeed successful in developing its tourism sector—the data also reveals emerging issues that need attention from planners and tourism industry.
Most importantly, the discontent with tourism differs between the demographic groups, with younger Floridians being the least supportive of the tourism industry: 41% of those younger than 35 years old want less tourism versus 29% among those 45–64 years old and only 16% in the 65+ group. Interestingly, the high negative perception of tourism that the youngest age group demonstrates from the hosts’ perception seemingly contradicts this group’s indifference toward problems that tourism brings to local communities from the guests’ perception (Szromek, Hysa, and Karasek 2019). The difference between age groups is the most prominent in the appreciation of tourism impact on the economic health of the community, with young Floridians giving the lowest scores to all relevant factors. For example, only 23% of those younger than 35 years old believe that tourism reduces poverty, as compared 50% of those who are 55 years old and older.
Similarly, appreciation of tourism differs between the racial groups, especially in the economic impact. The White and Latino groups have rated the impacts of tourism industry higher than the Black Floridians in all dimensions except for the fair prices for goods and services. Notably, Black respondents also rated the gender and equality in business ownership the lowest, while White and Latino respondents provided similar assessment. In contrast, dimensions related to crowdedness (litter, congestion, traffic, public transportation) were rated the lowest by the White respondents.
Finally, perceptions of tourism industry impacts differ profoundly between genders: the female Floridians rate tourism impact on their communities lower than males in all categories and dimensions. While the gap in opinions regarding the impact of tourism on economic health is small (65% of males vs. 58% of females estimate it is as positive), it is larger when considering safety, litter, crowding, transportation, gender, and racial equality, and other indirect impacts with a typical difference of 12%–15%. We observed this gender gap across all races.
For better understanding of these findings, the authors arranged ten 30-minutes phone interviews with senior level tourism professionals (DMO head, top management of a theme park, and similar positions). Respondents were asked to interpret the key finding of the study. To accounts for the highly positive, in general, attitudes toward tourism in Florida, respondents elaborated on (1) the size of Florida, which allows a degree of separation between resident housing and attraction points; (2) tax benefits of tourism; (3) an appreciation of the attractions, especially Disney and Universal Studios; and (4) the unique diversity of both small and large attractions. In other words, Florida may be more strongly associated with tourism than many previously studied destinations, thus increasing its acceptability among residents.
Regarding lower appreciation of tourism value among young Floridians, respondents suggested that the benefits of state income tax exemption is less salient for younger adults due to a generally smaller income. In addition, younger adults may be less inclined to see the benefits of tourism to the community at large. With this problem in mind, one respondent suggested that tourism promotion campaigns should use non-traditional, visually based media like Instagram and Snapchat specifically targeting younger demographics.
Regarding poorer views on tourism among racial minorities, interviewees noted that tourism marketing in Florida has done a poor job representing communities of color in their advertising for tourism, thus decreasing its perceived value. One respondent noted that their region had formed a multicultural committee to address issues related to tourism and race, thus suggesting growing recognition of the problem among tourism professionals. The interviewees also provided numerous action points, especially in relation to emerging signs of overtourism, such as: that overtourism is a real problem, but that the tourism industry is working toward solutions; that an education campaign should emphasize the impact of Covid-19 on tourism revenue in Florida; that lesser known tourism attractions related to tourism in Florida should be publicized more; and that campaigns to communicate the benefits of tourism should use relatable terms for the target population (e.g., that taxes collected via tourism offset the price of housing). Collectively, these insights offer guidance for the educational campaign, particularly for groups who feel less positively toward tourism.
Conclusion
To address the pertinent issue of detecting early signs of overtourism in tourism-dependent communities, we enhanced a well-established, theory-based SIA framework with the data fusion method. The emphasis of our finding, however, is not on the SIA framework, but rather on using this framework for detection of the early signs of discontent from tourism development. As demonstrated, our methodology incorporates both geographic and demographic aspects of the overtourism issue. We envision this approach helping industry and urban planning professionals in identification of potential problems in tourism development in their areas, which can become pressing if not addressed early, and in laying the data-supported groundwork for the practical solutions. The application of the approach to four tourism-dependent Florida’s communities suggests that there exists an emerging discontent with overtourism, while typical signs of overtourism such as distraction of natural ecosystems, growing amount of waste, escape of locals, and increasing public antagonism are still shaded by a general recognition of the economic benefits of tourism industry. What is especially troubling, this discontent is the highest in the youngest population group. The differences between the age groups, genders, and races in their perceptions of tourism benefits may be amplifying their dissatisfaction. It seems that the Krippendorf’s (2010, 107) “rebellious locals” pressuring for overhaul of tourism are more common than we are used to believe.
Supplemental Material
sj-docx-2-jtr-10.1177_00472875211064635 – Supplemental material for Detecting Early Signs of Overtourism: Bringing Together Indicators of Tourism Development With Data Fusion
Supplemental material, sj-docx-2-jtr-10.1177_00472875211064635 for Detecting Early Signs of Overtourism: Bringing Together Indicators of Tourism Development With Data Fusion by Andrei P. Kirilenko, Shihan (David) Ma, Svetlana O. Stepchenkova, Lijuan Su and T. Franklin Waddell in Journal of Travel Research
Supplemental Material
sj-pdf-1-jtr-10.1177_00472875211064635 – Supplemental material for Detecting Early Signs of Overtourism: Bringing Together Indicators of Tourism Development With Data Fusion
Supplemental material, sj-pdf-1-jtr-10.1177_00472875211064635 for Detecting Early Signs of Overtourism: Bringing Together Indicators of Tourism Development With Data Fusion by Andrei P. Kirilenko, Shihan (David) Ma, Svetlana O. Stepchenkova, Lijuan Su and T. Franklin Waddell in Journal of Travel Research
Supplemental Material
sj-pdf-3-jtr-10.1177_00472875211064635 – Supplemental material for Detecting Early Signs of Overtourism: Bringing Together Indicators of Tourism Development With Data Fusion
Supplemental material, sj-pdf-3-jtr-10.1177_00472875211064635 for Detecting Early Signs of Overtourism: Bringing Together Indicators of Tourism Development With Data Fusion by Andrei P. Kirilenko, Shihan (David) Ma, Svetlana O. Stepchenkova, Lijuan Su and T. Franklin Waddell in Journal of Travel Research
Footnotes
Acknowledgements
The authors are thankful to STR, Inc. for providing data on hotel industry performance.
Declaration of Conflicting Interests
The author(s) declared no potential conflicts of interest with respect to the research, authorship, and/or publication of this article.
Funding
The author(s) disclosed receipt of the following financial support for the research, authorship, and/or publication of this article: This research was supported by Eric Friedheim Tourism Institute.

Supplemental Material
Supplemental material for this article is available online.
Notes
Author Biographies
References
Supplementary Material
Please find the following supplemental material available below.
For Open Access articles published under a Creative Commons License, all supplemental material carries the same license as the article it is associated with.
For non-Open Access articles published, all supplemental material carries a non-exclusive license, and permission requests for re-use of supplemental material or any part of supplemental material shall be sent directly to the copyright owner as specified in the copyright notice associated with the article.
