
Abstract
This study identified the spatial and temporal patterns of national park visitors by combining global positioning system (GPS) technologies and surveys using the sequence alignment method (SAM) based on the concept of space–time path of time geography. Data were collected from a sample of 344 GPS tracks and questionnaires obtained from Gyeryongsan National Park in South Korea. A complex random stratified sampling method was employed to represent a national sample based on mobile positioning data. The result of the SAM analysis revealed that the derived visitor typologies constituted three groups from 83 unique paths extracted from 341 sequences. Significant intergroup differences were found for the paths based on average travel distance, average visit duration, and average travel speed. The main theoretical contribution of this study is in expanding the application of the theory by providing methodological improvements using SAM and GPS analysis of the theoretical basis of time geography.
Keywords
Introduction
Globally protected areas, such as national parks, have received an estimated 8 billion annual visitors and generated over US$ 6 billion in direct in-country expenditures (Balmford et al. 2015). The comprehension of visitation patterns is essential to sustainable tourism management due to the increase in demand for protected areas and the continuous influx of visitors; it not only predicts tourism impact under high tourism pressure but also identifies the logic that underpins destination management planning (Ramkissoon, Weiler, and Smith 2012). Exploring park visitors’ movements enables the discovery of ways to redirect, concentrate, or disperse the visitors to reduce their impact on natural resources. Yet, limited research has been conducted on the movements of visitors in parks due to lack of system-wide, consistency in data collection, and dispersed visitor access (Monz et al. 2019). Accordingly, information on the accurate locations and use levels of visitors cannot be determined despite what this information could offer in terms of early warning gauges for crowding, impact on park resources, inadequate facilities at natural sites, trampling and erosion on vegetation and soil, improper disposal of human waste, risks to human health, and visitor experience issues (D’Antonio et al. 2010).
The core geography concept of the space–time path serves as an important visualization and quantification tool to reveal visitors’ spatial and temporal patterns (Huang et al. 2020). Achieving a deeper understanding of spatial and temporal patterns of national park visitors through research and analysis is necessary to improve efficient resource allocation and enhance competitiveness for destinations (Risteskia, Kocevskia, and Arnaudov 2012). The geology, physiography, flora and fauna, and esthetic of national parks are essential components of the visitor experience (Arrowsmith and Chhetri 2003). Therefore, nature influences movements in relation to tourist activities, and data regarding spatial and temporal visitor behaviors should be used to further protect natural areas.
While exploring the spatial and temporal elements of visitor behaviors and use levels is not a novel concept, past research has conventionally employed methods such as automatic visitor counters, observations, and surveys. These methods are limited and tend to provide only descriptions based on small sample sizes in limited contexts (D’Antonio et al. 2010). Further limitations of existing approaches are related to logistical considerations and the accuracy or validity of the procedures used (D’Antonio et al. 2010). Although current global positioning system (GPS) tracking technologies can generate accurate time and location data, a lack of research exists concerning its use for deriving sequential aspects within spatial and temporal patterns and a typology of visitors (Shoval et al. 2015). The ability to aggregate spatial and temporal patterns and develop generalized typologies of visitors pursuing various activities while considering visitors’ sequential movements is one of the difficulties in spatial and temporal analysis.
An approach to overcome this challenge is to make use of the sequence alignment method (SAM), which contrasts with traditional quantitative methods, as it develops generalized typologies by combining various activities within a particular order of events. This approach is considered ideal for tourism research because it involves the sequential movements of visitors through spatial and temporal path (Choi 2014; Shoval et al. 2015). Prior research applied SAM by designating the elements (places) constituting the path as points, and arranging each point (Lee and Joh 2010; Shoval et al. 2015), which can result in difficulty in interpreting the exact path as there may be several cases of paths between points. Because information may be lost in this way, past studies may not contain all of the path information, which makes it difficult to interpret a valid representative path (Mavoa et al. 2011; Shoval et al. 2015). To overcome such limitations, the current work presents a unique method of coding, analyzing, and interpreting data for a new target object: coding the travel route considering all intermediate points, that is, using all nodes, and examining the similarities between the paths by the array of the coded travel route (as explained in detail in the Data Analysis section). Thus, this study attempts to reveal the spatial and temporal patterns of national park visitors by providing methodological improvements using SAM, of which the theoretical basis is space-time geography. SAM analysis is useful for park managers to discover how visitors are using resources, how efficient resource allocations are prioritizing destination attributes, and how current problems in park management impact resource and social conditions (D’Antonio et al. 2013). The findings of this research offer significant implications for managers and policymakers in developing destination competitiveness, improving management strategic decisions, and identifying priorities for efficient resource allocations to extend the knowledge base regarding the values, activities, and management preferences of visitors.
Literature Review
Spatial and Temporal Patterns of Visitors
Time geography is a theory developed by Hägerstrand (1970), emphasizing individual space–time paths. It presents a conceptual framework to understand the spatial and temporal domains of individual activity patterns (Hägerstrand 1970) and enhances the ability of researchers to visualize and analyze location-based datasets. Space–time is the fundamental concept of time geography, and tourism literature is replete with attempts to comprehend the spatial and temporal behavior of individuals across a variety of settings.
A significant disadvantage of traditional approaches is that they require respondents to recall their visits; insufficient recall may yield respondent bias and inaccuracy (Pettersson and Zillinger 2011). This limitation can be addressed by using GPS devices, which can track the spatial and temporal patterns of visitors with more accurate, detailed, and reliable data (Hallo et al. 2005). A further advantage is that research using GPS methods requires shorter data collection times for the visitors and less training of staff (Hallo et al. 2005). A popular method used to track spatial and temporal patterns of visitors is a GPS logger, as it enables precise and continuous analysis of movement and records time and location information, such as latitude and longitude. GPS loggers provide more data than traditional methods, such as the real speed of a visitor’s movement, location, stop durations, and off-trail behavior (Wolf, Hagenloh, and Croft 2012).
Such GPS technologies have been used to determine the total number of park visitors as well as the origin and arrival place of a visitor in a particular park at a moment in time. Beyond parks, progress in GPS technologies has benefited research on the spatial and temporal patterns of visitors to small attractions (Huang et al. 2020), events (Abkarian et al. 2022), cruise ships (Shoval et al. 2020), and large urban areas such as Rome (Calabrese and Ratti 2006), Lisbon (Caldeira and Kastenholz 2015), and Hong Kong (McKercher et al. 2012).
Most research on the spatial and temporal patterns of visitors to protected areas using GPSs has been conducted in the Western context. Beeco, Hallo, and Brownlee (2014) used GPS tracking methods to reveal the spatial and temporal patterns of visitors and hot spots for visitors in a forest at Clemson University. In addition, studies were conducted with a GPS-based tracking method to understand the spatial and temporal patterns of visitors in three national parks (D’Antonio et al. 2010), and Sumter National Forest, and Cascade Mountains, all in the United States (Hallo et al. 2012), exploiting the reduction in data collection time gained by collecting high-resolution data via GPS loggers. In recent research, Abkarian et al. (2022) used GPS data tracking event participants at the AirVenture event to identify the spatial-temporal activity patterns. A machine learning algorithm was used to classify participants into groups based on their activity sequences. In the east, Zheng, Huang, and Li (2017) developed a multi-step heuristic to predict the subsequent visit location for a tourist based on movement history data taken by GPS at the Summer Palace in Beijing, China.
Recently, the integration between GPS tracking data and survey data has allowed researchers to gain insights into the spatial and temporal patterns of visitors and visitor experiences in use-related contexts, such as both internal and external factors influencing their spatial and temporal patterns (Caldeira and Kastenholz 2018). Specifically, studies suggest that the spatial and temporal patterns of visitors are determined by their characteristics, such as available time, motivations, and interests, and other informal factors, such as knowledge of the destination and destination features (Caldeira and Kastenholz 2015).
Despite the increasing accuracy of GPS, there are behavioral barriers that can prevent individuals remembering the unit use, technical barriers in that GPS data do not have complete spatial accuracy (5–10 m in a location), and analytical barriers related to differences for concordance by analyzing complex data (Paz-Soldan et al. 2014). According to Shoval and Isaacson (2007), one of the limitations of existing space-time analyses is that they fail to aggregate spatial and temporal patterns to develop generalized typologies by combining various activities within a particular order of events. An attempt has not so far been made to study the aspects of the quantitative research methodology to resolve the issue of the sequential order of the data (Golob and McNally 1997; Schlich and Axhausen 2003). Comprehending the sequence of events in space and time enables researchers to identify an integral part of tourist behavior and reveal various patterns therein (Shoval et al. 2015). For this research, in which we needed to identify movement patterns from the sequence of activities in space and time, SAM was selected for analysis technique because this approach is considered ideal for research on tourism as it involves the sequential movements of visitors through a spatial and temporal path (Choi 2014; Shoval et al. 2015).
Overview of the Sequence Alignment Method
SAM was originally used in genetic algorisms to arrange nucleotide sequences (DNAs or RNAs) or amino acid sequences (proteins) to determine the similarities between different sequences (McClure et al. 1988). It was first used in social sciences as a way of tracing musicians’ career trajectories by deriving algorithm sequences from socio-economic data (Abbott 1995). SAM is well suited for daily life pattern analysis (Shoval and Isaacson 2007) and for determining more structural, distant relationships between elements (Joh et al. 2002). Within a variety of research on human activity–travel behavior, SAM has been applied to collect activity–travel data, survey data, and location data (Delafontaine et al. 2012).
SAM is one of the more promising methods to analyze sequential aspects within the spatial and temporal patterns of human activities (Shoval and Isaacson 2007). SAM was first introduced to tourism by Wilson (1998), who coded travel events and activities as a sequence (or trajectory) using SAM on activity pattern clustering. Wilson (2001, 2006) used SAM to identify the activity patterns of Canadian women from diary data and further examined the reliability of alignments to classify sequential data in time-use research. Wilson (2008) expanded the activity sequence by adding geographical attributes to visualize the representative patterns as a Hägerstrand trajectory. Moreover, Shoval and Isaacson (2007) created typologies of tourists on the basis of spatial and temporal activity sequences, identifying 3-D spatial and temporal time geographies of the visitors. Recently, Ji et al. (2021) examined the elements of both the mundane and the extraordinary in theme park visitors’ experience using SAM. The methodology revealed three behavior patterns with intensified use of hospitality facilities, attractions, and a combination of both. Also, Xie et al. (2022) applied SAM to identify representative trajectory clusters of land-use conditions and change in rural town settlements from 1980 to 2015 in Guangdong by similarity of land-use changes among the sequences. The results of this study found 10 groups of land-use sequences of rural town settlements with varying trajectories.
The principle of SAM is to divide two arrays into a target array and a source array and then measure the similarities between the two arrays by comparing activity sequences and scoring the complexity of the processes necessary to make the two arrays identical and thereby identifying activity patterns (Joh et al. 2002). The advantage of SAM is that it accurately calculates the similarities of arrays regardless of their lengths or the type of individual values constituting the arrays (Choi 2014). To identify groups with similar paths, SAM can extract the sequence patterns of activities for each group through arranging and clustering individuals’ paths based on the similarities of each path.
The sequence identifies the order of attractions visited by an individual and provides in-depth data regarding how the landscape is navigated sequentially. Although SAM requires categorization and can result in a loss of information and computational costs in distance measurements, it is shown to be superior to other alternatives in pattern recognition (Joh et al. 2002). For instance, researchers using other alternatives in pattern recognition (i.e., time-series analyses, associate distance measure methods, high-frequency pattern methods) group similar objects based on the features they have in common, focusing on the similar patterns of nodes, while SAM classifies groups on the basis of the sequence of events within the object (Shao and Gretzel 2010; Shoval and Isaacson 2007). Thus, a powerful advantage of SAM has been represented in research on tourism for the processing and identification of sequential patterns. Of these various tools, SAM has been used commonly to determine how visitors move across varying locations (Vu et al. 2018).
A method that has recently attracted much attention from researchers is trajectory clustering, which classifies clusters of the same geometry to identify the movement patterns of nodes, focusing on an individual’s geometric spatial trajectory properties (Tang et al. 2021). Most of the current trajectory clustering techniques concentrated some spatial features of trajectories, whereas spatial and temporal features are ignored, which allowed some fundamental information about the movement patterns of nodes to be lost in the trajectory clustering results (Tang et al. 2021). Thus, in the context of tourism activity sequences studied in this work, SAM is well suited to identify similarities of the space-time trajectory pattern where the sequence patterns of links are important rather than similar patterns of nodes (Shoval and Isaacson 2007; Wilson 1998), even if they are spatially separated. Wilson (1998) draws the analogy of finding hidden patterns in data by means of an alignment process to revealing typologies of tourist behavior by means of SAM, yielding comprehensive sketches of tourists’ activities (Kawase and Ito 2016), similar transportation modes (Crawford, Watling, and Connors 2018), movement habits (Millward, Hafezi, and Daisy 2019), and social change (Delmelle 2016).
A sequence analysis can provide two types of analyses (Shoval and Isaacson 2007). The most common analysis constructs groups on the basis of similar sequences and/or representative sequences that generate “trees,” which separate the sequences taxonomically. The second analysis, which is less likely to be used, detects patterns of behavior in the studied sequences. The former use of SAM will be considered in this study.
Figure 1 illustrates a SAM example. In the figure, there is a target array of A–B–C and a source array of A–D–B. The target array has time series values of A in 1990, B in 2000, and C in 2010, and the source array has time series values of A in 1990, D in 2000, and B in 2010. The values matching the target and source arrays are identical and can be calculated, which will be used for quantitative similarity values. To make the source array A–D–B identical to the target array A–B–C, D is deleted from the source array (cost 1 is consumed) and C is added (cost 1 is consumed), resulting in a coincidence cost of 2. The larger the calculated value, the more different the arrangements, while the smaller the value, the more similar the arrangements. Operations include deletion, insertion, and substitution (Shoval and Isaacson 2007). In the present study, the paths of the individuals are arranged, and similarities between paths can be calculated using SAM. Similar paths are then grouped for data analysis.
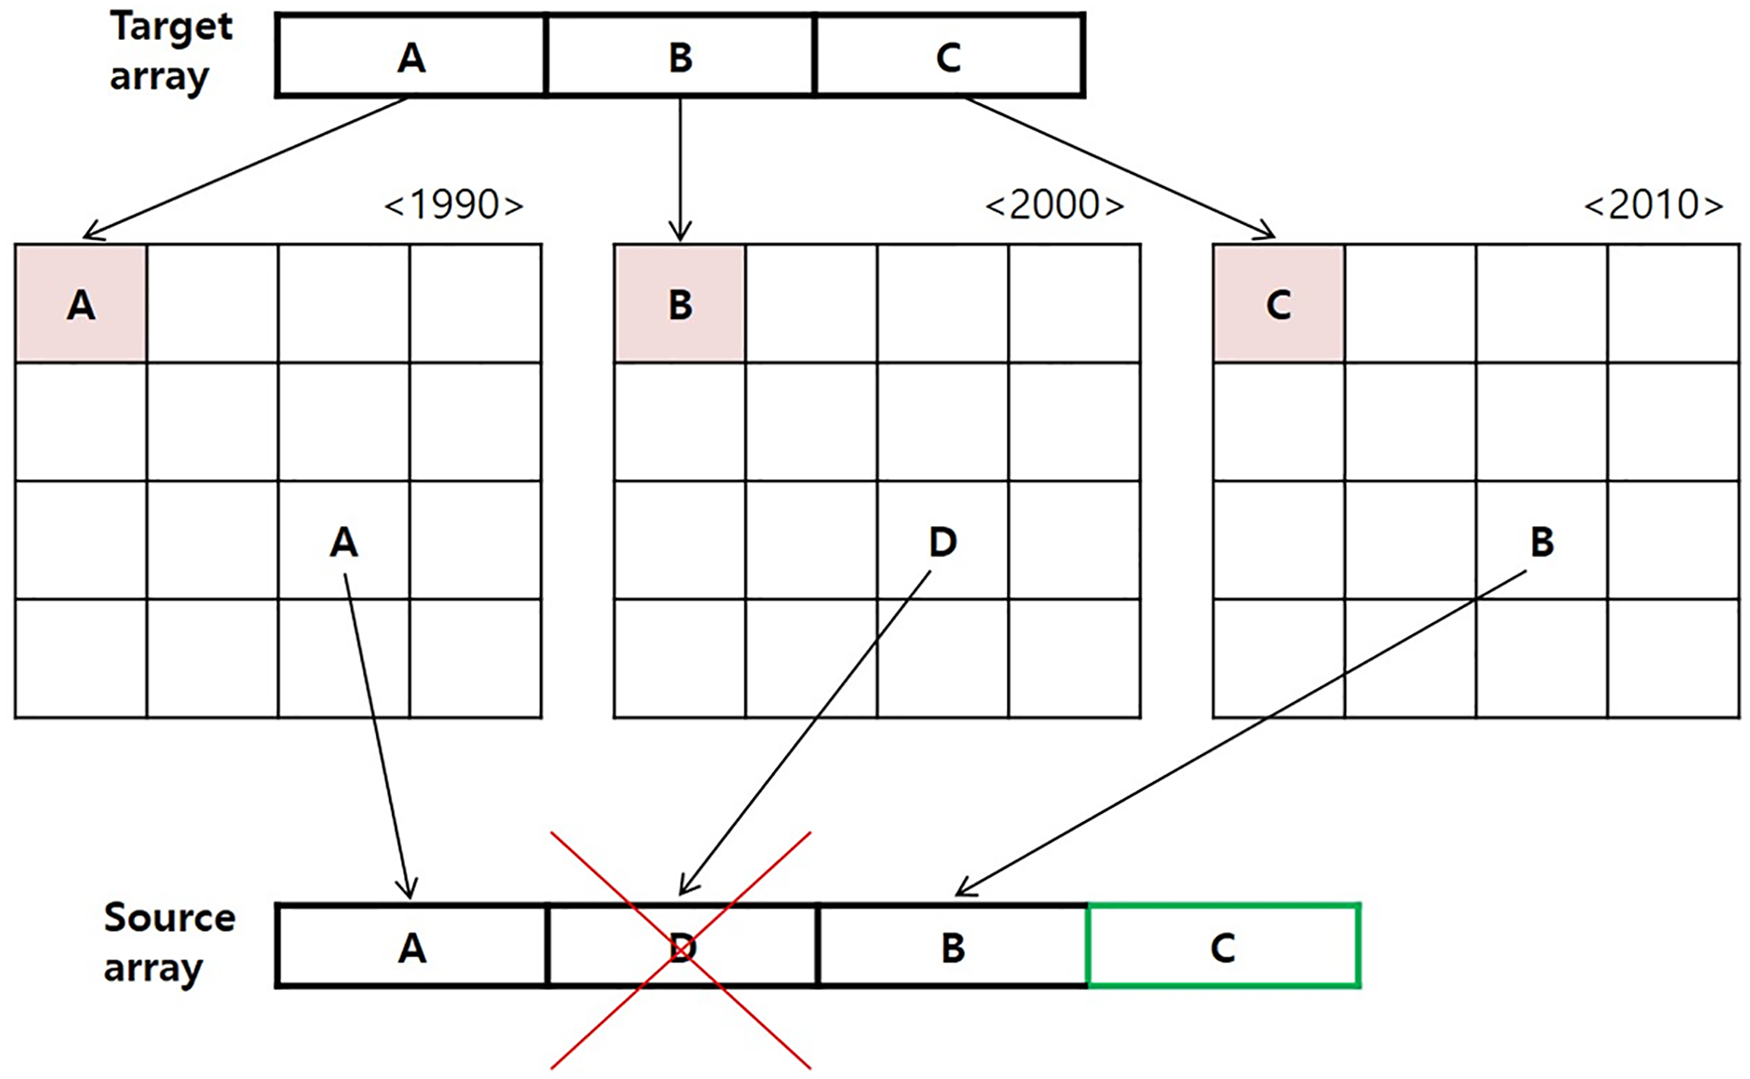
Example of sequence alignment method (Choi 2014).
The method used in this work could effectively improve the applicability and feasibility of SAM, which has been expanded within the current study for the detection and extraction of the exact route, the exact path array, and the pattern of each array in protected areas, a new context. Understanding the spatial and temporal patterns of visitors at park destinations is significant for the natural, social, management, and visitor experiences, because different visiting behavior types can produce difference movement patterns (Kidd et al. 2018). Understanding the spatial and temporal activity patterns of national park visitors can be instrumental in reducing visitors’ negative impacts on the natural resources of the parks, enhancing quality of visitor experience, and allocating park resources more efficiently and reasonably (Kim, Thapa, and Jang 2019). Such knowledge is therefore essential to park management, which sets social and psychological interactions between the visitors and the location itself (Kidd et al. 2018; Ramkissoon, Weiler, and Smith 2012). Further, due to difficulties in quantifying ecological impacts from visitors and the lack of reliable methods for the recording of detailed use patterns, tracking use in remote and vast areas of wilderness may encounter significant limitations (Keller and Foelske 2021). In many cases, such as parks with multiple, undesignated, diffuse entrance locations, management is too complex for conventional methods (Monz et al. 2019). Also, the classification patterns of visitor behavior are significant for managers of park and protected areas as unique preferences of visitors may require different management and information needs to ensure the desired experience and reduced environmental impacts (Kidd et al. 2018).
Materials and Methods
Study Site: Gyeryongsan National Park
Gyeryongsan National Park is one of 22 Korean national parks and was designated as the second Korean national park in 1968. It has an area of 64.71 km2, with 16 peaks and 10 valleys that center on Cheonhwangbong Peak (847 m above sea level) (KNPS 2022). With regard to natural resources, the park contains 1,121 plant, 1,867 insect, and 645 animal species (KNPS 2022).
Gyeryongsan National Park is mainly located in Daejeon, Gongju, and Nonsan in Chungcheongnam-do Province (Figure 2). As the park is close to the Daejeon metropolitan area, tourism congestion and concentrated tourism flows are largely associated with popular areas of the city and increasing demand at iconic natural sites (Chun et al. 2020). The annual number of visitors to Gyeryongsan National Park has increased from 1 million visitors in 2006 to more than 1.8 million visitors in 2018, reaching the second highest number of visitors to the park on record (KNPS 2022). Two reasons often cited for these increases are new government policies related to reduced working time (from 68 to 52 hours per week in 2003) and the elimination of park entrance fees in 2007 (Choe, Schuett, and Sim 2017; Schuett et al. 2016). Independent visitors to Gyeryongsan National Park have flexible activity patterns based on loose itineraries, whereas group visitors tend to have more rigid, determined routes and itineraries. The challenges posed by flexible movements, increased use levels, and resource sustainability impact not only park visitors and park managers but also local communities. Thus, the balance between the sustainability of Gyeryongsan National Park and improving visitor experiences is one of the critical features of managing this national park (Sim, Choe, and Kim 2018) (Table 1).
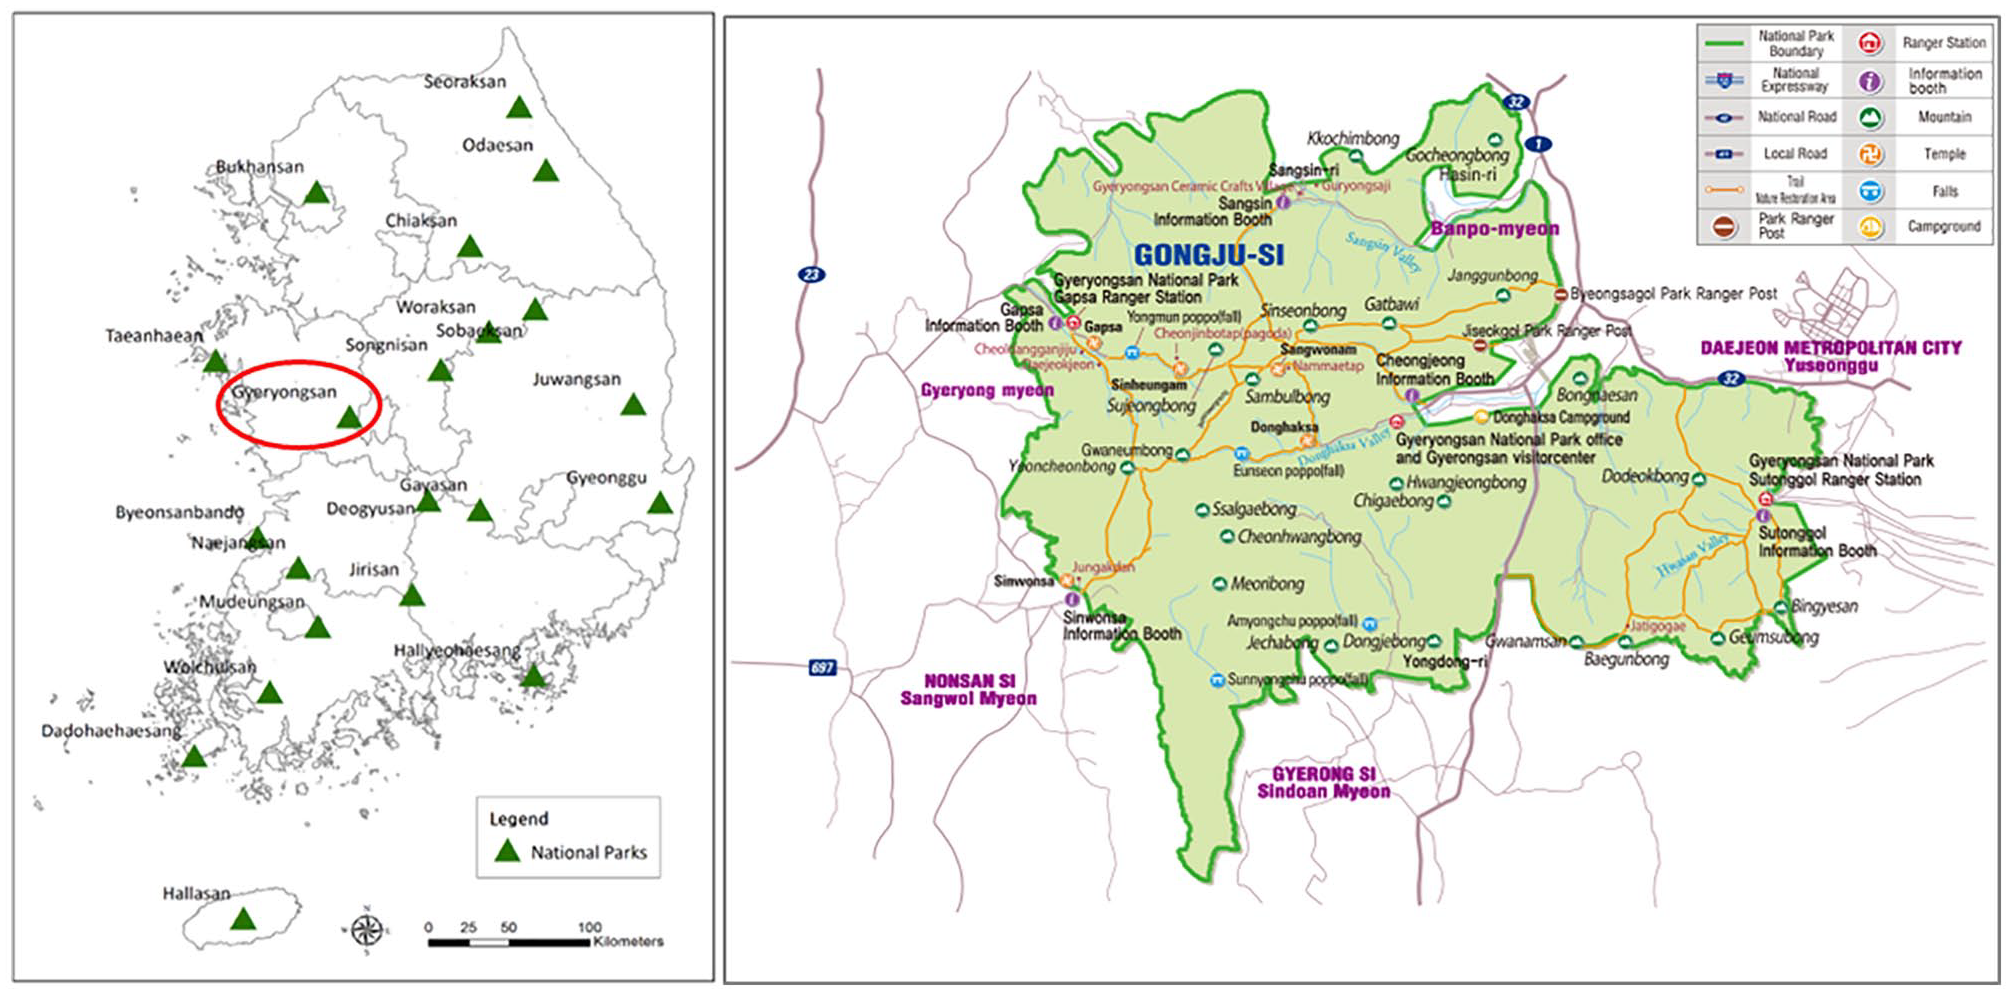
Map of Korean national parks and Gyeryongsan National Park (Korea National Park Service [KNPS] 2022).
Number of Visitors to Gyeryongsan National Park (Statistics Korea 2020).
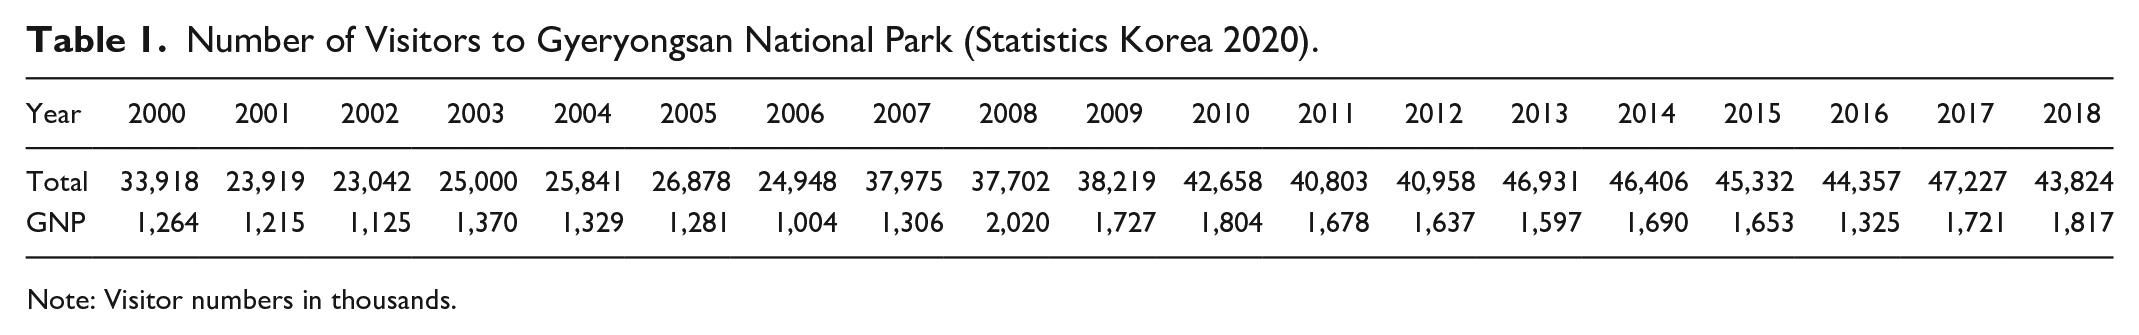
Note: Visitor numbers in thousands.
Data Collection
Onsite, face-to-face surveys were conducted with 344 visitors at Gyeryongsan National Park between April and September 2017. The staff of the Korea National Park Service collected GPS and survey data using systematic random sampling from six information centers in Gyeryongsan National Park (i.e., Donghaksa, Gapsa, Cheonjeong, Sinwonsa, Sangsin, Sutonggol). Korea National Park Service staff distributed GPS loggers at the information centers. Loggers were provided to individuals and one person per travel party. To obtain a representative sample of actual national park visitors, the sample size and characteristics were predetermined on the basis of mobile positioning data from SK Telecom (Figure 3). The Korea National Park Service staff briefly introduced the objective of the study to the survey participants, and the participants were selected when they met the following criteria: (1) willing to participate in this study and (2) visiting Gyeryongsan National Park. Those individuals who agreed (78.3% response rate) were given a GPS device and instructed to return it to an information center when their visit ended.
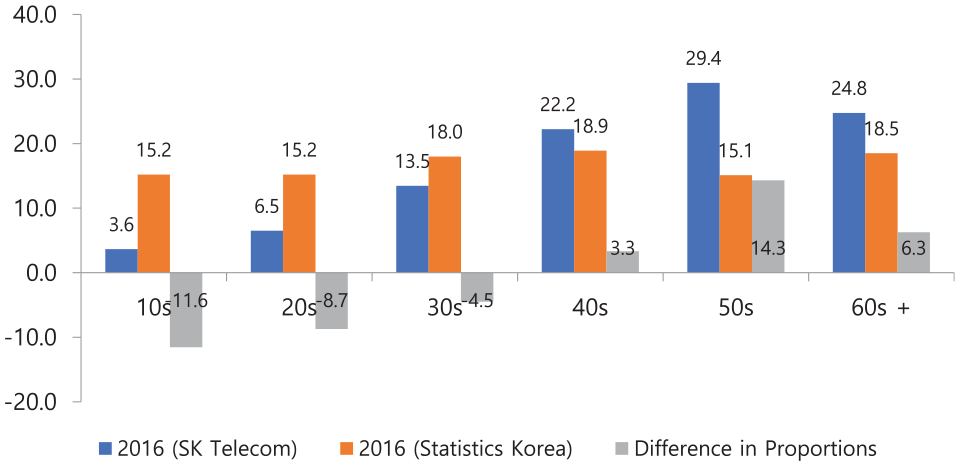
Sample based on the mobile positioning data from SK Telecom subscribers and Statistics Korea (2016).
For this study, M-241, a GPS logger made by Holux, was used. This logger has the ability to track 100,000 points and has a 12-hour use time. The loggers were set to provide a detailed account of visitors’ movements by recording locations at 10-second intervals. The participants also filled out a survey to acquire demographic and tripographic data so that the spatial and temporal patterns of visitors provided via GPS were combined with the visitor characteristics. This is an important addition because visitors’ sociodemographic characteristics and tripographics (i.e., residence, group types, number of people in groups, motivations, visiting other tourist attractions) influence their behavior and internal decision making when traveling to national parks (Choe and Schuett 2019). This study analyzed each participant’s path along a trail.
Sample Population and Characteristics
In the past, visitor surveys at the Korea National Park Service used random stratified sampling based on the percentage of visitor population by age group as provided by Statistics Korea (Figure 3). However, sampling errors were reported when the sample of the target population was surveyed. These errors are attributed to the fact that SK Telecom and Statistics Korea reported different percentages of the target population (Figure 3). For instance, when the target population was calculated using data from Statistics Korea, the proportion of visitors in their 10s–30s was higher than the proportion of people in their 40s or older who visited the national parks. For this reason, the previous sample of the target population might not have reflected the population visiting Gyeryongsan National Park. Therefore, in this study, a complex random stratified sampling was employed to estimate the age of the target population who actually visited Gyeryongsan National Park, using subscriber data from a telecom company. SK Telecom was selected because 52% of mobile phone subscribers in South Korea use this company. The sample was calculated so as to be nationally representative based on the mobile positioning data from SK Telecom subscribers and Statistics Korea.
The characteristics of the respondents are presented in Table 2. A total of 344 individuals agreed to use the GPS trackers and fill out the questionnaire. Of the visitors to Gyeryongsan National Park, 56.9% were male and 43.1% were female. In addition, 29.7% of the respondents were in their 50s, while 25.3% were in their 40s. Of the respondents, 34.3% reported a household monthly income over 5,000,000 Korean Won (KRW) or US$ 4,266. The average monthly household income in Korea is 5,554,983 KRW (Statistics Korea 2020). Visitors to Gyeryongsan National Park were from the region of Daejeon (55.8%), Sejong (7.6%), Gyeonggi (6.4%), and Seoul (5.5%). Of the respondents, 25.6% were office workers, 20.1% were self-employed, and 16.9% were homemakers.
Demographic Profile of Respondents.
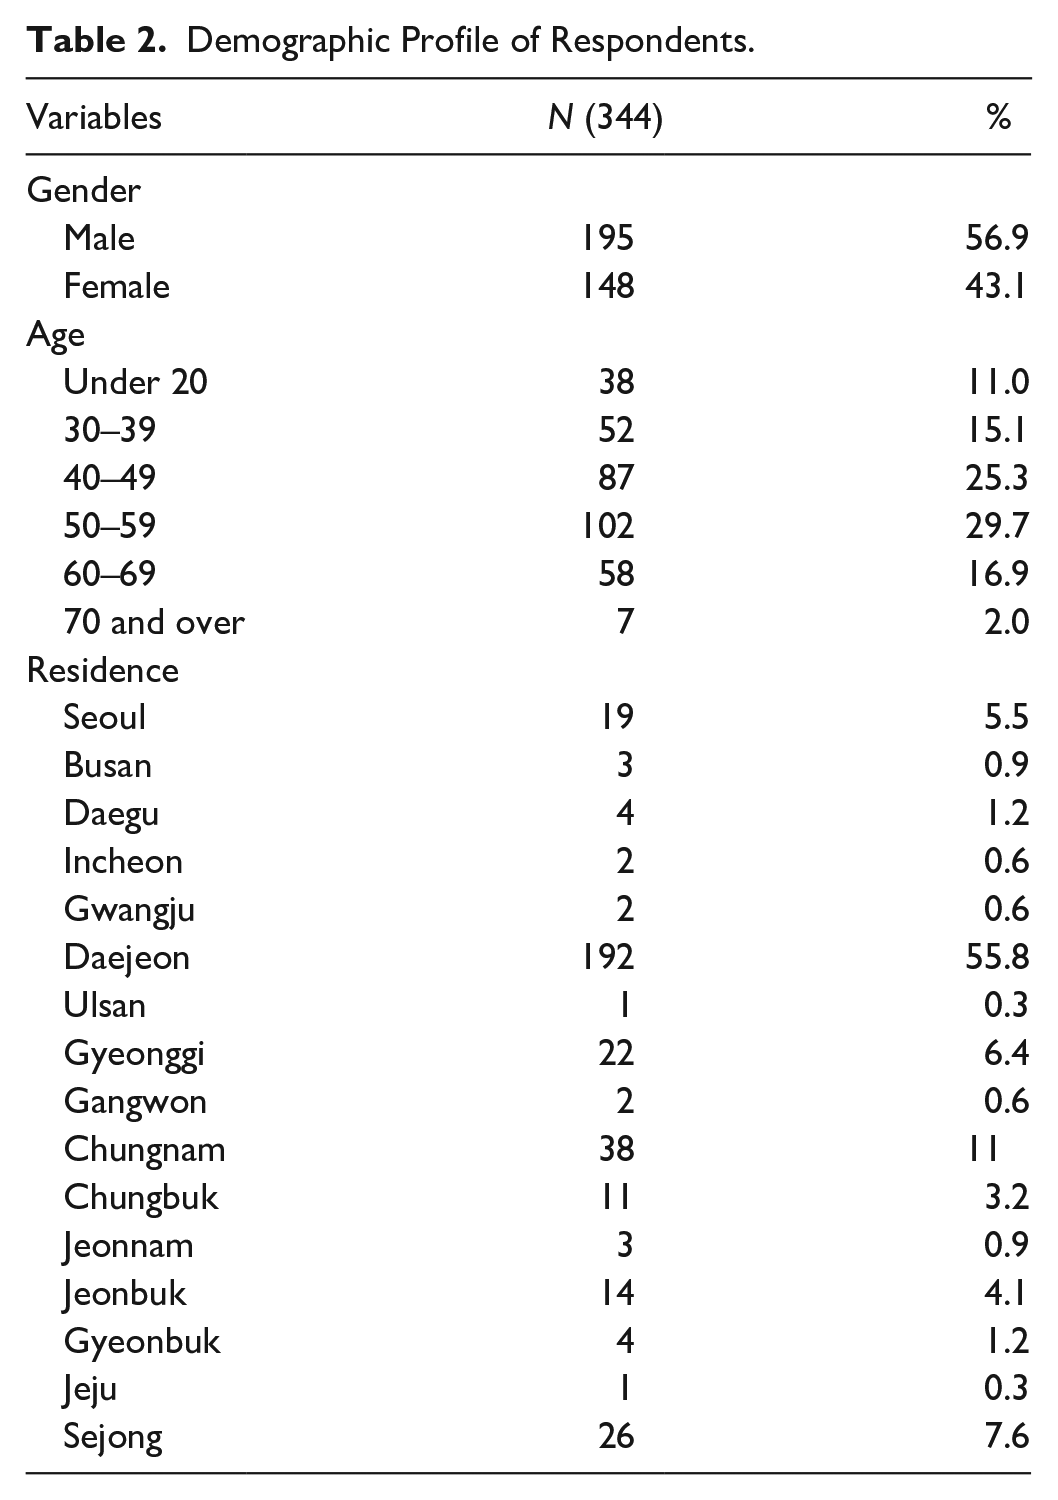
Table 3 shows the tripographic profiles of the respondents. A total of 92.3% of the visitors were single-day visitors, and about half visited Gyeryongsan National Park in groups of two individuals. Of the respondents, 84.3% used private vehicles to visit the park, and 86.7% were repeat visitors. As for travel expenditures, 45.5% of the respondents spent less than 10,000 KRW at the park. For 90.7% of the respondents, Gyeryongsan National Park was their primary destination. About 85.2% of the respondents identified the park as their only destination, while 14.8% visited other tourist attractions before/after visiting the park.
Tripographic Profile of Respondents.
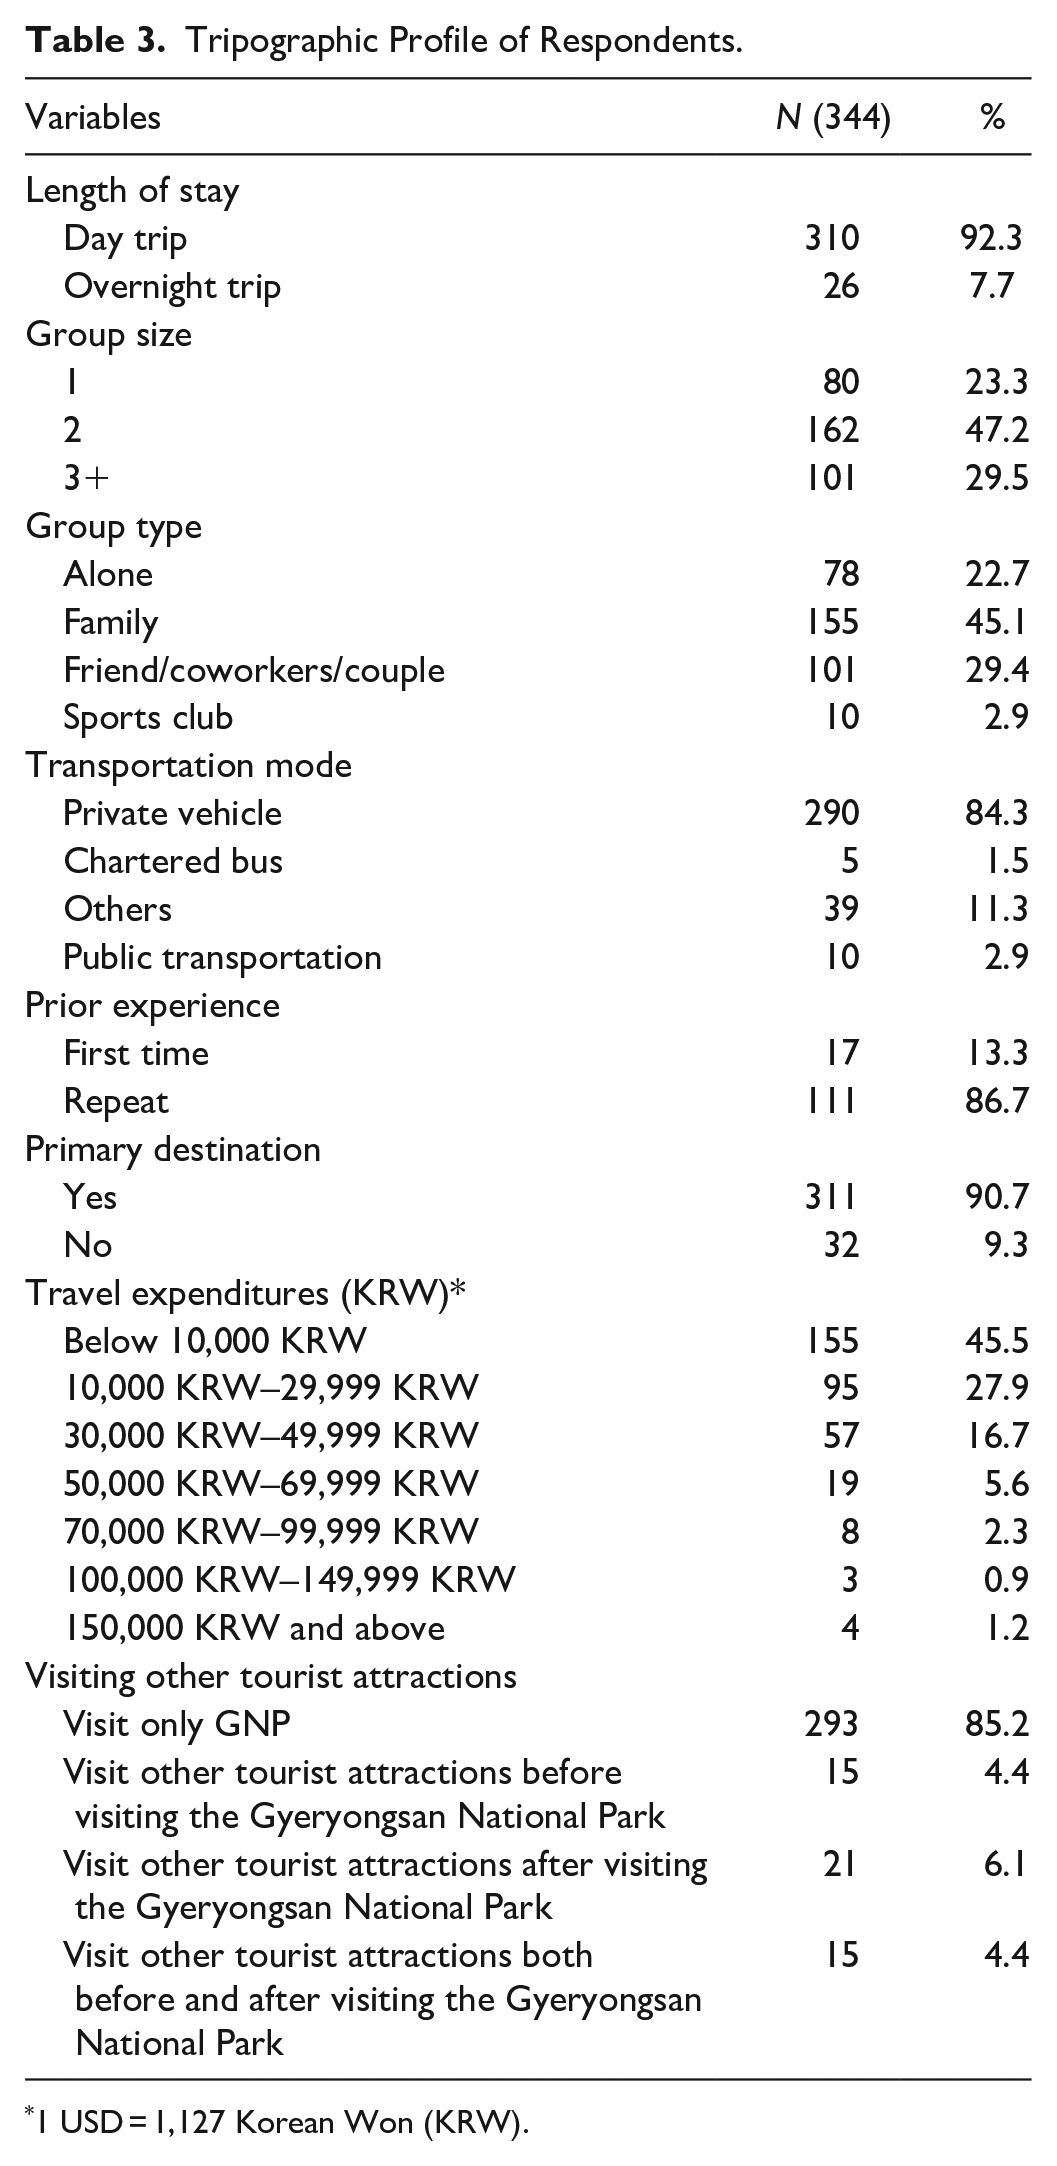
1 USD = 1,127 Korean Won (KRW).
Data Analysis
By proposing a novel method of analyzing the arrangement of links using all nodes, the current work creates unique path arrays in terms of data preprocessing in data analysis. Previous studies using GPS to track activities analyzed the visited points array and identified which points people visited and in what order, only the nodes visited between the starting point and the ending point were included in the array. On the other hand, the analysis of SAM in this work used a different data type (analysis object). All nodes were connected by a hiking path, and the paths of the individuals were identified to determine how people travel along paths by following a particular order. Each spot in this national park study is a node, and the park path connecting the spots becomes a link, which connects two nodes. That is, the target object observed in this study becomes the travel route, including all detailed paths (links) moving from node to node. In this case, all nodes (points) between the starting node and the ending node were included in the array.
Past research applied SAM by designating the elements (places) along the path such as attractions, landmarks in cities, or facilities in theme parks, points, and identifying the arrangement of the points (Lee and Joh 2010; Shoval et al. 2015). In this case, it was not plausible to interpret the exact path because of the indeterminacy in paths between points. For example, if we create the path array that moves from A to E in Figure 4 below, information loss between the arrays may occur depending on the way we classify each node. We cannot definitively say whether an individual’s path is A–C–E or A–B–C–E, in line with the limitations of SAM that have been discussed by recent publications (Joh et al. 2002). As shown previously, the possibility of data loss may result in failure to contain all of the path information necessary to obtain a valid representative path (Mavoa et al. 2011; Shoval et al. 2015).
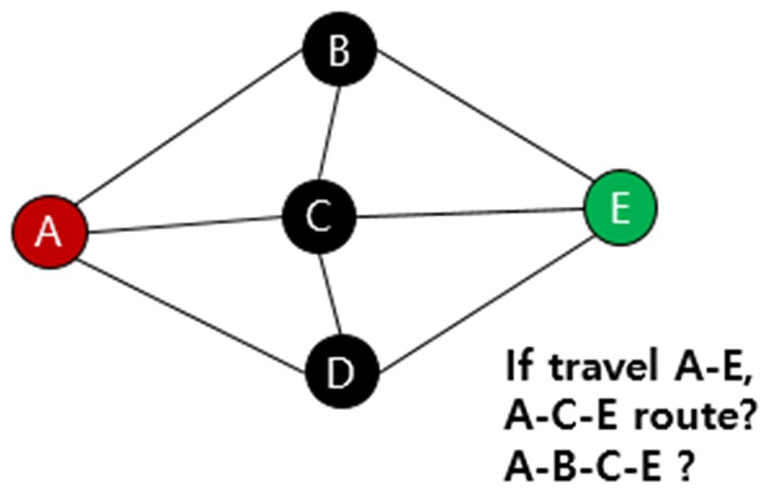
Path array of A–E.
In contrast, the data analysis of this study did not lose any information, as the path array data were all arranged in the form of node-link-route. This is because the current work created the path array by coding all places in the national park as nodes. Since the pattern of the route was analyzed, different interpretations of the results were obtained compared to previous studies. For example, there are a number of ways to travel from area A (starting point) to area B (endpoint) in the national park. Here, the result of this study portrayed the exact route; furthermore, the exact path array can be found, and the pattern of each array can be found as well.
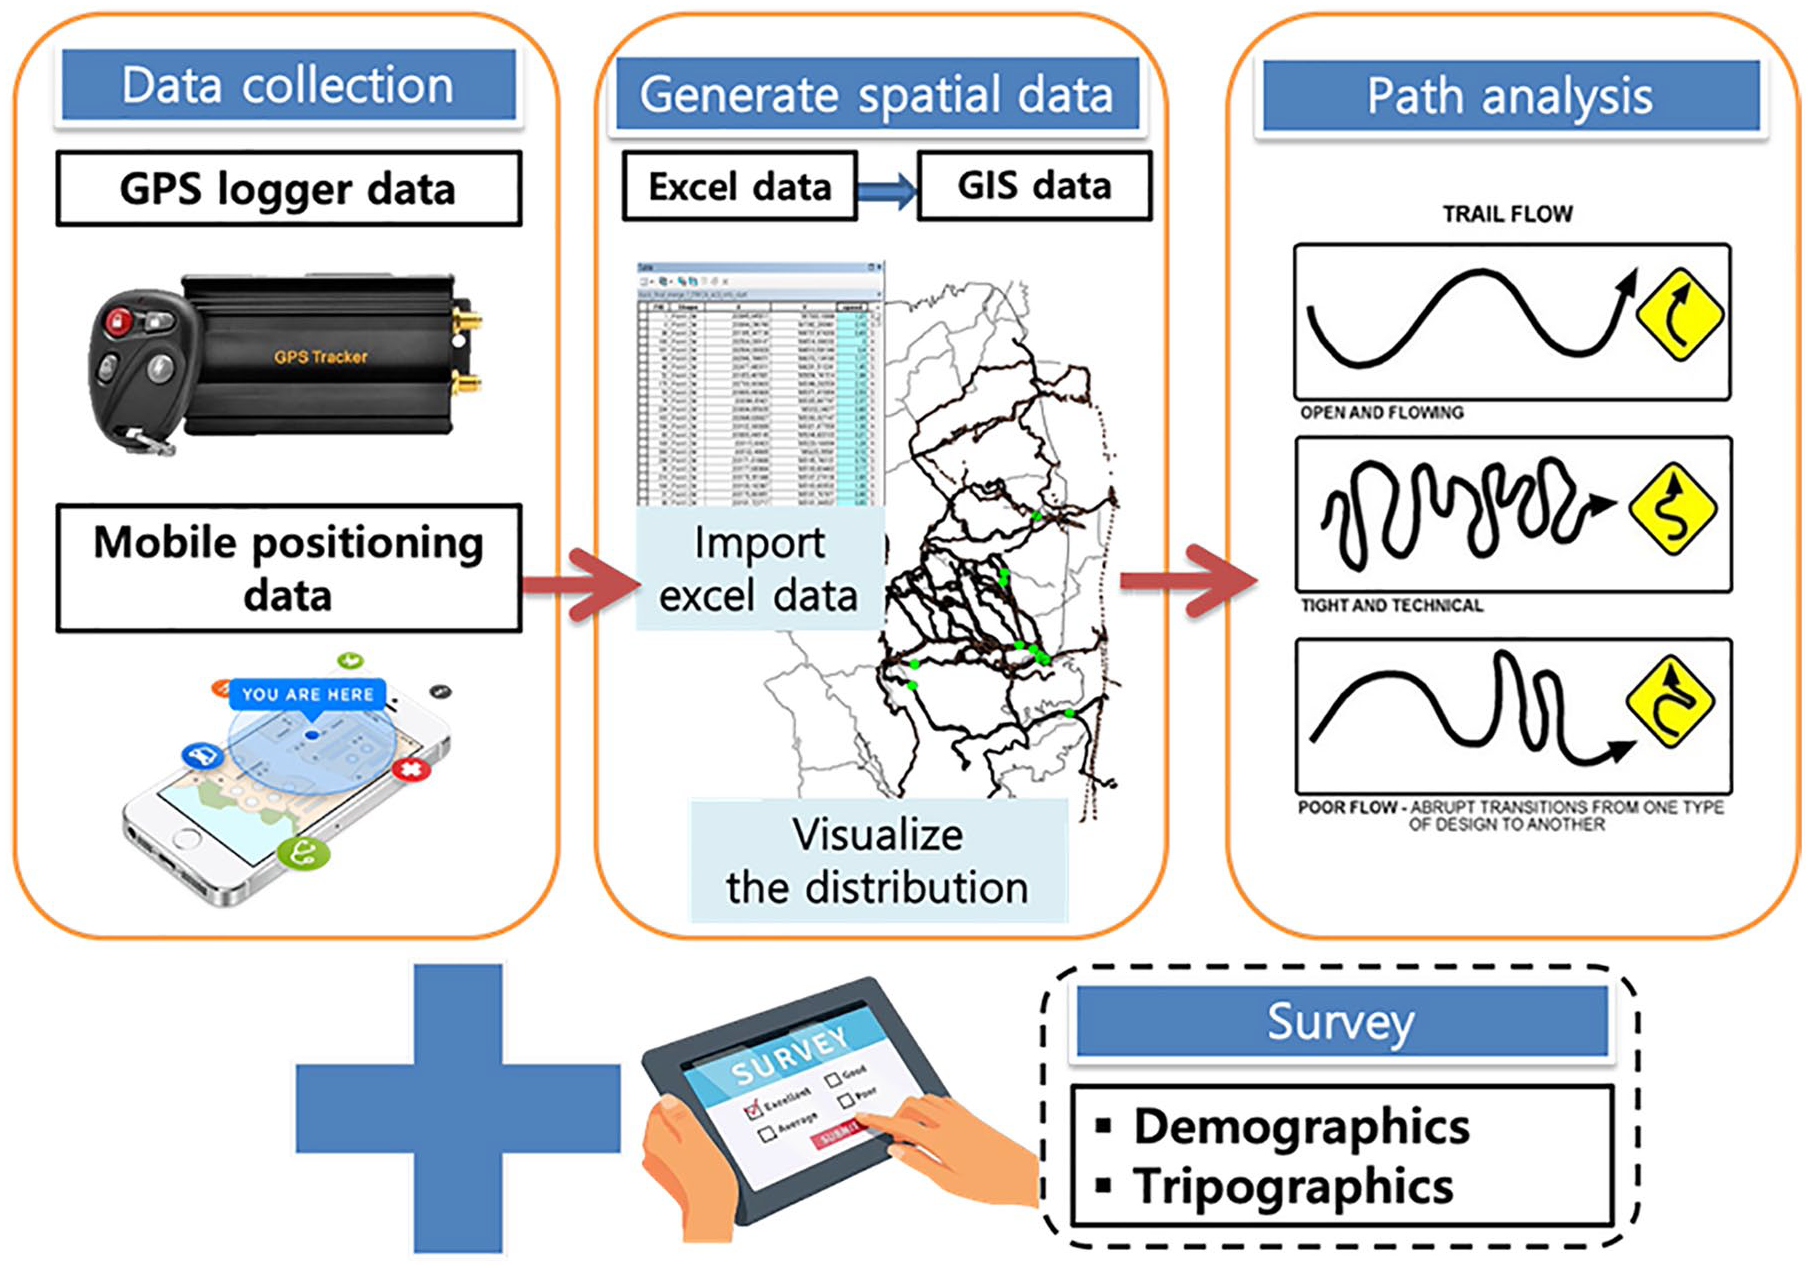
As Millonig and Gartner (2008) mentioned, GPS tracking methods report only spatial and temporal data. Accordingly, a survey was also utilized to obtain information related to the respondents in this study. The raw data used in the analysis were collected from a total of 344 loggers and surveys. First, the GPS loggers converted signals into position, velocity, and time estimates. The generated spatial data were then imported via Excel data into ArcMap to visualize the distribution and identify the common paths the visitors took. Second, the path analysis steps using SAM were described (Figure 5) and adapted from an analysis tool used by Joh et al. (2002). The path array was made from the individual paths collected from the logger and arranged in order of visit. For example, in the case of LOGGER_ID 0421001 in Figure 5, the case moved from the “o” site to the “j” site, and the path array became “oj.” Since we need to measure the similarities between arrays, duplicate arrays were removed and only unique arrays were collected. After the matching values between the paths were calculated using the SAM, a distance matrix containing the matching values was created.
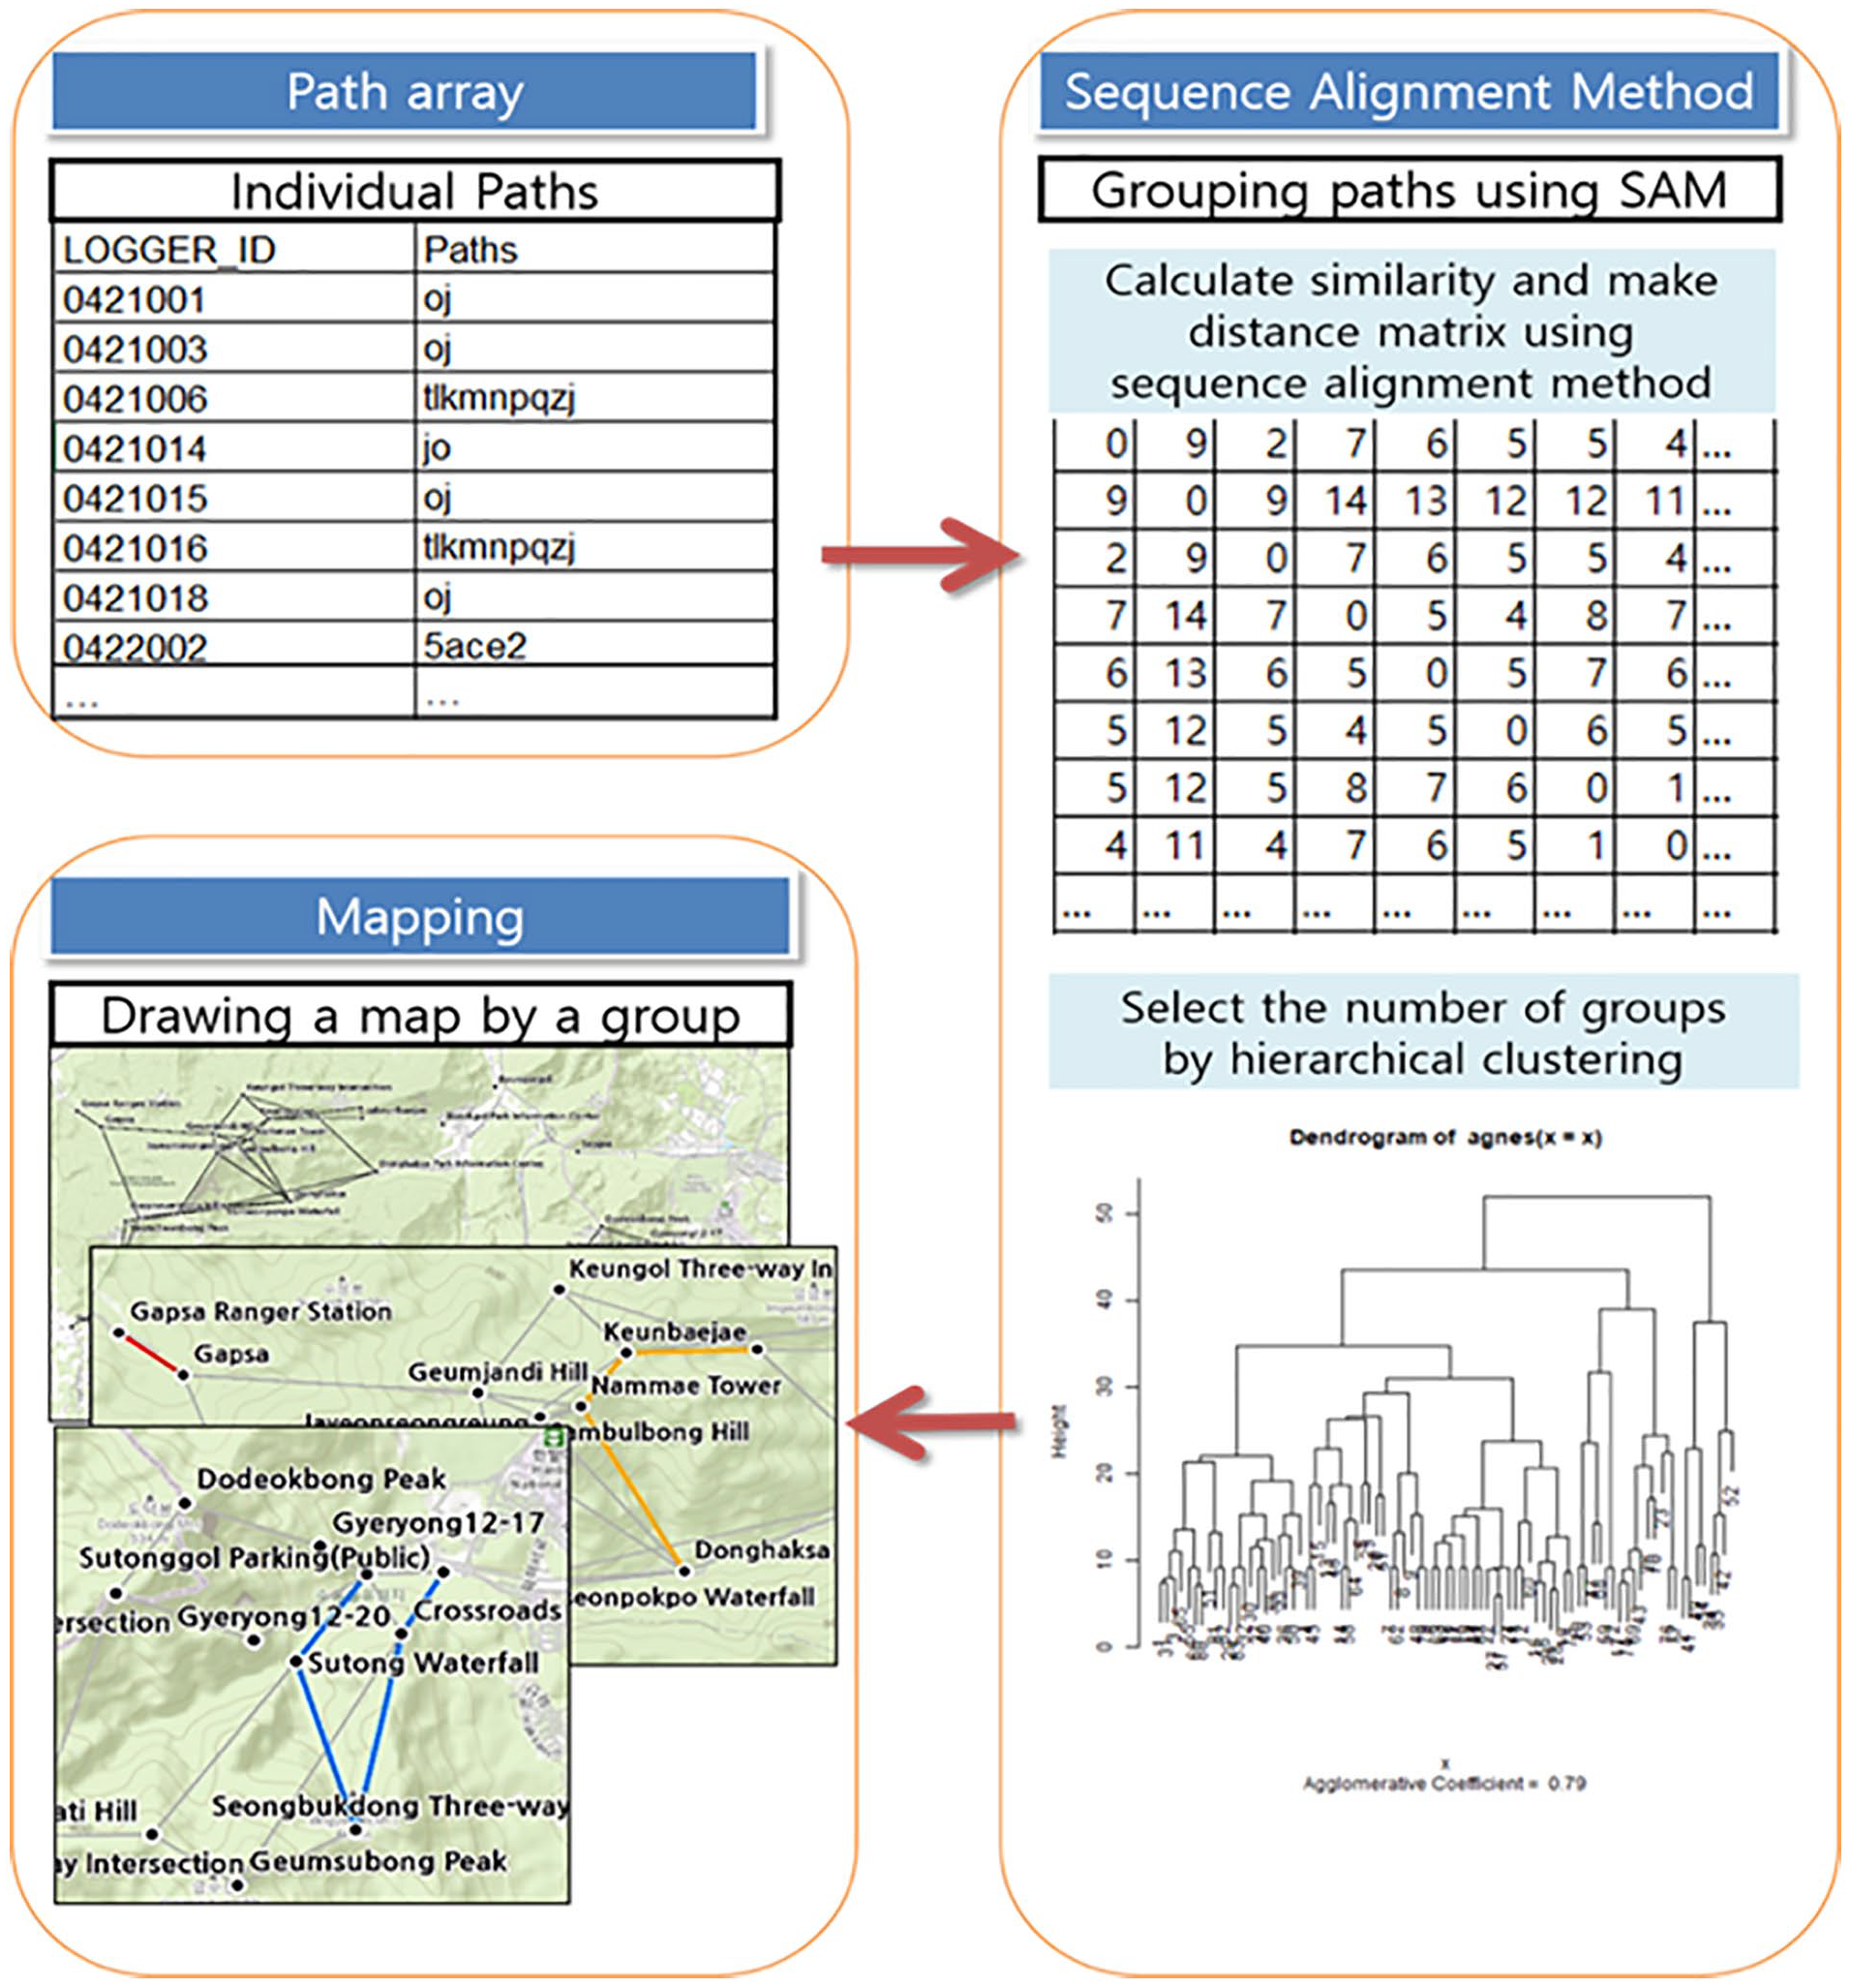
Path analysis steps using the sequence alignment method.
Next, a hierarchical cluster analysis was performed to compare the clusters in R. To create a dendrogram, a distance matrix was used as the input data for the hierarchical cluster analysis. The results of the hierarchical cluster analysis of similar individual arrays were found in a dendrogram using a bottom-up approach. Then, the number of groups was selected based on the dendrogram. Finally, a map was created for each group, and the types and number of arrays in the group were interpreted. With the sequence frequency criterion, the more frequent a sequence, the more representative it is supposed to be. Thus, a representative sequence (representing the characteristics of the group) was selected for the most frequent sequence and used to interpret the meaning of the group.
Third, the combined GPS, survey, demographic, and tripographic data were analyzed using SPSS version 26.0. Descriptive statistics were used to profile the demographics of the Gyeryongsan National Park visitors. A one-way ANOVA test was used to analyze the intergroup comparisons of path length, travel time, and travel speed. Tukey tests were then performed to identify significant differences among groups, and chi-square tests were carried out on the demographic and tripographic characteristics to examine statistically significant differences. The Figure 6 shows the overall data analysis process.
Overall data analysis process.
Results
Spatial and Temporal Patterns
First, the alignment of the dataset produced a dendrogram (Figure 7) that identified, for the three groups of visitors, (1) the visited locations and (2) the sequences in which they visited the locations. A hierarchical cluster analysis was performed using the similarities between the paths by applying the SAM to an extracted unique path. Through the dendrogram, the most similar arrangements were grouped through a bottom-up approach and then the similar arrangements were grouped together. Specifically, three sequences of signal multipath errors encountered in GPS data were excluded from the 344 sequences, leading to a total of 341 sequences. From the 341 sequences, 83 unique paths were extracted after the duplicate paths were removed. At this point, 41 sequences that only contained one point were extracted separately into one group. In addition, 300 sequences were used in the SAM analysis, which allowed the researchers to classify the data into two groups based on the red line in a dendrogram (Figure 7). Therefore, a total of three groups were obtained: two groups based on the dendrogram and one group that visited only one point. Figure 8 shows the visualization of the 83 unique paths, and Figures 9 to 11 represent the visualizations of three groups that were defined by the SAM to depict the spatial and temporal patterns of the visitors at Gyeryongsan National Park. The results showed that the spatial and temporal patterns had significant impacts on the visitors’ paths.
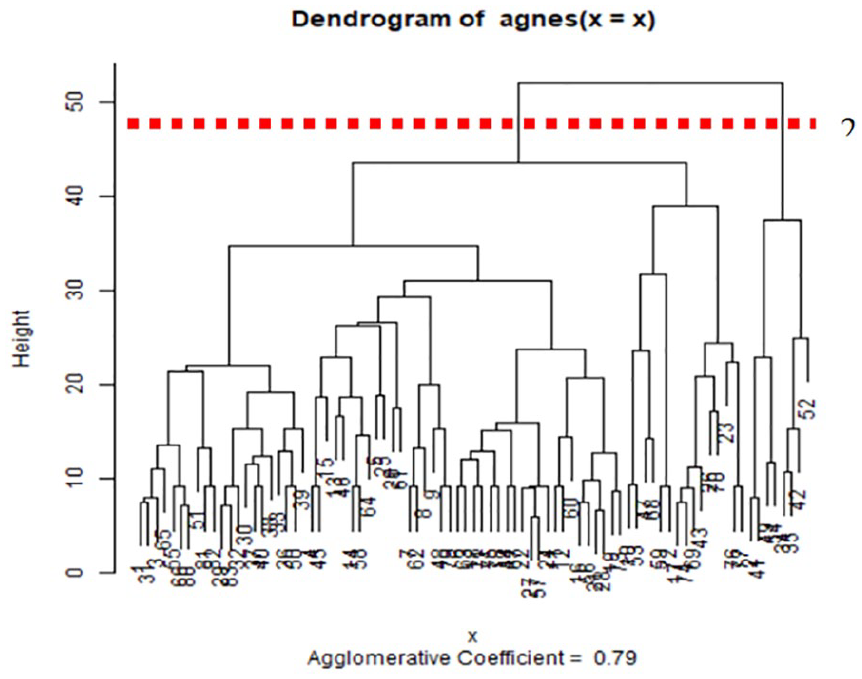
Hierarchical tree structure of data analysis.
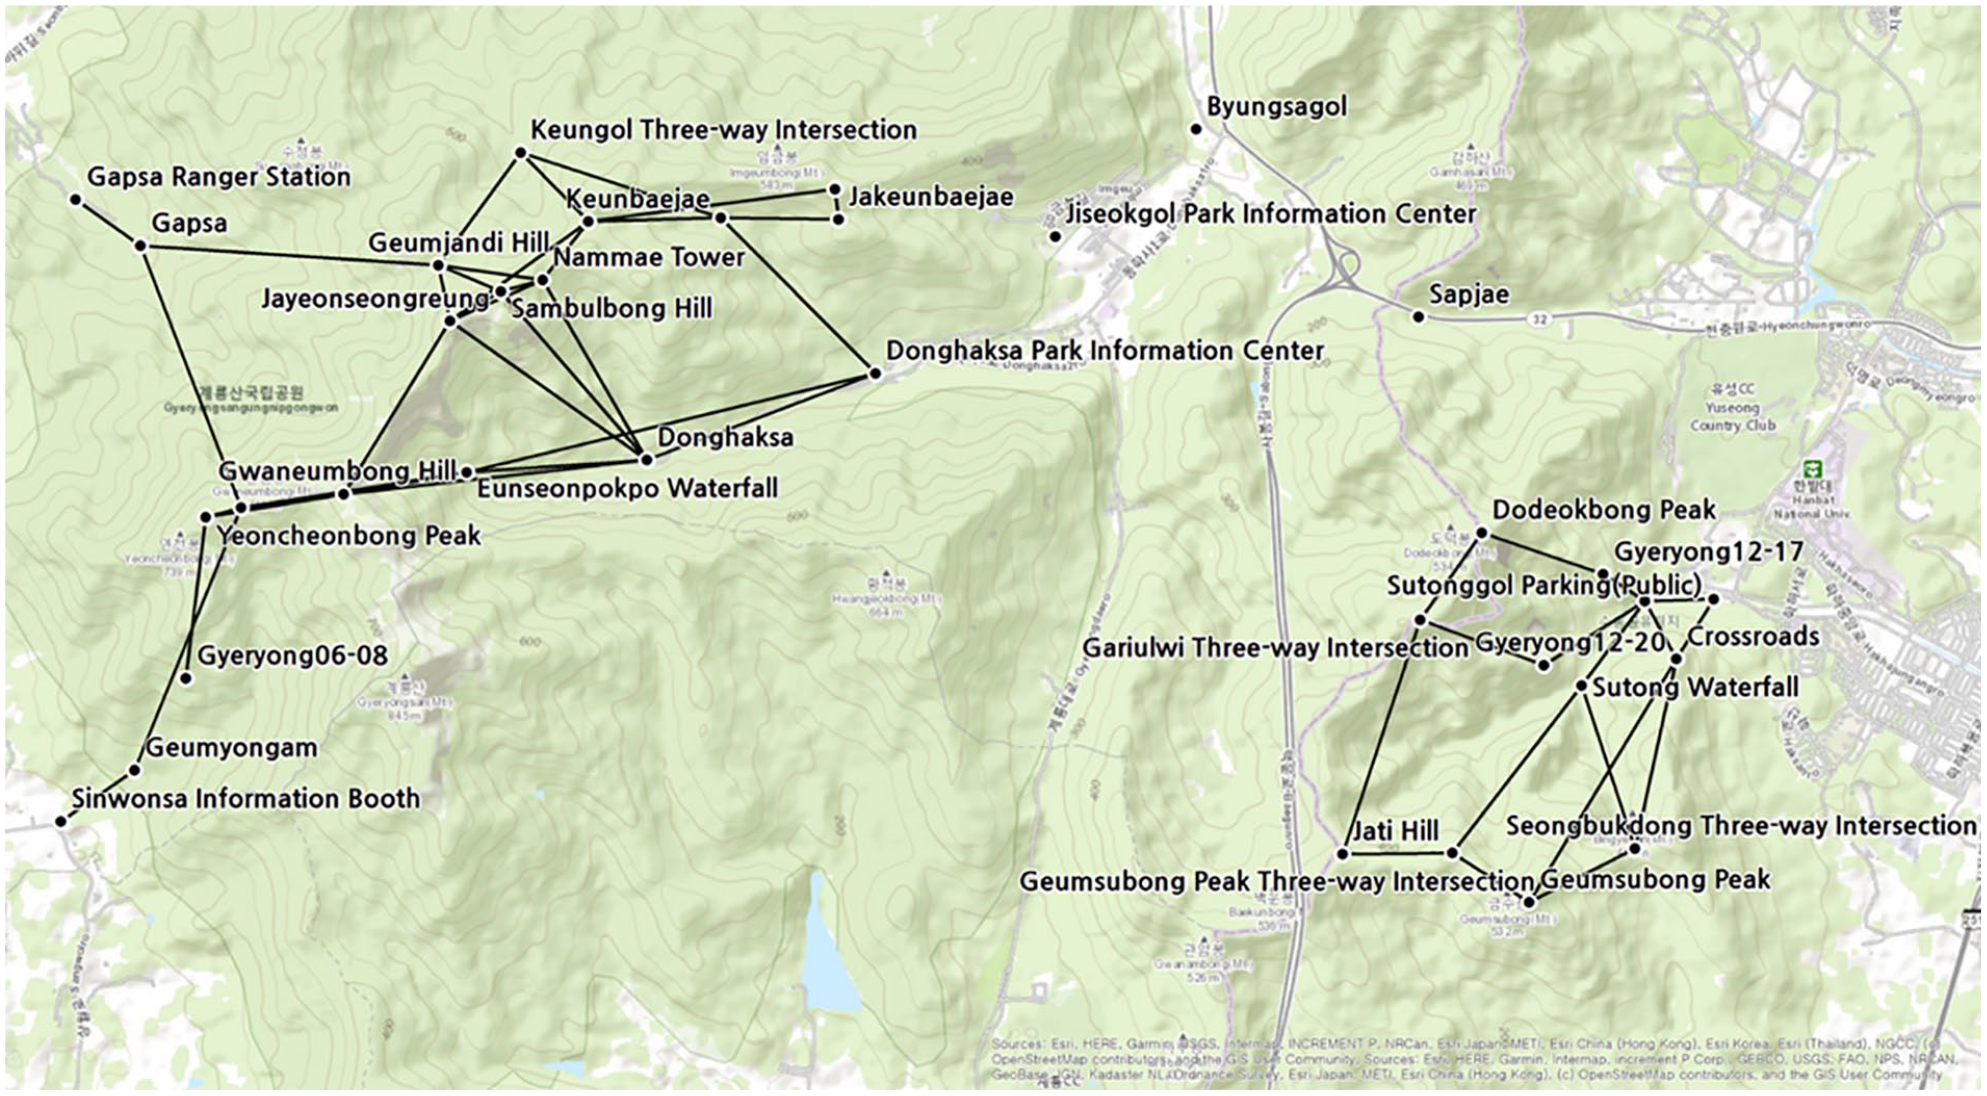
Visualization of the 83 unique paths.
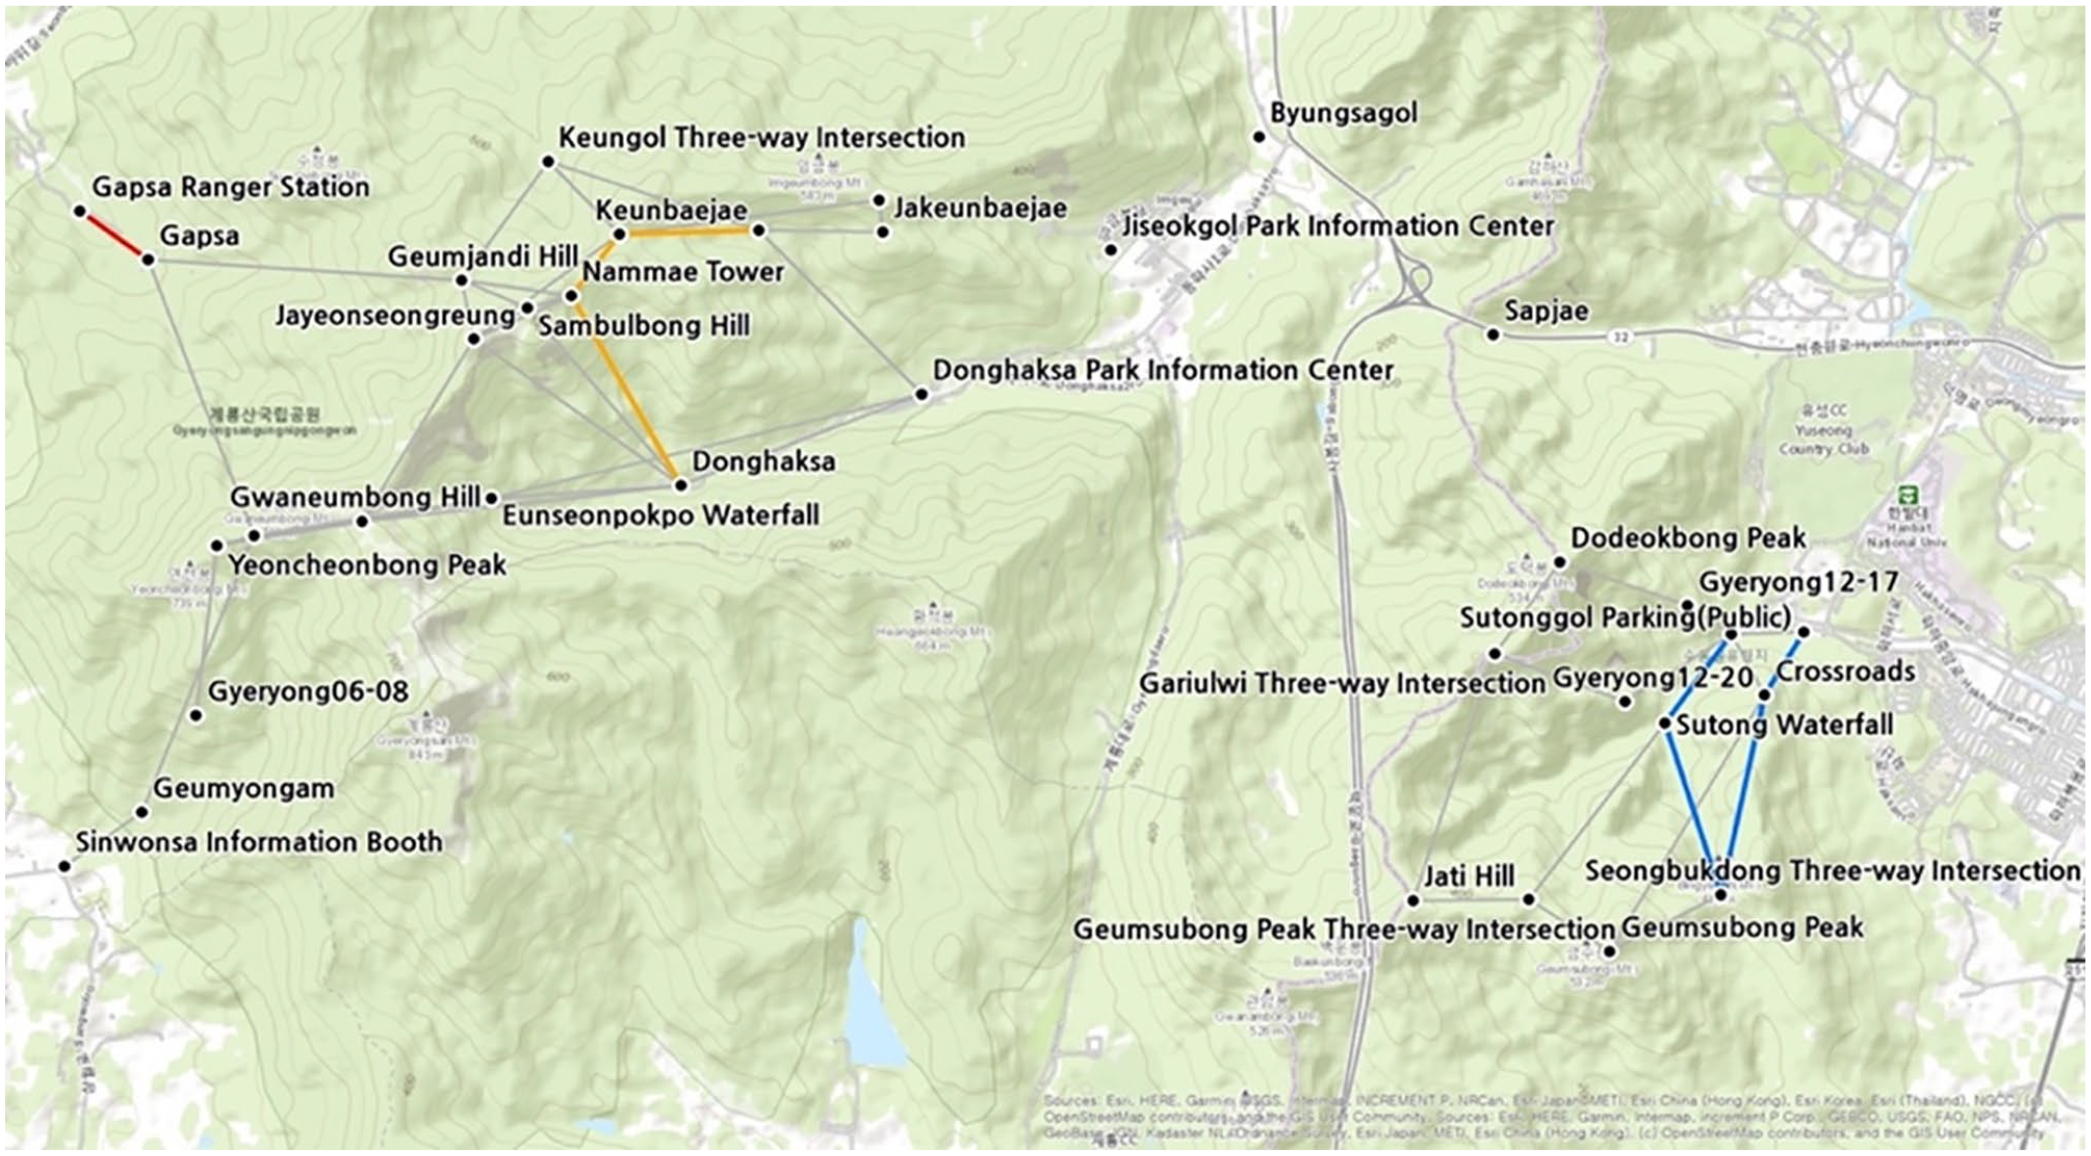
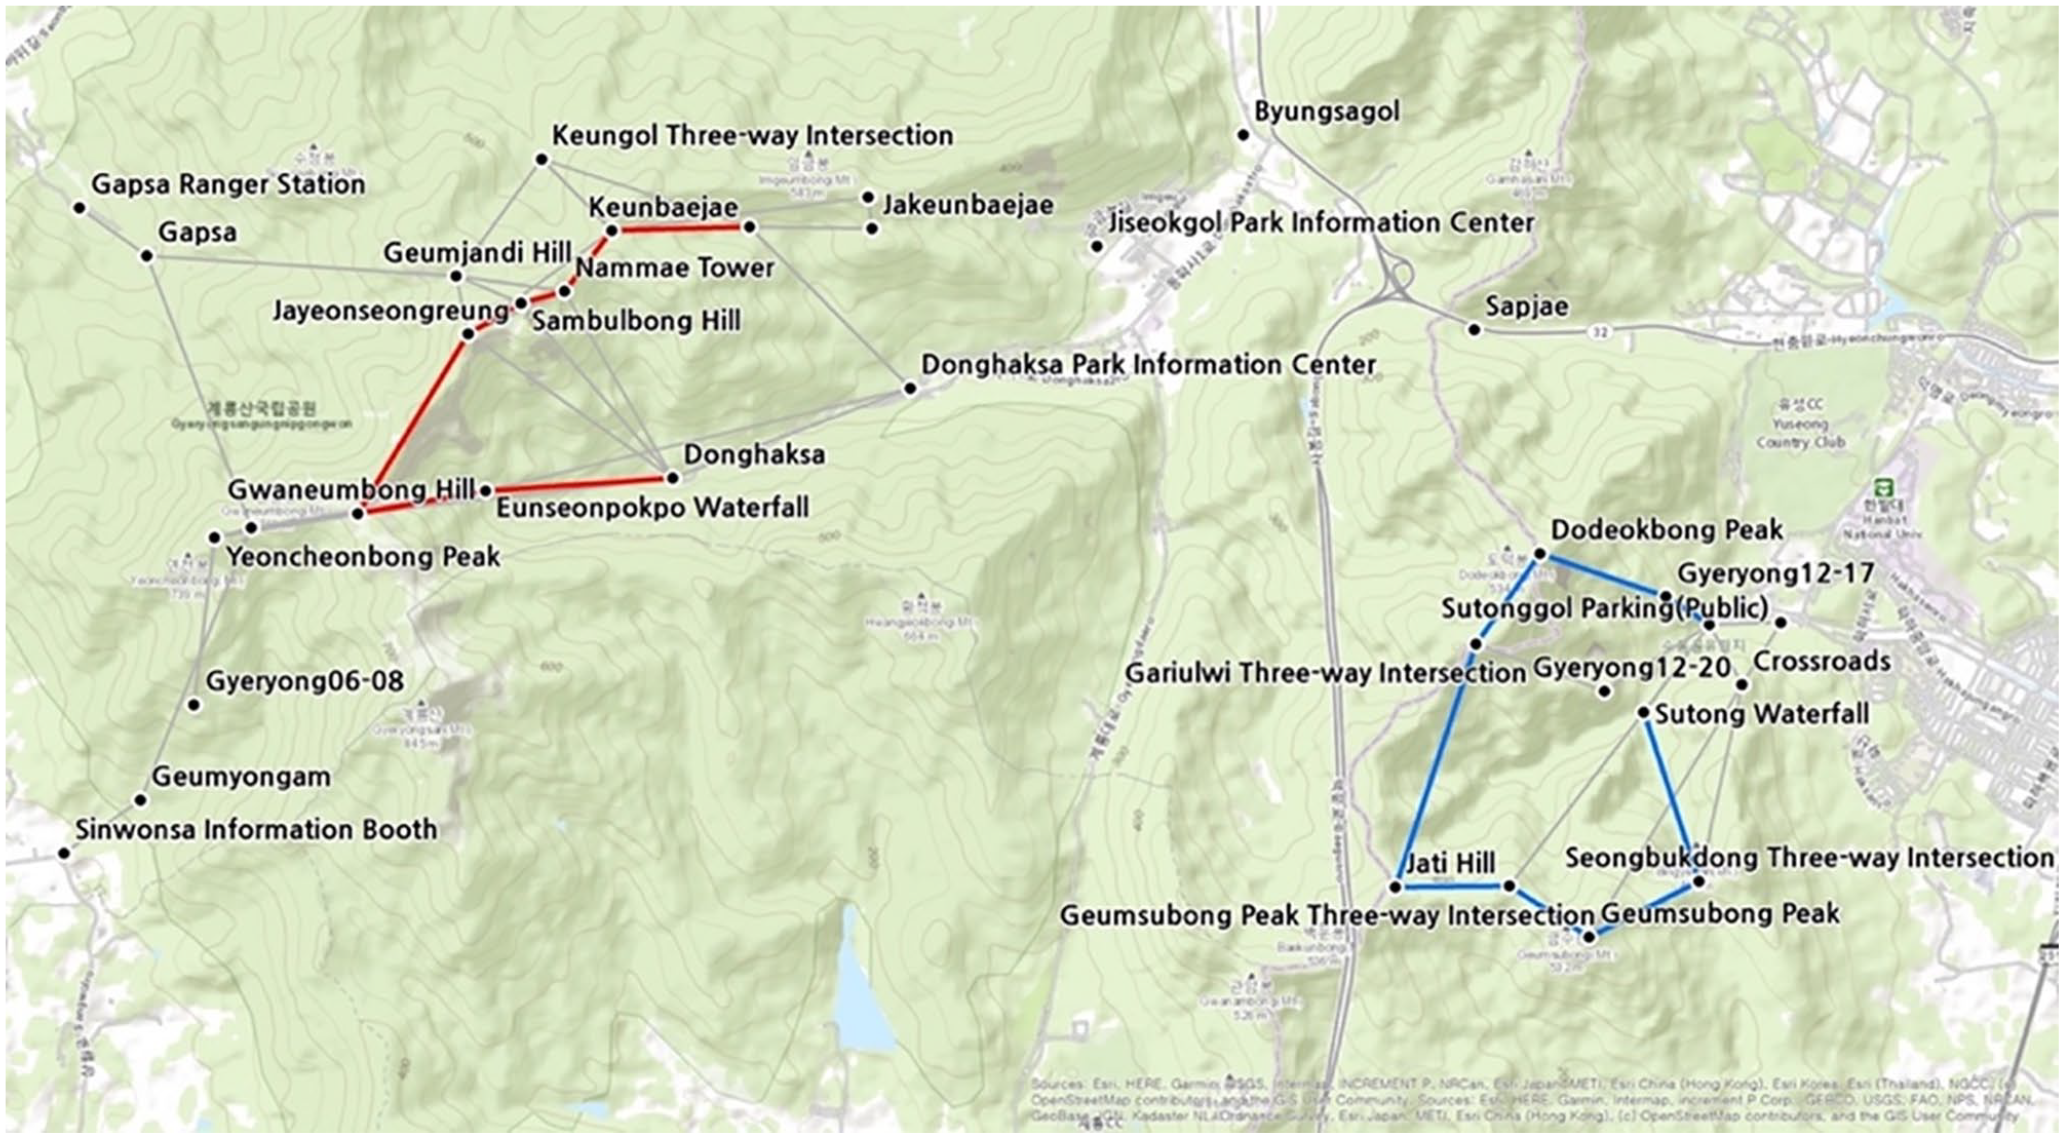
Path analysis for Group 1.
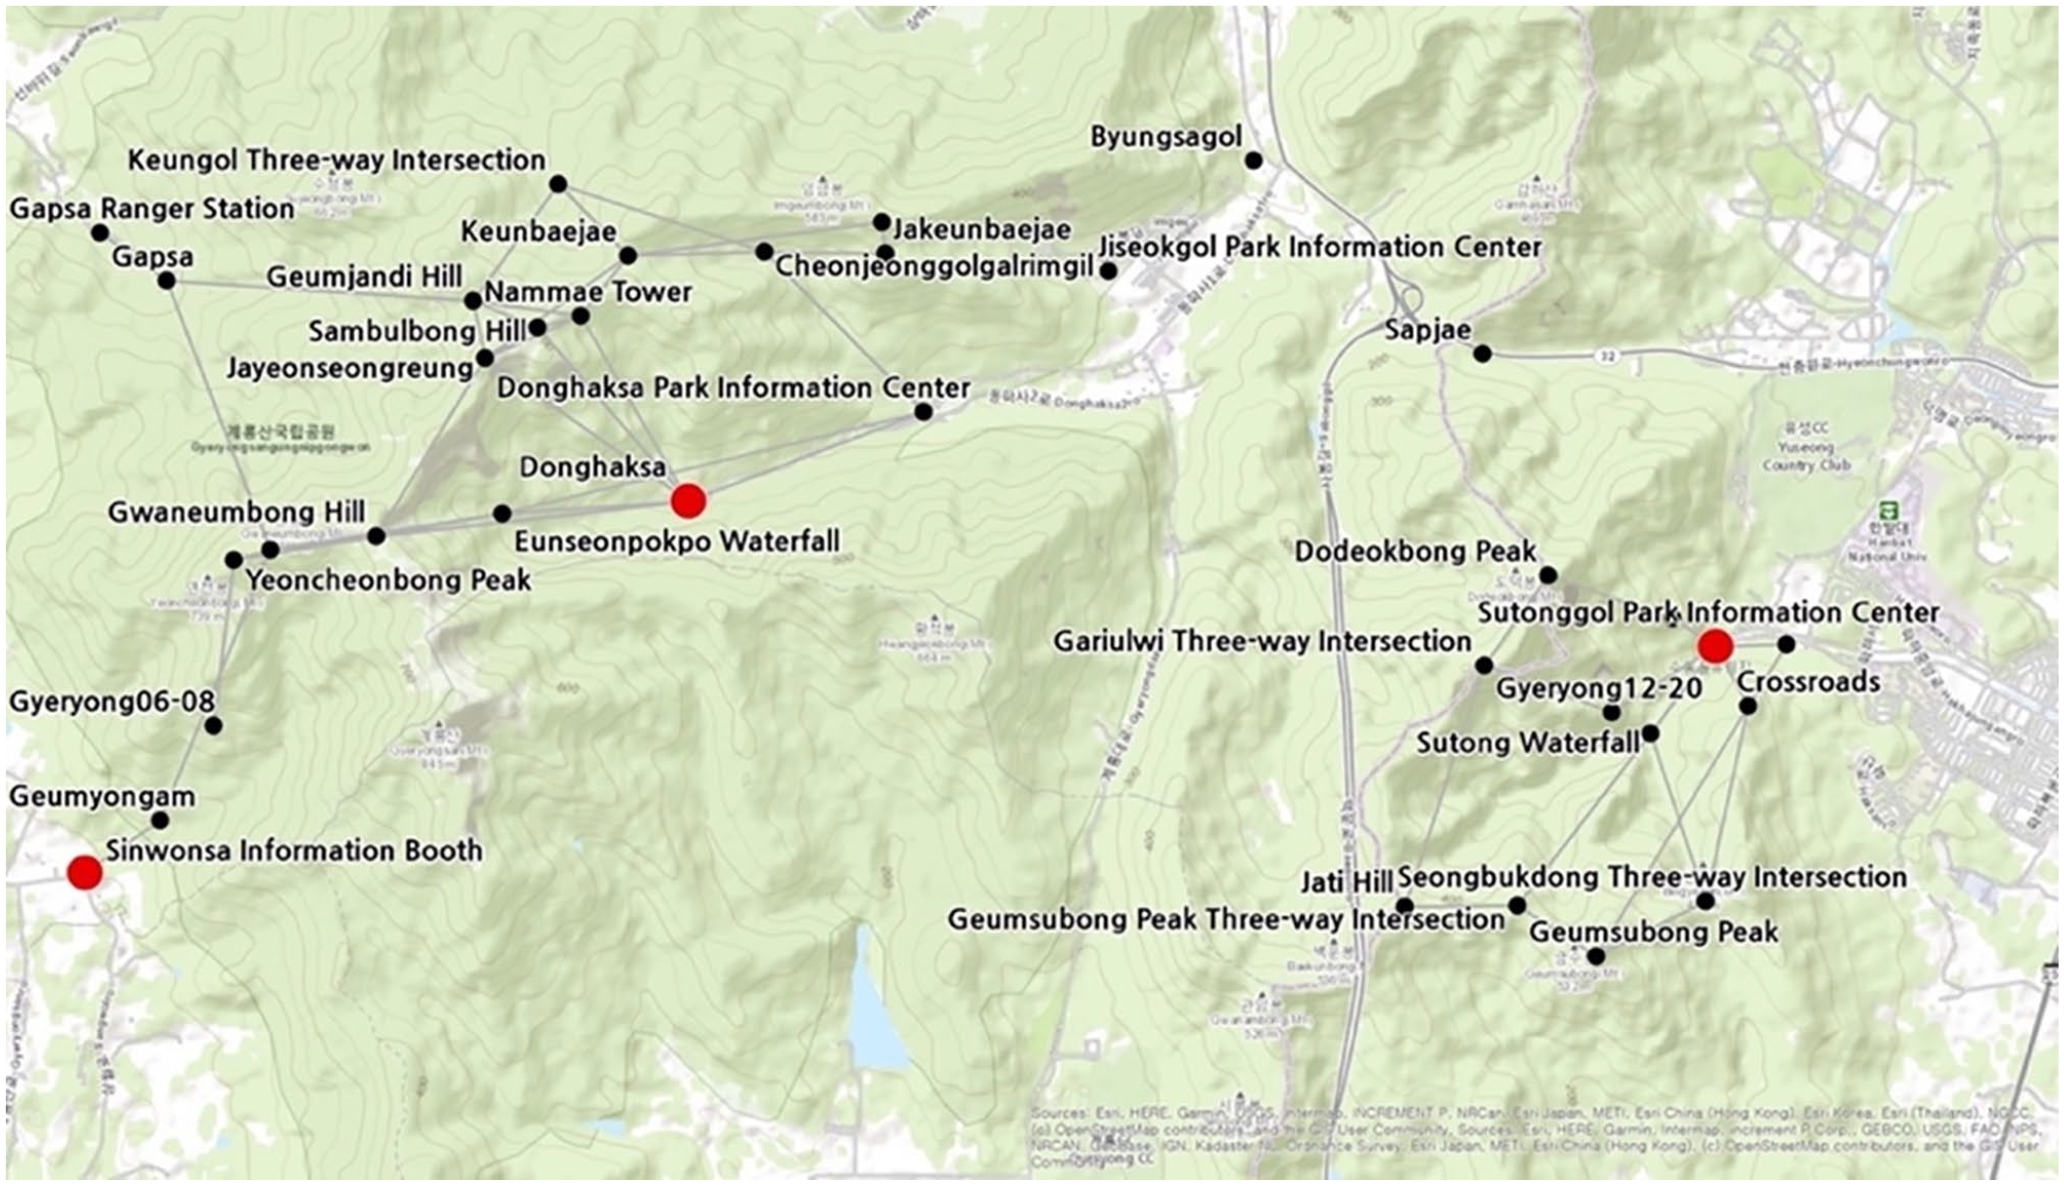
Path analysis for Group 2.
Path analysis for Group 3.
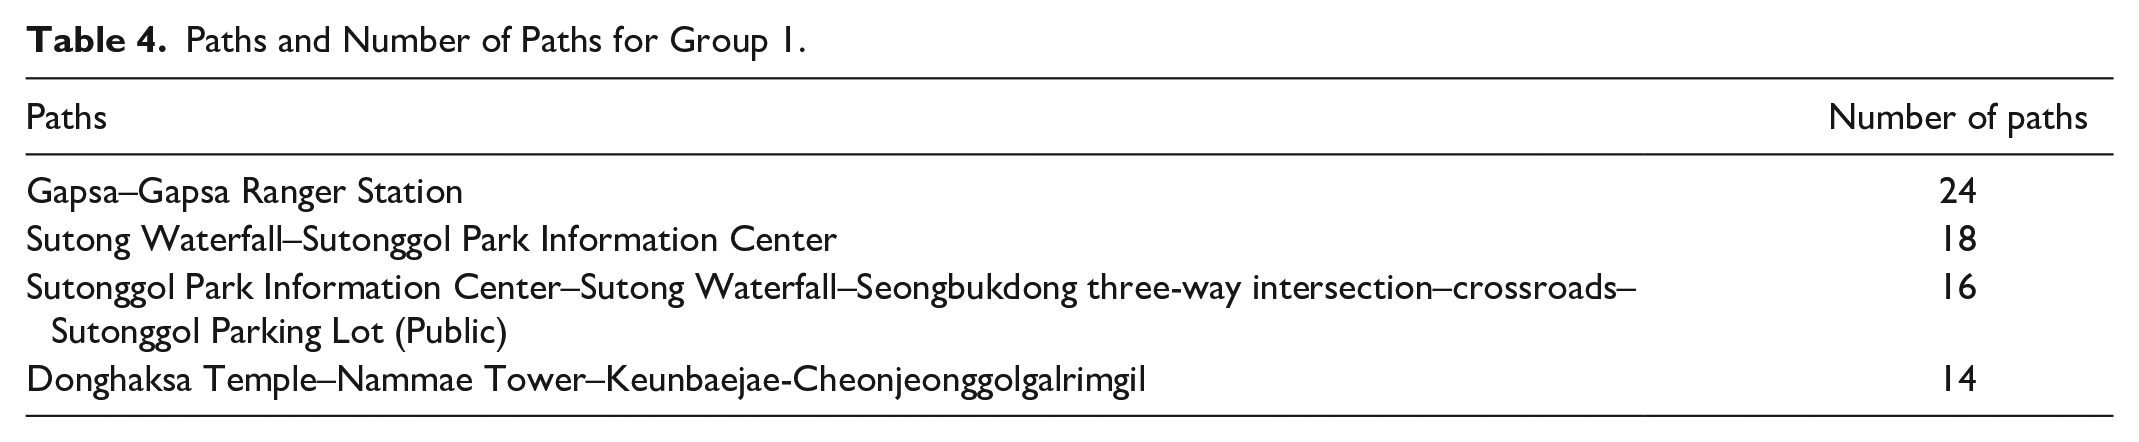
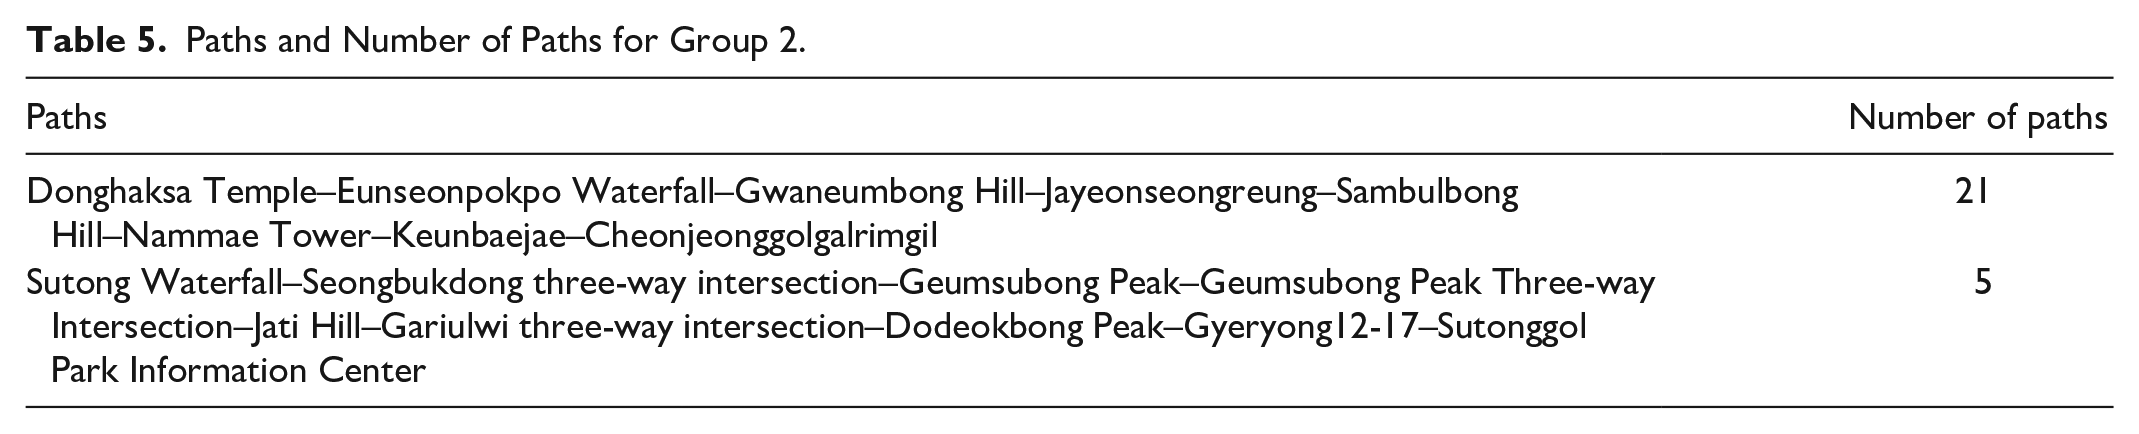
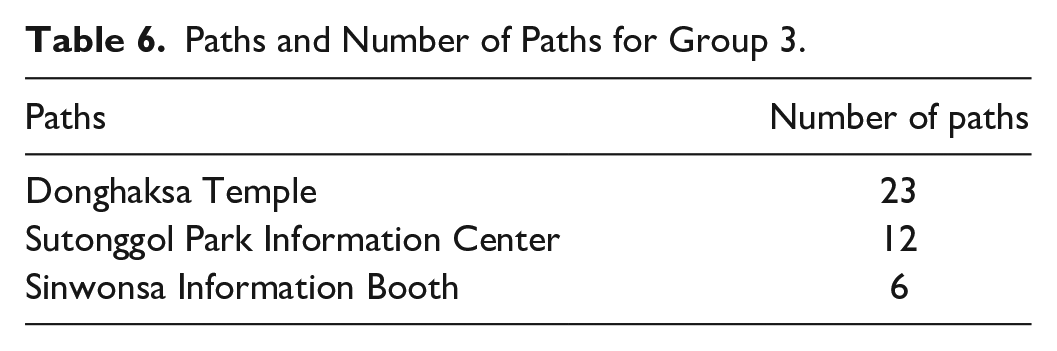
Second, an efficient approach to evaluating path similarity is using a sequence alignment. The representative sequence (i.e., most frequent sequence) was found to represent the characteristics of the group and the highest scoring locations. The principal finding of the SAM analysis was a classification by length of paths visited. Overall, Group 1 took medium distance paths, Group 2 took long distance paths, and Group 3 had short distance visits to only one place. For instance, the representative path of Group 1 had three major departure points (i.e., Gapsa, Sutonggol, Donghaksa) where the participants took medium distance paths for each departure point. Figure 9 shows the path analysis for Group 1 while Table 4 shows the paths and number of paths for Group 1. The representative path for Group 2 took long distance paths that crossed or linked several regions and departed from Donghaksa or Sutonggol Falls (Figure 10 and Table 5). The representative path for Group 3 showed a short distance visit, where the participants stayed at Donghaksa, the Sutonggol Park Information Center, and the Sinwonsa Information Booth (Figure 11 and Table 6).
Paths and Number of Paths for Group 1.
Paths and Number of Paths for Group 2.
Paths and Number of Paths for Group 3.
Specific places were labeled “intersections” that separated the medium- and long-distance groups. The results of the SAM identified the representative intersection and departure points that divided the medium- and long-distance paths. For instance, Donghaksa served as both a starting and intersection point. From Donghaksa, visitors who took medium-distance paths went in the direction of Nammae Tower, whereas visitors who took long-distance paths moved in the direction of the Eunseonpokpo Waterfall. From Sutongol, the Seongbukdong three-way intersection served as the intersection. From this intersection, the visitors who took medium-distance paths moved in the direction of the Sutonggol Parking Lot or Sutonggol Park Information Center while the visitors who took long-distance paths moved in the direction of Geumsubong Peak.
Movement is a significant criterion in tourism, with spatial and temporal patterns including moving distance, moving speed, and moving range (Huang et al. 2020). For the analysis, these three features were used to evaluate the temporal behaviors of visitors. In each group, the means and standard deviations for average travel distance, visit duration, and travel speed were determined. Intergroup comparisons of path length, travel time, and travel speed were performed using one-way ANOVA with the Tukey test. Significant intergroup differences were found for the paths based on the average travel distance, average visit duration, and average travel speed (Table 7).
Results of ANOVA.
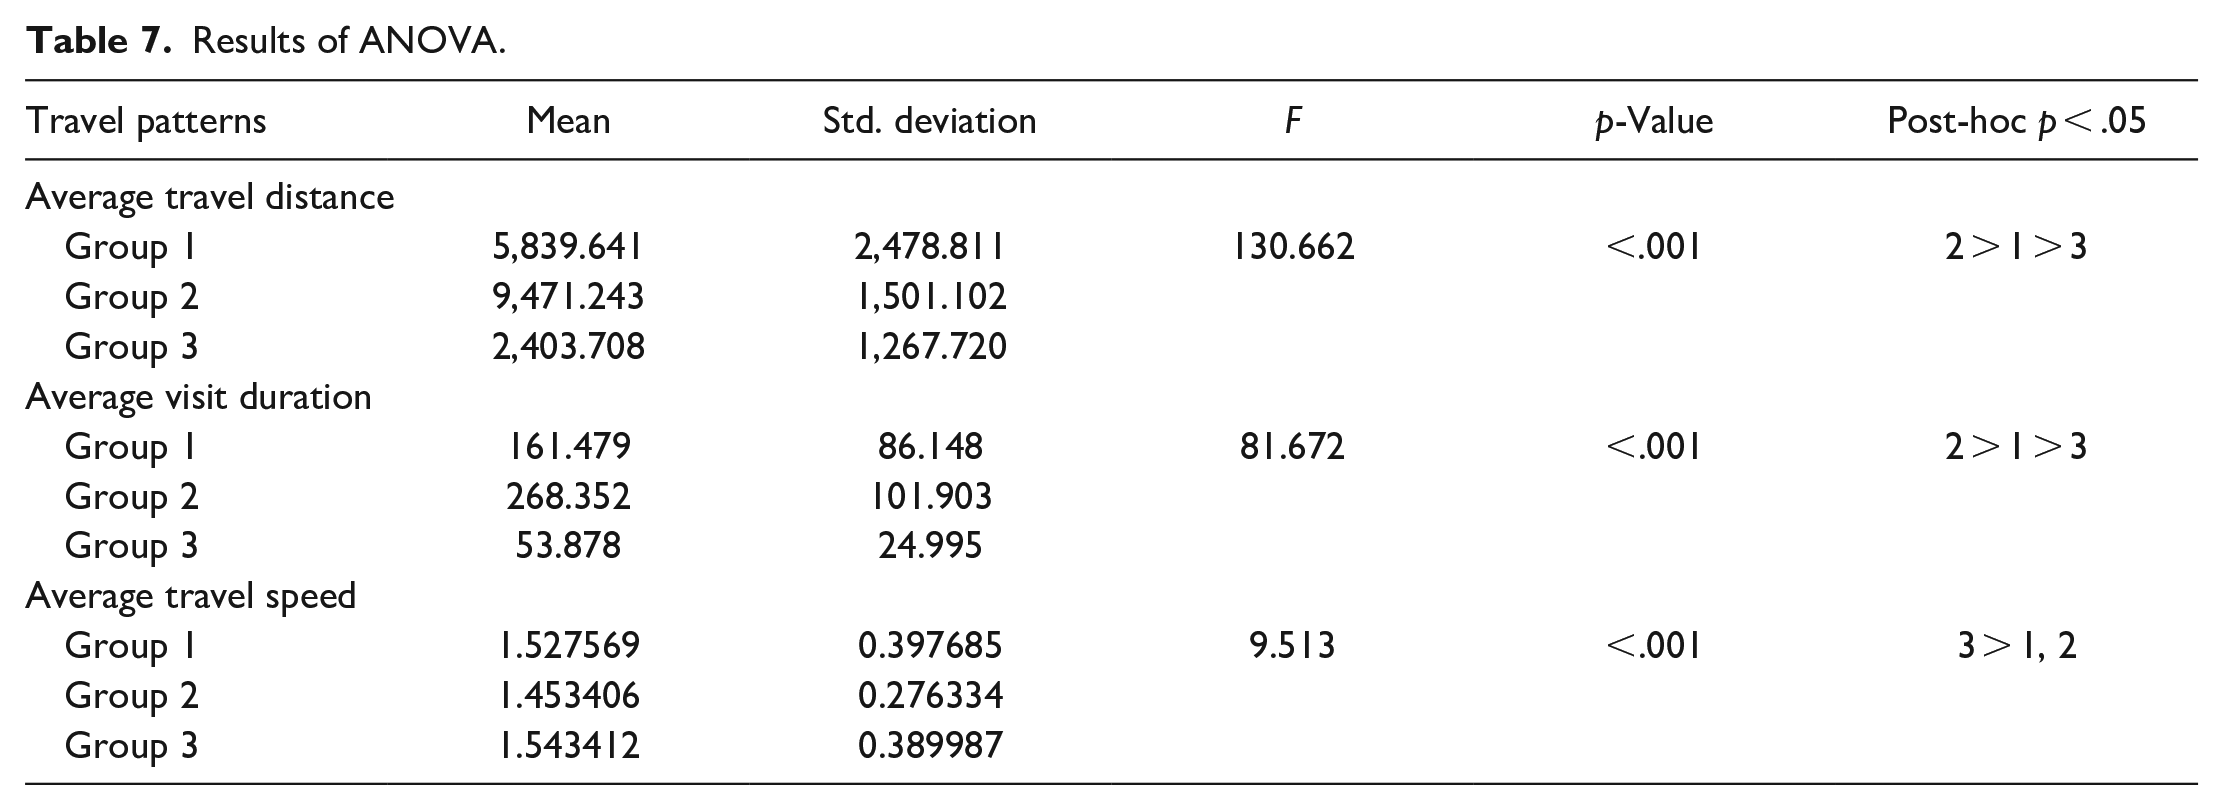
Group 1 showed an average travel distance of 5.8 km, travel time of 162 minutes, and travel speed of 1.53 km/h. These visitors exploring at a moderate intensity level made up more than half of the total sample. Their activities were focused almost exclusively on two to four locations at the park. Group 2 showed an average travel distance of 9.5 km, travel time of 268 minutes, and travel speed of 1.45 km/h. Their journey involved the longest path, longest duration, and slowest speed, reflecting a multi-stop, point-to-point movement pattern. Group 3 showed an average travel distance of 2.4 km, travel time of 54 minutes, and travel speed of 1.54 km/h. Visitors in Group 3 made up the smallest part of the sample. They spent a relatively short time at the park, less than one hour, and stayed in a single, relatively close area. In other words, they demonstrated an intensive use pattern with a special focus on one location at the park, traveling directly to and from one point without stopping at other locations during the trip (Table 7). The means and standard deviations for the average travel distance, visit duration, and travel speed, and the results of the ANOVA were calculated followed by Tukey tests.
Difference in Demographic and Tripographic Characteristics
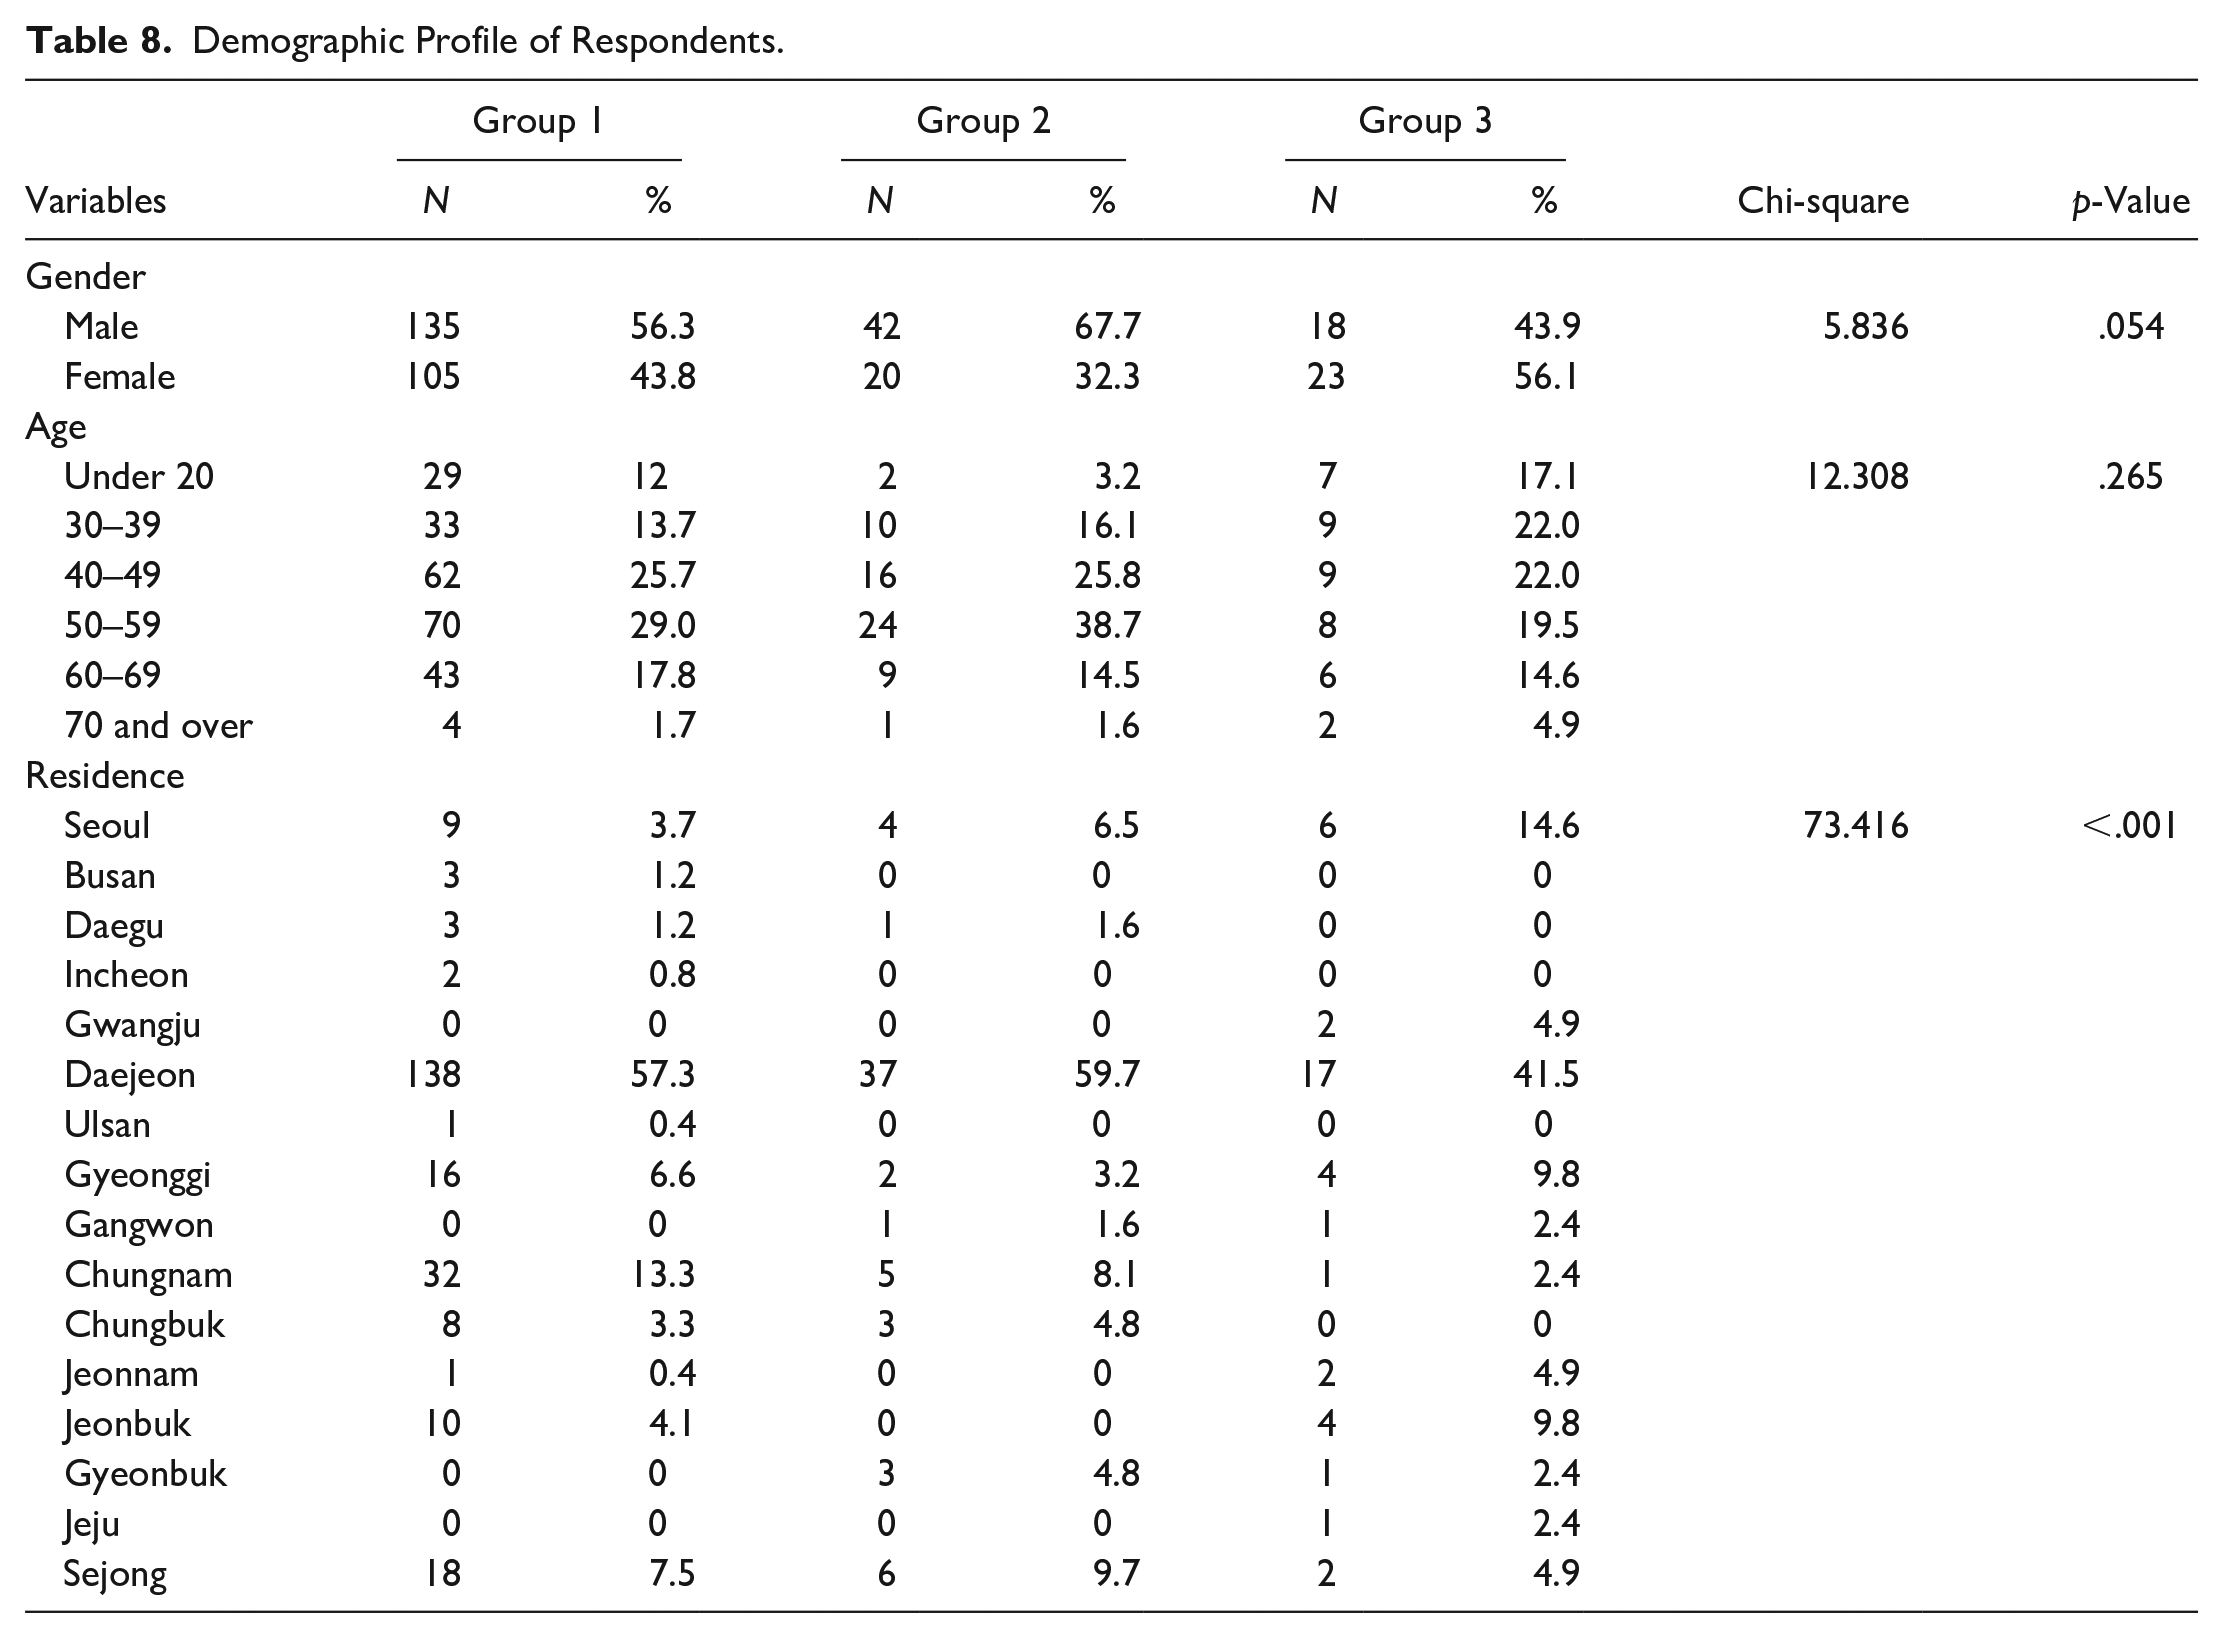
The final stage was intended to reveal whether any relationships exist between the spatial and temporal patterns of the visitors and their characteristics. Of the 344 visitors, there were 241 in Group 1, 62 in Group 2, and 41 in Group 3 (Table 8). A chi-square test was conducted to determine whether significant differences existed in terms of the three groups’ demographic and tripographic characteristics (see below Table 9). Despite no differences in gender and age because of the low number of respondents in each group, the respondents were significantly different when their residence variables were compared. Across Groups 1 and 2, more than half of the visitors came from the Daejeon, Chungnam, and Sejong regions. However, the highest number of visitors in Group 3 came from the Daejeon region, followed by those from the Seoul and Gyeonggi metropolitan areas.
Demographic Profile of Respondents.
Tripographic Profile of Respondents.
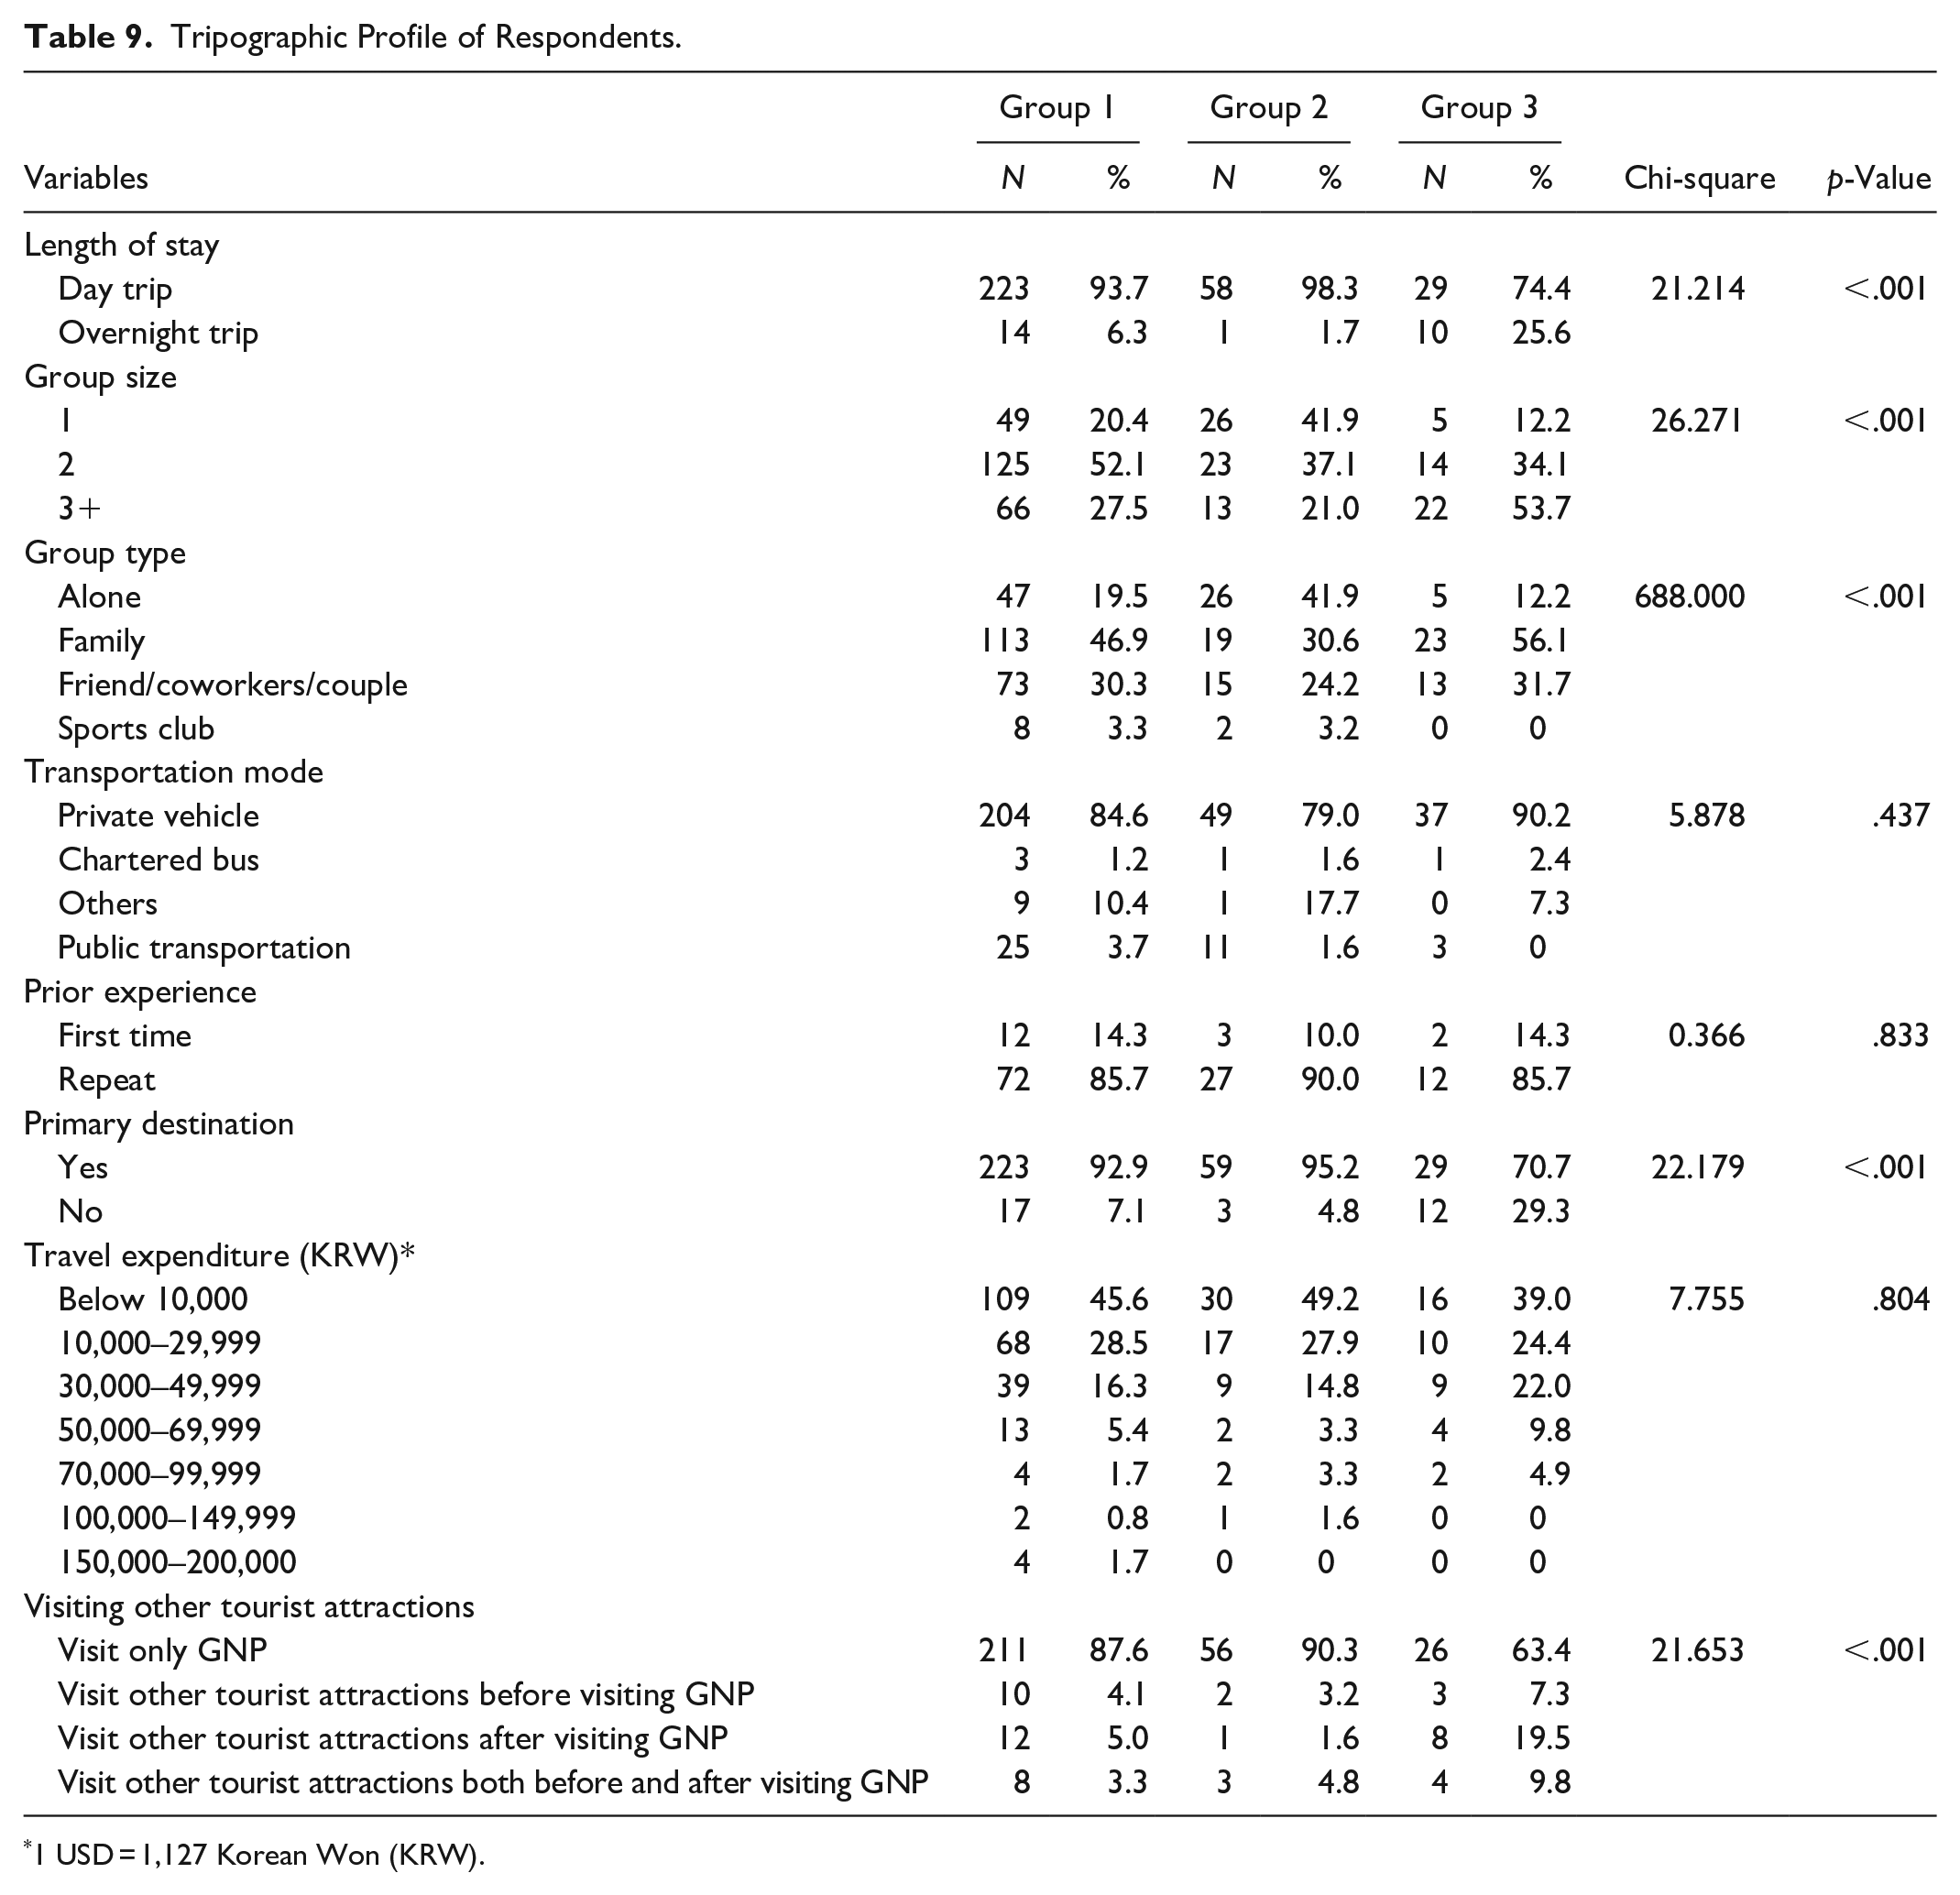
1 USD = 1,127 Korean Won (KRW).
The findings of the study also revealed significant differences in the length of stay, group size, group type, and visiting other tourist attractions variables for each group. As indicated in Table 9, most of the visitors in Groups 1 and 2 visited the park for a single-day trip while a quarter of the respondents in Group 3 visited the park for an overnight trip. The visitor groups were smaller in Groups 1 and 2. The majority of respondents visited the park in groups of two in Group 1 (52.1%) and by themselves in Group 2 (41.9%), while 53.7% of the visitors in Group 3 were part of groups of at least three people. Visitors in Groups 1 and 2 showed similar hiking motivations for visiting the park, whereas Group 3 visited the park to walk to low-lying areas and appreciate cultural assets and/or visit the temple. A total of 41.9% of the visitors in Group 2 traveled alone, indicating that family or friends would not have a significant impact on the spatial and time movements in this group. Single visitors in Group 2 traveled further and spent more time at places than did single visitors in other groups.
With regard to the tripographic characteristics of the visitors in Group 1, the majority came to Gyeryongsan National Park for a day trip in groups of two with family (56.1%) or friends, with coworkers, or as a couple (31.7%). Of the respondents, 92.9% reported the park as their primary destination, and 87.6% of the respondents did not visit other tourist attractions before or after visiting the park. Visitors in Group 2 came to the park for day trips in various group types, such as alone (41.9%), with family (30.6%), or with friends or coworkers, or as a couple (24.2%). Most of the visitors (90.3%) came only to the park (i.e., not visiting other tourist attractions) in groups of two (41.9%) or alone (37.1%). Of the respondents, 95.2% reported the park as their primary destination. Of the respondents in Group 3, 56.1% came to the park with family while 31.7% went with friends or coworkers or as a couple. In addition, 74.4% went for a day trip and 25.6% for an overnight trip. Of the respondents, 70.7% reported the park as their primary destination. A total 63.4% of the respondents visited only the park, while 19.5% traveled to other tourist attractions after visiting the park.
Discussion and Conclusions
Discussion
The findings of this research highlighted the analysis method using SAM in identifying the spatial and temporal patterns of visitors to parks and protected areas on the basis of their unique space–time paths. Generalized typologies of their activities and the characteristics of each group were likewise developed. The derived typologies consisting of three groups showed significant differences in visitors’ spatial and temporal patterns in the attractions and/or stopover points inside the park (i.e., length of paths visited, sequence patterns, departure points, intersection points, primary destination, travel distances, visit duration, travel speeds) and visitor characteristics (i.e., residences, group types, number of people in groups, motivations, visiting other tourist attractions). Overall, the finding of the SAM analysis revealed representative paths for each group with major departure points, representative departure point (Sutongol), and representative intersection point (Seongbukdong three-way intersection). This information divided the medium (i.e., Sutonggol Parking Lot or Sutonggol Park Information Center) and long-distance paths (i.e., Geumsubong Peak).
Remarkably, the significant spatial and temporal differences among the three groups occurred mainly in the actual sequence patterns of their visits inside the park (i.e., the order that they visited and the paths they took), and this facet was well-described by the SAM. The spatial and temporal differences identified in this study were similar to those differences reported in Shoval and Raveh (2004). This view corresponds to what Keul and Kühberger (1997) concluded in their prior study on the significance of the space–time sequences of visitors. It also showed that visitors’ individual preferences, goals, and plans are less relevant than their spatial and temporal sequences when they determine their behaviors onsite. These findings further support the idea of Ramkissoon, Mavondo, and Uysal (2018), who suggested that generating meaningful visitor types can inform management decisions associated with resource protection and provision of quality experiences by applying classification techniques that are rarely used in the spatial and temporal context.
In terms of geographic distance, while the visitors in Groups 1 and 2 for day trips were from nearby regions (i.e., Daejeon, Chungnam, Sejong) and did not travel to other tourist attractions, one-fourth of the visitors in Group 3 came from far metropolitan areas (i.e., Seoul, Gyeonggi) and stayed overnight and visited other tourism destinations near Gyeryongsan National Park. Geographic distance is considered to be one of the most significant variables influencing length of stay (Nicolau, Zach, and Tussyadiah 2018). The findings of the current study are consistent with the distance decay theory supported by previous studies that confirm visitors traveling a longer distance to a location will stay longer at that location to feel as if they are maximizing the value of their stay (Jackman et al. 2020).
An additional issue emerging from these findings is where the visited length of path is linked to group size/type and visiting other tourist attractions variables. The findings revealed that the majority of the Group 1 respondents visited Gyeryongsan National Park in groups of two and most Group 2 visitors came alone, while half of the visitors in Group 3 were part of groups of at least three people, including family, with the intent to walk to low-lying areas and appreciate cultural assets and/or visit the temple. In particular, the visitors in Group 3 toured the park for less than one hour and demonstrated an intensive use pattern with a special focus on one location at the park. Group 3 traveled directly to and from one point, without stopping at other locations during the trip, and visited other tourist attractions before and/or after visiting the park. It is further shown that the visitors in Group 3 came to the park to appreciate the beautiful scenery of Donghaksa Gorge and the historical and cultural relics of the temple, which has been there for more than 1,000 years. The path to Donghaksa Temple is easy to hike with gentle slopes and suitable for family visitors in Group 3.
This study presents a new methodology by which to obtain knowledge fundamental to the understanding of current topics in parks and protected areas management, such as enhancing visitor experiences and monitoring visitor impacts on resources. The findings of this study showed that paths most often visited were in areas close to the viewpoints, rest areas, information centers, and landmarks. These highest use paths are related to the management of visitors, resources, facilities, and emergency safety. With this understanding, this study can help park managers and tourism authorities gain better knowledge of the profiles, behaviors, needs, and trends of visitors and facilitate the design of destination attributes to allocate resources to serve conservation values and respond to the unique preferences of visitors. Prior studies have noted the importance of effective strategies in national parks that need to manage visitors and minimize the impact on resources through the comprehension of visitor behavior, ultimately maintaining visitor experience quality in national parks (Choe 2016; Choe and Schuett 2020; Ramkissoon, Graham Smith, and Weiler 2013). The quality of natural resources, as well as the experiences of visitors within parks and protected areas, is significantly impacted by the spatial and temporal behaviors of visitors (Kidd et al. 2018). As suggested by Ramkissoon, Weiler, and Smith (2012), environments in protected areas may be improved, loyalty to national parks may be promoted, and consequently, future generations may be generated by leveraging understandings of visitation patterns.
Theoretical Implications
The main theoretical contribution of this study is in expanding the application of the concept of space–time path of time geography by providing methodological improvements, using SAM and GPS analysis, of the theoretical basis of time geography, which is the basic spatial and temporal analysis of human activities. In the traditional method, spatial patterns were visually analyzed through spatial visualization and analysis of the trajectory. Difficulties arise, however, when an attempt is made to analyze a large number of trajectories owing to limitations in visual identification of overlapping and cluttered trajectories. The method used in this study could overcome the limitations of the traditional analysis method by converting the trajectory into a sequence and grouping patterns through the similarity of the sequences. This study also contributed to the area of automatic GPS trajectory data collection by expanding the scope of analysis in time geography. In time geography, surveys are conducted to analyze the spatial patterns in a traditional manner. However, recent advanced tracking technologies of automated GPS data collection have become powerful tools for time–geography analysis, ensuring both data efficiency and accuracy through fast cycle times and quality assurance.
The results of this investigation identified visitors’ movement patterns, both spatial and temporal, which have not been sufficiently emphasized (Liu, Huang, and Fu 2017; Shoval and Raveh 2004). The study confirms that space and time sequences of visitors are more significant than visitor characteristics, supporting the studies of Shoval and Raveh (2004) and Keul and Kühberger (1997). The findings highlight that the significant spatial and temporal differences among the three groups are mainly in the actual sequence patterns of their visits inside the park. Tourism attractions and/or stopover points inside the park characterized by the similar length of paths visited and sequence patterns were identified as well as the areas of most often visited paths. As a result, this study was able to demonstrate a tendency toward the spatial concentration of clustering, which is closely related to park facilities (i.e., rest areas, information centers) and the growing demand for the iconic nature of many tourism attractions (i.e., viewpoints, landmarks). These results provide further support for the findings that the spatial model of the central spaces of tourists effectively describes the development of spatial knowledge of tourists in protected areas.
The findings of this study have a number of methodological implications for the spatial and temporal patterns of tourists. First, the methodological value of SAM analysis makes it an insightful tool to better comprehend visitor behaviors based on spatial and temporal patterns, because the SAM can be successfully adopted in a park setting. Prior studies focused on either the spatial pattern of visitors using questionnaires or the temporal patterns of visitors with time-series land cover data. However, since GPS devices can record all changes in the spatial and temporal data of visitors, the current study was able to further analyze the spatial and temporal patterns of the visitors by applying the SAM to a protected area setting and context. Therefore, this study presents a method and example that can simultaneously analyze spatial and temporal patterns by combining GPS and SAM analysis, thereby creating tourist typologies of space-time activities. Distinguished by unique spatial and temporal patterns and sequential movements, the use of SAM in this study revealed 83 unique paths from the 341 sequences. The variations of behavioral patterns tracked in this study revealed that SAM has the ability to detect and extract hidden sequence patterns in the data and present new ways of analyzing the sequential aspects of the data.
Second, by using a digital data collection method (GPS) and sampling (mobile positioning data), this study obtained more accurate results than traditional quantitative methods would have, to construct a fine resolution of spatial and temporal data. In particular, this study is important in that digital data have grown in importance as a novel technology to apply toward identifying the movement information of individual units for public purposes. Furthermore, this study shows that the sample populations obtained using mobile positioning data can successfully represent a national sample and reduce sampling error by estimating the target population using mobile positioning data from a telecom company. It is believed that the exact spatial and temporal patterns of visitors can provide fundamental knowledge for park management, facility planning, and public area analysis as well as community recreation planning. Mobile positioning data also has the ability to create tourism statistics that can assist in developing park management strategic plans.
Third, the analytical framework for the data integration between the objective GPS tracking data and subjective survey data provides an insight into visitors’ spatial and temporal patterns and experiences in use-related contexts. This information can help planners avoid excessive exploitation of natural resources in protected areas (Risteskia, Kocevskia, and Arnaudov 2012). Linking GPS and survey data could leverage both types of data, which could also be expanded to the knowledge base regarding the spatial and temporal patterns, values, activities, and management preferences of visitors; improve efficient allocation of resources; and create the value of competitiveness of destinations through the integration of tracking methods, such as mobile positioning data, mobile phone GPS, and Bluetooth beacons.
Practical Implications
First, a major implication of the findings is that the representative paths and major intersections can be used to establish strategies for the allocation of human resources in major locations to make sustainable use of the resources and develop destination management planning. Park managers can utilize these findings to discover how visitors are using resources, how efficient resource allocations are in prioritizing destination attributes, and how current problems are handled in park management, regarding issues such as visitor experiences, resource impact, and social conditions (D’Antonio et al. 2013; Hallo et al. 2005). Furthermore, the results of this study help address the key issues of identifying non-preferred paths and developing new paths that consider the needs of visitors, including trail improvements, decreasing impact on resources, and resource allocations. For example, referring to the official website of the Korea National Park Service, two hiking paths are recommended regarding Sinwonsa. However, the results of the SAM revealed that the Sinwonsa Information Booth was only related to the short distance visits of Group 3, showing that not many visitors prefer to use Sinwonsa as a departing point for their medium- and long-distance path visits. The current study makes several noteworthy contributions to the development of destination management in that the proposed methodology can identify the highest used paths and intersection points appropriate for approach, reach, manipulation, and use with regard to the spatial and temporal patterns of visitors. It can also help determine the representative path, attractions, and representative routes that readerships, visitors, and park managers can explore. Specific attributes of protected areas may be marketed as central attractions to bring in more visitors (Ramkissoon, Graham Smith, and Weiler 2013).
Second, the combined results of GPS and SAM analysis can help predict and design visitation circuits and activities. In this way, integrated management systems can be developed for park resources and facilities to target different groups, enhance visitor satisfaction, reduce resource damage by dispersing visitors in concentrated areas, and predict visitor congestion. This work contributes to existing knowledge affecting park management policies by identifying the visitors’ spatial and temporal patterns, including the highest paths, departing points, intersections, dangerous areas, viewpoints, and rest areas in the park. The sequences of movements that indicate the links between travel to and from different neighborhoods, once understood in full, can help managers and policymakers develop destination competitiveness, improve management strategic decisions, and identify priorities for efficient resource allocations. They may also be able to determine a degree of predictability about the values, activities, and management preferences of visitors. In addition, determining less visited areas and developing new areas for balance in tourism development strategies may help support less developed areas and improve positive impacts on the tourism industry and the local economy (Ferguson 2017).
Finally, generalized typologies combining visitors’ activities that are clearly based on the sequences of their movements, offer valuable knowledge for park managers and marketers for creating promotions (i.e., advertising, public relations, promotional strategy) by offering reliable visitor profiles and preferences in park usage. Such knowledge can also assist destination management organizations and developers in designing and implementing strategies more effectively. For instance, the characteristics of the three groups in terms of sequences, travel distance, and travel speed will help park managers distinguish between active and inactive visitors (i.e., high and low intensity levels). Similarly, the temporal aspects of visitors’ behaviors offer evidence about how much time visitors spend at the park. For example, this study indicated that there were more family visitors than individual visitors during the day. Therefore, it would be important to tailor facilities and services to better target this particular traveler group and attract this target market in off-peak times with events and programs to disperse visitors more widely.
Limitations and Future Research
Despite the significance of this research, there are several limitations. First, the impact of the spatial and temporal path directions’ alignment outcome has yet to be explored. For instance, in this study, the path A→B→C and the path C→B→A were dealt with differently. If the direction of the path was to be discounted, then the results of the analysis may generate different findings. Second, the current research is limited in that GPS tracks were cleaned manually, a labor-intensive, human-based task that can generate errors. Several steps were used in this study to maintain consistency; however, an automated or program-based cleaning process would provide more accurate data (Stamberger et al. 2018). Third, due to having to carry the GPS logger, there might be some potential inconveniences to the participants. For example, time and human resources were necessary to monitor the distribution and return of the GPS loggers at the park information centers. High cost of the device, battery life, size, and time necessary to program the device were also inevitable disadvantages of using the GPS logger during this research phase.
Another limitation of the study is that the sample size and characteristics were predetermined according to mobile positioning data to reduce sampling errors. The collected data may not represent international visitors, although in this case, only 5% of the national park visitors were international. In addition, this research was limited to Korean national park visitors. Future studies should apply this proposed method using different populations in different destinations to embrace more international views and interactions on this topic. Thus, future studies should have larger sample sizes and more diverse population groups. Future research may also compare the estimates from the SAM results with the spatial and temporal distribution of future patterns to predict tourist movements using Markov chains.
As the social interest in and value of mobile positioning data increases, research on the analysis and utilization of such data is vital. Thus, further research should use mobile positioning data to analyze the spatial and temporal patterns of visitors in order to develop management policies, for example, for meeting the needs of visitors, enhancing park use convenience, and contributing to local economic impacts relating to the movements of humans, wildlife, and logistics.
Finally, this research was conducted before the Coronavirus (COVID-19) outbreak. Clearly visitors’ spatial and temporal patterns and the ability of people to travel has been, and will continue to be, dramatically impacted by the pandemic (Choe, Wang, and Song 2021). Korea has experienced a boom in domestic travel since COVID-19 brought a sudden halt to international travel, though Korea is one of the countries least seriously affected by the pandemic. Notably, the pandemic has reshaped Koreans’ spatial and temporal patterns, with the increasing number of tourists into natural areas, camp sites or stay in luxury hotels, take road trips, and travel alone (Wang, Choe, and Song 2021). Therefore, the results of this study warrant a cautious interpretation and should be adopted with a great care.
Footnotes
Declaration of Conflicting Interests
The author(s) declared no potential conflicts of interest with respect to the research, authorship, and/or publication of this article.
Funding
The author(s) disclosed receipt of the following financial support for the research, authorship, and/or publication of this article: This work was supported by the Ministry of Education of the Republic of Korea and the National Research Foundation of Korea (NRF-2017S1A5B5A01023368). The authors would like to thank the Korean National Park Service for sharing the data utilized for this study.