
Abstract
Water services in India are typically known to have high levels of coverage yet relatively lower levels of service and quality. Through a study based on primary data from Lucknow and Kanpur districts of Uttar Pradesh, this article attempts to find determinants of accessing drinking water from within a household’s premises. In terms of achieving sufficiency, the percentage of households getting sufficient water throughout the year is reported to be the highest for bore-well and the lowest for public taps. Our analysis shows that disadvantaged and lower income groups have to face greater hardship in accessing drinking water compared to upper caste and upper income groups. Education, income levels of the households, occupation and the size of the family are important socio-economic factors affecting access to drinking water within premises. Since disadvantaged groups have to face great hardship in accessing drinking water as compared to upper caste communities, it is suggested that policymakers should formulate people-centred policies while looking at the supply of water rather than target-oriented ones.
Introduction
Access to drinking water by a growing population is one of the major concerns facing the world today. The problem has been aggravated over the years due to inadequate efforts made by the government to deal with this issue, particularly in less developed countries. The demand for water is growing three times faster than the growth of population and it is estimated that by 2025, the population deficient in water would have increased from 450 million to about 3,000 million based on business-as-usual projections (Kundu & Thakur, 2006). Though the status of provision of water and sanitation has improved, albeit slowly, inadequate and poor quality of drinking water has not only resulted in more sickness and death, but has increased health costs, caused low worker productivity and school enrolment (Haq, Mustafa & Ahmed, 2007).
Water supply is a state subject, whereas the central government is only responsible for setting water quality standards. In many regions, the state government has to establish departments or special agencies to supply of domestic water to urban and rural areas. These government agencies are also responsible for monitoring the quality of water supplied (Srikanth, 2009). The main agency for both urban and rural water supply in the state of Uttar Pradesh is the Uttar Pradesh Jal Nigam (UPJN) which is constituted as an autonomous corporation but works under the control of the state government (GoI, 2007).
Access to piped water is highly differentiated. These facilities are more readily available to higher income households, while poor households have to depend on public taps and hand-pumps. Equity in access to drinking water is a matter of minimum assurance to all for water is required for livelihood needs irrespective of their socio-economic status (Kulkarni, 2011). The global burden of poor access to safe drinking water and sanitation falls primarily on the poorest of the poor (Phansalkar, 2007). The poor are more susceptible to ill-health than others because of their lack of access to adequate safe water, malnutrition and unhealthy living conditions (Hussain, Regassa & Wijerathna, 2003; Jha, 2010; Johnstone, 1997). These inequalities have an important bearing on human development because of their association with the distribution of opportunity for survival, education, poverty and income (UNDP, 2006).
In this context, the article analyses the accessibility of drinking water facilities in Uttar Pradesh on the basis of census data and compares it with primary data to study the present situation in terms of the duration of water supply, its quality, sufficiency and so on. It also examines existing inequities in drinking water. However, the focus of the article is particularly on socio-economic factors which determine the availability of a particular drinking water source or a drinking water facility within premises.
The study is based on both primary and secondary data. Primary data from 200 households have been collected from Lucknow and Kanpur districts of Uttar Pradesh in 2011 through the uniformly designed structured interview schedule. Water is a state subject and there is one policy for the whole state. At the state level, the capital works are carried out by UPJN, whereas the operation and maintenance is carried out by different Jal Sansthans at the city level—the Kanpur Jal Sansthan in Kanpur and Lucknow Jal Sansthan in Lucknow. To see the differences in the implementation of policy, two cities are selected. A multi-stage sampling technique is employed for the selection of households. Household in the present study is considered as the unit of analysis. The Herfindahl index 1 has been used to measure the inequities of drinking water sources among different social and income groups. The bivariate analyses followed by multinomial logistic regression are used here to study determinants of drinking water source.
The article is divided into six sections including the introductory section. The second section presents the existing drinking water facility in Uttar Pradesh. Current status of urban water supply has been analysed in the third section, while the fourth section measures inequality in access to drinking water among different socio-economic groups. The determinants of drinking water facility have been presented in the fifth section. Finally, the last section provides a summary of the present study and its main conclusions.
Drinking Water Facility in Uttar Pradesh
The Government of India considers only taps, tubewells and hand-pumps as potable sources. According to the definition by the Census of India, if a household has access to drinking water from a tap, tubewell or hand-pump situated within or outside the premises, it is considered as having access to safe/improved drinking water (Lohia, 2006). Typically, water services in India are characterised by high levels of coverage but the accessibility component includes distances travelled to the source of drinking water, and further, whether the source is shared with other households or community or for exclusive use of households (NSSO, 2010).
As per the 2011 Census, 88 per cent households of Uttar Pradesh have access to safe drinking water, but this coverage only indicates the percentage of households using potable sources for their drinking needs. Only about 52 per cent households have drinking water facilities within premises. About 44 per cent rural households and 79 per cent urban households get their drinking water within their premises (Table 1).
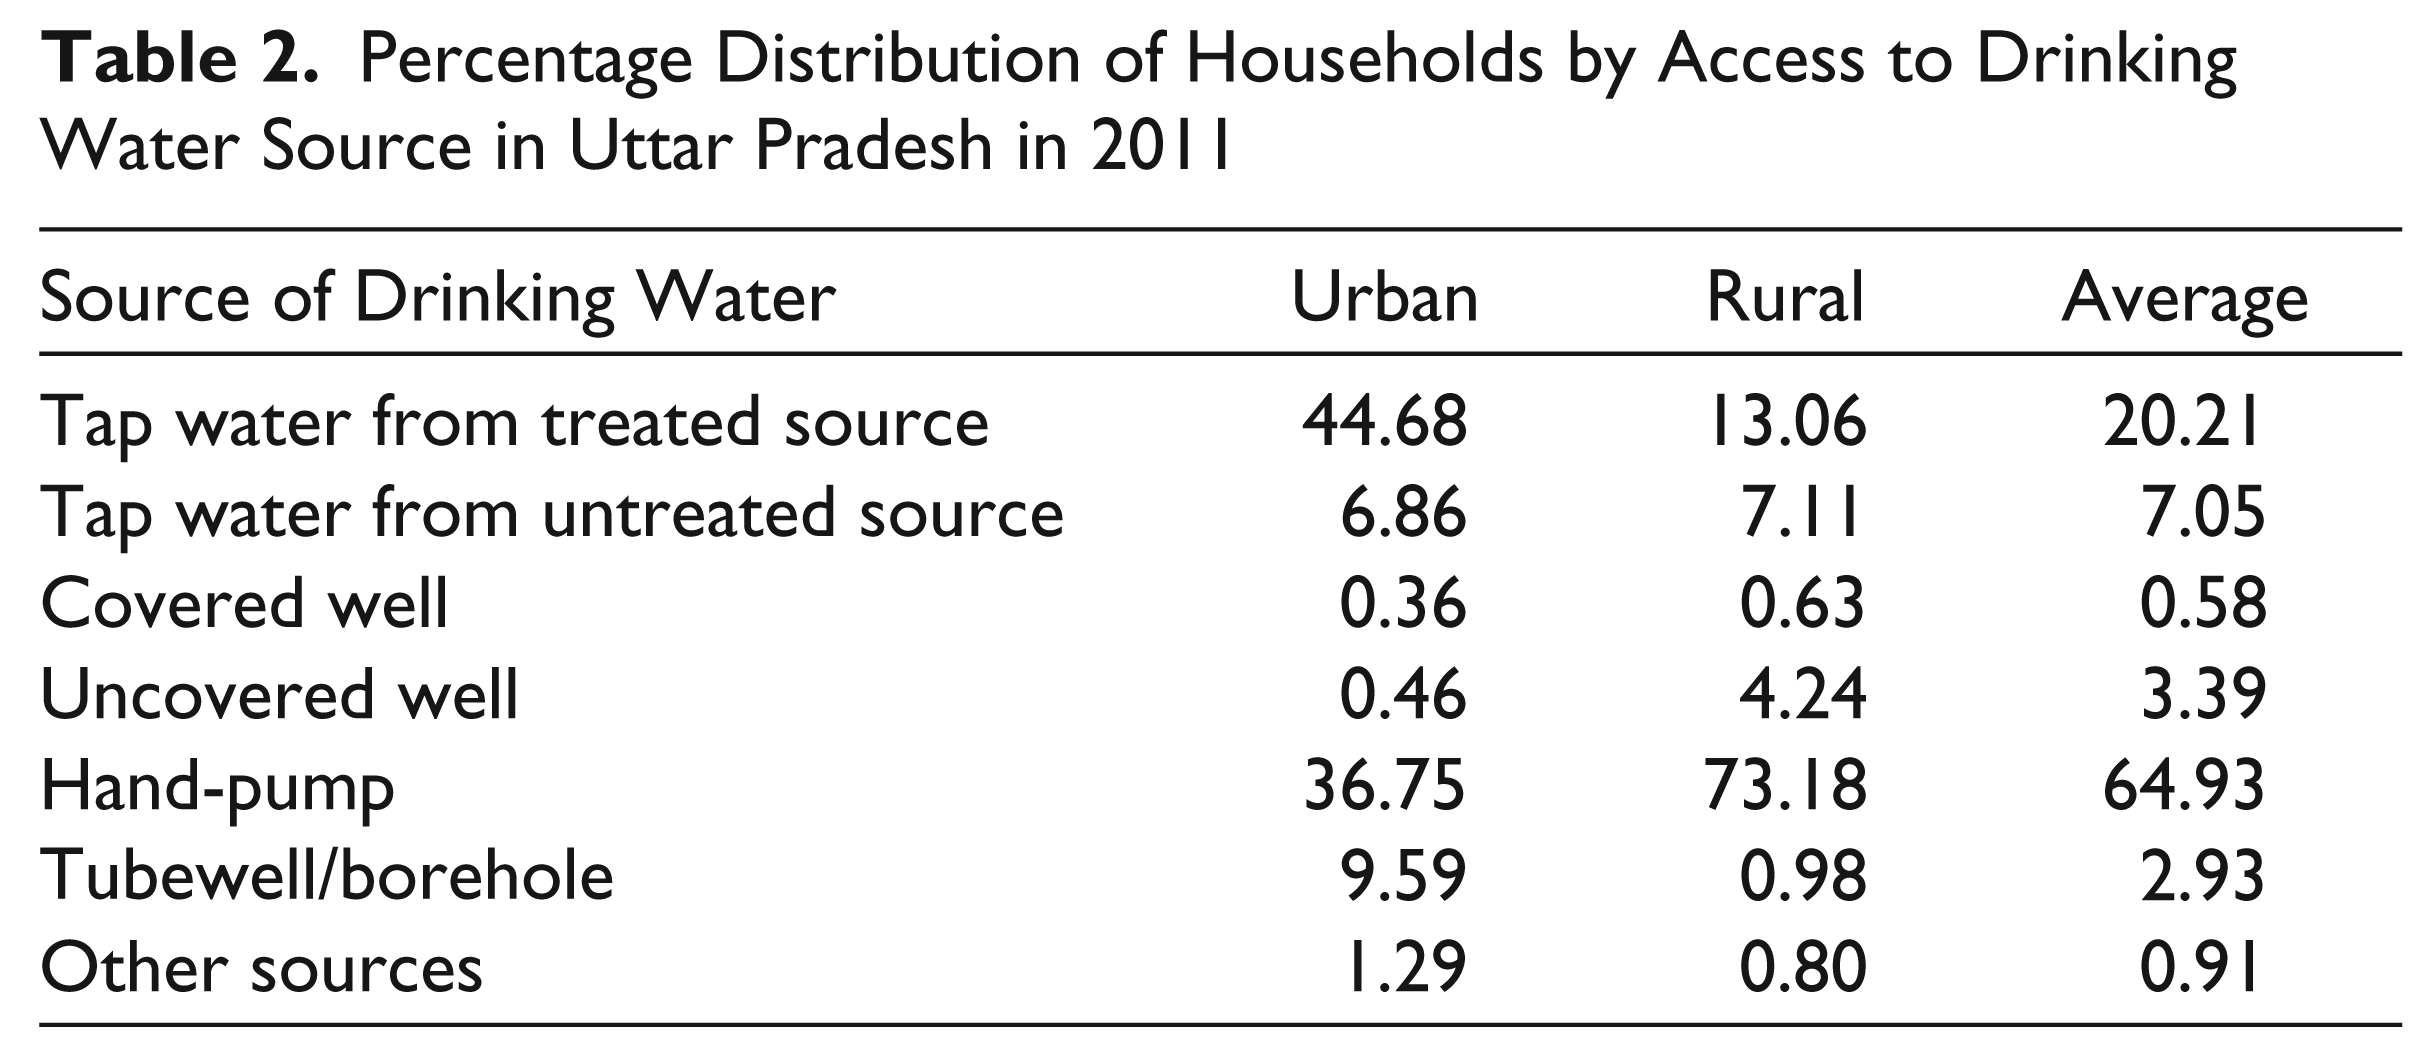
There are also significant disparities between rural and urban areas with regard to access to drinking water source. About 44 per cent urban households obtain their drinking water from tap water from treated source, while only 13 per cent rural households obtain drinking water from tap water from treated source. On the other hand, the percentage of rural households is more than urban households in case of tap water from untreated source. It may be noted that about 74 per cent rural households and 46 per cent urban households depend on tubewell or hand-pump as their main source (Table 2). This means that the main source of drinking water in rural Uttar Pradesh is the hand-pump, while in urban Uttar Pradesh it is tap water/hand-pump. Though providing water via public taps and hand-pumps is important but it may not be up an adequate facility because of the attendant health risks as also the time lost in collecting water (Paul Balakrishnan, Gopakumar, Sekhar & Vivekananda, 2004; Seetharam & Rao, 2009; WSP Study, 2011).
Location of Water Sources by Households in Uttar Pradesh (in per cent)
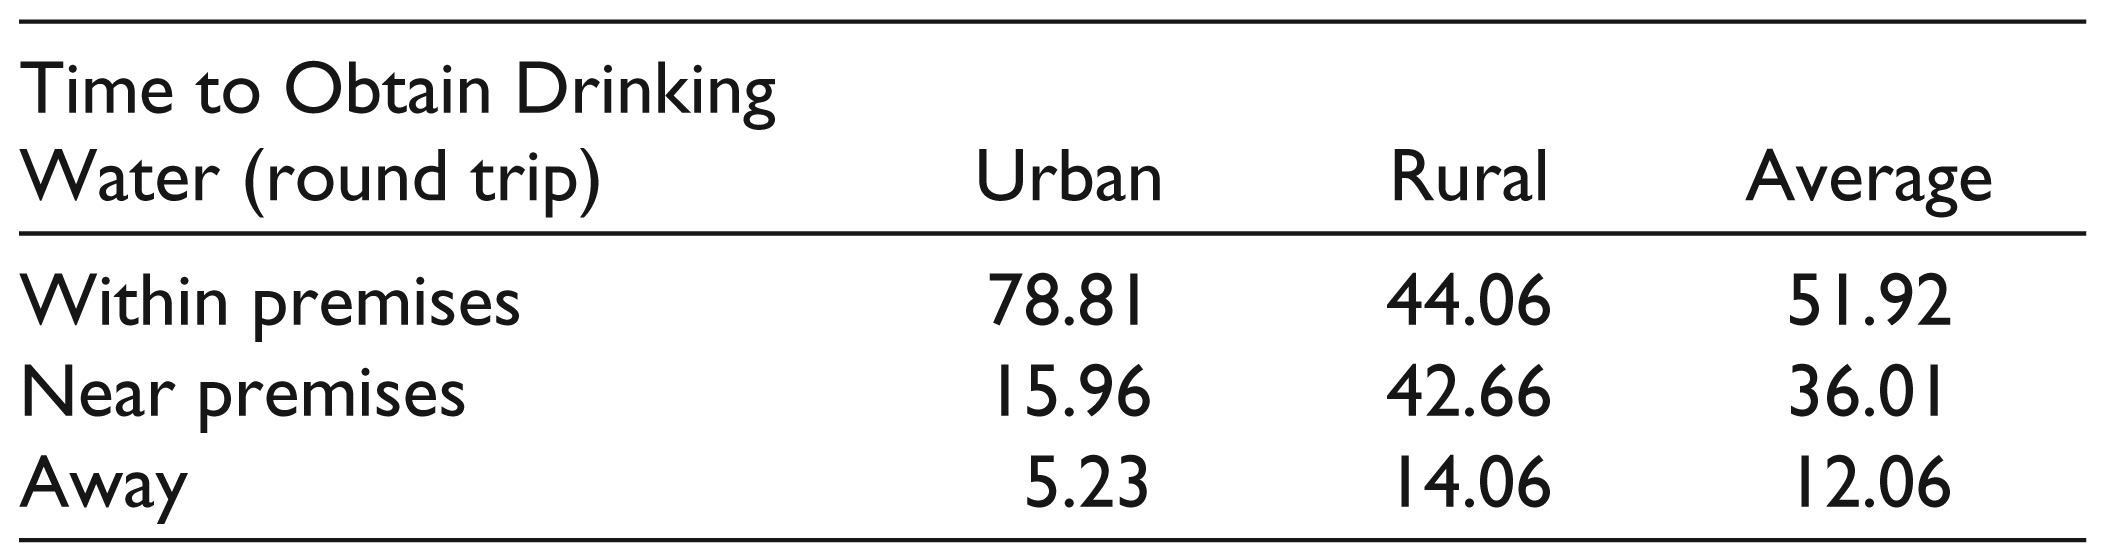
Location of Water Sources by Households in Uttar Pradesh (in per cent)
Percentage Distribution of Households by Access to Drinking Water Source in Uttar Pradesh in 2011
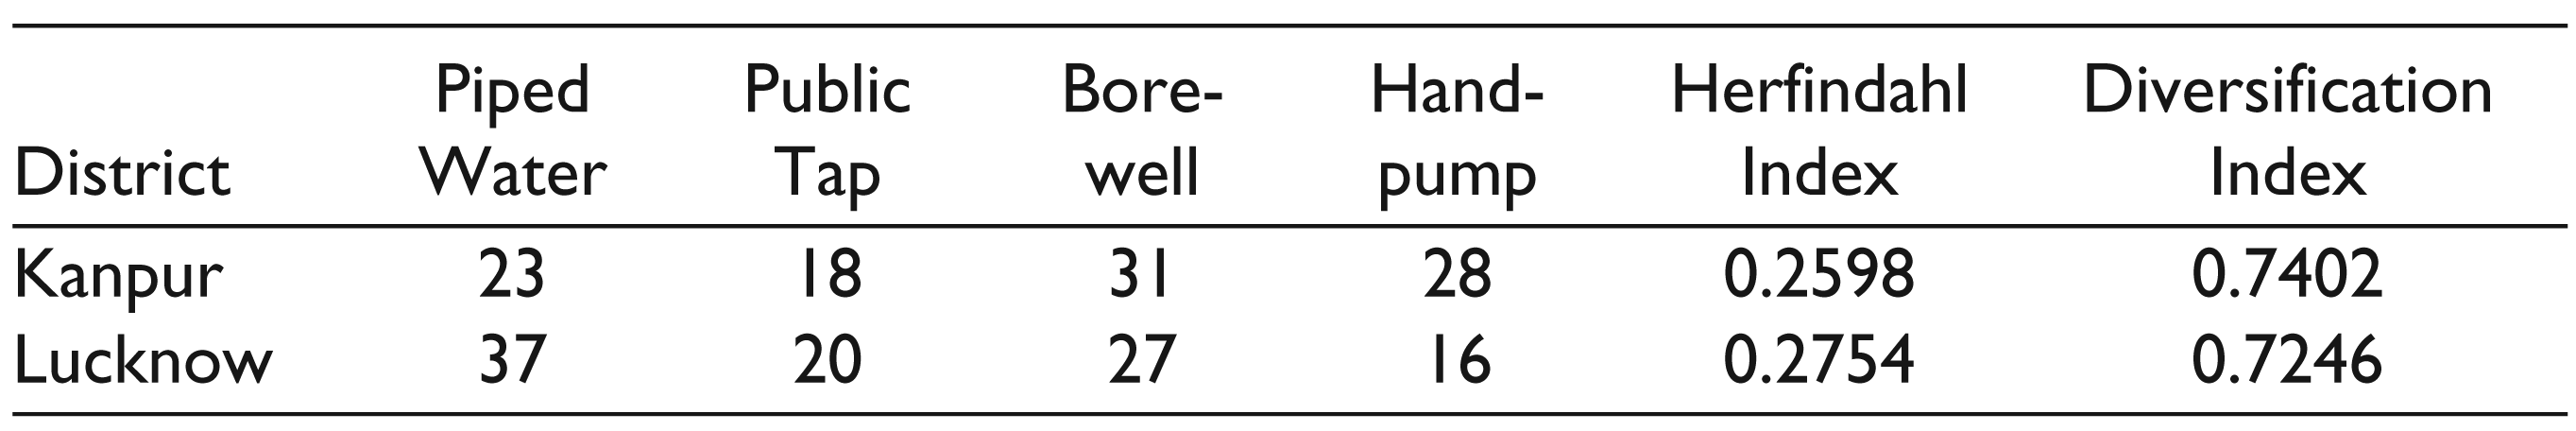
District-wise Distribution and Diversification of Drinking Water Sources
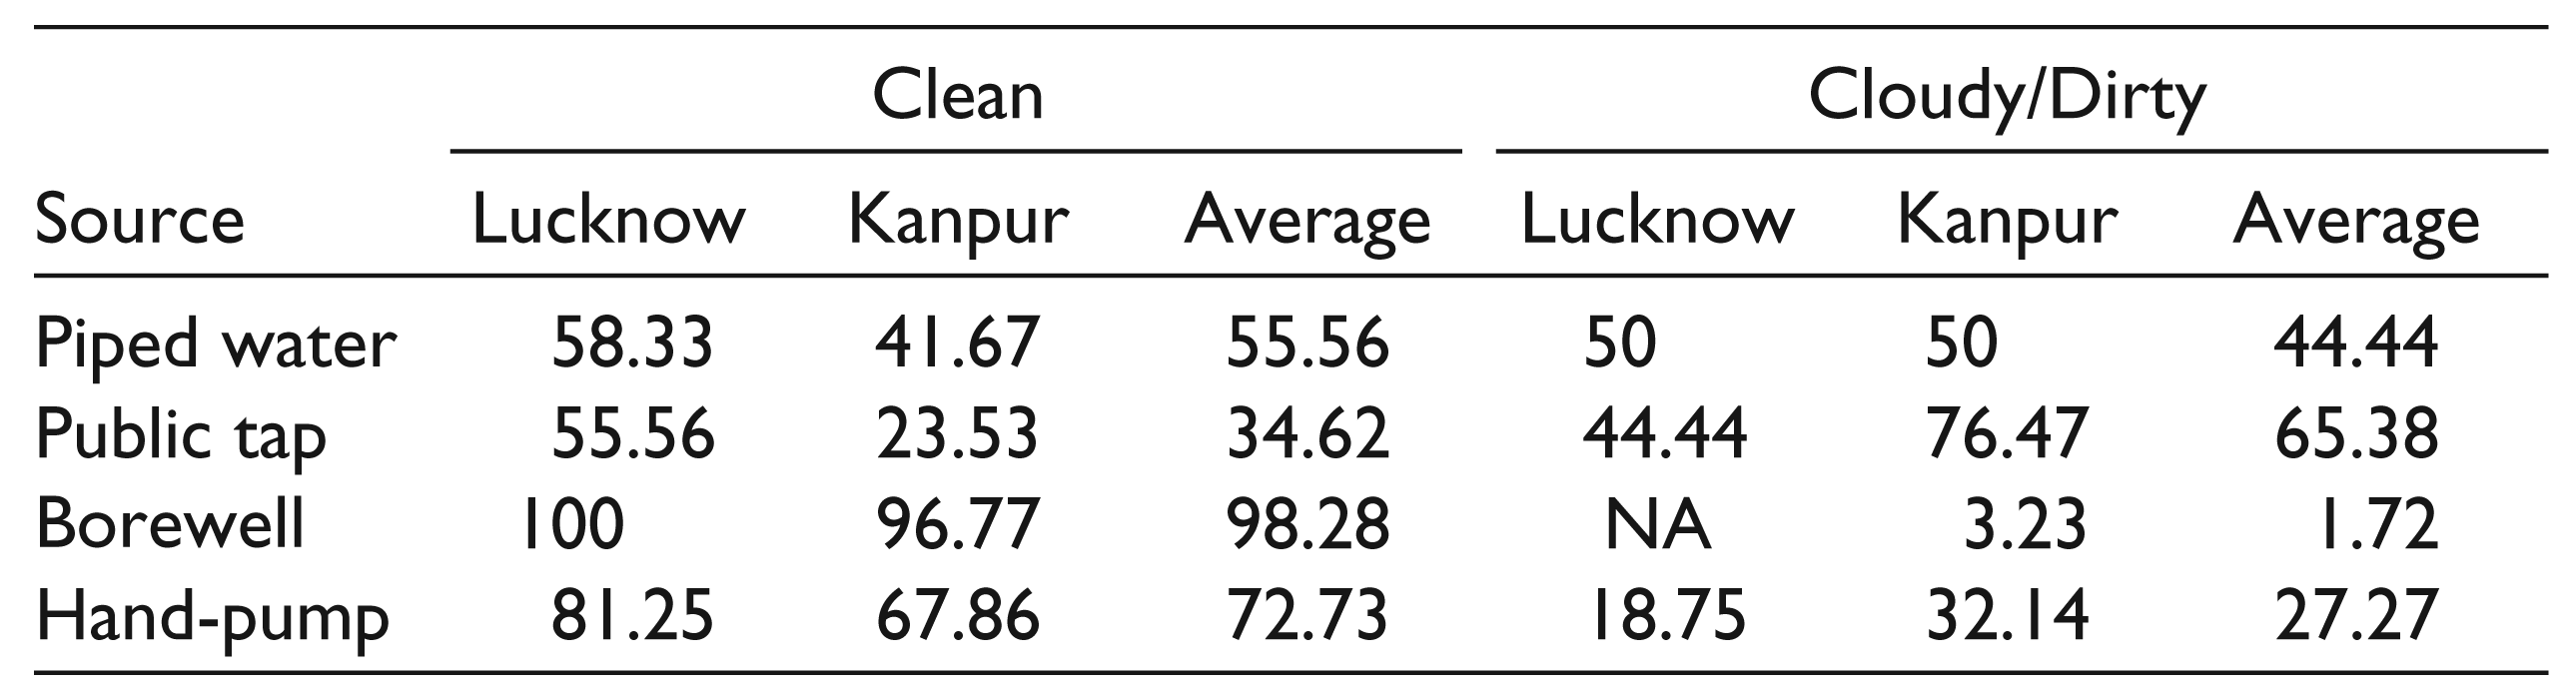
Quality of Drinking Water by Source (in per cent)
If the supply is irregular or infrequent, it implies a more limited use of water. The potential of diseases, such as diarrhoea, cholera and typhoid, are linked to unsafe and inadequate water. Low pressure of water is another problem of municipal water supply. About 73 per cent of the respondents reveal that sometimes low pressure occurs in water supply, while 19 per cent households reveal that the pressure is always low in the water supply. Only 8 per cent households report that there is no low pressure. A district-wise analysis shows that the quality of piped water supply is better in Lucknow than Kanpur. In fact, in all indicators, such as pressure, frequency, it looks as if the households in Kanpur are more affected from these problems than households in Lucknow.
Quality of Drinking Water by Source (in per cent)

Pressure of Piped Water Supply (in per cent)

Frequency of Piped Water Supply (in per cent)

Current Status of Urban Water Supply
About 30 per cent of the total sampled households receive piped water supply, while 19 per cent depend on a public tap; 29 per cent households obtained their drinking water from borewell, while 22 per cent households from hand-pumps. A district-wise analysis shows that the main source of drinking water is through a borewell and a hand-pump in Kanpur, while in Lucknow it is piped (Table 3). According to the Census 2011, about 67 per cent households of Lucknow and 42 per cent households of Kanpur receive piped water supply. The diversification level is also higher in Kanpur than Lucknow. It can be said that households of Kanpur use more diversified sources of drinking water. 2 The reason may be the poor water supply in Kanpur city which forces most people to go in for their own boreholes (Datta, 2002).
The study reveals the presence of water quality problems. About 70 per cent of households have found sand, mud and a foul smell in the drinking water they accessed from a public tap. The borewell is reported to be the safest drinking water source. It is evident that the households dependent on public tap and piped water are the most affected by the issues mentioned earlier (Tables 4 and 5). A majority of households report that water is available twice a day. About 4 per cent of households say that municipal water is available only once a day for 2 or 3 hours (Tables 6 and 7). This indicates that the majority of households reveal a shortage of regular water supply.
Quantity
Adequacy in terms of both quantity and quality is important. If the supply is irregular or infrequent, it implies a more limited use of water. The availability of a sufficient quantity of drinking water is considered important for maintaining the health and hygiene requirements of households (NSSO, 2010). To gauge the extent of sufficiency of drinking water availability, the informant was questioned on the adequacy of drinking water. It is observed that among the tubewell/hand-pump users, the highest proportion of households received an adequate amount of drinking water, whereas when the public tap was used as a major source, the proportion of households who received adequate drinking water was the lowest.
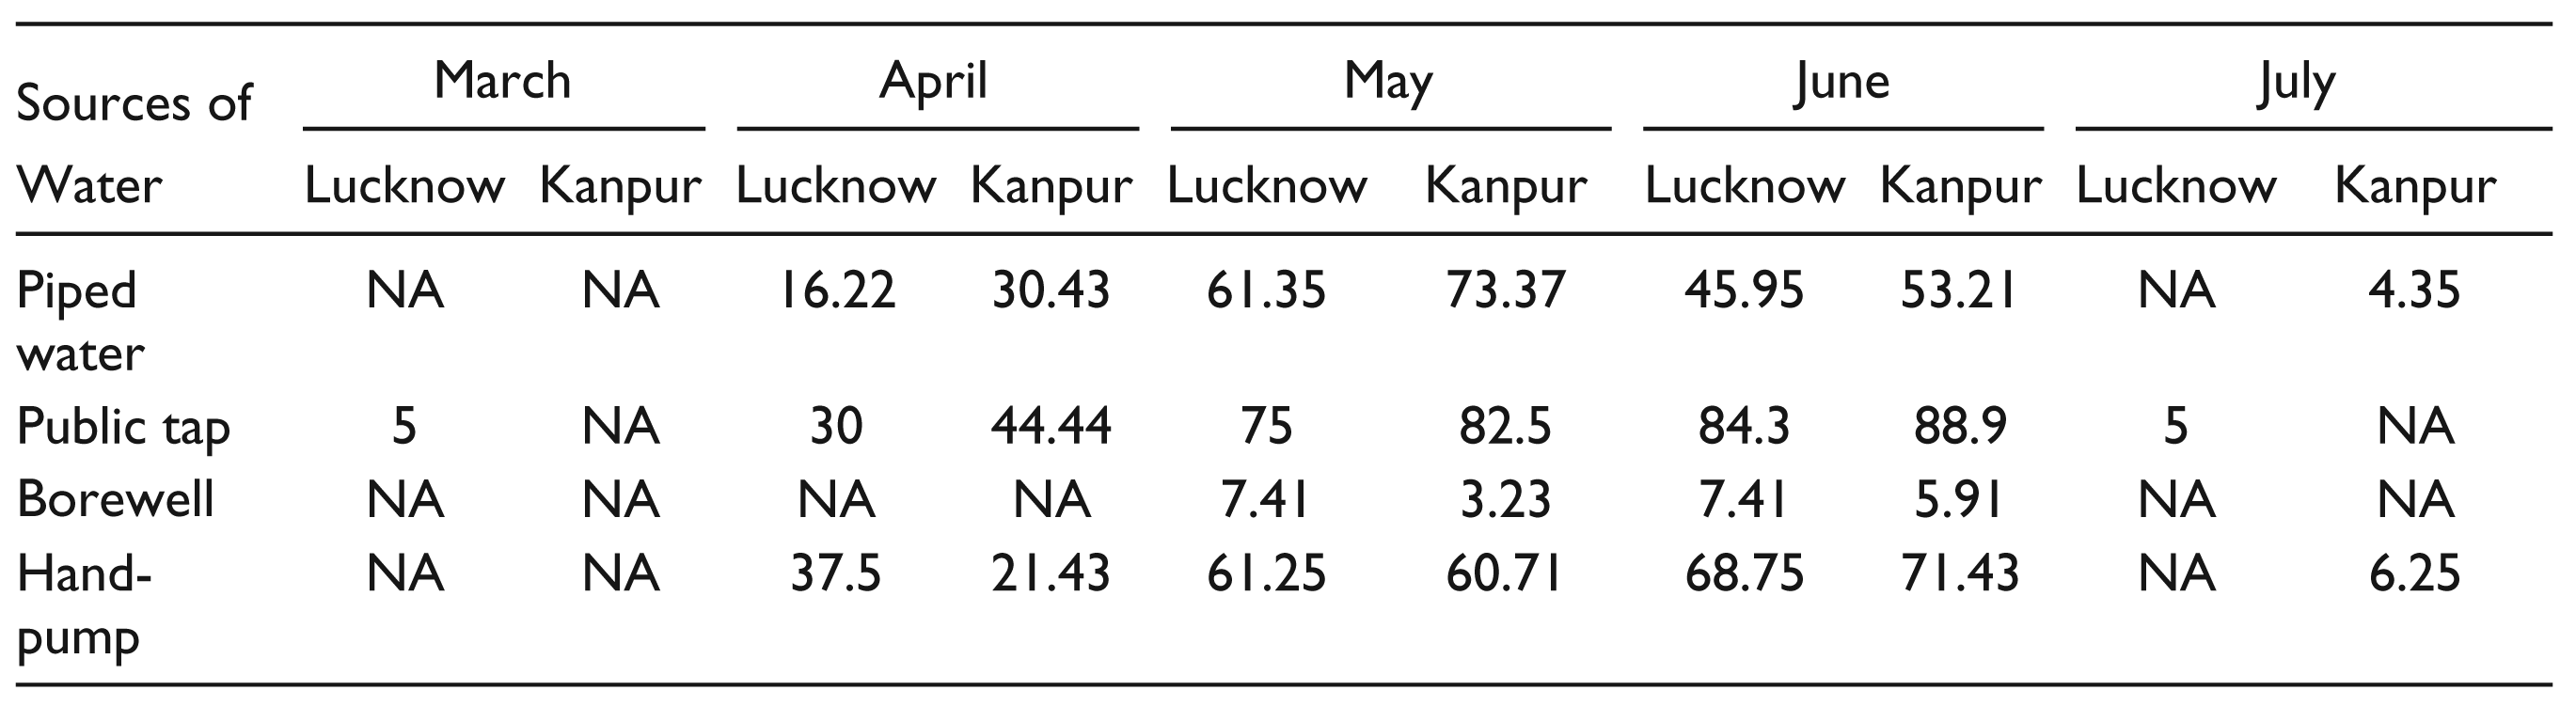
The non-availability of sufficient drinking water can be seen in specific month(s) of the year or throughout the year. A shortage of drinking water starts creeping in from the months of March, reaching a peak during May and June. Thereafter, the situation of availability of drinking water improves gradually by July. Nearly, 71 per cent of the piped water users, about 89 per cent of the public tap users and about 68 per cent of the hand-pump users had insufficient drinking water during the month of May. In the months of April and June, drinking water was not enough for nearly 19 per cent and 52 per cent of the sampled households, respectively. It is clearly evident among the tubewell users that the highest proportion of households got sufficient drinking water (Table 8). A diversification index confirms that tubewell users get an adequate water supply as compared to other sources of drinking water because they can get water when they need it. The condition of public tap users is the worst among all sources (Table 8). This is also confirmed by district-wise analysis. It is evident that piped water and public tap users of Kanpur report more insufficiency of drinking water as compared to Lucknow (Table 9).
Source-wise Sufficient Drinking Water in Different Months and Diversification

Source-wise Sufficient Drinking Water in Different Months and Diversification
Source-wise Sufficient Drinking Water in Different Months in Lucknow and Kanpur
Income-wise Distribution and Diversification of Drinking Water Sources
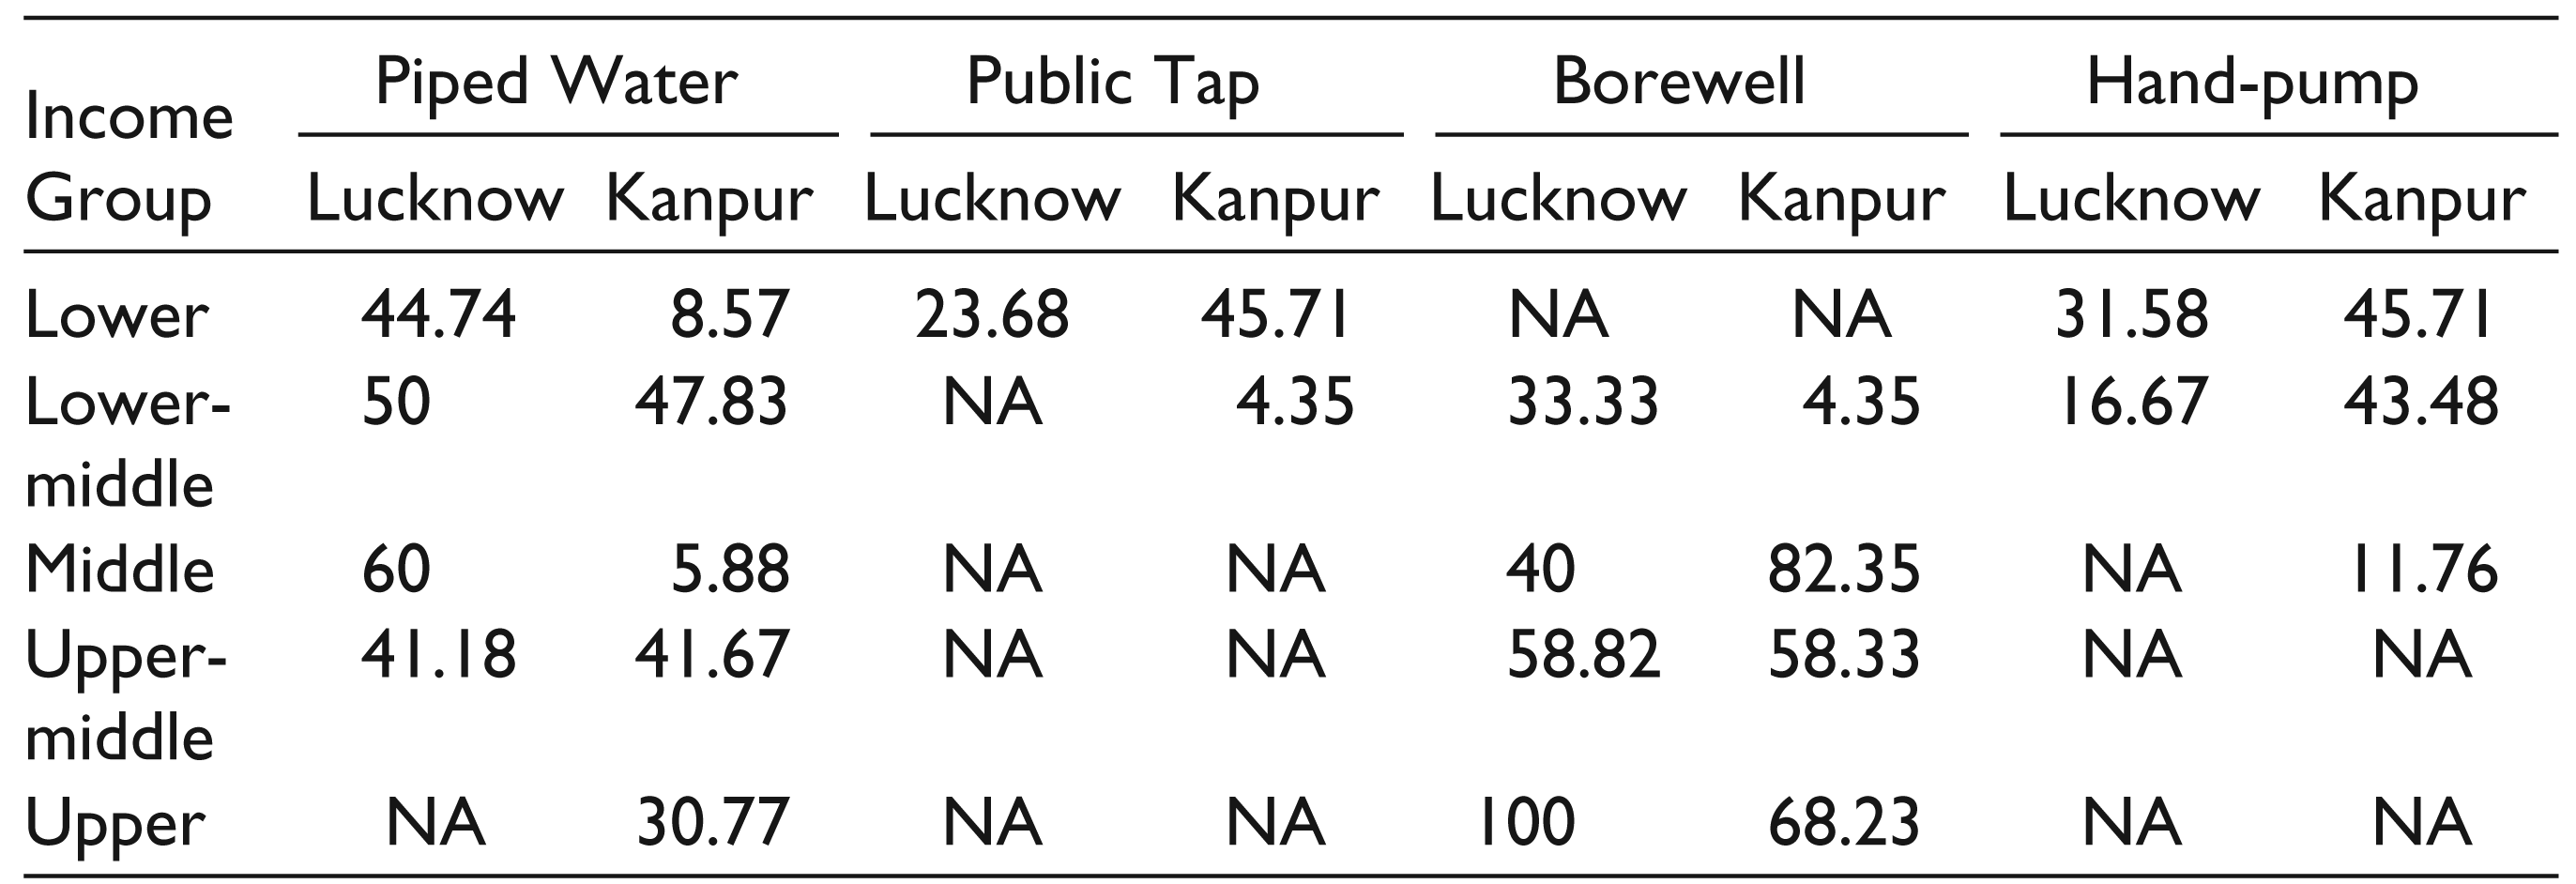
Income-wise Distribution of Drinking Water Sources in Lucknow and Kanpur
Caste-wise Distribution and Diversification of Drinking Water Sources

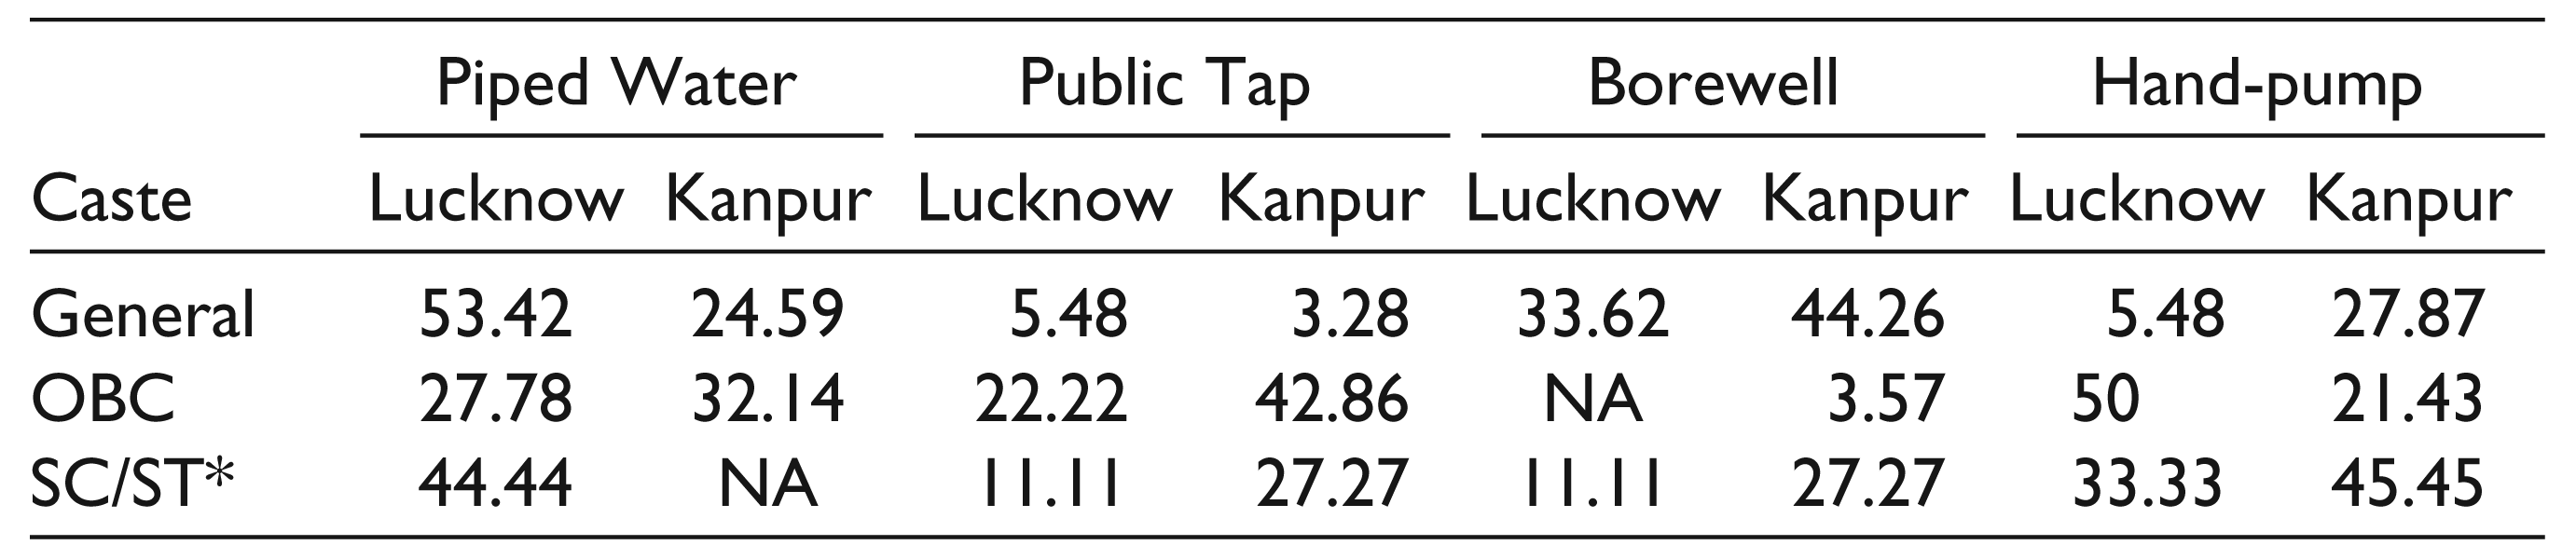
Caste-wise Distribution of Drinking Water Sources in Lucknow and Kanpur
Inequality in Access to Drinking Water
Inequality is a pervasive theme in access to water. In most rich countries, people are not differentiated on the basis of where they draw their water, or what type of toilet facility they use. In many developing countries, the wealth distribution defines the source of water and type of sanitation facility. Inequitable access to water is the product of disparities in fresh water resources, income, power and institutional capacity among and within countries (Moe & Rheingans, 2006). The global burden of poor access to safe water and sanitation falls primarily on the poorest of the poor (Phansalkar, 2007). A study of Rajasthan finds that the piped water schemes have benefitted wealthier people more than the poorer, but the poorer people are compensated by the improved access to the hand-pumps (Mohan, 2005). Kanmony (2003), Mckenzie and Ray (2009), Zerah (2006), Kundu and Thakur (2006), Singh (2009) and Tiwari and Nayak (2013) found various types of disparity, that is, spatial, social and gender disparities in the availability of drinking water. A recent study finds that public services received by inhabitants depend on their economic strata (Kamyotra & Bhardwaj, 2011).
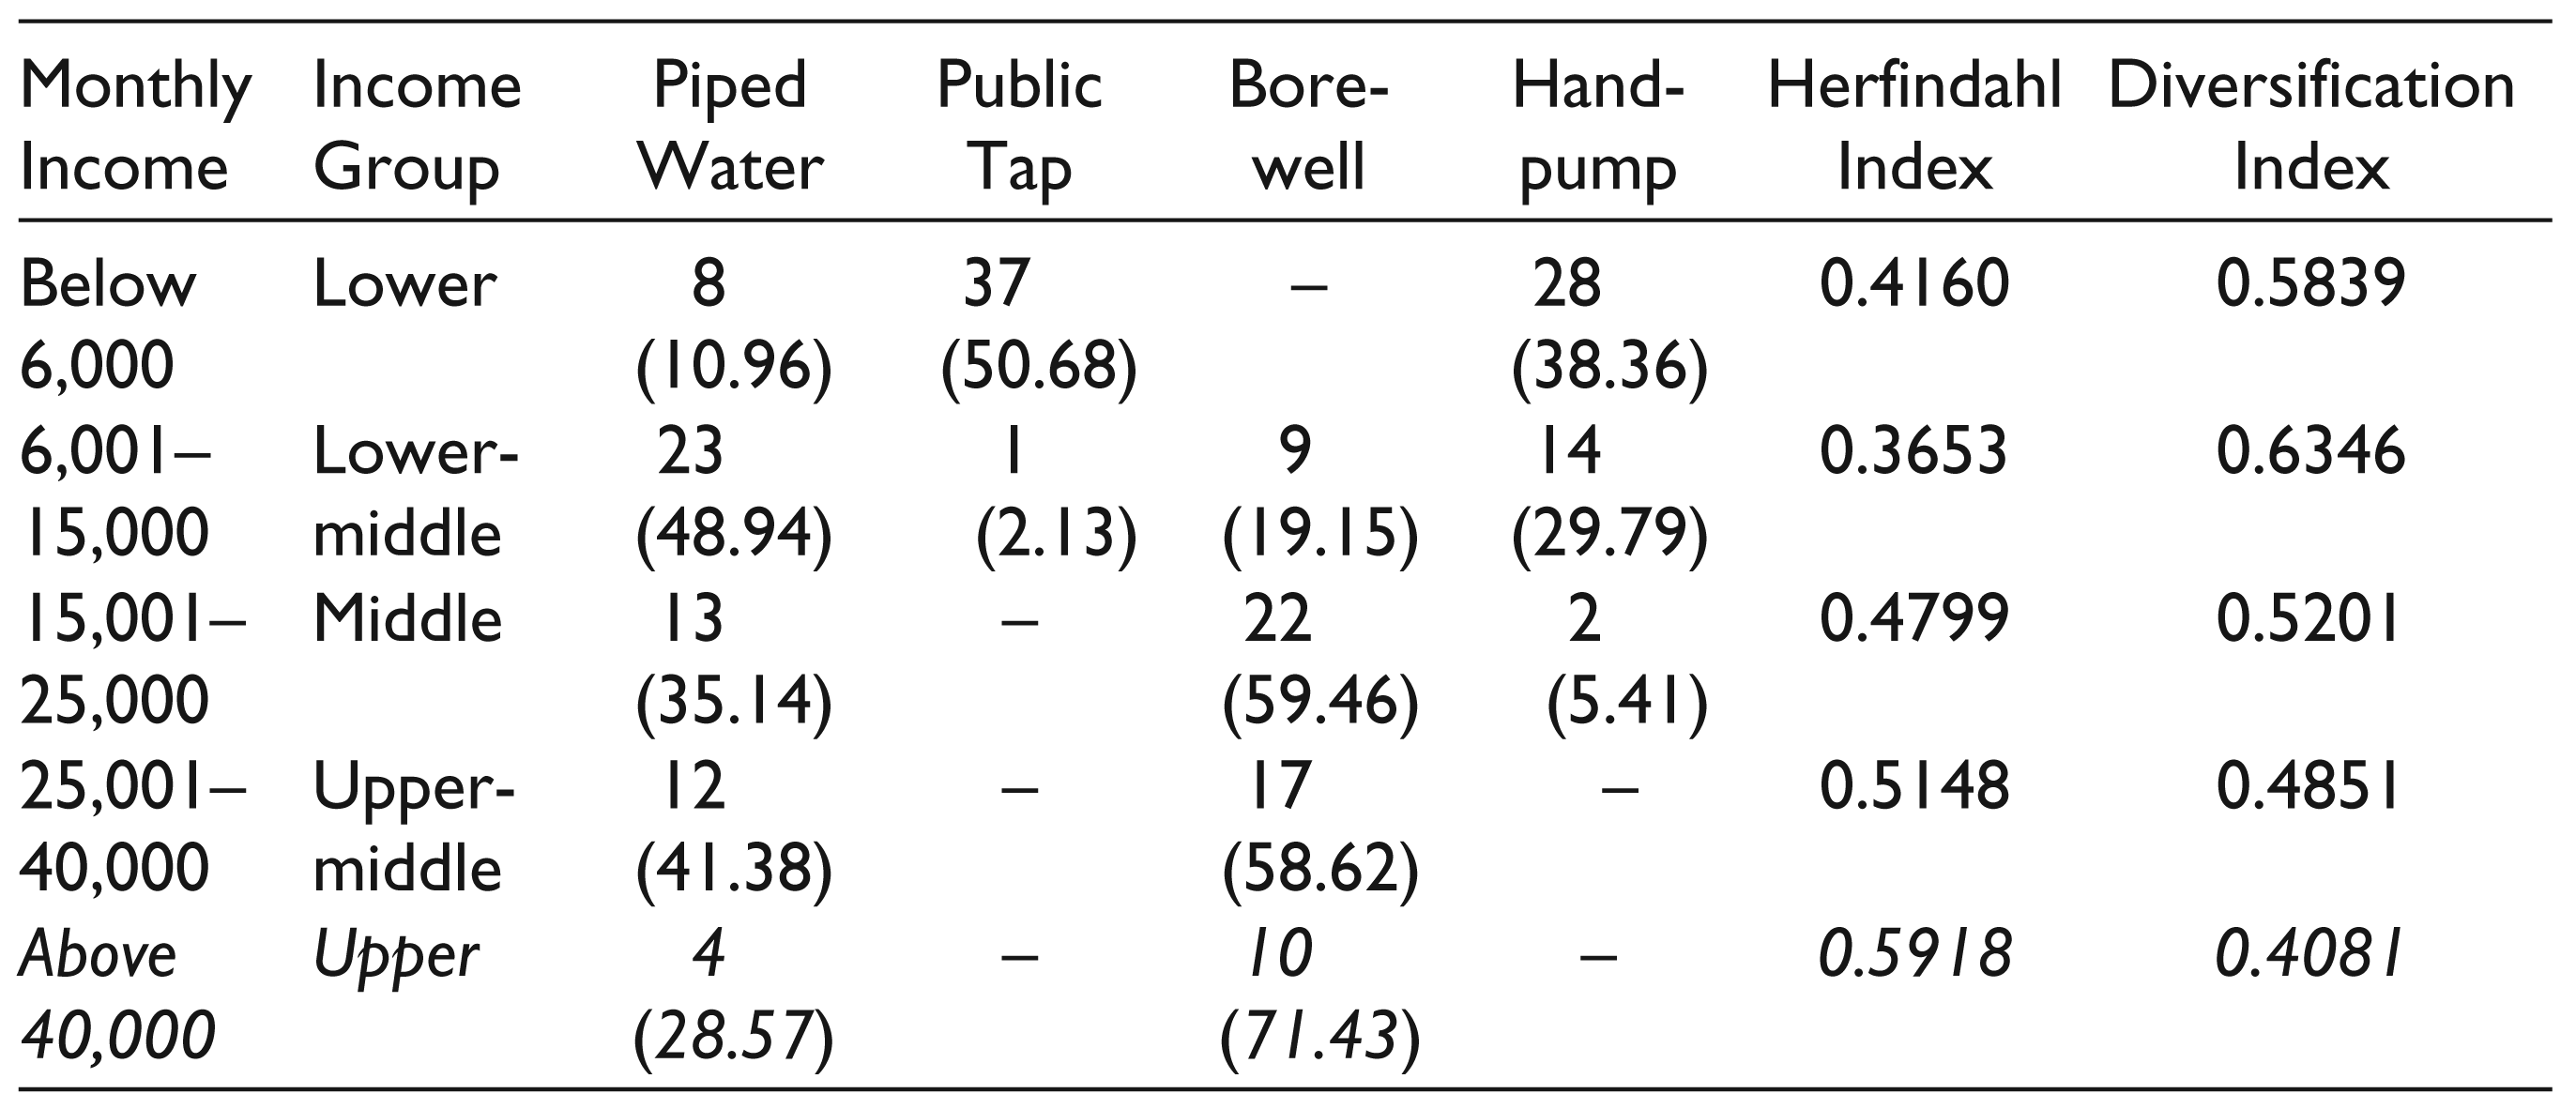
Income-wise distribution of drinking water sources in the study area clearly reveal that people who have low income do not avail of borewells and have few less piped water connection but rich people have subsidised water sources or their own water source or both (Table 10). The low-income group has to depend greatly on public taps and hand-pumps. It is also seen that lower income groups have more diversified sources of drinking water than upper income groups. Upper income group is least diversified, as all households have piped water or borewell and they store water in big tanks for whole day, and so the people do not need to look for other sources of drinking water. District-wise analysis also confirms it (Table 11). Therefore, lower income groups have more vulnerable sources of drinking water than other groups of people.
There is a clear caste inequity seen in accessing piped water (Table 12). About 35 per cent general households and about 24 per cent of OBC households have access to piped water, while none of the ST households have piped water and/or a tubewell. The bulk of ST and OBC households have to fetch their water from a public tap. The percentage of households depending on a hand-pump is high among SC, ST and OBC households. A caste-wise distribution of water sources has also brought to light the fact that higher caste groups have an easy access to more private water sources than their low caste counterparts. It is evident that people belonging to forward communities depend mostly on borewells, while hand-pumps are the main source for SC/ST households and the public tap is the main source for OBC households (Tables 12 and 13). The diversification level is highest among SC/ST, though a marginal difference persists. SCs/STs have more diversified sources of drinking water and OBCs have less diversified sources of drinking water than other castes. It can be said that caste does not play as much a significant role as income for determining the type of drinking water sources (Table 12). Therefore, it is the socially and economically weaker section of people who have more diversified sources of drinking water than other communities of people.
Determinants of Drinking Water Facility within Premises
Accessibility can be looked into two ways, namely, general access and optimal access. General access refers to access of water, via taps, hand-pumps and tube-wells, whereas optimal access refers to taps within residential premises. The distance to the water source from the house affects the volume of water consumed. Availability of drinking water within the household or within the premises of the household is definitely a better form of facility, since in such cases household members need not travel to fetch drinking water. If, however, the household members need to travel long distances for drinking water, it may not be treated as a desirable facility (NSSO, 2010). Various studies also confirm that the coverage figures do not reflect actual availability of water supply which is better reflected by service quality indicators such as hours of supply, water quality and quantity (Mavalankar & Shankar, 2004; Mingxuan & Rao, 2011; Pushpangadan, 2006). A proper access requires two conditions to be fulfilled—right to sole use and that the water source should be within the dwelling. In general, the closer the water source is to the dwelling, the better it would be (Bajpai & Bhandari, 2001; Pushpangadan, 2006). In this regard, the distance travelled by households to access the source of drinking water is an important aspect which needs to be analysed.
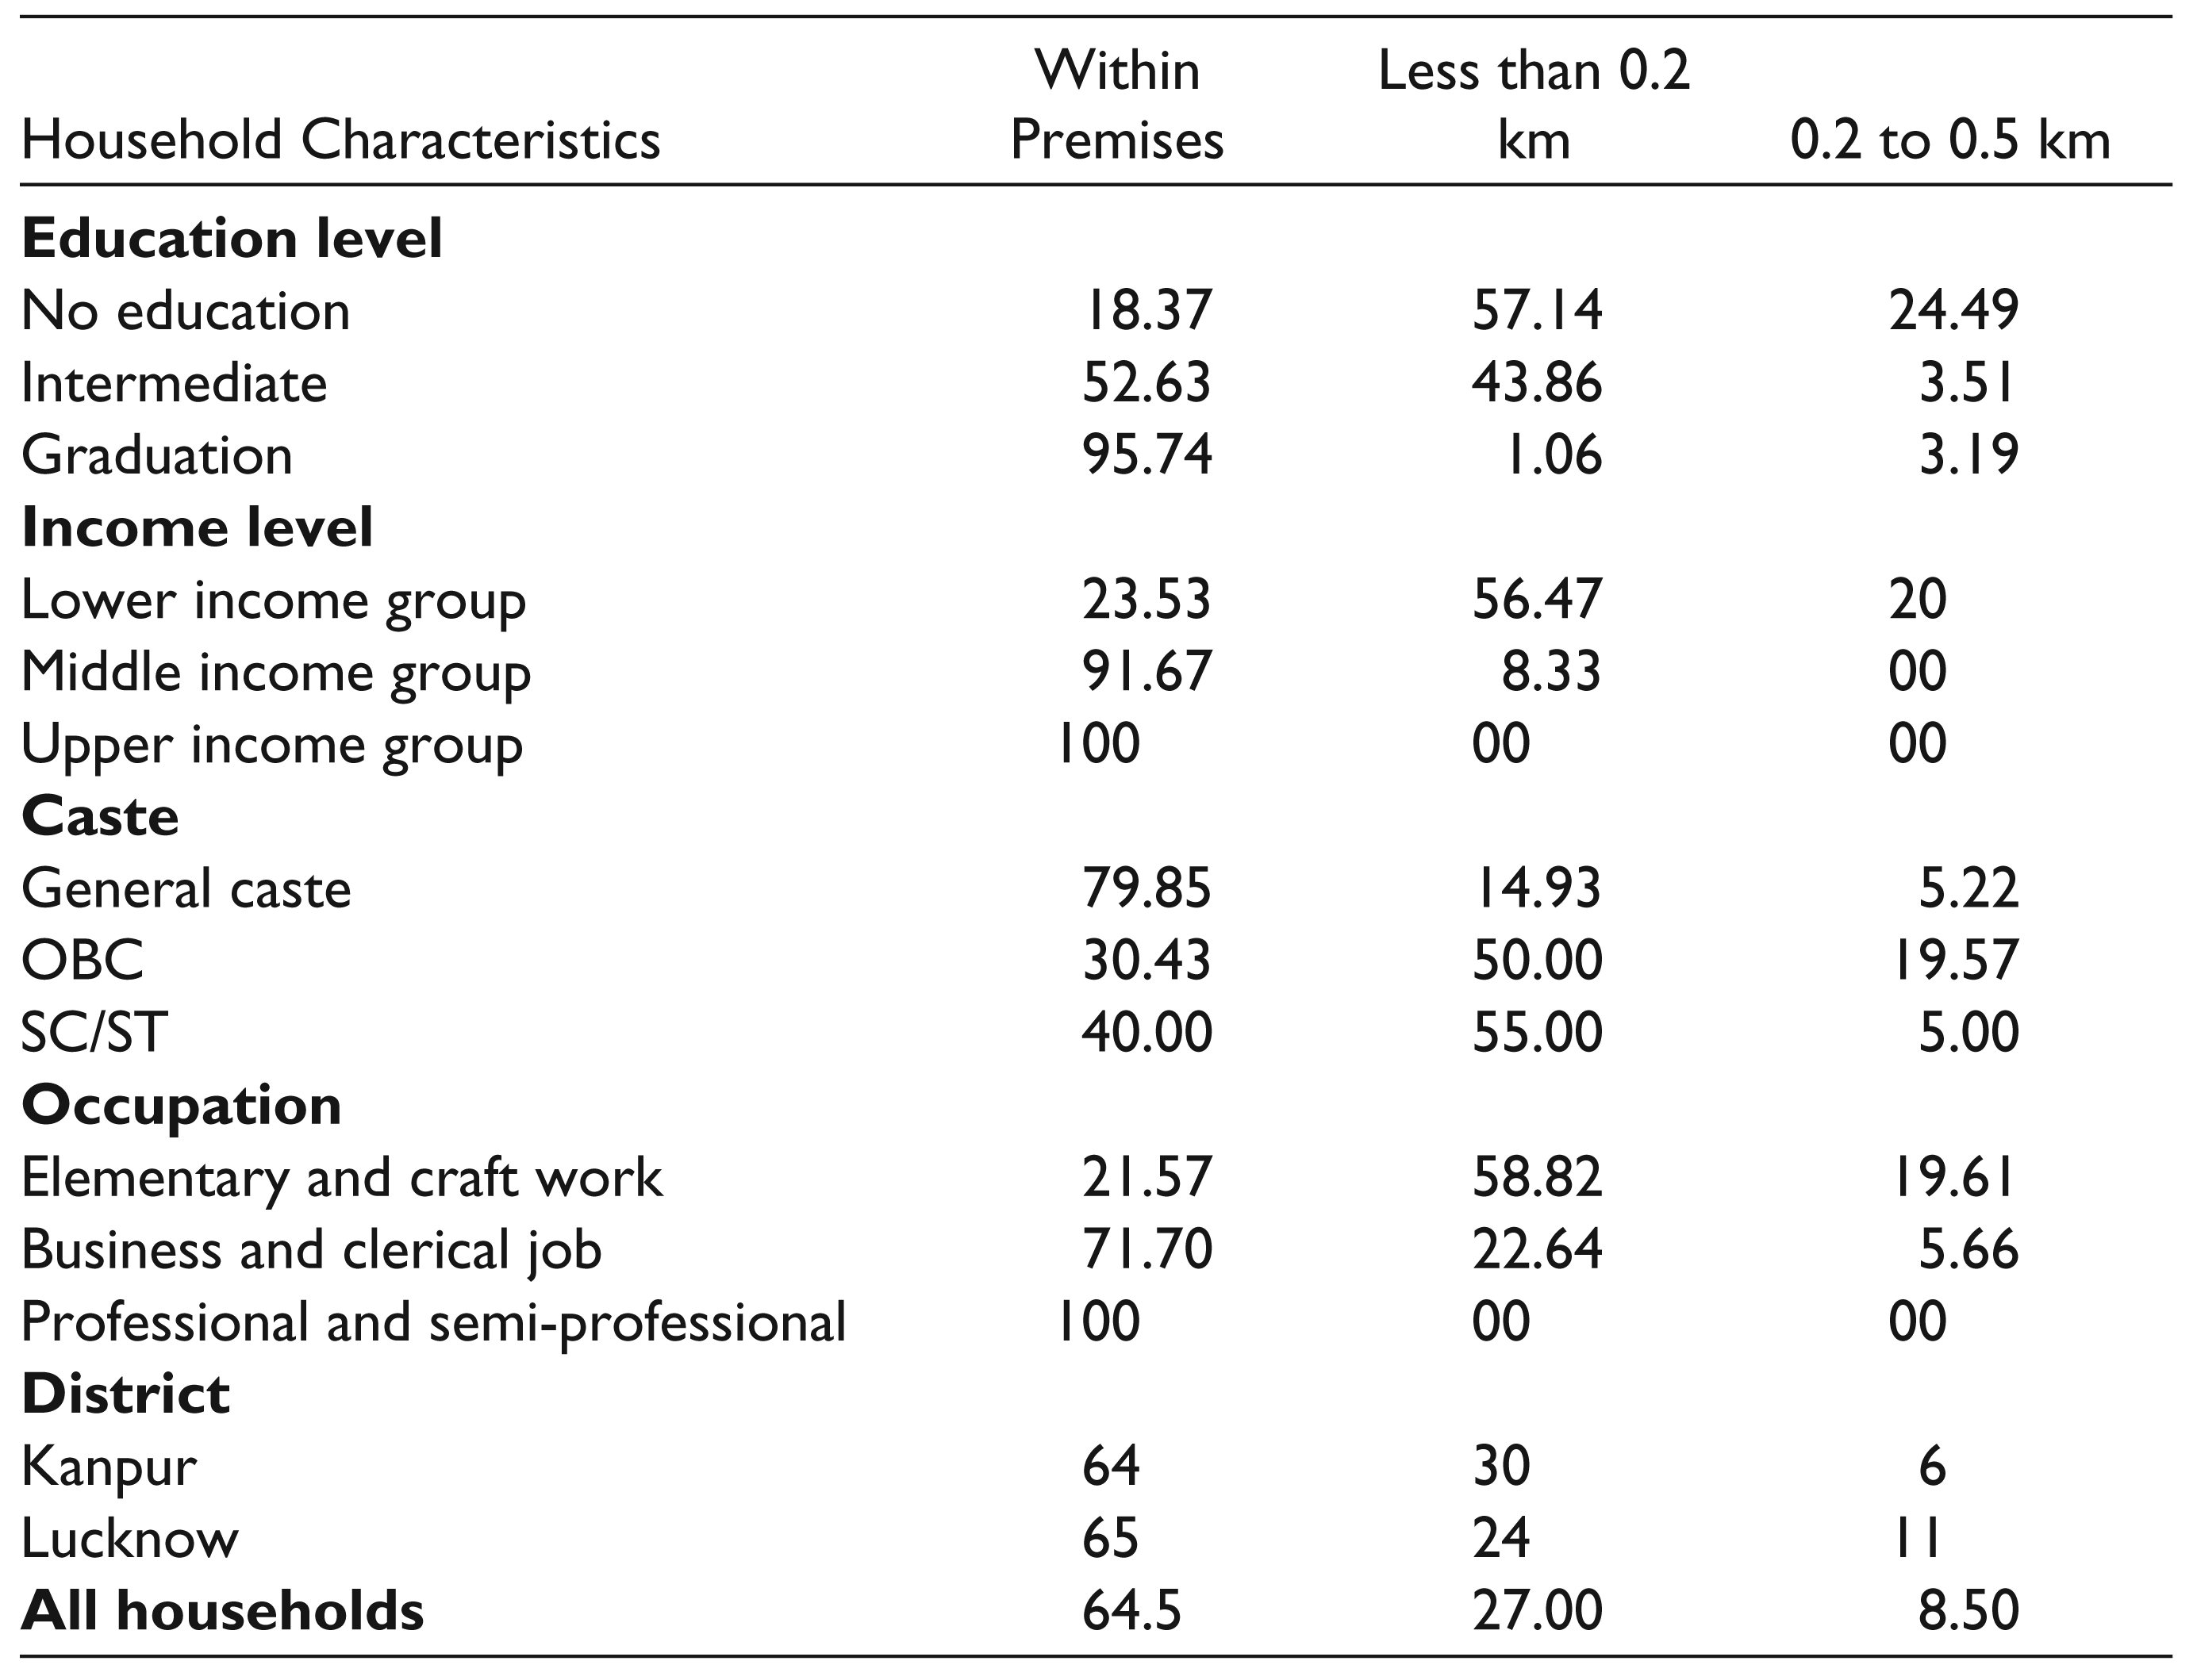
their premises while about 36 per cent within a distance of half kilometre in the study area. The analysis shows that illiterate, lower income groups, elementary and craft workers have to go far to obtain drinking water. They are discriminated against in the provision of safe drinking water within premises (Table 14). In the study, those families that lack a household water supply have to collect water from hand-pumps and public taps. This means that the population pays with their time for the lack of investment in bringing water sources closer to their dwellings. All professional and semi-professional households have drinking water sources within their premises in the study area, so they have not travel for water. A caste-wise analysis shows that about 80 per cent of general households have drinking water sources within their premises, while 30 per cent of OBC households have drinking water source within their premises in the study area (Table 14). All upper income households obtain drinking water within their premises. The analysis of district-wise data on water collection time shows that there is no difference in access to drinking water source between both districts.
Distribution of Households by Distance of Drinking Water Source (in per cent)
Results of Logistic Regression
To identify key determinants of drinking water in premises, a dichotomous variable is computed indicating whether the household has any drinking water facility within premises or not. The dependent variable is binary, assuming the value 1 if the household has drinking water facility within their premises and the 0 if he has not. The socio-economic factors such as education, income, social category, family size and occupation are considered as independent variables.
Based on descriptive statistics, an empirical model has been developed to identify the factors affecting drinking water facility in premises, as follows:

where X1 is education, X2 is income, X3 is occupation, X4 is the family size and X5 is the social group.
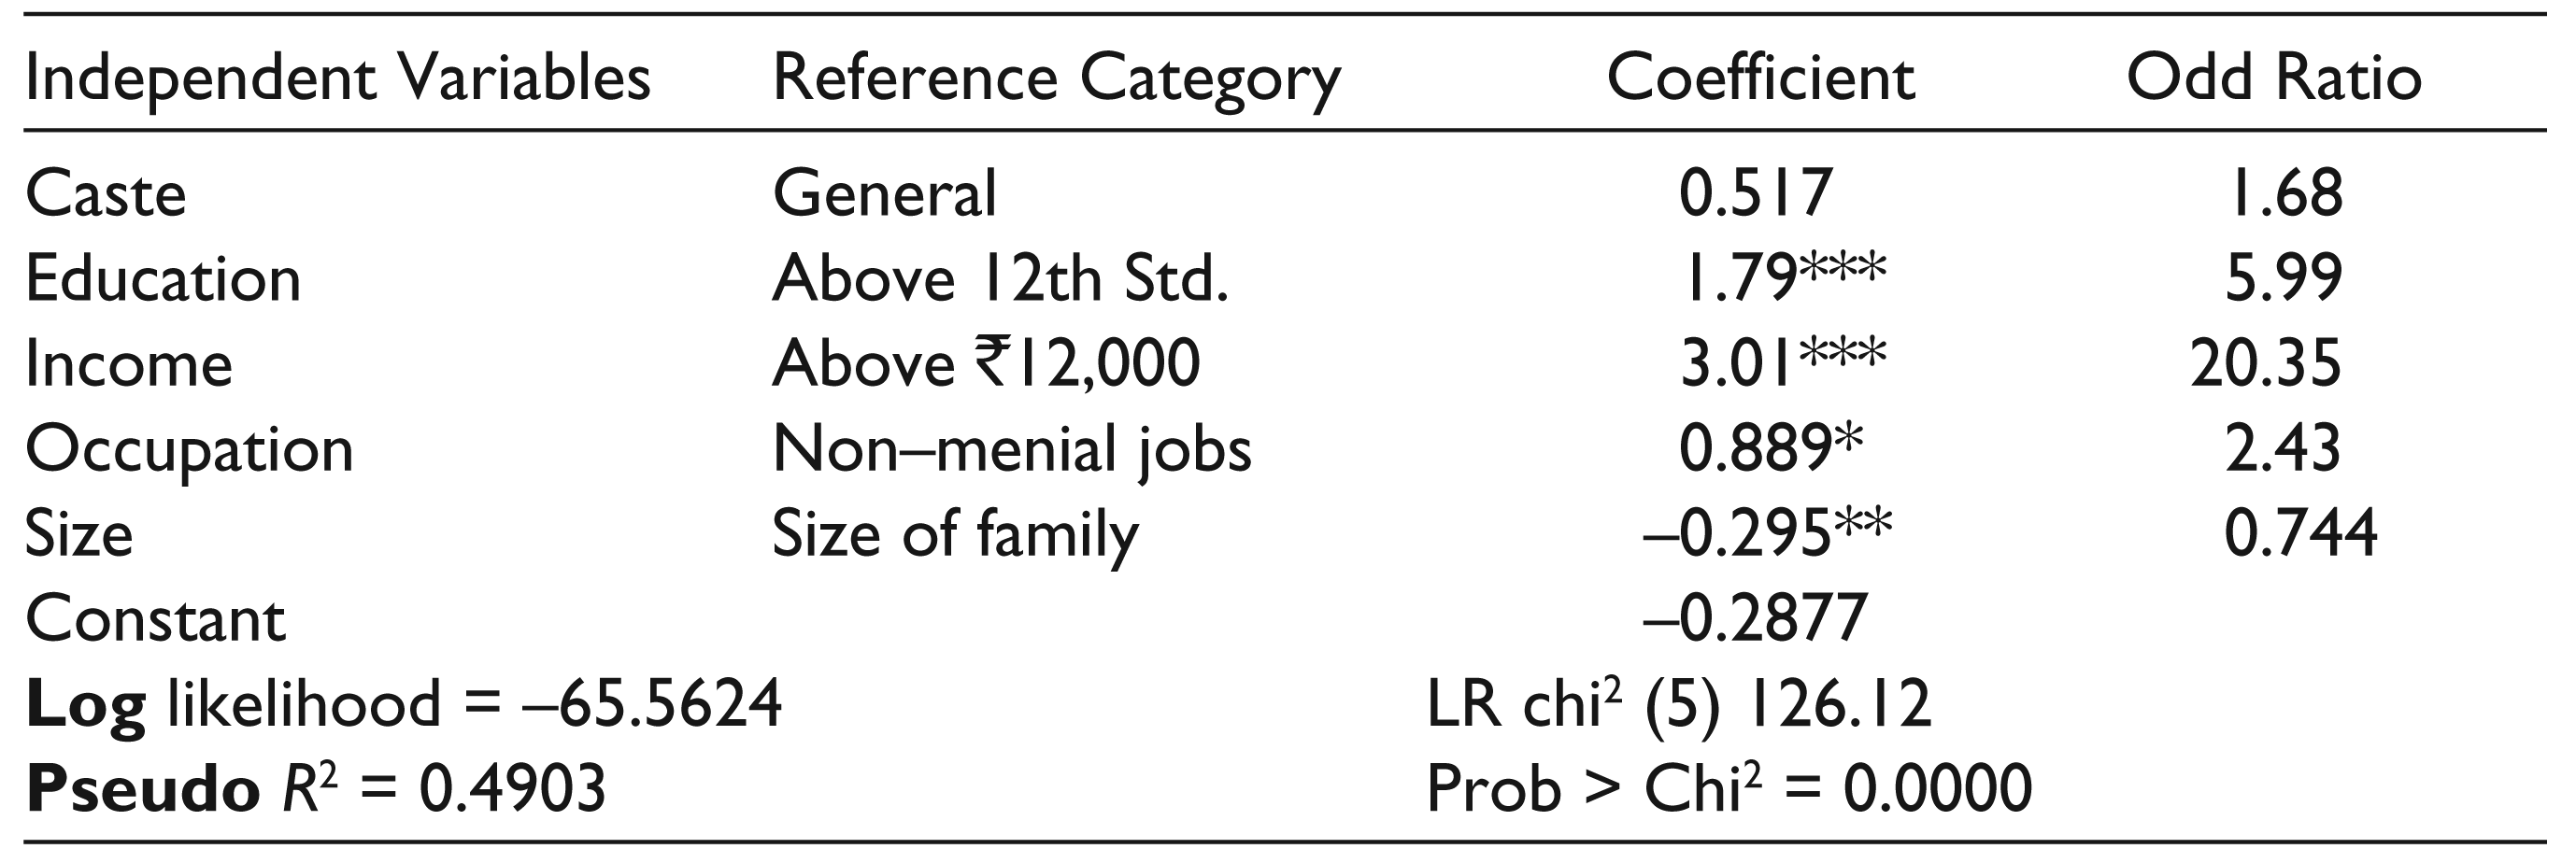
The results indicate that education, income and occupation have a positive and significant impact on drinking water in premises (Table 15). This implies that the households are more likely to have drinking water facility within premises with higher income, education and occupation. Among the predictors, the beta values indicate that income is the most significant variable followed by education, occupation and size of family. The odd ratios reveal that probability of having drinking water within premises is 20 times higher for those households whose income is above ₹12,000.
The educational experience of the head in the household plays a strong and significant role in access to drinking water in premises. The likelihood of availing drinking water facility within premises is six times more than those household heads that are educated till the 12th standard and below. The occupation variable also exerts a significant influence on the dependent variable. The probability of drinking water in premises is two times greater for a household head who works in to non-menial jobs as compared to menial jobs.
The small, though significant, negative estimated coefficient of the family size variable shows that the household size and composition significantly affect the drinking water facility. The negative coefficient of family size implies that large families are less likely to access drinking water in premises than from small families. The likelihood ratio test statistics indicate that the explanatory variables used for predicting having drinking water facility within premises explain a fairly good-fit in the model. The findings from the pseudo R-squared value indicate that the variation explained by all the independent variables is 49.03 per cent.
Thus, the logit model reveals that probability of drinking water source in premises is significantly high if the person is highly educated and belongs to a high-income group. This is consistent with the result that poorer households are generally more adversely affected by low levels of water supply and sanitation facilities (Agarwal, 2011).
Multinomial Logit Estimates of Principal Drinking Water Source
The multinomial logit model has been used to explore the factors affecting the probability of using principal source of drinking water. Multinomial logistic regression is a procedure by which we can obtain estimates of the net effects of a set of predictor variables on all dependent variable contrasts (Morgan & Teachman, 1988). Dependent variable consists of four categories of principal sources, that is, municipal piped water, public tap, borewell and hand-pump.
In multivariate analysis, a number of independent variables such as individuals, household level and control variables are used. Income and education are the main independent and control variables. Occupation, caste and size of family are other key variables. The primary interest is to compare the likelihood of using piped water, public tap or borewell vis-à-vis using hand-pump for drinking purpose.
The role of education is found to be different in the choice of drinking water source. While it is found insignificant in the choice of public tap and borewell, only higher education exerted a positive and significant influence for municipal piped water as compared to a hand-pump. The probability that the household with the most educated head use piped water becomes 2.69 times higher than the household with illiterate head and a hand-pump user (Table 16).
Income is positively and significantly related to municipal piped water and borewell but not to a public tap. This indicates that households from a middle income group and an upper income group are particularly likely to use municipal piped water or a borewell relative to hand-pump and its use by a poor income group. On an average, the probability that middle income households use piped water for drinking is about three times higher as compared to poor income households. The marginal probability of using borewell for drinking increases as households head become richer. The probability that the upper income households use borewell for drinking purposes turns out to be 26.52 times higher than the poor households.
Multinomial Logit: Source of Drinking Water
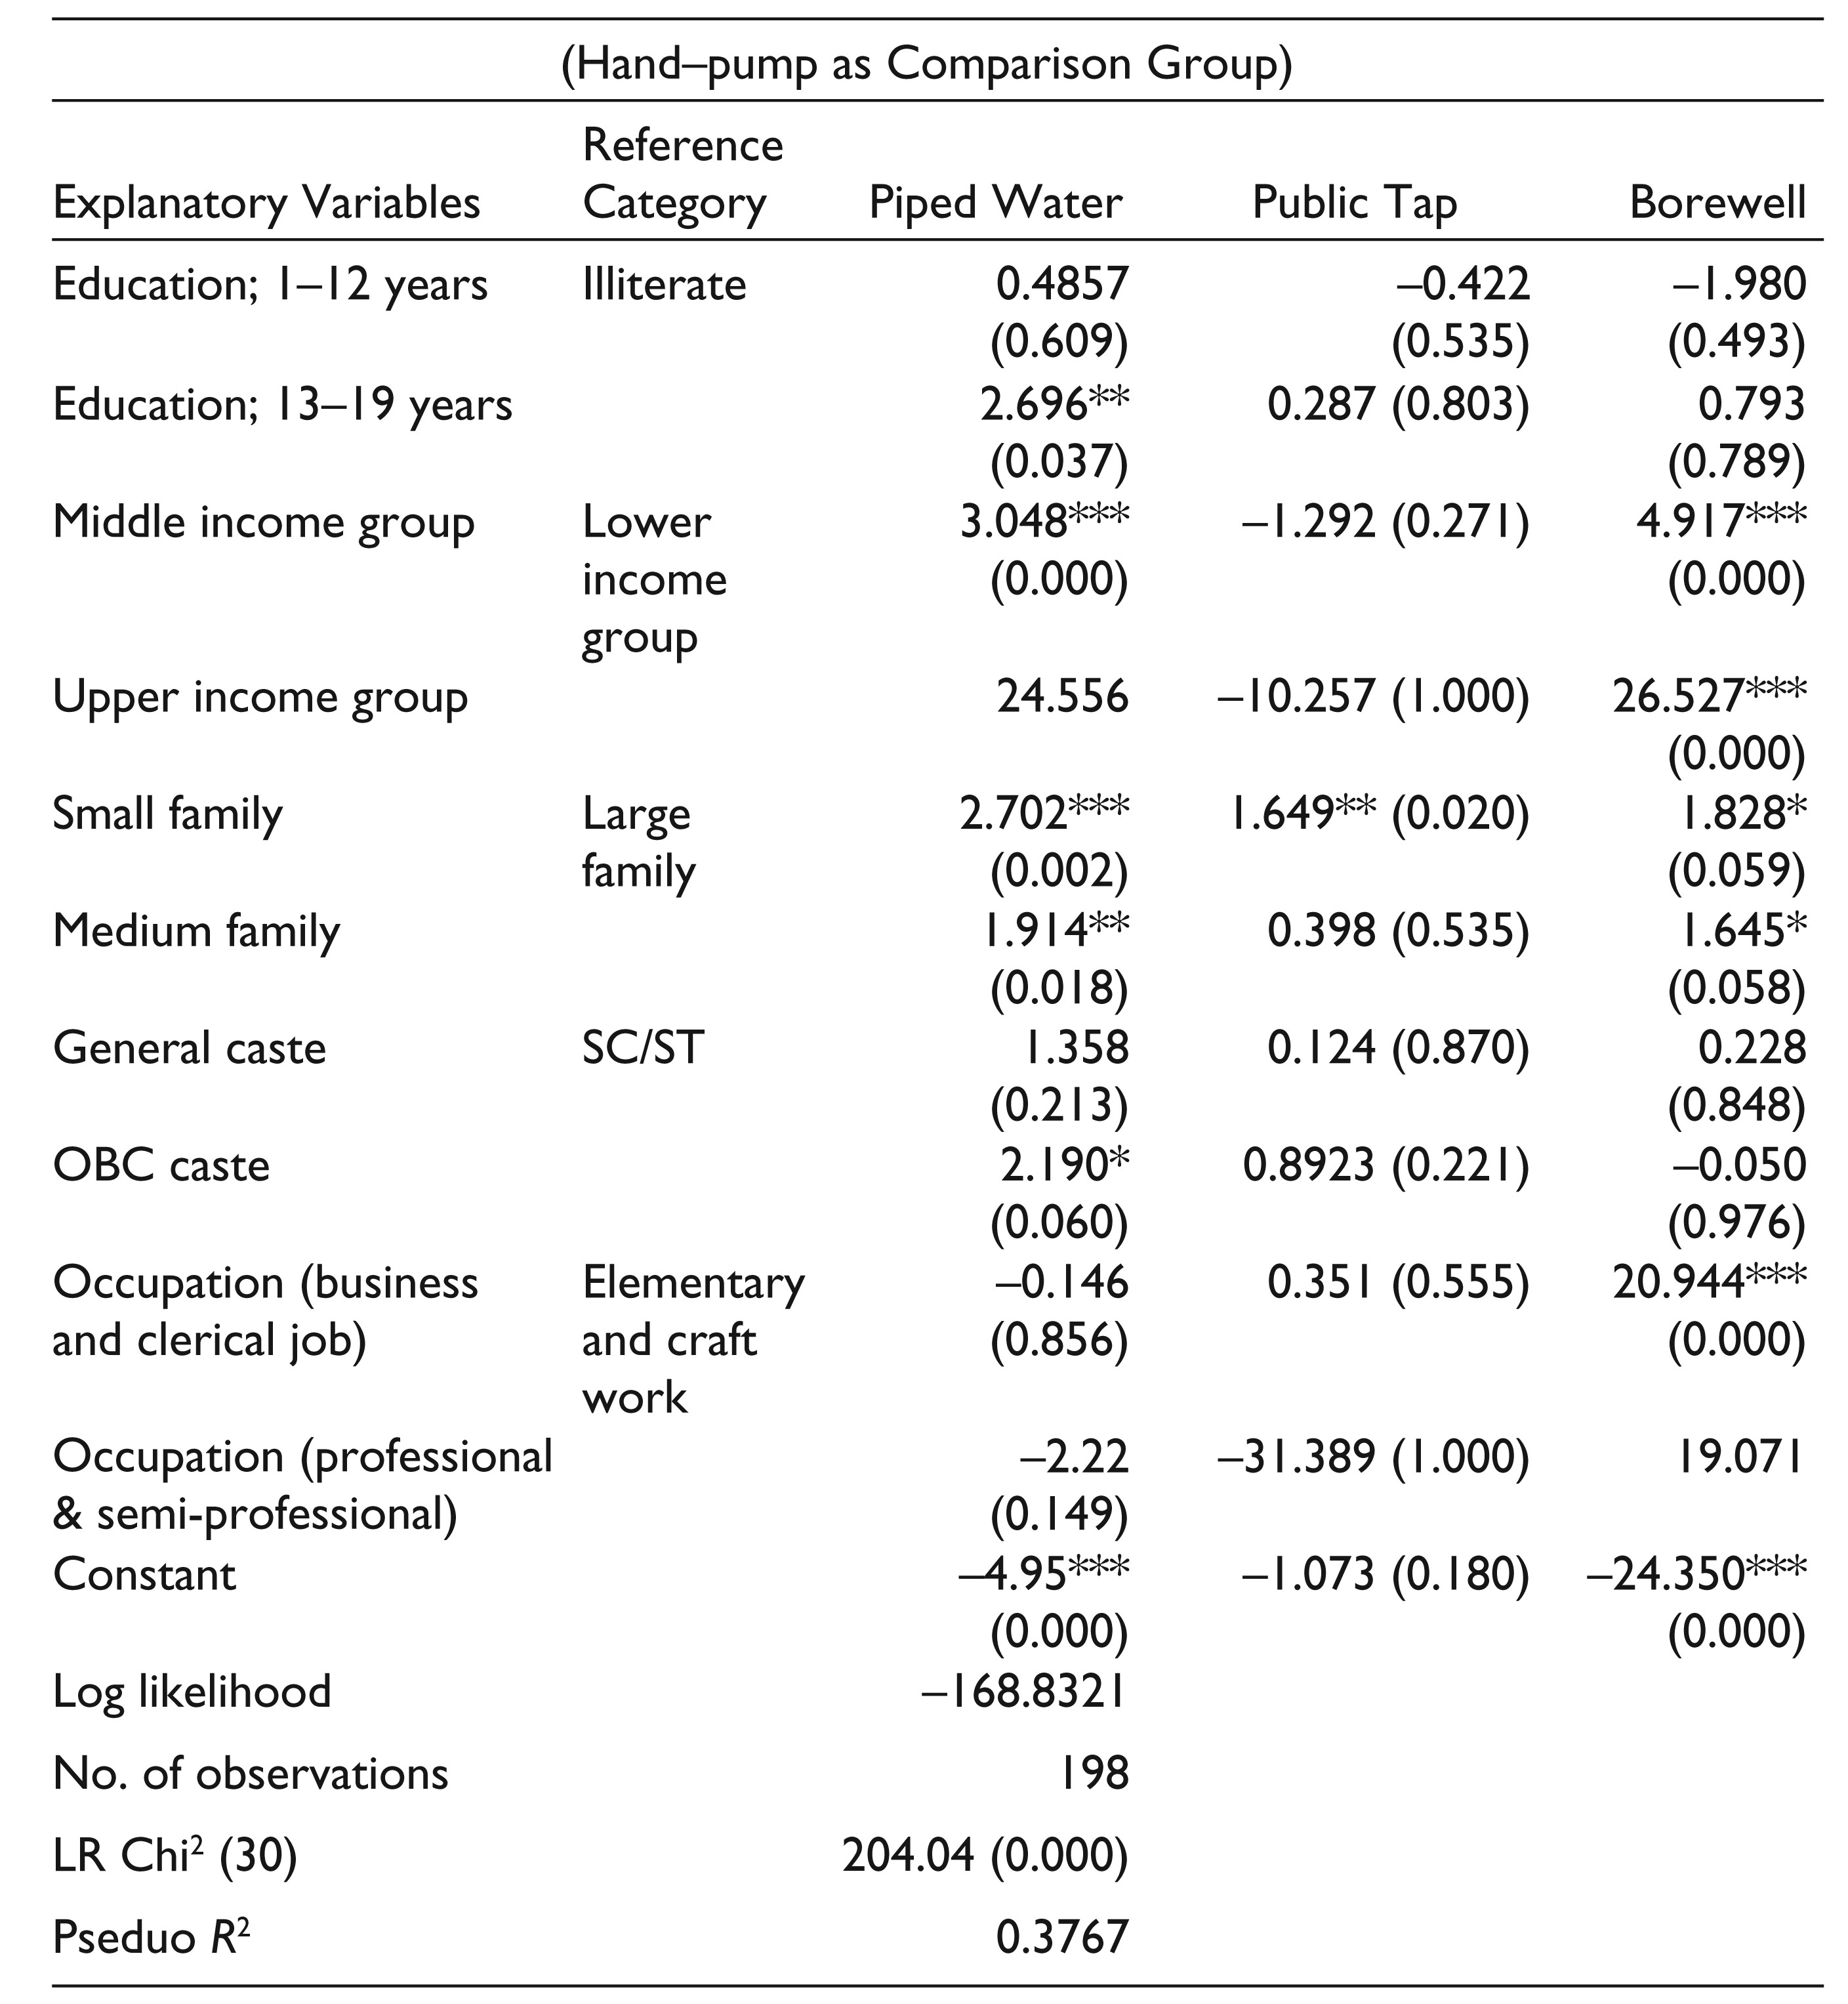
Another strong and statistical association is found between the size of family and principal sources of drinking water. The results indicate that households from a large family are particularly likely to obtain their drinking water from hand-pump than a small family, relative to other principal sources. Further, turning to the social class categories, it is not significant for a general caste while households belonging to OBC are relatively more likely to use piped water for drinking than a hand-pump. If a household belongs to a OBC category, there is 2.19 times more probability for using piped water for drinking relative to SC/ST social group. Further, the occupation dummies have an insignificant effect on the sources of drinking water except for the business and clerical occupation for the most expensive source that is borewell. The estimated marginal probability coefficients show that on average probability of using borewells for drinking among this occupation group is respectively 20.94 times higher than the occupation group which is related to elementary work.
Summary and Conclusion
The study clearly reveals that the current state of water supply in Uttar Pradesh is inadequate covering all standards, either in terms of quantity or quality. There are both public and private sources of water supply in the study area. The data show that about 49 per cent sampled households use municipal water supply consisting piped water and public tap for drinking purposes, while 29 per cent households use borewell and 22 per cent households obtain their drinking water from hand-pumps. It is clear that the main source of drinking water is groundwater in Kanpur, while piped water is the main source in Lucknow indicating a poor water supply in the former city.
None of the households say that municipal water is available 24 hours a day and 7 days a week. Households encounter problems with municipal water services in terms of its look and smell. About 42 per cent households report a foul smell in the water supply while 50 per cent households have a problem of a dirty water. In terms of adequacy, the percentage of households getting sufficient water throughout the year is reported to be the highest for borewell and the lowest for public tap.
The study has also highlighted the existing inequities in accessing drinking water among different socio-economic groups. The lower income group depends greatly on public taps and hand-pumps. The diversification index also confirms that there are diversities in the adequacy of drinking water, and access and distance to water sources. The disadvantaged groups have to face great hardship in accessing drinking water as compared to upper caste communities. It is suggested that policymakers should formulate people-centred policies while looking at the supply of water rather than target-oriented ones.
The article empirically analyses factors affecting the availability of drinking water within premises using the logistic regression analysis. The results of the regression analysis clearly identifies education and income level of the households as important socio-economic factors affecting access to drinking water within premises. However, occupation and family size are other important factors, which are more likely to influence having access to drinking water within premises. The results of multinomial logit model also reveal that education, income, caste, occupation and family size are the determining factors for drinking water source.
By looking at factors influencing availability of drinking water, the role of income and the level of education are very crucial. For this reason, improvement of human capital is strongly needed to indirectly increase the availability of decent drinking water facilities in every household.
Footnotes
Acknowledgements
The article is based on the a thesis awarded by B.B.A. University, Lucknow, under the supervision of Professor Sanatan Nayak. I would like to thank Professor Nayak for his valuable comments on an earlier draft of this article.