




Abstract
The article focuses on the geographical dimension of child sex ratio (CSR) and its evolving pattern for the last 40 years (1981–2011). Using a spatial statistical approach, it has been possible to identify homogeneous groups of objects in the study area. The study considered the role of spatial proximity of cultural diffusion which spreads rapidly regardless of the position of groups within a social structure. In doing so, the article tried to conceptualise the role of region in shaping its gender. The study explained declining CSR through the process of two mechanisms: one, the regional pull, that is, a region exerts a force so as to cause a movement towards itself and the other, diffusion of knowledge and ideational changes. Finally, the study has tried to measure the effect of socio-economic variables on CSR through a regression model.
Introduction
India is the second most populous country in the world and it is facing a huge problem of a declining child sex ratio (CSR). For the last 40 years (1981–2011), the number of girls in India has been shrinking as compared to the number of boys. The causes for this skewed CSR as explained through a kinship pattern (Agnihotri, 1997; Dyson & Moore, 1983; Miller, 1981, 1989) or neglect of the girl child (Arokiasamy, 2004; Bardhan, 1974; Das Gupta, 1987; Mayer, 1999; Visaria, 1968) are mainly due to the social value attached to women because of their economic utility. Recent studies on low CSR have repeatedly emphasised more on the practices of sex-selective abortions rather than excessive female infant mortality (Almond, Edlund & Milligan, 2013; Das Gupta, 2005; Park & Cho, 1995). The recently published census data have confirmed a gradual spreading of child masculinity from the country’s northwestern region where there exists a female unfriendly cultural regime to other parts of the country. The spread of child masculinity in each subsequent census from a nodal area to the peripheral zone (Guilmoto, 2005) is not random, but a patterned process following a geographical regularity.
The spread of low CSR beyond its traditional boundaries definitely gives a clue of regional influence that works beyond social influence and social proximity. The spatial pattern of the masculine CSR hints at the diffusion of shock waves from an epicentre of innovation to the surrounding area. Demographers and social scientists have so far tried to address the geographical pattern of CSR through density maps or through cross-tabulation that simply show the concentration of the data over the study area. Although such studies have produced substantial explanations, they fail to organise observed data into a meaningful structure, and the fact that data are often spatially autocorrelated is rarely taken into consideration. Through the spatial statistical approach, it is possible to explore the important hidden dimension of data, in addition, showing where high or low values of the phenomenon studied tend to concentrate. This would give a regional pattern of gender discrimination and also demonstrate how gender matters to a region.
Considering space as a crucial element of demographic behaviour, which is likely to be spatially homogeneous, this article will analyse the spatiotemporal evolution of CSR through a spatial statistical approach. Further, the analysis has focussed on various factors that can be associated with contemporary sex discrimination and clarified their relative explanatory power. As the article intends to examine the specific role played by a region in determining sex ratio variation an attempt has been made to classify the whole region (India) according to its geographical location and incorporate most of the social and cultural correlates of sex ratio that are usually put forward.
Data
The district-level data on CSR (0–6 years) have been taken from the Census 1981–2011 provided by Registrar General of India. Socio-cultural and demographic indicators have been taken from Census 2011 and district-level household surveys (2007–2008). The data of total fertility rates has been taken from Christophe Z. Guilmoto and Irudaya Rajan’s (2013) paper titled, ‘Fertility at District Level in India: Lessons from the 2011 Census’.
Methods
The study calculated CSR based on the Census data 1981–2011. The socio-cultural series (C series) of census data provide the total number of population by age and sex. The CSR is defined as the number of girls per every 1,000 boys aged 0–6 years.
CSR = (0–6 female population/0–6 male population)*1,000
Thus, the proportion below 1,000 indicates a lower number of females to males, whereas the proportion above 1,000 indicates a higher number of females to males. The regional variation is shown on the basis of mapping using ArcGIS 9.3 version. A zonal map is made on the basis of the CSR obtained in different regions. The map will be used to show the distribution of CSR to identify the spatial spread of female child deficit.
Hotspot Analysis
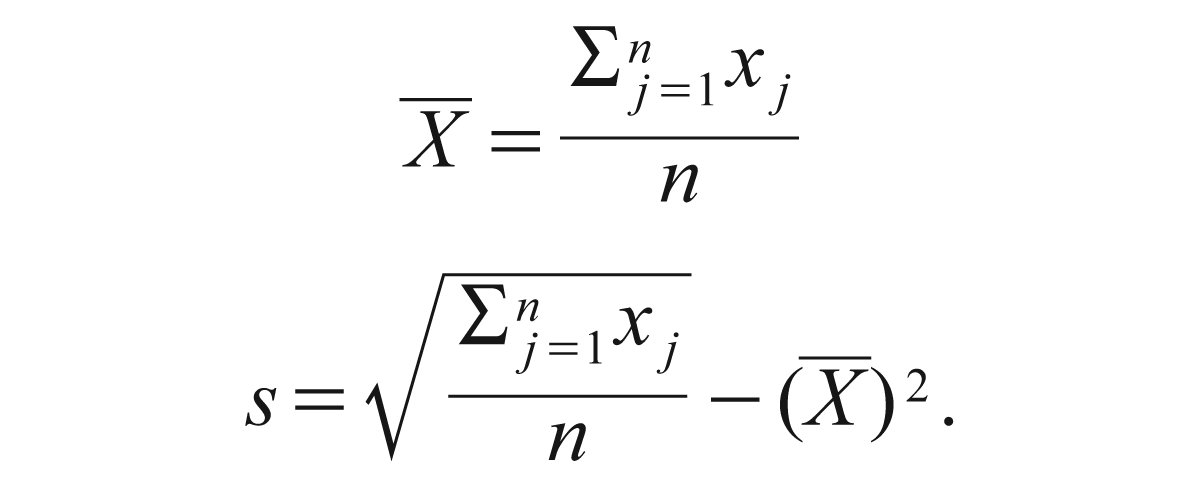
Hotspot analysis identifies the locations of statistically significant hotspots and cold spots in data. This measures how concentrated the high or low values are for a given study area. The null hypothesis for the General G statistic states that, ‘There is no spatial clustering of the values’ (ESRI, 2013). A high Z-score and small P value for a feature indicate a significant hotspot. A low negative Z score and small P -value indicate a significant cold spot.

where xj is the attribute value for the feature j, wi,j is the special weight between features i and j,n is the equal to the total number of features and
The
Multiple Linear Regressions
Multiple linear regression attempts to model the relationship between explanatory variables and a response variable, that is, district-level CSR by fitting a linear equation to observed data. Every value of the independent variable x is associated with a value of the dependent variable y. The population regression line for p explanatory variables x1, x2, …, xp is defined to be μy = β0 + β1x1 + β2x2 + … + βpxp. This line describes how the mean response μy changes with the explanatory variables.
Formally, the model for multiple linear regression, given n observations, is yi= β0 + β1xi1 + β2xi2 + … βpxip + ɛi for i = 1, 2, … n.
Evolving Pattern of CSR since 1981–2011
The district-level CSR from the Census 1981 has been analysed. Historically, the CSR in India has always been skewed in northwestern India. Literature on CSR points out a clear division between the northwest and southeast pattern of female survival disadvantage (Agnihotri, 2000; Miller, 1981). The reasons of child masculinity in northwestern states have been explained by the cultural practise and kinship structure which attaches less utility to female children than male children and produces social norms hostile to the survival of a girl child. The economic and social worth of daughters in south Indian families is much higher when compared to North Indian families. Life expectancy at birth is much higher for girls born in south India, they are more likely to be educated, to contribute in the productive economy, allowed to have late marriage, closer to their natal home, and thus maintain ties with parents even after marriage (Jeffery, Jeffery & Lyon, 1988; Miller, 1981; Moore, 1978; Sharma, 1980; Sopher, 1980).
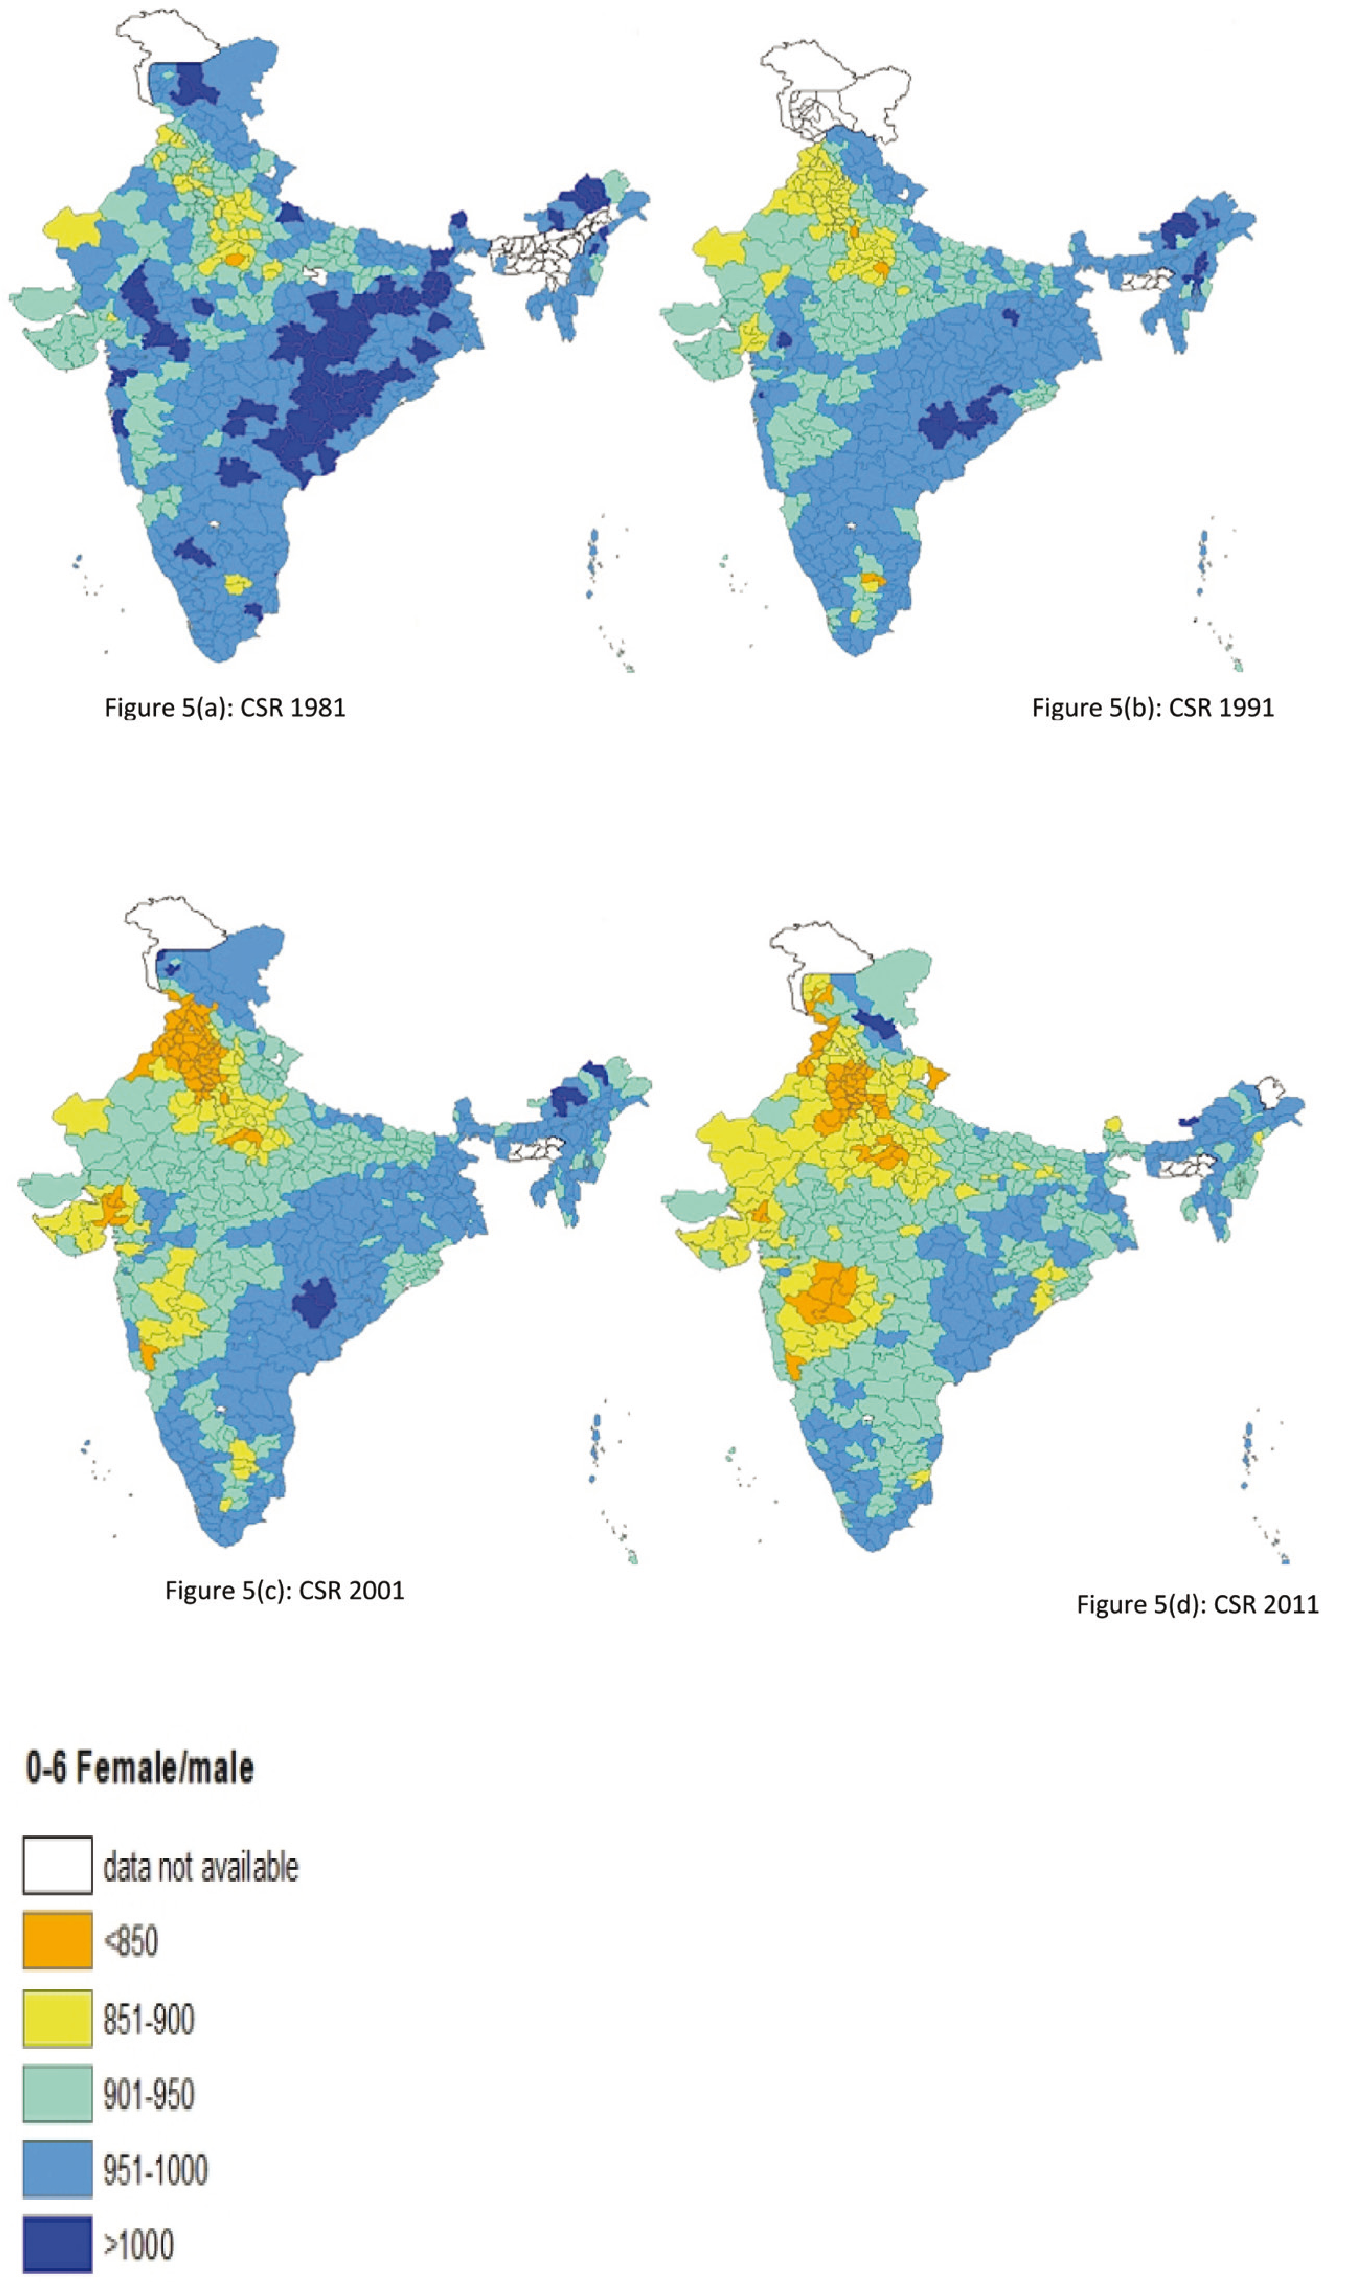
Traditionally, the geographical structure of the CSR stretches across the Narmada–Sone or the Bharuch–Chhotanagpur axis (Agnihotri, 2003). Five broad categories (Figures 1–4) of female-to-male (0–6 years age group) population have been identified as up to 850, between 851 and 900, between 901 and 950, between 951 and 1,000 and above 1,000 for all four censuses since 1981–2011. Districts falling into the first two categories are those where the female deficit is strong, the third category shows moderate child deficit, whereas the last two categories represent a favourable CSR. In 1981, the CSR of India was 962 with much internal variation at the district level. The lowest CSR (832) in 1981 was in the Gwalior district of Madhya Pradesh. This is the only district having CSR below 850. Two other districts, Morena (891) and Bhind (877) of Madhya Pradesh showed substantially low CSR. Considering 950 as a threshold point of normal CSR (i.e., no gender discrimination), the districts having CSR less than 950 are assumed to be the districts of excess female child mortality. This zone of higher girl mortality stretches from the northwestern states of Punjab, Rajasthan, Gujarat to the eastern states of Uttar Pradesh and Bihar and stops at the border of West Bengal. Among northeastern states, Dibang Valley (910) in Arunachal Pradesh and Urukhrul in Manipur (949) are coming under this zone. In south India, Salem and Namakkal (899) are two districts with having lower CSR. Favourable sex ratio of population 0–6 stretches from the Southwest to Northeast covering the states of Karnataka (except Bidar, Uttar Kannada), Andhra Pradesh, Kerala, Tamil Nadu (except Salem, Namakkal) Chhattisgarh, Odisha, Jharkhand, West Bengal and some districts in Bihar and all northeastern states.
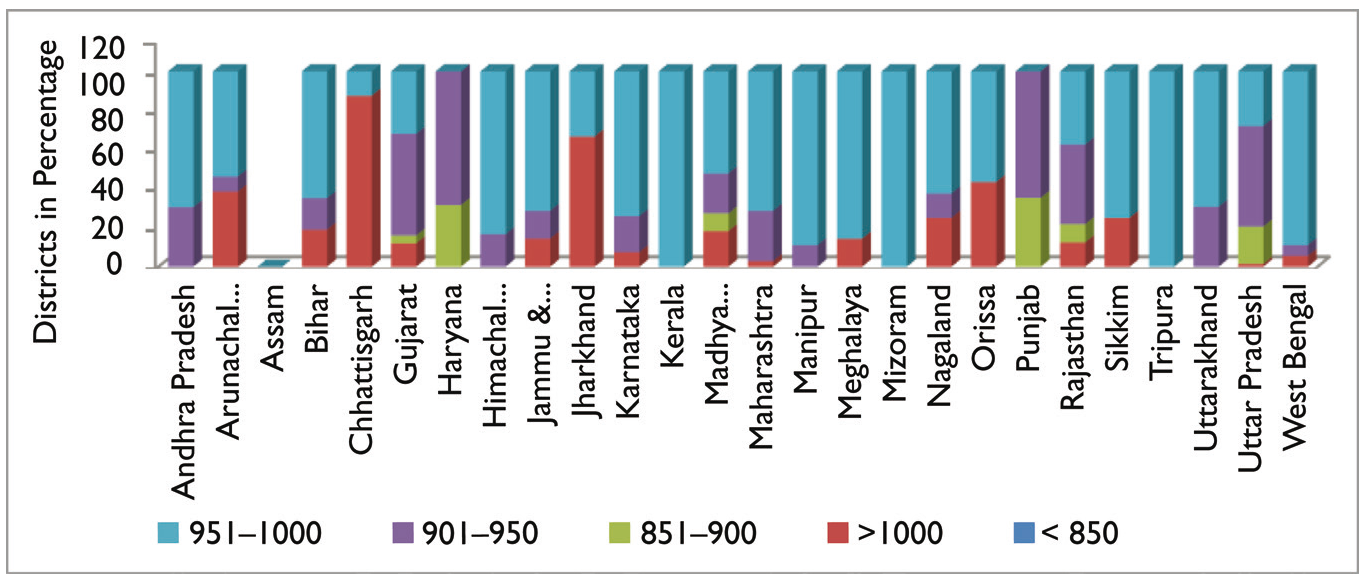
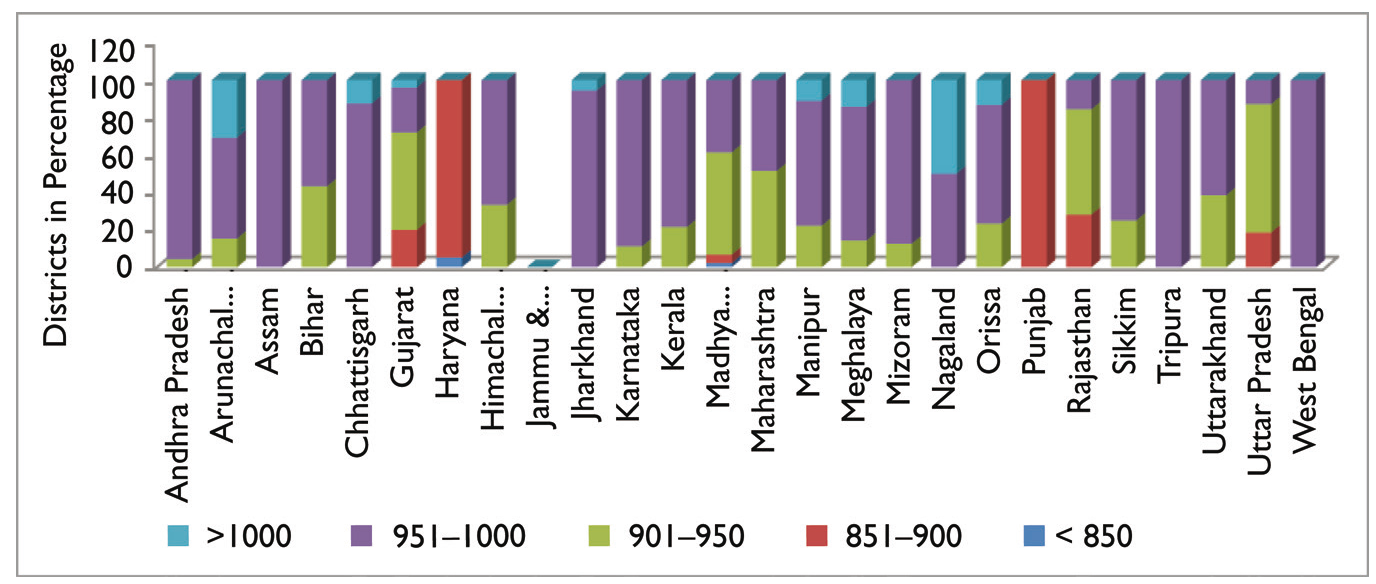
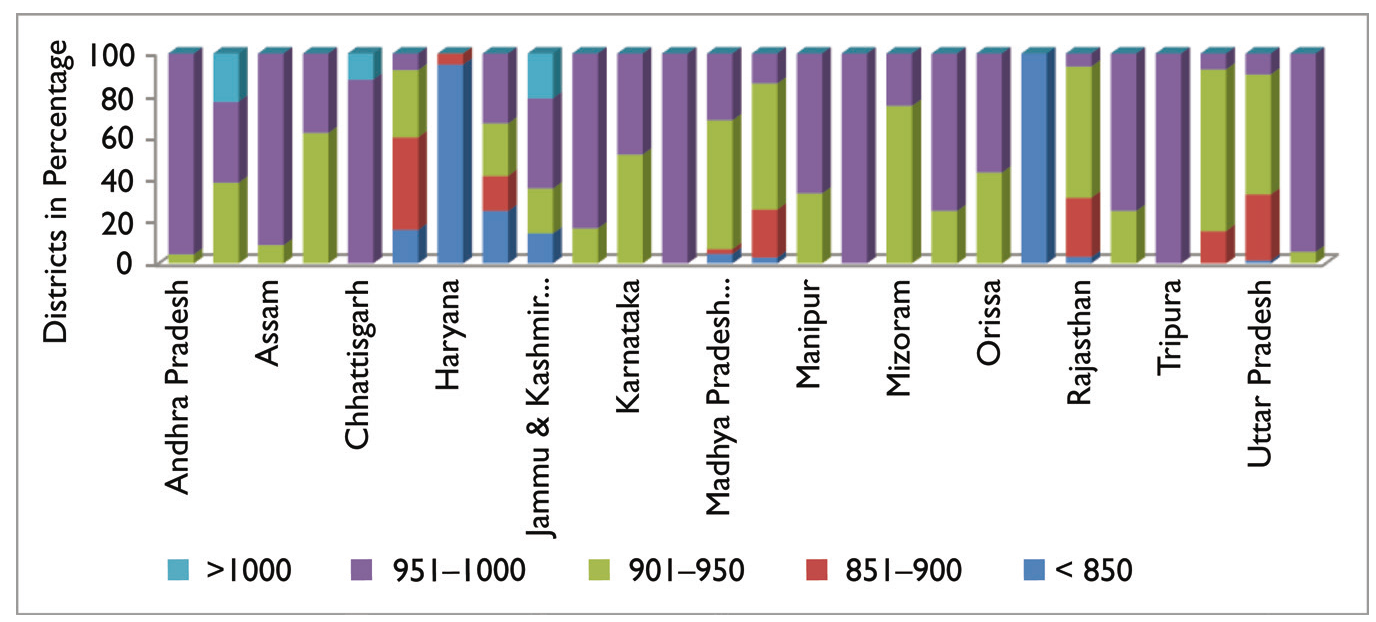

The highest CSR (1,079) has been found in the Krishna district of Andhra Pradesh. Indian regional demography represents a clear demarcation of the northwest and southeast CSR (Miller, 1989) which corresponds to many other socio-cultural features like kinship structure, fertility level and female autonomy (Dyson & Moore, 1983). North Indian states, which have the highest female mortality, are characterised by patrilocal exogamy for females. In North Indian kinship systems, cooperation and help are sought from male blood relatives and women are excluded from the line of property inheritance. In contrast, in the southern states, where gender differences in mortality are relatively low, village endogamy and cross-cousin marriages are prevalent (Dyson & Moore, 1983). Thirty-five districts in 1981 have a CSR below 900 indicating a serious scarcity of girl child. The districts (Bhind, Morena, Datia, Dhaulapur, Mainpuri, Jind, Sonipat, Agra, Aligarh and Firozabad), with a CSR of below 900, have formed a cluster surrounding the district Gwalior where the lowest CSR of the decade 1981 has been found. Whereas in eastern India, the districts with high sex ratio( >1,000) are found in the state of Andhra Pradesh, Odisha, Madhya Pradesh, Chhattisgarh, Jharkhand, Bihar and West Bengal. They form a swathe stretching from south Odisha to the border of West Bengal.
Following these two clusters found in 1981 (Figure 5a), the study will proceed to explore the spatial spread and behaviour of these clusters in each subsequent decades (1991, 2001 and 2011). Since the focus of the study is centred around the last 40 year period, we have considered 1981 as the base year of our study and try to track the spatially evolving pattern of CSR on the basis of 1981. As the study hypothesises the role of spatial proximity in forming cluster and its real expansion, we assumed, that the district having the lowest CSR within a cluster of low CSR is the potential region which influences its surrounding region.
Further, we tried to find out whether these clusters are geographically fixed and if there are some other clusters that have or can emerge in due course of time. For the convenience of identification, each cluster has been given a name according to the name of their source region (district). It has been possible to observe the discrimination of sex ratio and its evolving pattern through maps going back consecutive 40 years. At a glance, the map of 1991 (Figure 5b) showed a huge decline of dark blue patches as the number of districts having CSR greater than 1,000 have been reduced from 86 in 1981 to 20 in 1991. Out of the districts that had formed a cluster of high CSR (above 1,000) in 1981, many of them have decreased their values. Baugh (1,004), Bastar (1,003), Dantewara (1,017) and Koraput have a CSR greater than 1,000 since 1981. Apart from districts within the cluster with a high CSR, there were few districts (West Nimar, Jhabua, Banaswada, Dungarpur, Udaipur, Rajasmand, Rajgarh, The Dang, Valsad, Navsari, Hassan, Mandya, Pudukottai, Mahbubnagar and Khedi) which had their values greater than 1,000 in 1981 seemed to have lost the female advantage in 1991 and had a CSR less than 1,000. The Gwalior cluster (1981) of a low CSR has extended towards northwest covering most of the districts in Punjab and Haryana and bordering districts of Rajasthan (Ganganagar, Hanumangarh and Jhunjhunun) in 1991. The lowest value of CSR in 1991 has been found in Salem (830), followed by Faridabad (844) and Bhind (850). Gandhinagar and Jaisalmer are two districts which have a CSR in the category of 851–900 since 1981. It is noteworthy, to mention that 1991 has produced another cluster of low CSR (851–900) surrounding the district of Gandhinagar and its adjacent districts of Ahmedabad, Anand, Mahesena and Kheda. Thus, Gandhinagar is the newly emerged epicentre of low CSR in western India, and it spread shock waves (Kuzhiparambil & Rajani, 2012) of low CSR to the above-mentioned adjacent districts. The map of 1991 depicted the spatial spread of a low CSR and contraction of high CSR.
The spatial patterns of sex discrimination are much more pronounced in the map of 2001 (Figure 5c) as the districts with low child ratio have increased further and spread outward along with a sharp contraction of the districts which had a favourable CSR in previous census. In northern India, the number of districts below 900 has increased and in large numbers of districts CSR has gone below 850 surrounding the Gwalior cluster. Bastar (1,009) and Dantewara (1,014) are two districts that were able to hold their CSR above 1,000 since 1981.
Among states in the northeast, East Kameng (1,035) and Upper Siang (1,010) are two districts having values greater than 1,000. The districts that have their CSR above 951 seem to be compressed and missing numerically. The districts, Surendranagar (886), Jamnagar (898), Bhavnagar (881), Rajkot (854), Amreli (923) and Porbandar (909) adjacent to Gandhinagar (813), have shown a decline in their CSR in this decade. In 2001, Kolhapur district appeared to be another potential source region of low CSR. Kolhapur (839) and its surrounding districts like Sangli (851), Satara (878), Solapur (895), Osmanabad (894), Bhid (894), Ahmadnagar (884), Jalgaon (880) and Aurangabad (886) have decreased their CSR less than 900 in 2001. The 2011 (Figure 5d) data show only two districts Lahul & Spiti (1,013) and Tawang (1,005) are having a CSR above 1,000. The northern Gwalior cluster has spread outward and covered many districts in Rajasthan and collides with the cluster in Gujarat surrounded by Gandhinagar. The cluster of Kolhapur district has extended further in this decade. The resulting maps show an increase in low CSR from the source region and its spread towards peripheral zone reflects what Gulimoto (2008) considered as contagion effect. Each cluster spreading in successive census points out to diffusion mechanism where a potential source region or epicentre (Kuzhiparambil & Rajani, 2012) sends out shock waves of low CSRs to its neighbouring regions and the effect of diffusion is measured by the proportion of region coming under the shock wave (Kuzhiparambil & Rajani, 2012).
The data analysis of 40 years identified a possible epicentre from where the diffusion mechanism evolves. In 1981, we assumed Gwalior as a probable source of diffusion as it has the lowest CSR among the surrounding districts. We consider the district having a lower value for a consecutive 40 years as a potential source of female discrimination and diffusion is directly related to the distance from the source of the information (Hagerstrand, 1967). From these source regions, the behaviour tends to spread outward and captures the adjacent districts. We begin with the Gwalior epicentre of female child deficit on the map in 1981 and trace their behaviour in subsequent censuses to confirm the pattern of female child deficit in India. In 1991, Gandhinagar and in 2001, Kolhapur emerged as a new epicentre.
Hotspot Detection
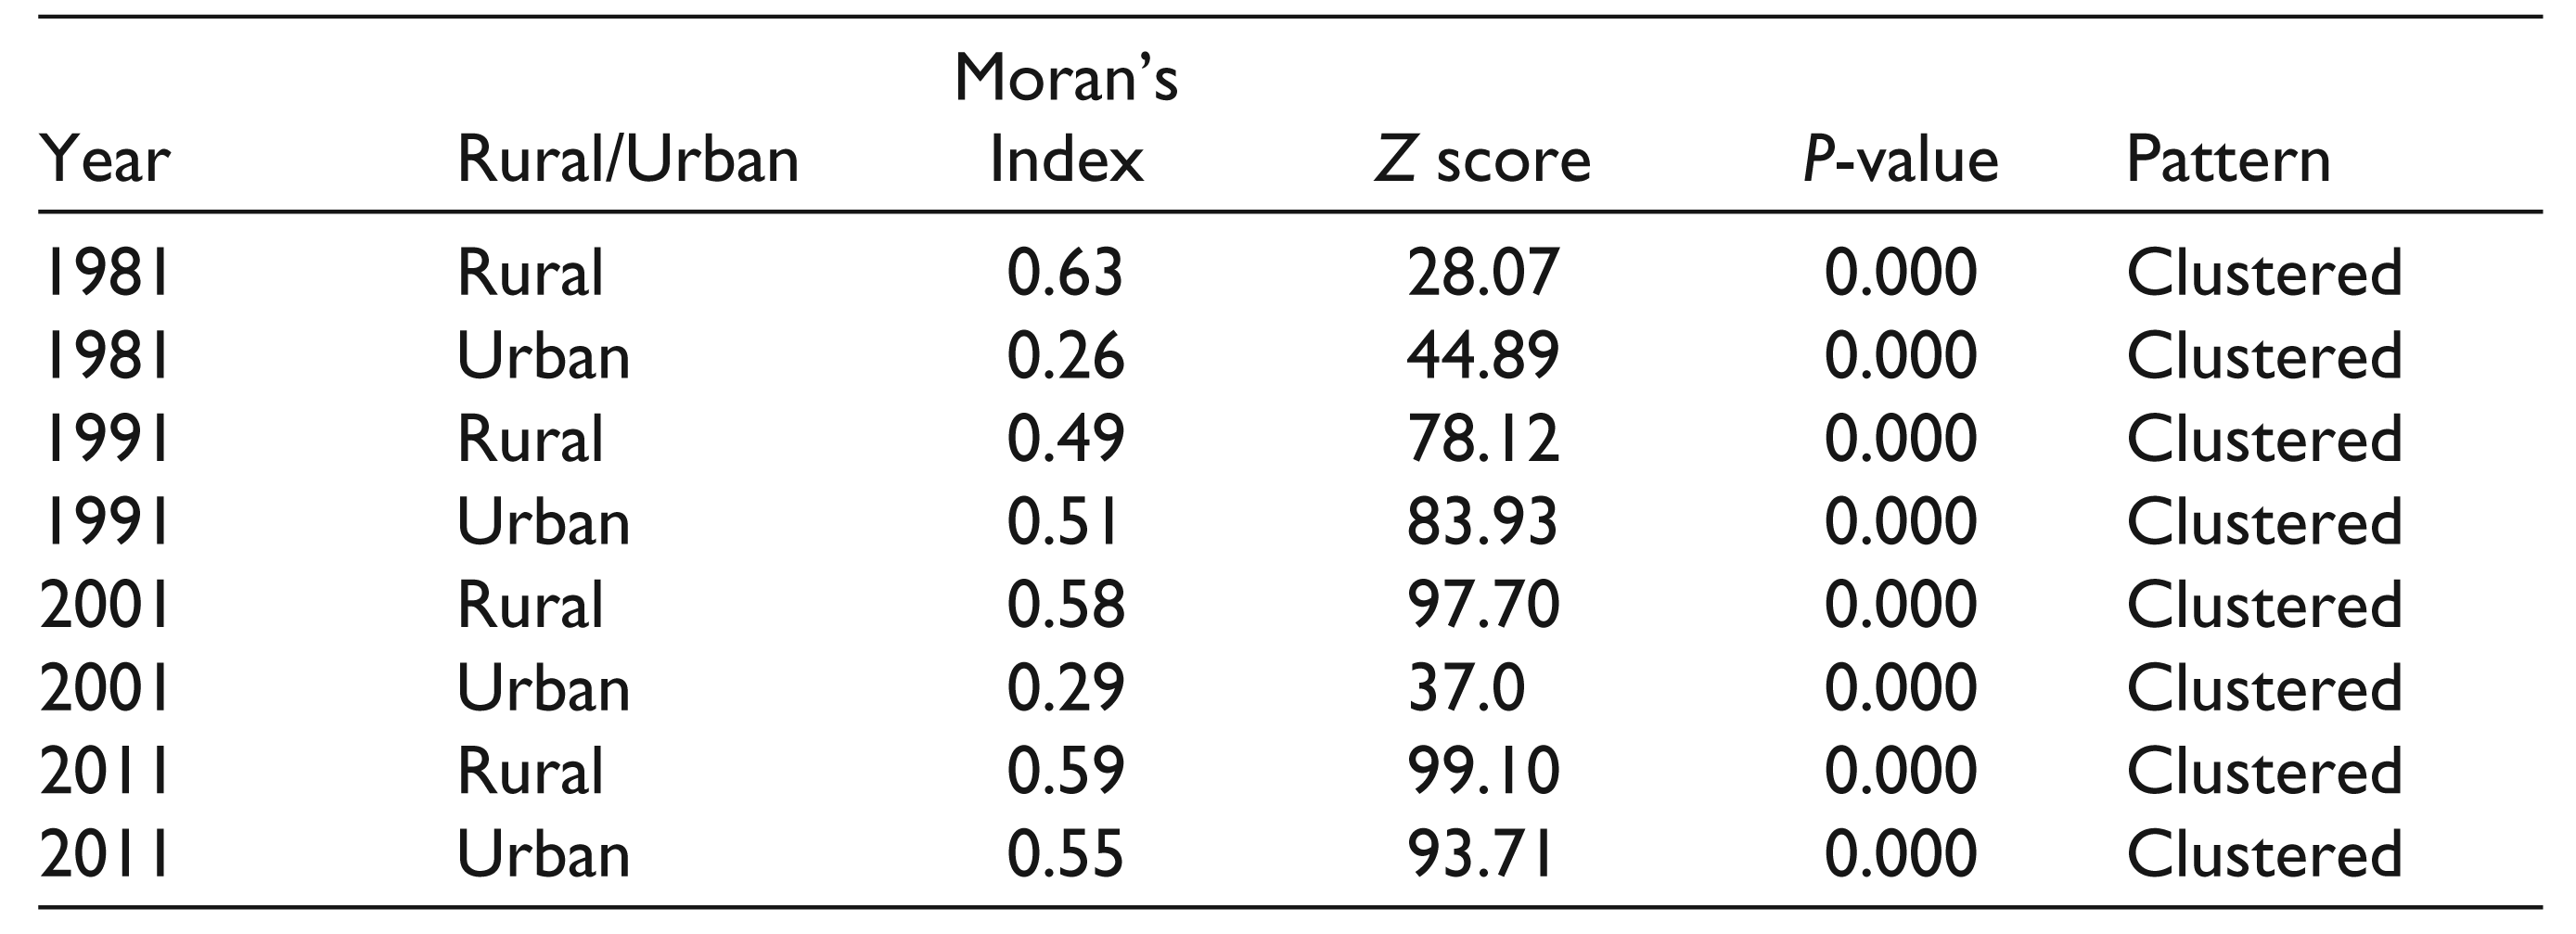
As our major concern is to find the spatial pattern of CSR through the period of 40 years, it leads to the identification of spatial association. Inspired by the notion that all things are related to each other but near things seem more far (Tobler, 1965), we tried to identify the local pattern of the CSR and its change over the given time period. Hotspot detection can be useful to examine the local level of spatial autocorrelation to identify districts where values of CSR are extreme and geographically homogeneous. Hotspot indicates some form of clustering in the spatial distribution (Osei & Duker, 2008). Global Moran’s I is used to assess the overall pattern (Table 1) of the data but it tends to average local variation and give a general autocorrelation of the pattern. Global spatial autocorrelation can be used as the threshold for defining hotspot (Nelson & Boots, 2008). The value of Moran’s I range from −1 to +1, while a positive value indicates positive spatial autocorrelation and negative value indicates negative spatial autocorrelation a value close to ‘0’ indicates spatial randomness. The significance level was set at 99 per cent.
Result of Global Moran’s I
Hotspot analysis assesses each feature within the context of its neighbouring features and compares the local situation to the global situation (ESRI, 2013). It separates statistically significant cluster of low CSR and high CSR or the cold spot and hotspot. 1 Here, low CSR means the statistically significant cluster of low CSR (0–6 F/0–6 M*1,000) which represents the less female favourable zone compared to the hotspot. This statistic serve the purpose of quantifying the degree of association through the concentration of weighted points (or area represented by a weighted point) and includes all other weighted points within a radius of distance d from the original weighted point (Getis & Ord, 1992). The result expresses the Z-score and P-value of the calculated Gi* (d), in comparison with the normal distribution of the statistics calculated by simulation (Feser, Sweeney & Renski, 2005). The Inverse Distance Weighting (IDW) interpolation method has been used which implements the assumption that closer things are much more alike than those which are farther apart. A significant hotspot stands for the features having the high Z-score and small P-value in such a way a significant cold spot would have low negative Z-score and small P-value. The value of Z-score intensifies the clustering. A higher value of Z-score means that the intensity of clustering is high and vice versa. A Z-score near zero means no spatial clustering. Each hotspot analysis of CSR showed statistically significant hotspots (P < 0.00).
Spatial Analysis of Hotspot
While going through the density maps for the last four decades, the deterioration of CSR in each subsequent decade was quite visible. The extent of CSR from its usual geographic limitation was also noticeable. While the density map can only tell us where the cluster in the data exists, hotspot analyses give the statistical significance of those clusters and ensure that the occurrence of the cluster is not by random chance. There are some outstanding spatial clusters of CSR covering specific locations.
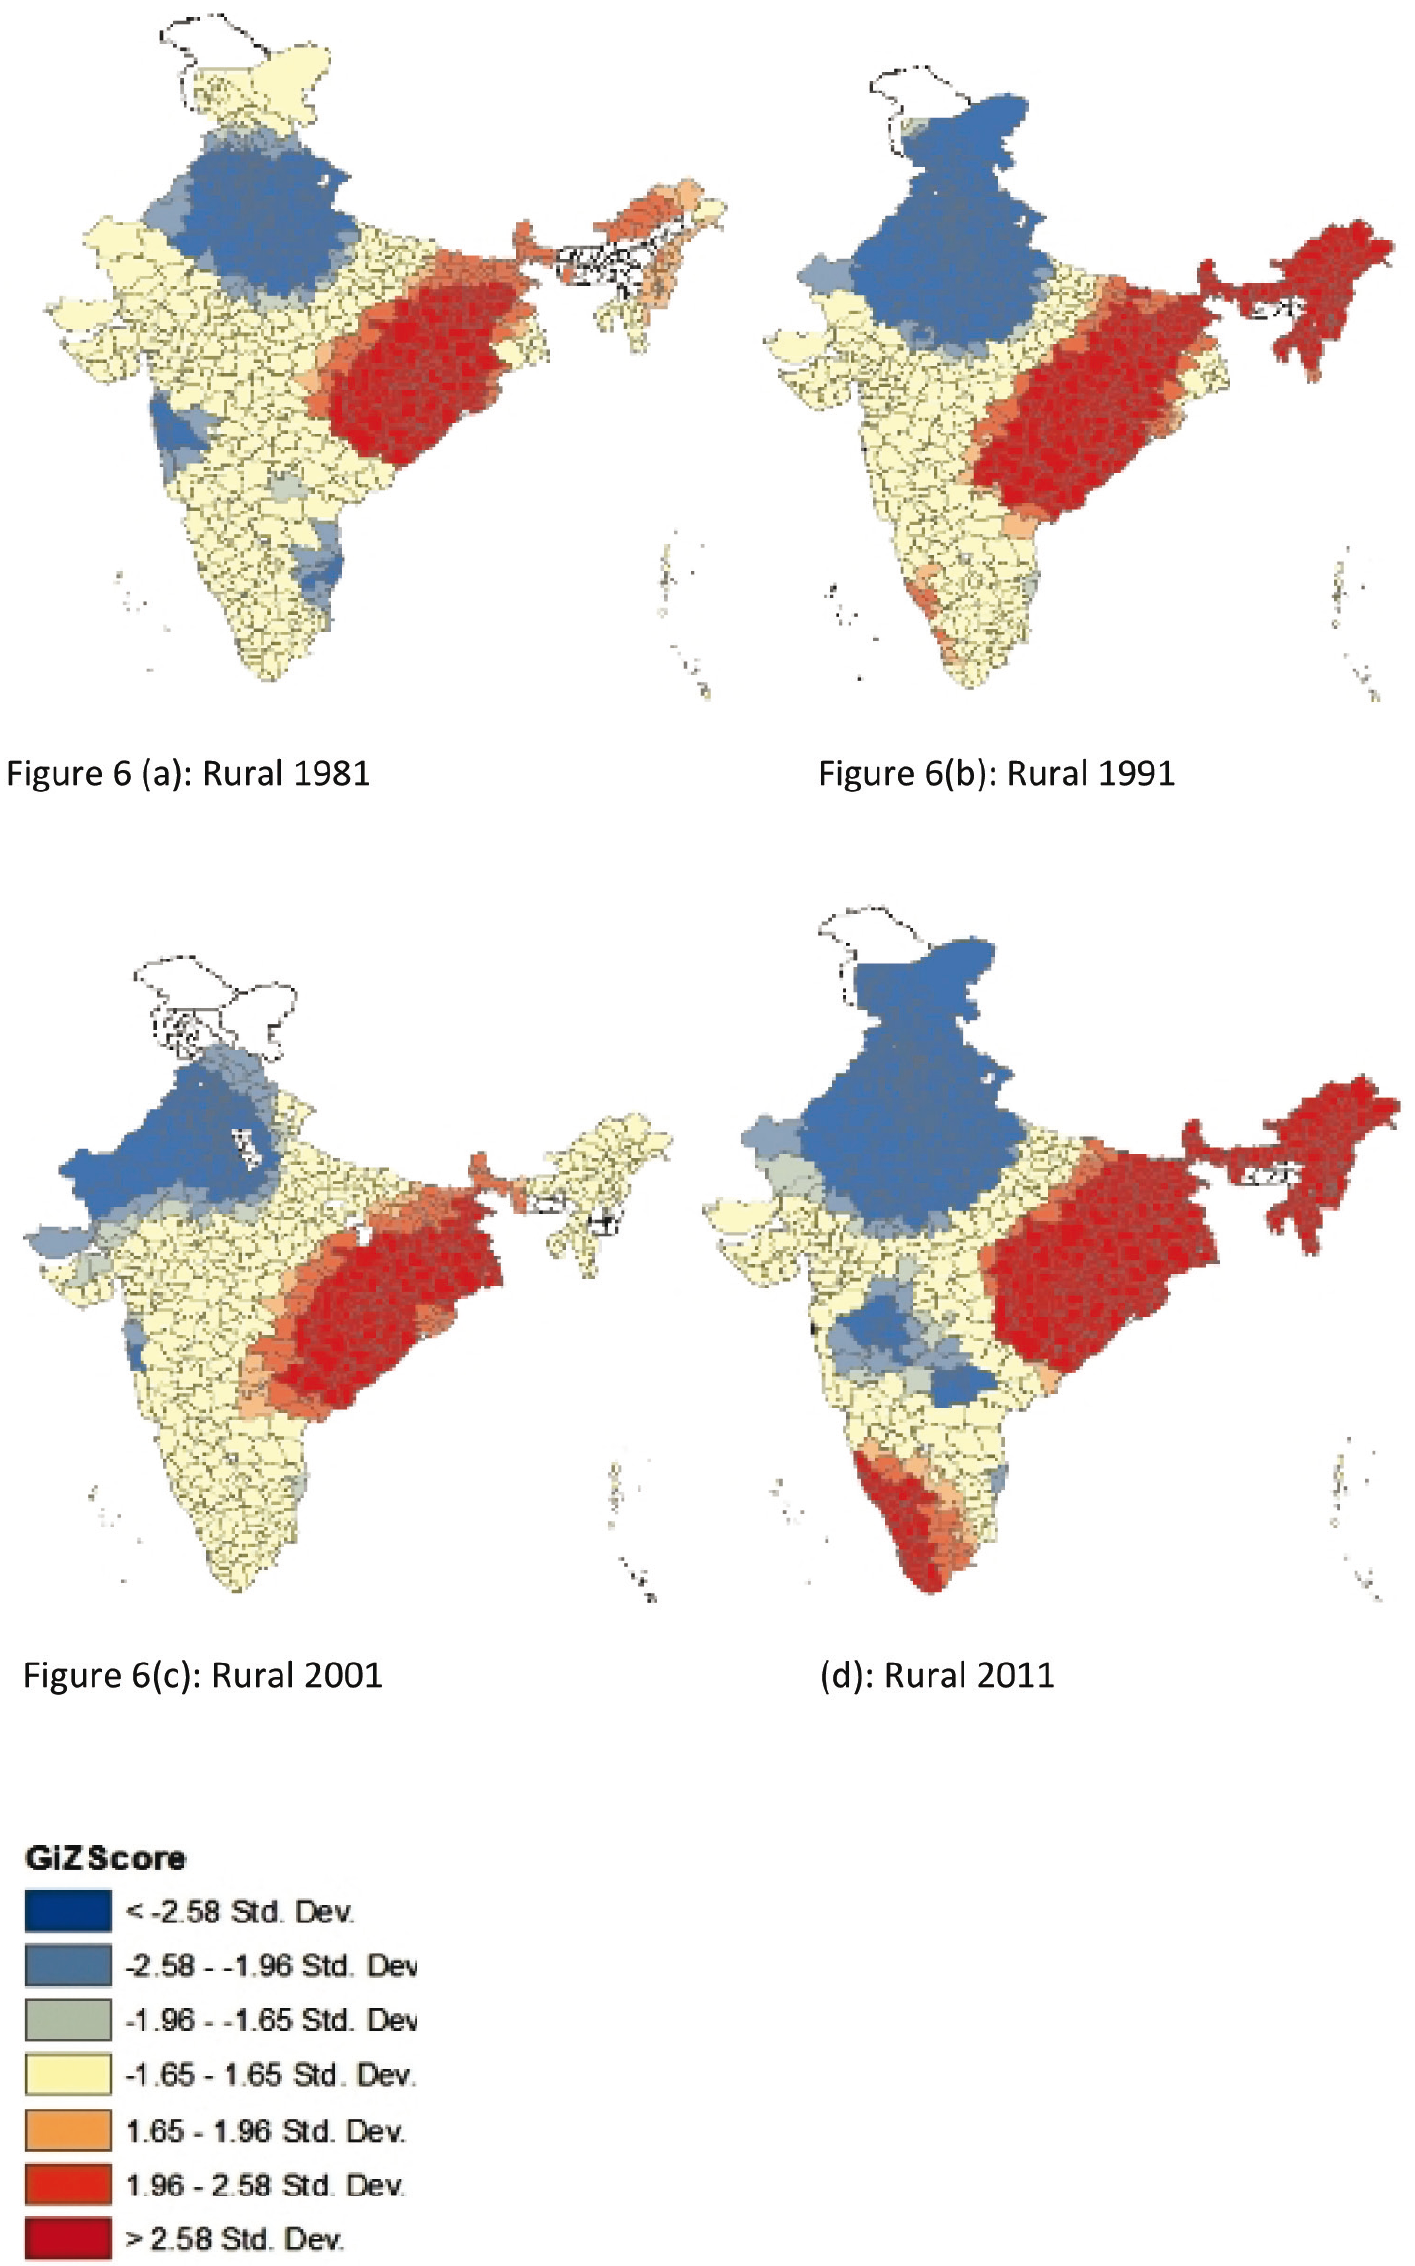
In the maps (Figure 6), red areas indicate statistically significant hotspots while blue areas represent significant cold spot areas. This map showed a clear spatial pattern of a CSR in rural and urban India. Both rural and urban maps show a rapid decline of the hotspot and a gradual increase in the cold spot area. The result shows hotspot (the statistically significant female favourable cluster) seems to be decreasing over space along with a gradual increase of cold spot. In 1981, a rural hotspot (Figure 6a) was in eastern to the northeastern region. It stretches from Dakshin Bastar Dantewara in Chhattisgarh to Dibang Valley in Arunachal Pradesh. Laying in the northeast direction it covers most districts of Bihar, Odisha, Chhattisgarh, Jharkhand and West Bengal. Bordering districts of Uttar Pradesh (Balia, Ghazipur) Madhya Pradesh (Sheoni, Shidhi), Andhra Pradesh (Vishakapatnam) and Maharashtra (Nagpur).
A cold spot has been found in the northern region, covering mainly the state of Punjab, Haryana and Himachal Pradesh and stretching up to the district of Hamirpur, Lucknow, Kanpur in Uttar Pradesh, Guna in Madhya Pradesh, Ganganagar and Bikaner in Rajasthan. In 1981, hotspot (Figure 6e) of urban CSR has covered an elongated area of the district of Mahububanagar and Prakasham in Andhra Pradesh to Malda and Murshidabad district of West Bengal in a south-west to northeasterly direction. It has extended up to the Damoh and Raisen district in Madhya Pradesh in the west. The track of the hotspot mainly covered the districts of Bihar, Chhattisgarh and Jharkhand. The northern cold spot of urban India for 1981 is far smaller than rural India. A cold spot in northeastern India is also visible. In 1991, rural (Figure 6b) hotspot seems to decrease slightly towards the coastal districts of Odisha and Andhra Pradesh but remains more or less in the same direction.
On the contrary, a northern cold spot stretched towards the south-west direction. Compare to 1981, in 1991 a majority of districts of Rajasthan came under the cold spot region. The cold spot of the rural CSR in 1991 reached up to Barmer in Rajasthan and moved further up to Rajkot in Gujarat. It covered some districts in western Uttar Pradesh, like Bijnor, Budaun, Etawah and Shivpuri, Sheopur and Morena in Madhya Pradesh. The cold spot reached up to Lahul and Spiti and Chamba in the north. In 1991, the map of urban (Figure 6f) CSR shows a clear division of the northwest cold spot and a southeast hotspot is visible. The hotspot lying in the southwest to northeast direction covers all the southern states along with the state of Odisha, Bihar and Chhattisgarh and Jharkhand in the east. In 1991, a cold spot in rural India has been found in the northwestern part, from Himachal Pradesh to western Uttar Pradesh. The track of a cold spot in northeastern India seemed to have shrunk in 1991.
In 2001 (rural map, Figure 6c), the number of districts favourable to women decreased abruptly. The hotspot that spread in an elongated form till 1991 declined massively and concentrated in the eastern part of the country. It has covered few districts of Odisha, Bihar and West Bengal and stretches up to the northeastern states. The cold spot in 2001 rural map concentrated in the northwestern part in the districts of the state of Jammu and Kashmir, Punjab, Haryana, Rajasthan and western Uttar Pradesh. In 2001 (urban map, Figure 6g), a clearer picture of the northwest and southeast division of cold spot and hotspot has been found. A large number of districts have been discarded from the hotspot region. A comparatively narrow belt of high CSR passed through the state of Bihar, West Bengal and few districts of eastern Uttar Pradesh, Maharashtra, Madhya Pradesh and most of the districts of Odisha, Andhra Pradesh, Tamil Nadu and Kerala. In each decade, a pattern confirmed that the cluster of low CSR gradually expanded from the northern part to the central and western part, while the hotspot was narrowing rapidly and shifting from the east to southern districts. In the 2011 rural map (Figure 6d), two hotspots were observed: one in the eastern part and another in the extreme south-eastern part of the country. A cold spot remained in the same position but spread outward.
The present result indicates that a spatial statistics approach can play an important role in exploring the spatial structure of particular social phenomena. Rather than giving a formal analysis of distribution through density mapping, this analysis provides a geographical closeness through the spatial proximity of data.
Conceptualising Spatial Process
The geographical concentration of a skewed CSR as an index of discrimination towards the girl child highlights a strong aspect of spatial patterning. While observing the thematic map of CSR the north–south distinctive division is discernible and assumed to be unchanging over the years. The cluster formed in the northwestern part seems to be persistent irrespective of time and place (rural–urban) and systematically spreading from its spatial limitation. The pace and space of declining CSR essentially gives a formal framework that represents the strong level of geographical regularity in the distribution of values. To elicit the interconnection of geography and gender, we perceived physical space as a medium through which social relations are produced and executed. In this study, our concern is to identify historical and social grounded gender and space relations which give a unique character to that region. In this study, we assume that a value in a given district is influenced by the values observed in adjacent districts. Cultural commonalities and contrasts tied up with space in Indian demographic literature endorse better explanation of gender preference as an identity of a space. Arokiasamy (2004, p. 838) has argued, ‘More generally, a regional variation of gender bias and inequalities reflects the extent of patriarchy and its demographic influence across the region.’
The manner in which the CSR of India has evolved over a period of 40 years assumes that two simultaneous processes of evolution have occurred. Districts where the CSR is less than 900 are found to spread from the core area to the adjacent districts forming a contiguous patch, what Guilmoto (2008) calls the contagion effect. Guilmoto (2005) considers the diffusion effect—a geographical spread from certain innovative nodal areas towards the peripheries. The core area has been conceptualised as the epicentre of missing girls, and its spatial spread towards periphery has been captured by Kuzhiparambil and Rajani (2012). In our analysis of the last 40 years, Gwalior, (1981 Census) Gandhinagar (1991 Census) and Kolhapur (2001 Census) have been identified as potential epicentres which had their values of CSR lower and spread the shock wave of low CSRs in subsequent decades. We conceptualise a regional pull from the core area that exerts a force and cause it to move the adjacent areas towards it, where cultural practise and human activities take place on the material and spatial form.
On the other hand, districts having values more than 951 have been declining rapidly for every decade. This is very much visible on the map as we can see the reduction of those districts having CSR above 951 (blue patches) all over the districts. The overall deterioration of CSR can be assumed as a result of technological diffusion that might be more visible in an urban area than a rural area. Thus, this study essentially identifies a clustering mechanism, that is, a regional pull. Occurring in those districts that are surrounded by the mother districts where female infanticide is a traditional practise and a diffusion mechanism where there is a sharp decline of CSR from each decade irrespective of their culture and tradition. We consider a clustering effect, surrounding a particular district, is the outcome of a neighbourhood effect where the behaviour of an individual is heavily influenced by the behaviour (or by the perceived behaviour) of others or through the sociological theories of learning, influence and network (Casterline, 2001).
Nevertheless, this mechanism is valid for those districts where decline has not occurred surrounding a mother district from where the shock wave of low CSR is supposed to be spread instead, the overall decline in CSR can be justified through the global channels of social interaction. The multiplicity of the channel through which information and ideas flow, brings ideational changes in global (national) level and are not restricted to regional settings. These channels may be various mass media, a social network that act as a social groove through which information ideas evaluation flow. Thus, a stronger connection in the urban area brings a much faster decline in fertility as well as CSR. Once fertility declines and socio-economic conditions change, the social influence shifts from encouraging fertility decline to the future return of present investment (Casterline, 2001). The invention of sex discrimination and its rapid spread from rural-to-urban strata technique brings a new regime in family planning where sex composition of living children matters. Thus, the overall decline in CSR is fast but not abrupt; rather patterned for diffusion mechanism.
Modelling Regional Variation of CSR
The maps show an obvious regional contrast, but it also indicates a strong level of geographical continuity. Thus, the geography of CSR variations remains as an issue of discussion through the superimposed socio-cultural frames that deserve attention. The analysis presented in this study is based on the CSR of 2011. The analysis has focussed on various factors that can be associated with contemporary sex discrimination and clarified their relative explanatory power. As the article intends to examine the specific role played by a region in determining sex ratio variation, an attempt has been taken to classify the whole region (India) according to its geographical location and incorporate most of the social and cultural correlates of sex ratio that are usually put forward. The variables that have been used here covered a wide range of social and economic dimensions. Quantification for certain social and cultural variables which could explain variations in sex ratio is a difficult task because of non-availability of such data in Indian census. The total number of districts with which the analysis has been carried out is 580. However, few districts have been left deliberately due to the lack of data.
Developmental Indicators
Male and female literacy rates and the percentage of the urban population have been taken as developmental indicators. Male literacy improves the participation rate of men in the labour market and increases the overall employment opportunities in a district. Whereas female literacy has a positive as well as a negative impact on child survival. A study conducted by Das Gupta (1987) among Punjabi women, showed the effect of literacy improvement in fertility changes and concluded that the desire for a small family is weighted in favour of boys. The result (Table 2) showed that male literacy has a positively significant (5%) association with CSR in the case of the north model. Female literacy is negatively and significantly (10%) associated in the west model. The west model represents the districts of Gujarat and Maharashtra, which are socially advanced and having high female literacy rate. Thus, the result has shown a negative implication of female literacy on CSR. The central model consists of districts in Madhya Pradesh and Chhattisgarh, mainly by socially economically tribal population, the result thus shows a positively significant (10%) implication of female literacy on CSR.
Urbanisation, as a sign of modernity, stands for the transition from the old to new. However, it works as a paradox of modernity favouring men not women. A recent study showed prenatal sex discrimination is much more prevalent in urban areas than in rural areas (Bhat & Zavier, 2007). Bose (2001) pointed out the recent steep decline in juvenile sex ratios is the result of greater availability of sex screening technologies, especially in an urban area. Prenatal sex discrimination became the modern approach to family planning in urban India. Although our model has shown a negative association between CSR and urbanisation, the result is not significant.
Social Indicators
For social indicators, the percentage of Scheduled Caste (SC) and Scheduled Tribe (ST) population for each district is taken into consideration. Traditionally, the sex ratio patterns among SC and STs have been presumed to be more balanced than among the overall population. The SC and ST population is usually poor, has marginal land assets and is a major supplier of casual and agricultural labour. Socially and culturally, these two groups are quite different from the overall population with women’s autonomy being much greater. Thus, the increase in the SC and ST population in the total population may have a link with a favourable CSR. The result has shown a significant positive association between the proportion of SC population in the east model, whereas the northeast model shows a negative association with CSR with SC population. For the ST, the north, east, south and west models showed a positively significant association with CSR.
Multiple Linear Regression of CSR of 580 Districts in India 2011

Male_lit, male literacy rate; Female_lit, female literacy rate; Urban, proportion urban population to total population; SC, the proportion of scheduled caste population to total population; ST, proportion of scheduled tribe population to total population; FWPR, percentage of female worker to the total female population; Al ratio, log male/female agricultural labour; Lowest_quin, per cent population in the lowest quintile of wealth index; TFR, total fertility rate; CPR, contraceptive prevalence rate; Marriage, proportion female married below 18 years.
Economic Indicators
The female work participation rate works as a proxy of autonomy as it increases the income level of household and the economic independence of women. Regional differences in sex ratio are sometimes determined by the worth of women in the agriculture labour force. Bardhan (1974) has observed that as rice producing, unlike the cultivation of wheat, demands more female labour in the field, the economic value of women is higher in those rice-growing areas. The pioneering work of Ester Boserup (1974) showed that the nature of women’s work in agriculture plays a major role in determining whether, at the time of marriage, women’s families receive a bride price or must give a dowry. Our result shows a very high coefficient of a positive association for the north, east and west models with the level of significance at 1 per cent that is similar to the works done previously. The lowest quintile has been taken as a proxy for income level; much research has shown that people from an economically better off class usually visit the clinic to know the sex of an unborn child (Kulkarni, 1986). Even in rural areas, the ability to pay for the services of the mobile doctors is the reason for widespread sex determination (Bose, 2001). The result has shown a positive significant association of the CSR and the proportion of population below lowest wealth quintile in the north (1% level), west (5% level), south (5% level) and central (10%) models, whereas a significant negative association is found for the east (10%) and the northeast (10%) models.
Demographic Indicators
For demographic indicators, we have taken the total fertility rate as a summary measure of fertility, the prevalence of any modern contraceptive methods and proportion of girls marrying before the legal age (18 years) at marriage. In the Indian context, the sex preference of children has a colossal positive effect in determining the use of contraceptive as well as fertility behaviour among couples (Das Gupta, 1987; Murthi, Guio & Dreze, 1995). The desire for sons appears to be a significant motivation for parity progression in a society with high fertility (Chaudhuri, 2012). The north model shows a significant positive association (10% level) of total fertility rate with CSR. The lower fertility rate in Punjab, Haryana, Himachal Pradesh and Uttarakhand with low CSR assumed to occur as a result of an ‘intensification effect’ 2 (Das Gupta & Bhat, 2010). The central and the northeast model showed significantly the negative association at 10 per cent and 5 per cent level. The result showed a positive association of modern contraceptive prevalence rate and CSR for the north and the south models at 1 per cent and 5 per cent level of significance, respectively. The low age of marriage is negatively related to women’s education level and autonomy and positively associated with high fertility. The result has shown the proportion of girls marrying below 18 years of age is negatively associated (1%) with the CSR in the west model.
Conclusion
A comprehensive analysis of India’s historic demographic data has revealed that a girl has a shorter lifespan as compared to a boy. This trend is not synonymous with the perception that little girls have an intrinsic biological advantage as compared to little boys that would point to a greater female population in an ideal world. The rationale behind such a sorry trend of a declining female population lies elsewhere and can be put down to social structures and kinship patterns guiding certain human activities thereby determining the prevailing system of gender relations. Thus, an identifiable territory (north/south) is not just a physical location but a sufficient condition for such a phenomenon to occur. This possibly explains why certain territories demonstrate region-specific CSR (e.g., a low CSR in Punjab) which may be termed ‘shocking’ but not surprising.
Against this backdrop, the crux of the study pivots on investigating the interactive mechanism between geography and gender. India is a country of striking sex imbalance. To trace the evolving nature of CSR, the study attempted to analyse its pattern of CSR through density mapping and further through the spatial statistical approach of the last 40 years. The density map highlights a geographical penetration of low CSR from a ‘core area’ to its neighbouring/periphery zone like a virus affecting people in the vicinity. For an easy identification of the cluster being affected by the shock wave of low CSR, they are named after the epicentre district where the CSR is found to be the lowest. Gwalior (1981), Gandhinagar (1991) and Kolhapur (2001) were identified as a potential epicentre of low CSR. In 2011, these two (Gandhinagar and Kolhapur) clusters blended into one and formed a giant cluster covering most districts of western India. Interestingly, in 2011, this contiguous belt comprises those districts that are neither economically homogeneous nor socially in a strict sense but obviously come under a broad categorisation of ‘northern culture’. Although low CSR is the typical character of an economically developed urbanised area (Agnihotri, 2003; Premi, 2001), the analysis gives a renewed interpretation of CSR where data speak more geographically.
The spatial analysis through hotspot depicts a gradual spreading of the cluster of low CSR as well as a simultaneous contraction of high CSR. There are essentially two mechanisms that have been perceived as working simultaneously. One hypothesis for intensification of low CSR around an epicentre can be attributed to regional pull where the mother district or the epicentre, which is characterised by a historically and socially lower value of CSR, influenced its surrounding region by emitting shock wave of low CSR. Hence, this influence is in a local level within a certain limit of geographical extension. The notion that all things are related to each other but near things are more than far (Tobler, 1965) lends a solid base to this study and affirmed our understanding that a real expansion of CSR through the process of intensification has its geographical path.
The other one is the diffusion mechanism through a global channel of social interaction that has brought the transition of sex ratio along with the transition in fertility. The additional dimension of the study has been explored through the empirical analysis. There is a remarkable regional contrast within India which can be attributed to socio-economic and demographic factors. The result shows every variable does not have influence in every region. Moreover, some variables have a significant positive influence on some regions statistically, whereas they have a negative significance for other regions. The vastness of the country with diversified cultural confluence and asymmetric developmental stages poses a difficulty in drawing a concrete conclusion.