
Abstract
India remains home to 300 million people who live in extreme poverty and face multiple deprivations. Their homes lack basic services ranging from water, sanitation, electricity, health to education (Millennium Development Report, 2014). By mining the data available in the latest 2011 Census, this article attempts to provide a scheme of regionalisation on the basis of multi-dimensional deprivation of households across districts through an assessment of household dwelling characteristics, available basic amenities and assets possession. The study reveals that districts in the Empowered Action Group (EAG) states perform the worst, while states located in the western and southern part of India and their districts are comparatively better off. The analysis concludes that households deprived of good housing conditions and basic amenities, facilities essential for healthy and productive manpower, tend to be asset poor.
Introduction
Multi-dimensional deprivation is an approach which studies the socio-economic status or the standard of living of households. It is a well-established method used to understand the basic services or amenities which are essential for sustainable development. Deprivation is a relatively disadvantageous factor that prevents a part of society from participating in the development process. In other words, it is this outcome of the process that constrains certain sections of population to meet even the minimum requirements for their social development (Singhal & Gill, 1991). Townsend (1987) defines deprivation as a form of disadvantage whether it is at the local, district, state or national level to which an individual, family or group belongs. Thus it refers to the condition experienced by a particular section of people. In a society, several forms of deprivation are usually observed.
In the present study, the multi-dimensional deprivation all across the districts of India have been taken into consideration. Multi-dimensional deprivation refers to durable goods or assets, lack of basic services or amenities and household dwelling characteristics. Existing literature indicates that one’s socio-economic status and poverty are more or less related to deprivation (Last, 1995; Townsend, 1987). The study of Townsend (1979) and Sen (1979) shares the common idea that income not only catches aspects of wellbeing but also expands capabilities. It also narrows down the nature and scope of deprivation of individuals or households. While poverty alleviation remains a goal for all social policies, defining and measuring poverty always remains contested among academicians. The information of material deprivation thus is used as a measure of the standard of the living conditions of individuals or their households (Bérenger, Deutsch, & Silber, 2013).
There are several types of deprivation, that is, inter-generational, life course and long-term/long-time. In the present context, the variables selected show a long-time deprivation of a group of people in India. The policies introduced so far have failed to bring down the number of deprived people in India substantially despite removal of poverty policies, or slogans like Garibi Hatao and the Minimum Needs Programme (MNP) introduced in the Fifth Five-Year Plan of 1974–1979. The quality of life of any households in a region (state) is largely determined by the availability of safe drinking water, sanitation, drainage facility for waste water, the type of fuel used for cooking purposes and the availability of a separate kitchen, and the congestion of the household (Das & Mistri, 2013). Unfortunately a large section of India’s population is still deprived of these facilities. Due to this cumulative effect, poverty still prevails in many households.
The study suggests that children born into deprivation face early developmental disadvantages, and later in school, educational disadvantages which collectively add to their employment and economic disadvantages (Williams, 1970 as cited in Herbert, 1975; Dugoua & Urpelainen, 2014; Nussbaumer, 2012). Although flagship programmes are being launched by different ministries under each successive Five-Year Plan to ensure a basic minimum standard of life for every citizen, especially those who are living in rural areas India (Das & Mistri, 2013), the socio-economic disparity between regions and the haves and have-nots continues to increase adding to a cumulative national effect.
Rationalising the Study
Even though there are targetted interventions to eradicate poverty, certain parts of India remain chronically deprived. The 2011 Census reports more than 50 per cent households (HHs) in India practice open defecation, 71 per cent use unclean fuel (other than LPG/PNG) for cooking purposes, 32 per cent do not have separate kitchens within dwelling rooms, around 5 per cent live in dilapidated houses and 18 per cent fetch water from sources located away from their household premises. This lack of facilities results in poor health outcome in terms of a higher level of infant and child mortality, a higher level of morbidity is also closely related to defecation practices, poor housing conditions, and accessing drinking water from unclean sources. The lack of available basic amenities within households reflects the exclusion of a large section from these social infrastructures.
Though it is commonly said, ‘There are many Indias inside India’, even within this adage there are many levels of regional variations in deprivation. The Census 2011 has provided us the opportunity for meaningful data mining up to the district level in this regard. A district-wise analysis of data raises a number of questions on the success of several flagship programmes as well as policy decisions taken by the government which would help us in providing future guidelines.
Objectives
The present study is an attempt to
Study present household living characteristics, available basic amenities and the accumulation of assets within households in districts of India. Identify regions with different levels of multi-dimensional deprivations.
Data Sources, Research Techniques and Framework
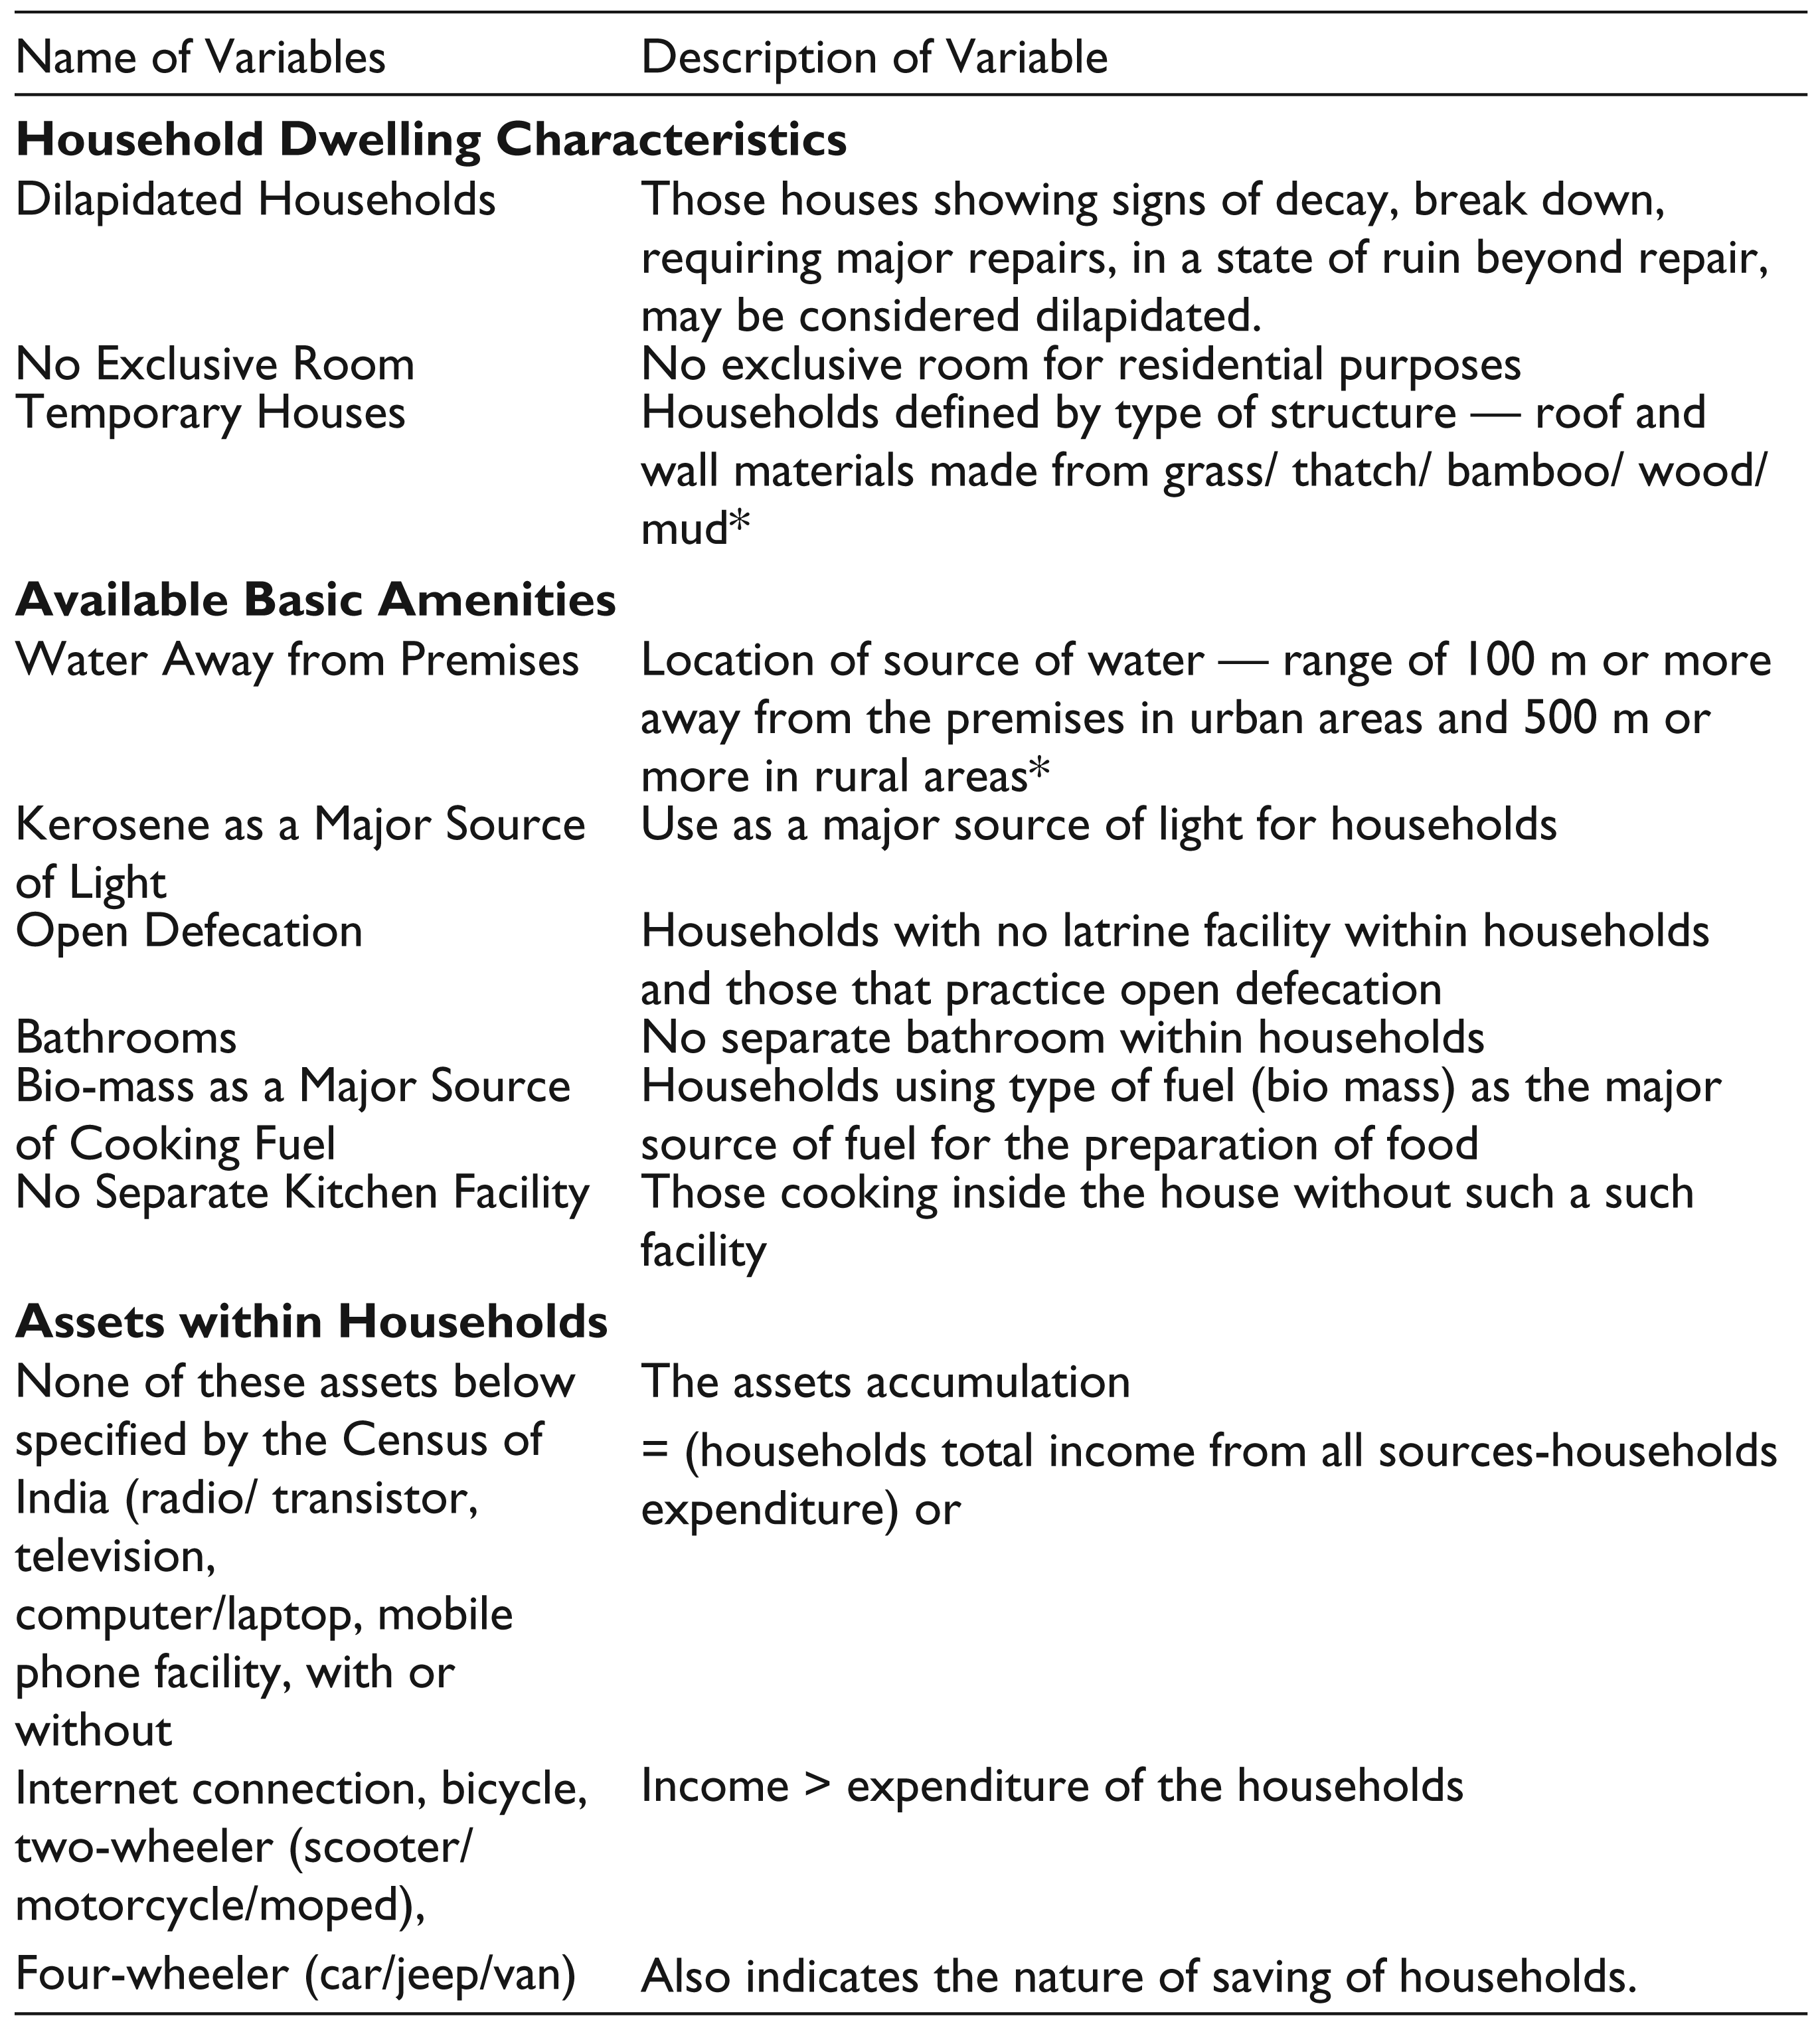
This article draws major data from the Census of India (Houselisting and Housing Data in ORGI––Office of the Registar-General, India––2011). Apart from this, data and information from the Ministry of Rural Development, the Planning Commission of India, Nirmal Bharat Abhiyan, the Ministry of Drinking Water and Sanitation (2012) has also been also used. The policies and programmes launched so far to provide a minimum level of basic amenities to households have also been brought into the discussion. Regional variations of selected study variables have been figured out. Apart from this, a composite index has been constructed with the help of a Principal Component to assess regions with multi-dimensional deprivation. All variables used are in a percentage form. The multi-dimensional deprivation of household comprises two or three distinctive indices—Housing Conditions Index, Households Basic Amenity Index and No Assets. A total of ten variables have been selected to identify the level of deprivation that households are living with. The districts with a higher value reveal worse conditions while those with lower values depicts better conditions. The following variables shown have been collected from the 2011 Census to understand multi-dimensional deprivations ( Table 1 ).
Variables Used in the Study (percentage)
Regional Dimensions in Dwelling Characteristics
The data collected by the 2011 Census, as part of its Houselisting and Housing Data, can be used as an indicator to address statistically how many people from various regions have been excluded from an adequate standard/quality of living. The regional pattern of a households’ dwelling characteristics has been captured by seeing the condition of residential houses, types of house structures and the number of rooms a household possesses. At the national level, the total number of dilapidated houses increased from 10 million to 13 million during the last decade (2001–2011). A total of 5.2 per cent of households are houses which are either showing signs of decay or are in danger breaking down. At the regional level, it is the eastern and central region of West Bengal, Odisha, Bihar, Jharkhand and Chhattisgarh where a high percentage of dilapidated houses are used for residential purposes, whereas the least percentage is reported from southern and western states. West Bengal reports the highest percentage of dilapidated houses (11.8 per cent), whereas the lowest are in Goa (1.5 per cent).
At the district level, Barpeta (Assam) reports the highest percentage of dilapidated houses, whereas the lowest percentage are in Upper Siang. Table 2 reveals that of the total number of households in studied districts, 39 per cent above the national average reside in dilapidated houses. A majority of districts of Uttar Pradesh, Bihar and all districts of West Bengal report dilapidated houses well above the national average ( Figure 1 ).
Dwelling Characteristics of Households in India
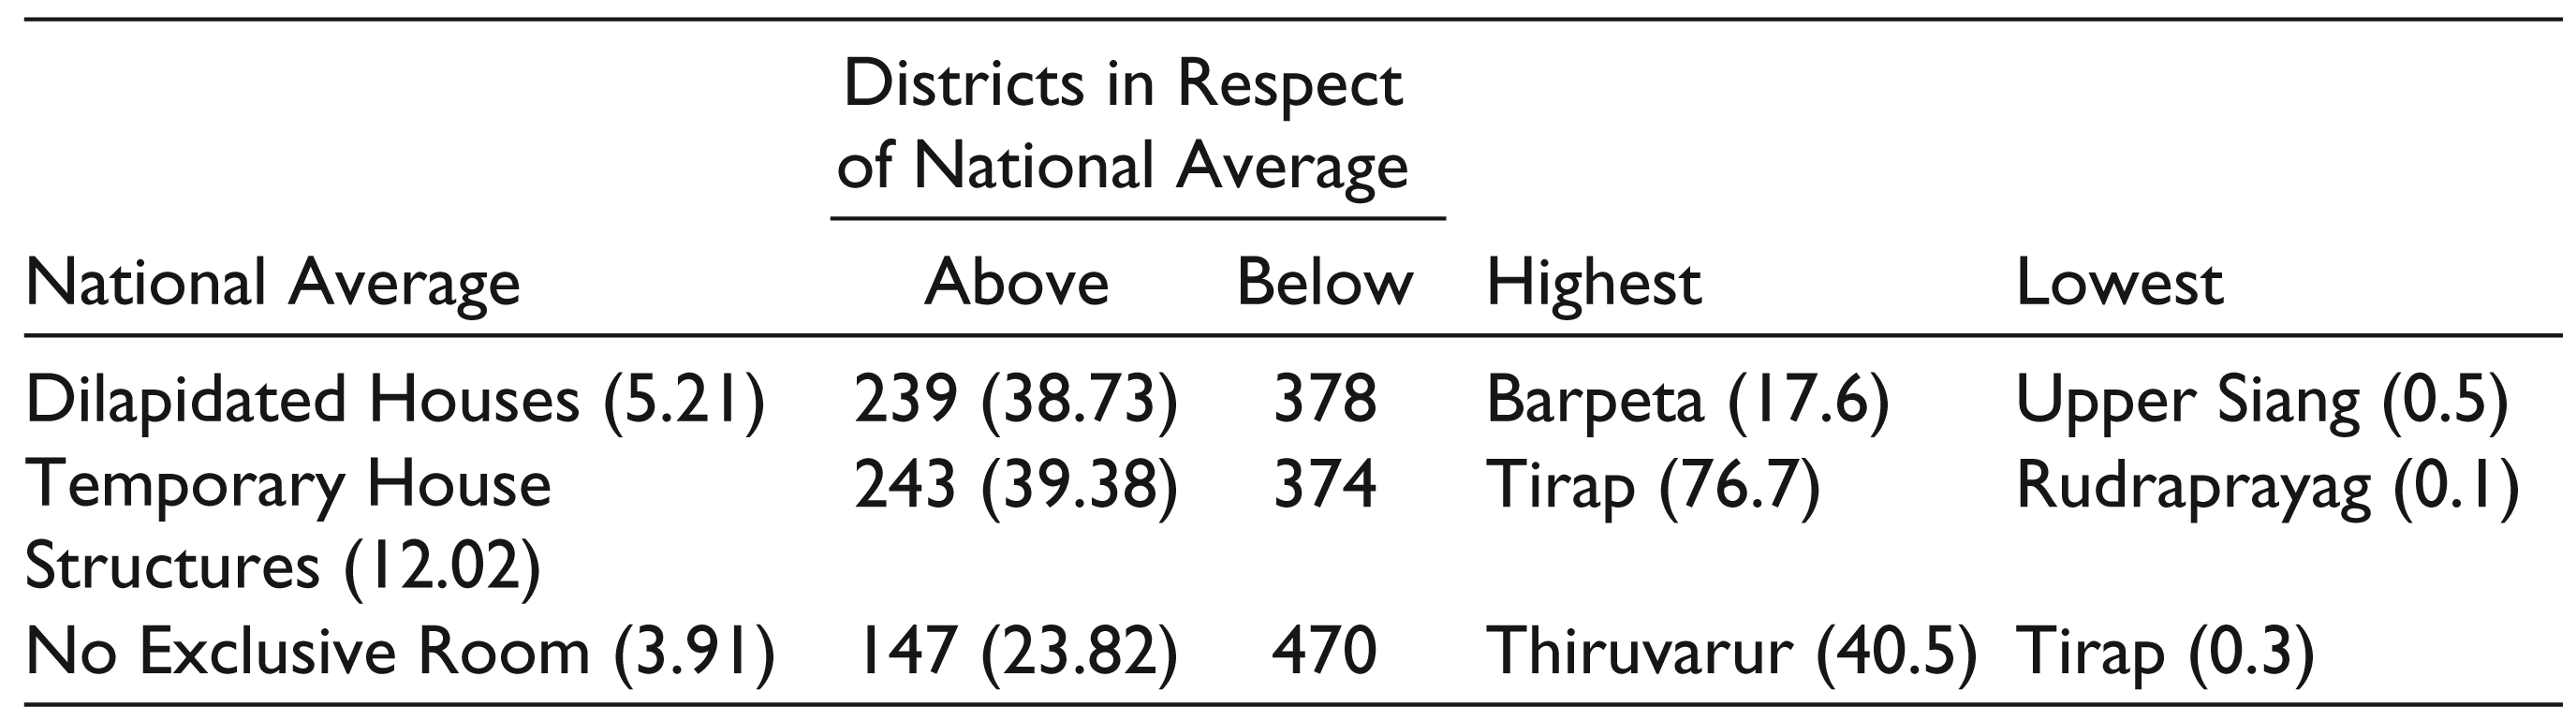
Temporary house structures for residential purposes are used by 12 per cent in India. Most states that have a common international border have a higher percentage of temporary house structures. For instance, the state of Arunachal Pradesh (46.5 per cent) reports the highest percentage of houses with temporary structures. Tirap district in Arunachal Pradesh also has a high percentage while Rudraprayag in Uttarakhand has the least percentage of houses with temporary structures. It can be inferred from Figure 1 that all the districts of Arunachal Pradesh and a majority of districts of Bihar and Odisha have a higher percentage of households with temporary structures. In Ladakh district in Jammu & Kashmir, 67 per cent houses consist of temporary structures. Districts located in the western part of Rajasthan which have a common border with Pakistan also have a high percentage of temporary houses. Similar to the occupancy of dilapidated houses, here, too, 39 per cent of districts have higher than the national average of households living in temporary structures. Superimposed figuring is done with these two housing characteristics to identify spatial association to distinguish regions with double deprivation. Interestingly, it is not the same districts with a high proportion of households with temporary structures which are living in dilapidated houses. So not only in the periphery but it is the core districts that have the double disadvantage of dilapidated and temporary structures for residences ( Figure 1 ). The districts of Bihar, West Bengal, Odisha and Uttar Pradesh share the largest burden of double deprivation in housing. Bordering districts are less burdened with this double deprivation. Geographical conditions cannot be ignored here: some bordering districts lack permanent habitats because of extreme climatic conditions, for example, in Leh and Jaisalmer. Here new temporary seasonal structures are constructed every year to offset weather conditions.

Third, another housing deprivation indicator is households with ‘no exclusive room’ for residence purposes. Thiruvarur district of Tamil Nadu reports the highest percentage of households with no exclusive room for residence purpose whereas Tirap district has the least percentage ( Table 2 ). The districts of western and southern India, situated in the industrial corridor, have a high percentage of households without an exclusive room for residence purposes. Similarly a majority of districts of Tamil Nadu, Karnataka and Maharashtra report a shortage of houses in the same category. Overall in India, 3.9 per cent households do not have rooms meant exclusively for residence purposes.
Regional Dimensions of Available Basic Amenities
Avaiable basic amenities within households is also another proxy indicator to study multi-dimensional deprivations and social inclusion or exclusion of a population. In many villages of India, the practice of untouchability still forces people belonging to a particular caste to fetch water from long distances. The provision and availability of safe drinking water and sanitation have a multifaceted influence on the quality of a good and healthy life. It reduces morbidity, water-borne diseases and deaths, cuts down health expenditures, saves money and improves human productivity. Similarily, the distance that one has to cover to fetch water also has a multi-dimensional influence on women and girls. In rural areas, it is the women or girls who are responsible for collecting water from different sources for household use. Thus, the provision of drinking water within one’s premises also reduces the drudgery of women and girls who spend long hours and energy in fetching water. Accessing available water was one of the components of thr Minimum Needs Programme launched in 1974–1979 for all sections of people in the country. Similarly, programmes like the Accelerated Rural Water Supply Programme in 1972–1973, and the Rajiv Gandhi National Drinking Water Mission in 1991–1992 are some of the initiatives taken by the Government of India. In 1999, the Ministry of Rural Development created the Department of Drinking Water Supply to supply water in rural areas.
The census of India defines the location of water being away from household premises if it is located 100 m from a household in urban areas and 500 m from a household in rural areas. A total of 18 per cent of households in India get their drinking water within a range of 100 m in urban areas and 500 m in rural areas. So, a substantial proportion of households travel a long way to fetch water: in fact, the percentage of households in this category has registered a nearly 1 percentage point increase in the last intercensal period (2001–2011). In the states of Manipur, Odisha, Meghalaya, Tripura, Jharkhand and Madhya Pradesh nearly 33 per cent of households and 25 per cent households of Nagaland, West Bengal, Chhattisgarh and Rajasthan fetch water away from the premises of households (Das & Mistri, 2013). However, a district-level analysis of households fetching water away from household premises indicates that districts located in and around the Indo-Gangetic plain region are characterised by a natural abundance of water while the hilly and plateau regions show a deficit in this resource. From Figure 2A, it can be inferred that inhabitants of most districts located in the peninsular plateau region fetch water from sources located away from their household premises. A majority of households in the entire stretch of the central plateau region of the country, starting from Rajasthan to the Northeast, still travel a fair amount to collect drinking water. A total of 55 per cent of India’s districts (337) report a high percentage of households––above the national average––which collect water from sources located away from the premises of households ( Table 2 ).
The Government of India launched the Central Rural Sanitation Programme (CRSP) in 1986 to accelerate sanitation coverage in rural areas to improve the health and quality of life of rural people and particularly to provide privacy and dignity to women. The Total Sanitation Campaign (TSC), another form of CRSP, was launched in 1999 with a community-led and a people-centred approach. Thus the TSC moved away from the principle of state-wise allocation, primarily based on a poverty criterion to a ‘demand-driven’ approach (Ministry of Rural Development, Annual Report 2007–2008). The TSC programme sought to attain one of the Millennium Development Goals of Sanitation for All by 2012 but failed. The data on housing, household amenities and assets shed new light on the complex transition of rapidly modernising India, where millions of households have access to technologies and consumer durable goods but no toilet facility available within households. Though half of India’s population does not have toilets within the premise of its households, well over half does own a mobile phone. Cultural mores, traditional reasons, lack of awareness and low level of education seem to be the primary reasons for this unhygienic practice. According to the World Health Organization open defecation is the ‘riskiest sanitation practice of all’. Almost 10 per cent of all communicable diseases are linked to unsafe water and poor sanitation. The release of such pitiable information at the national level has forced the government to initiate campaigns to get rid of open defecation. The Cabinet Committee on Economic Affairs increased the amount of money to be spent on household toilets in rural areas from ₹4,600 to ₹10,000. But increased spending alone will not be the magic wand that will wish away the problem of open defecation.
The Swachh Bharat Abhiyan, an initial vision of Mahatma Gandhi to clean India, has become a flagship programme of the new government and is a concrete step to meet the challenge of sanitation. The last census reported that nearly half of India’s households (49.8 per cent) practice open defecation while 53 per cent have no latrine facilities at within their premises. At the state level, Kerala shows the best figures as it records only 2 per cent of its households without latrine facilities within premises while both Jharkhand and Odisha are the worst performing with 78 per cent households without these basic facilities. Out of the eight Empowered Action Group (EAG) states, six, Bihar, Jharkhand, Odisha, Chhattisgarh, Madhya Pradesh, Rajisthan and Uttar Pradesh, report that a high percentage of households do not have latrine facilities within their premises and thus practice open defecation ( Figure 2B ). However, at the district level it is Bijapur district in Karnataka that has the highest percentage (94.4 per cent) of household without any latrine facility within the premises, followed by Dindori (94 per cent) in Madhya Pradesh.
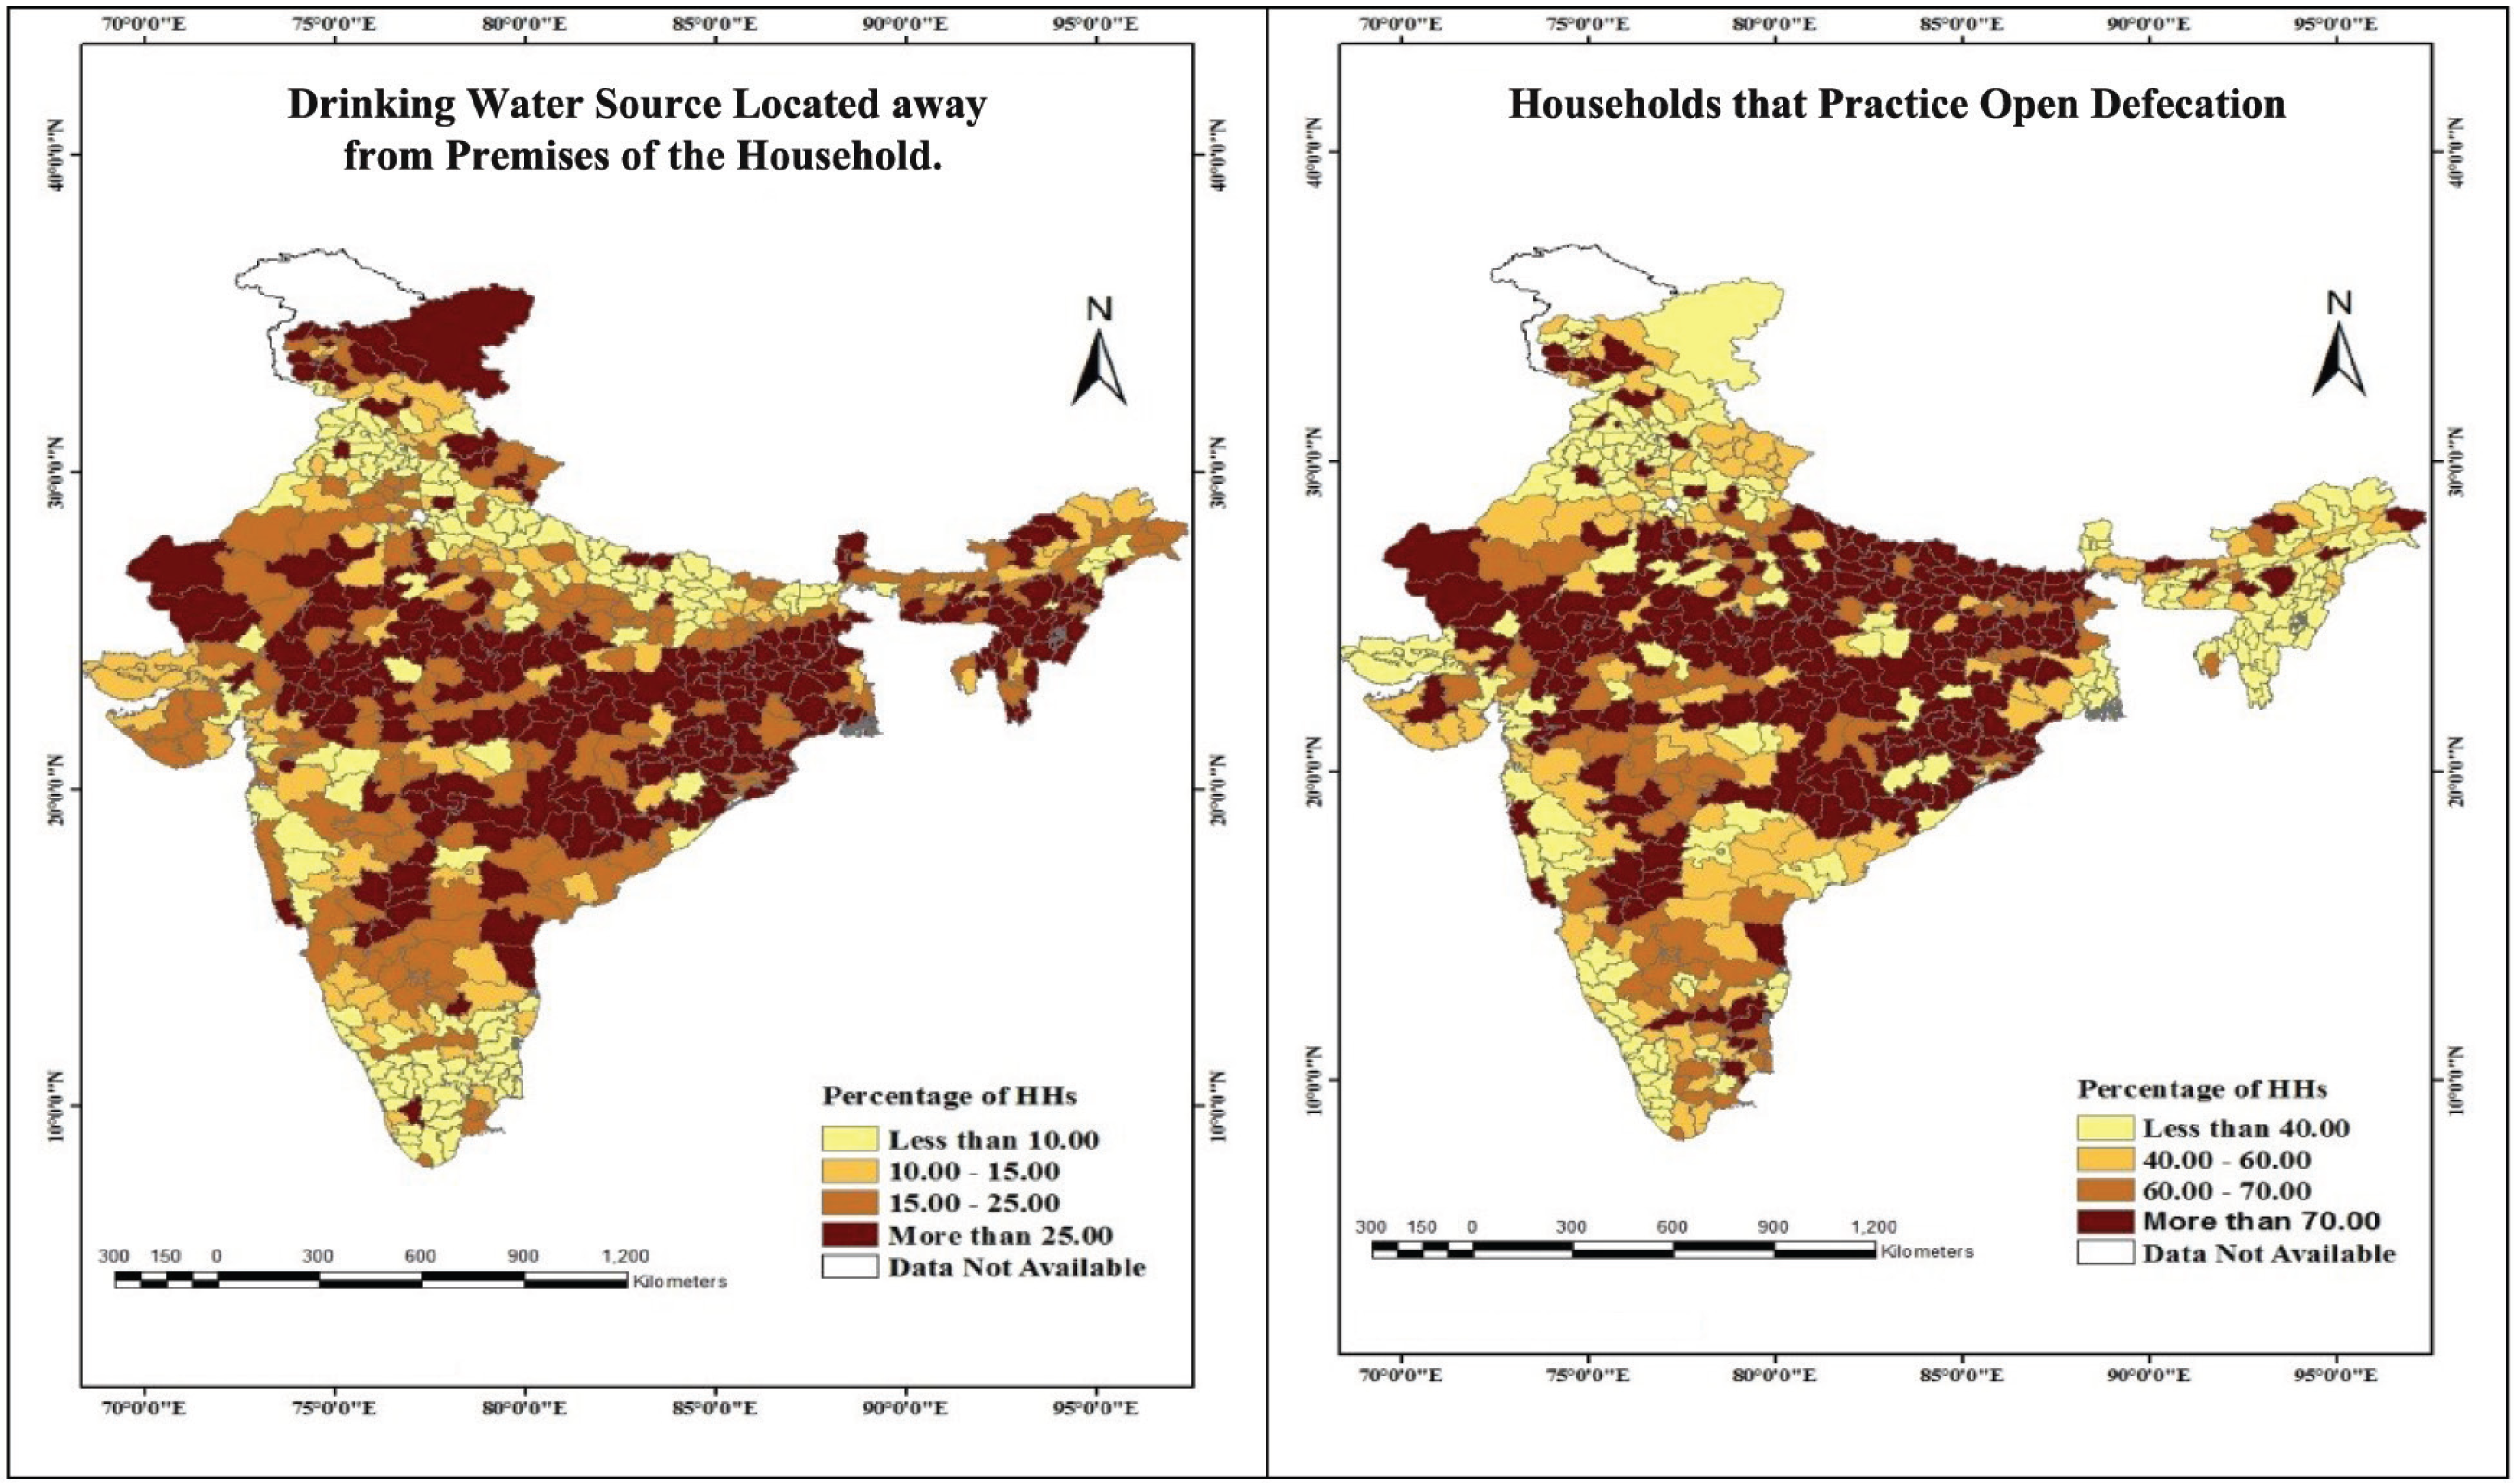
Nearly 60 per cent of the studied districts have a proportion of households above the national average (49.8 per cent) which are practicing open defecation ( Table 3 ). Mostly, but not always, the districts identified with a higher percentage of household without any latrine facility within households also report a higher rate of open defecation. Earlier, a macro-study of Das and Mistri (2013), based on the 2011 Census, indicated that states in central India were practicing more open defecation than the rest of India. A district-level analysis shows that in Bijapur district of Karnataka 94.4 per cent of households practice open defecation. In Karnataka, there are six districts which have more than 80 per cent households that practice open defecation. It revealed the extreme impoverished conditions existing in the state.
Availability of Basic Amenities to Households in India
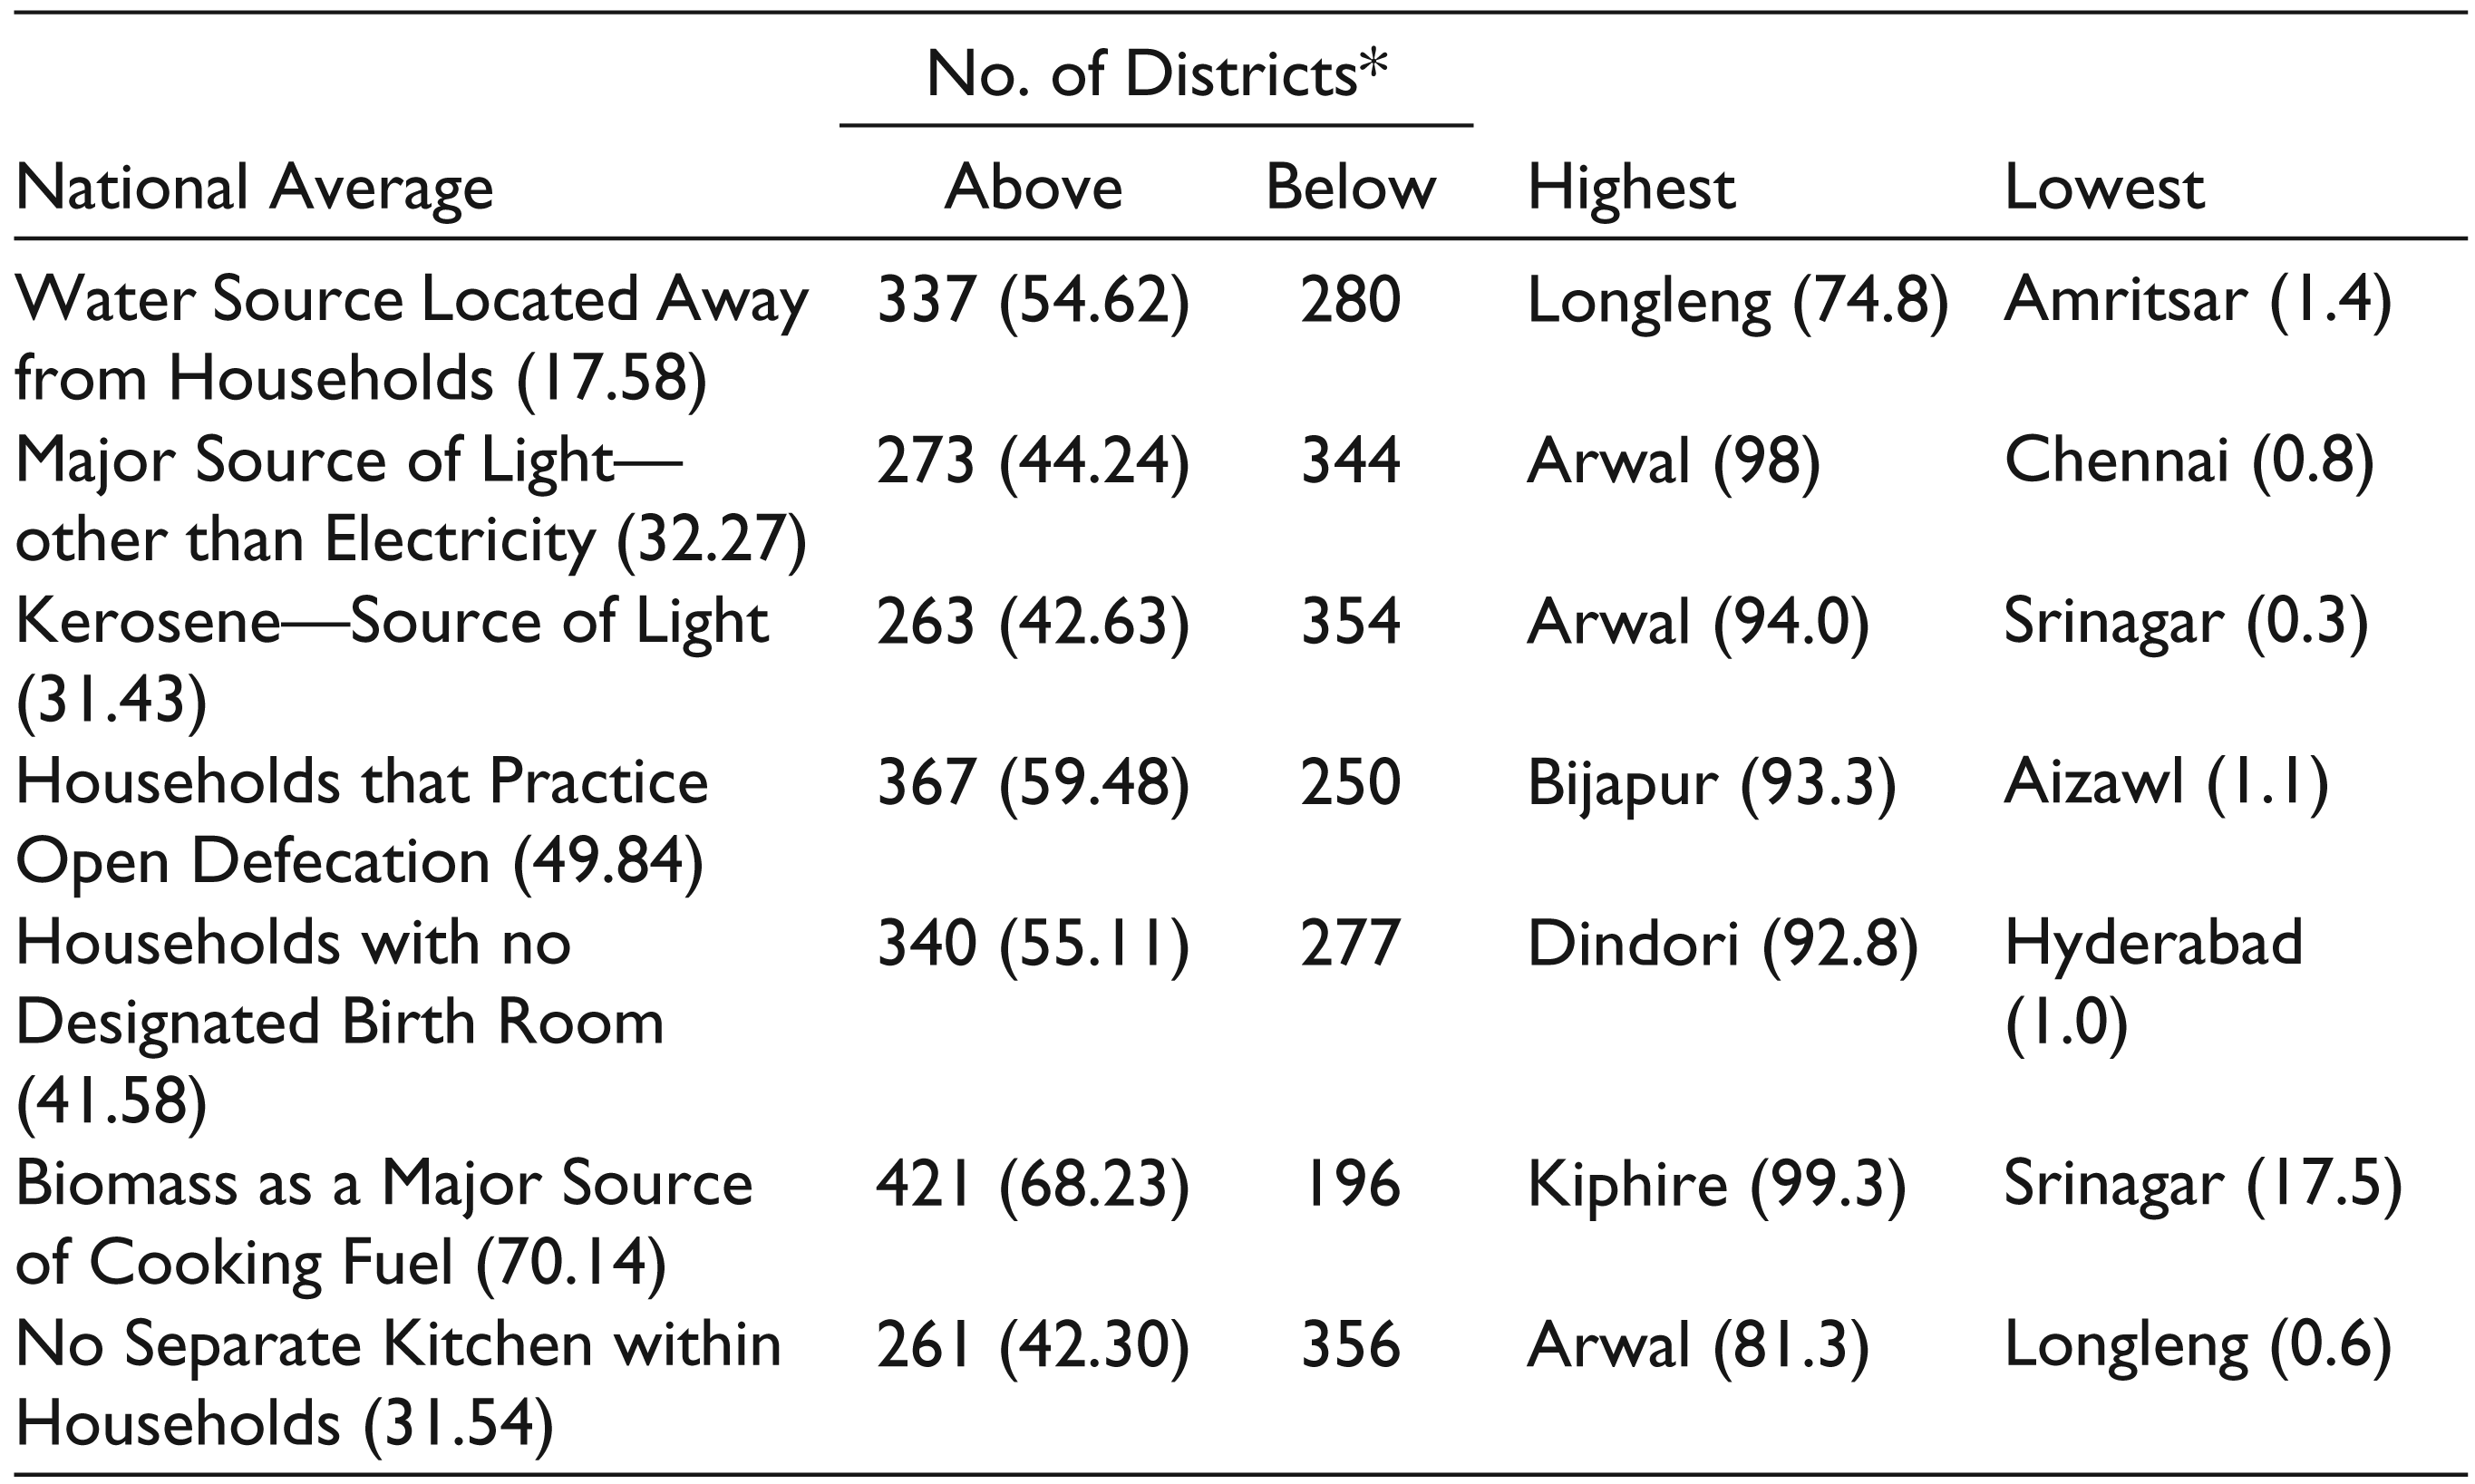
A household’s access to efficient energy has a multiplier effect on the quality of their lives. The services that most people in industrialised countries take for granted—adequate lighting, low-polluting heating, cooking energy, telecommunications and entertainment, motor power—are completely out of reach to large parts of the world’s population. A lack of access to affordable and reliable energy services represents a key obstacle to human, social and economic development (Nussbaumer, 2012). Uneven access to infrastructure raises the politically and socially central question of how people who are left behind view their relative deprivation. It may create social tensions from that (Dugoua & Urpelainen, 2014). In India, the scenario of ‘household energy use’ (both for light and cooking purposes) shows a wide range of regional variation. Nearly three-fourth (71.5 per cent) of households in India continue to use firewood, crop residue, cow dung cakes or coal for cooking which is a major source of traditional fuel in rural India. It puts women at risk to significant health hazards and hardship because in a society like India it is women who are mainly engaged in preparing food for household members. The dangers get aggravated for the urban poor as they cook inside living areas without any proper ventilation. However, the corresponding figure for households using LPG/PNG for cooking has increased from 17.5 per cent to 28.6 per cent between 2001 and 2011. India has a humongous task to provide safer cooking fuel. The highest percentage of households using non-LPG/PNG for cooking purposes are in Kiphire district (99.3 per cent), followed by West Khasi Hills (99.3 per cent) and Latehar (98.4 per cent). In 68 per cent districts of India, more households than the national average use non-LPG/PNG for cooking purposes ( Table 3 ). The tribal-dominated state of Madhya Pradesh has the highest number of districts using non-LPG/PNG for cooking purposes (basically firewood and crop residue), followed by Uttar Pradesh and Bihar which both traditionally use cow dung cakes and crop residue as the main source of fuel in rural areas. The regional picture shows that the northern part of India, stretching from west to east, is deprived of clean energy whereas the country’s western states along with southern states are better off ( Figure 3A ).

‘The United Nations’ goal for fighting extreme poverty will fall short unless nations work to bring electricity and modern, safe cooking technology to billions of “energy-poor” people around the globe’ (Lavelle, 2010). Similarly, those cooking inside their houses with no separate kitchen facility and use of unclean fuel are more exposed to different kinds of respiratory diseases. Women are the worst affected as the preparation of food for household’s consumption is mostly done by women. They use biomass fuels/chulhas (stoves), cooking in a multipurpose room, and spending long hours in the kitchen exposes women to smoke, heat, pollutants (Singh & Jamal, 2012).
It is clear from the recent 2011 Census that in India, 32 per cent households still do not have separate kitchens and cook inside their living areas. At the state level, Kerala has (95 per cent) the highest percentage of households with kitchens inside, whereas Bihar has the lowest. The percentage of households which do not have separate kitchens and use traditional type of fuels (firewood, crop residue, cow dung, kerosene and coal charcoal) is much higher in central India, eastern India and the Northeast. The prevalence of TB state-wise indicates a geographical clustering of the disease in eastern India and central India (National Family Health Survey-III, 2005–06). Figure 3B reveals that a majority of the districts in Madhya Pradesh report a higher percentage of households without separate kitchens inside, followed by Uttar Pradesh, Bihar and Jharkhand. Of the total study districts, 58 per cent have less than the national average number of households with a separate kitchen. The district Arwal in Bihar reports a higher percentage of households without separate kitchens for cooking purposes followed by Garhwa in Jharkhand.
The share of electricity to total primary energy consumption in India has risen from 59.7 per cent in 1980–1981 to 72.6 per cent in 2006–2007 (Das & Mistri, 2013). Still 32.3 per cent of households use other sources of electricity as the major source of lights within households. The highest percentage of households are in the Arwal district (98 per cent), Bihar. Chennai district (0.8 per cent) in Tamil Nadu is nearly universal in providing electricity to its households ( Table 3 ). The overall district-level regional picture at the national level indicates that 44 per cent of total districts report a higher proportion of households than the national average without having any available electricity. Thus, these districts still depend on either kerosene or other oils or solar energy as the major source of light.
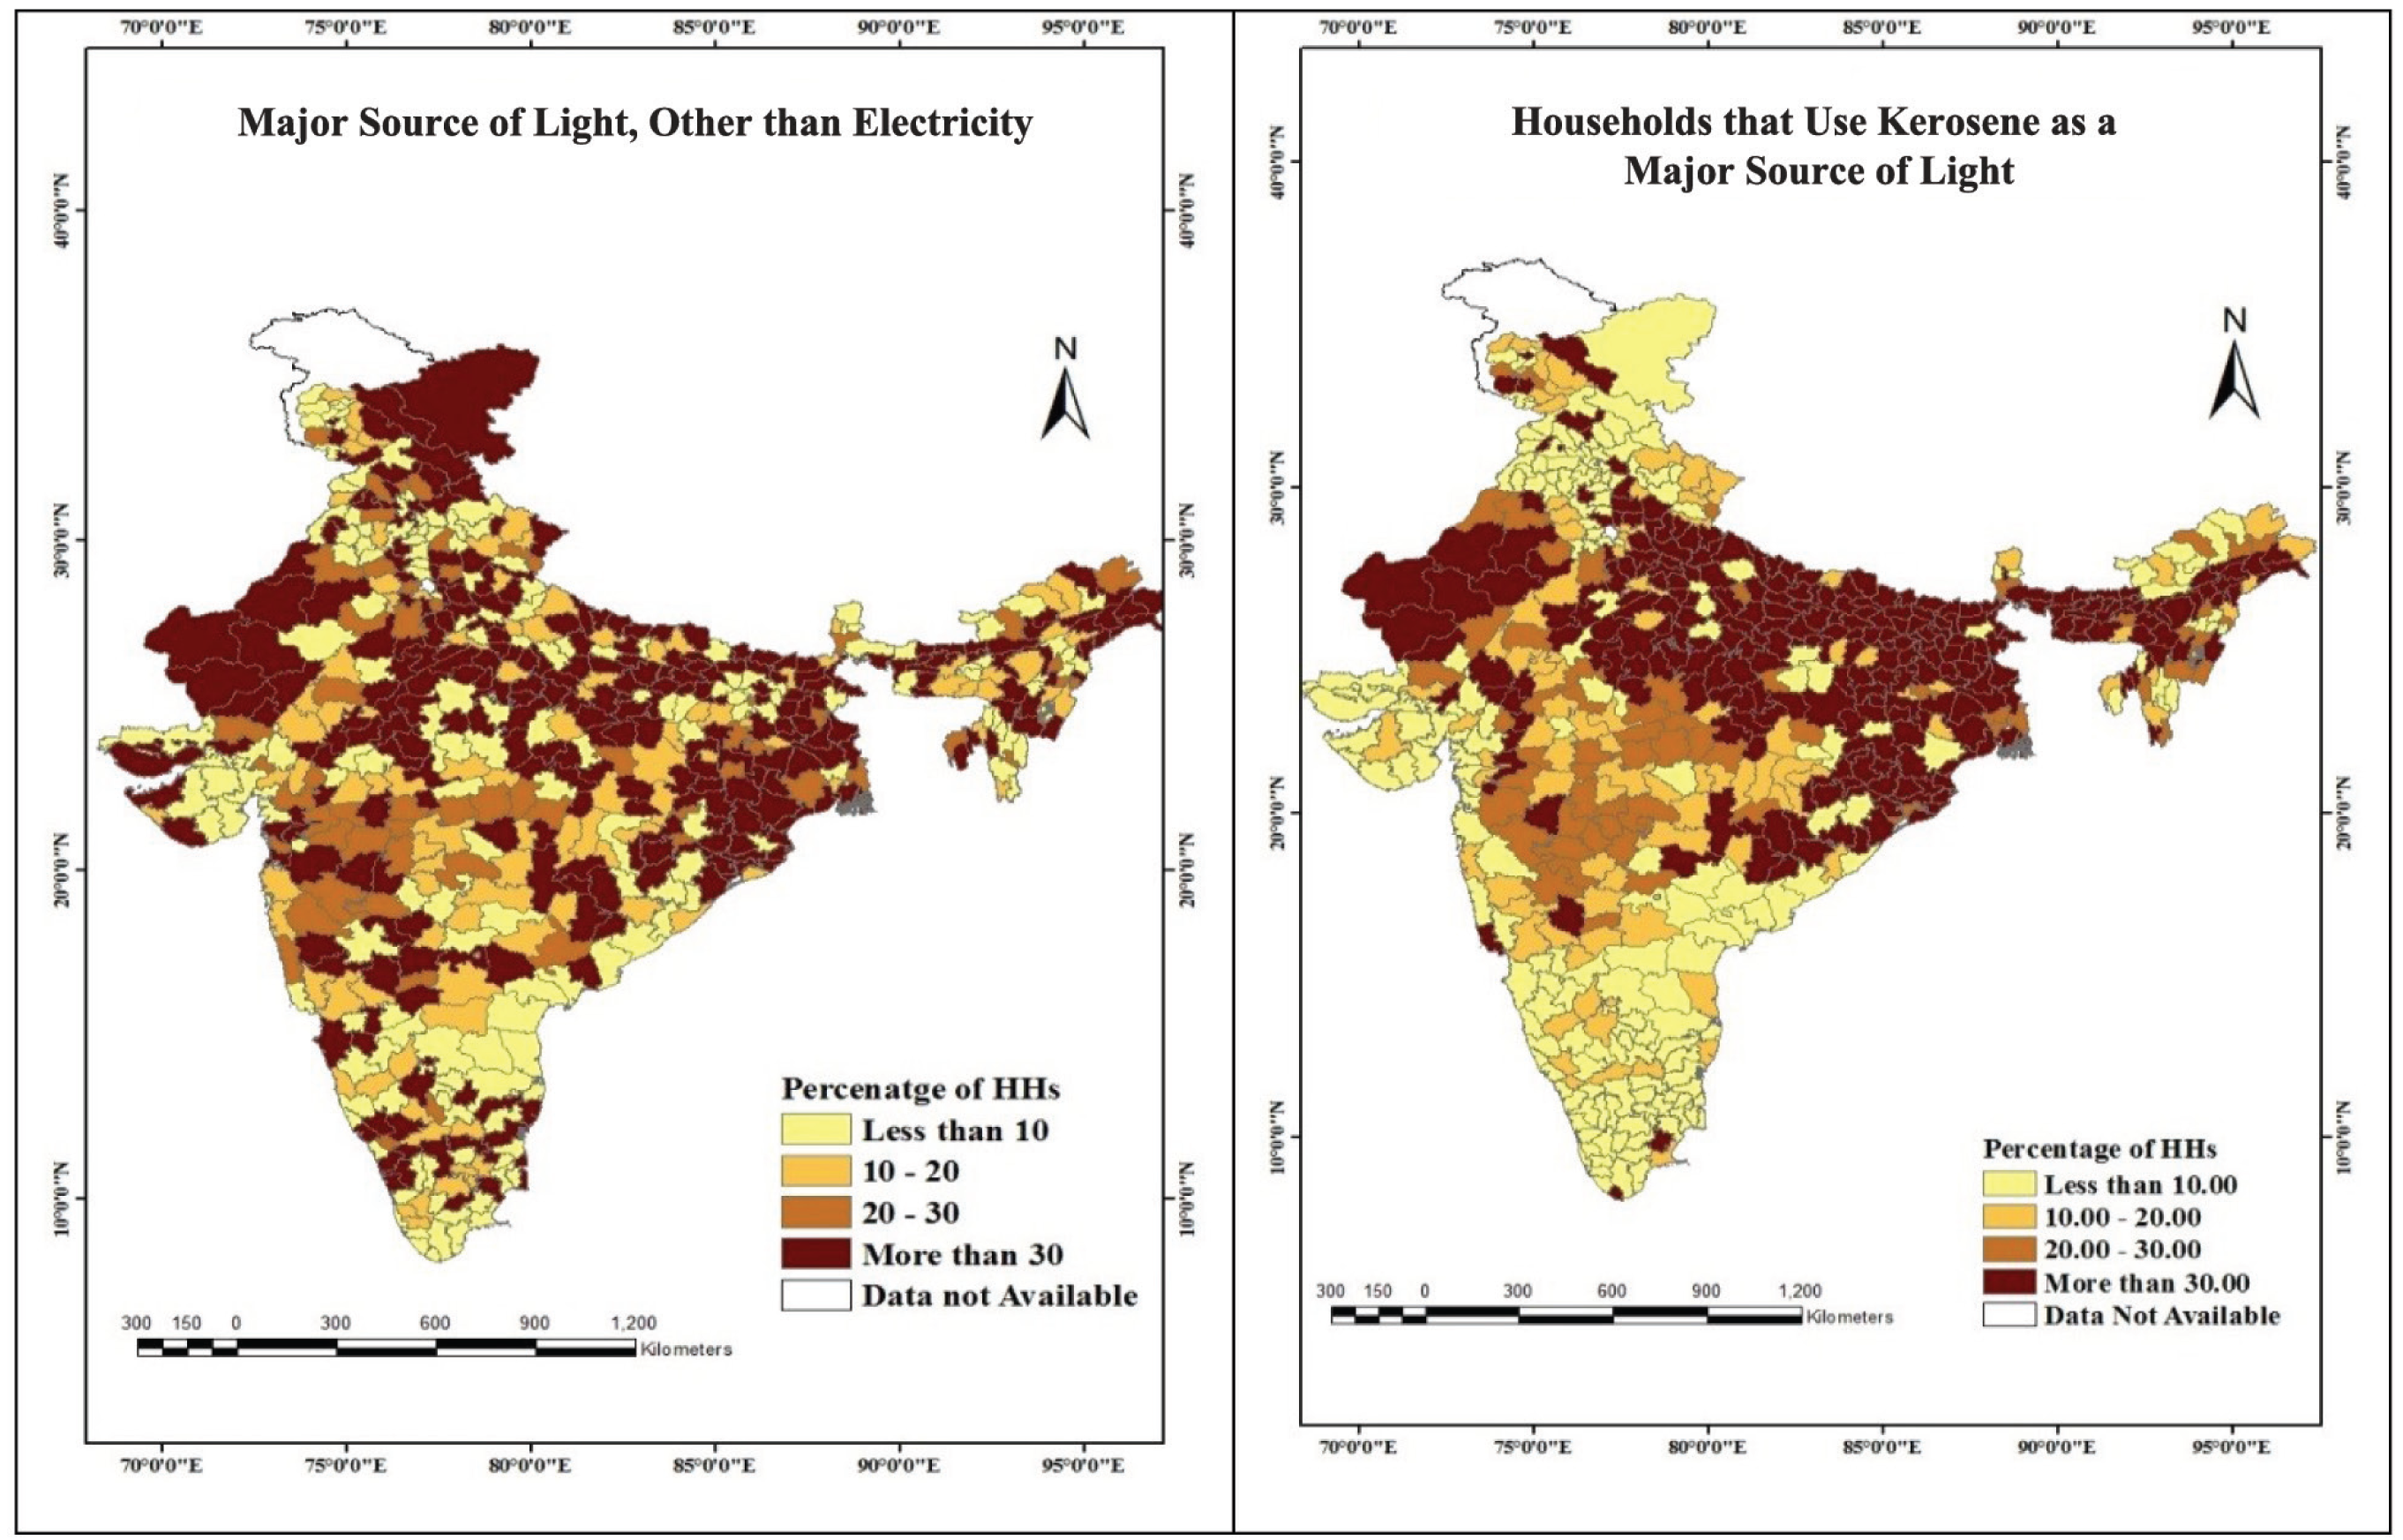
At the regional level, the maximum number of homes in the districts of central and eastern India report that a major source of light is that other than electricity. In most cases, such households largely depend on kerosene oil provided nationally by the Public Distribution System at a subsidised rates. The story of the western districts of Gujarat, a few districts of Jammu and Kashmir, Tamil Nadu and Rajasthan, is different. In these districts, a major source of light is non-conventional energy, either solar, wind or tides. Similarly, the coastal districts of West Bengal and Odisha also have a higher percentage of households using energy, other than electricity, as the major source of light within households (Figure 5A). Of all sources, other than electricity, kerosene is the dominant one across these districts of India.
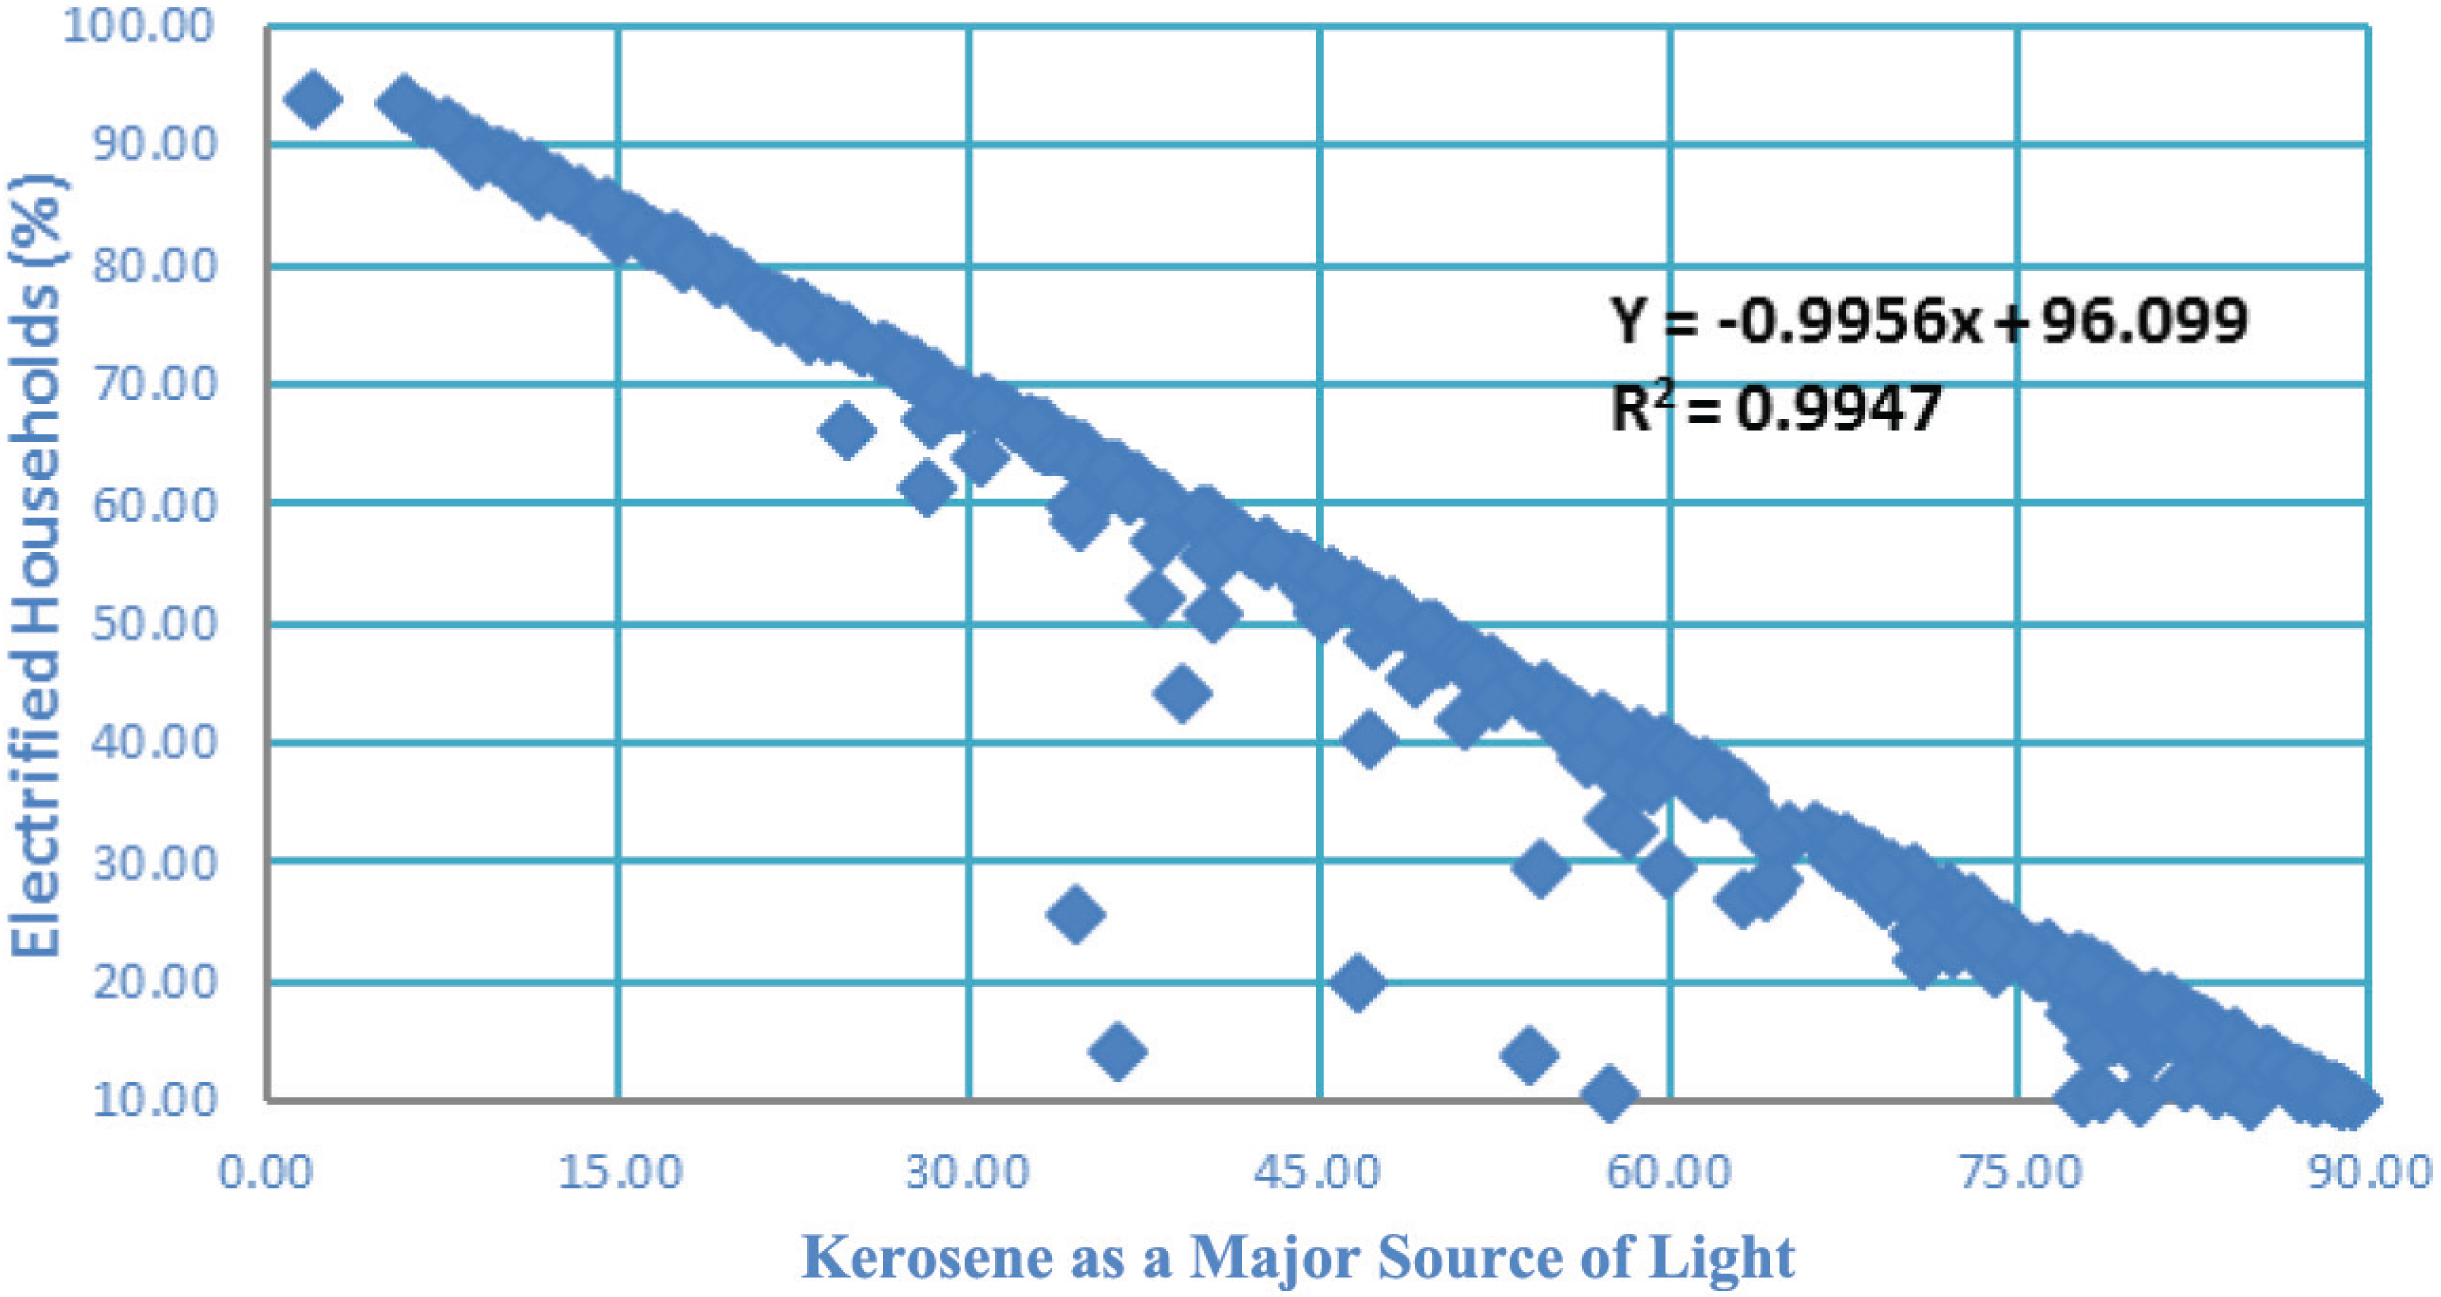
A scatter diagram ( Figure 4 ) shows the energy consumption scenario at the district level, households using electricity and kerosene as a major source of lighting. It reveals a clearcut dependence on kerosene in electricity deficit areas ( Figure 4 ) except for a few outlaying districts. Households which do not have electricity supply immediately depend on kerosene as an alternate source of light. It was reported in 2011 Census that nearly 43 per cent districts crossed the bench mark of the national average in terms of using kerosene as the major source of light. A majority of the districts of Bihar and eastern Uttar Pradesh report that more than 80 per cent households use kerosene as a major source of light. It can be inferred from Figure 5B that the EAG states, one of the regions with high natural resources, is actually an energy poor region, that is, with a low percentage of electrified households. It is observed that people deprived of a certain level of energy services spend more money, relative to their income, on energy than those who have better access (Groh, 2014). Thus the withdrawal of subsidies from kerosene reimposes deprivation especially when it is the only alternative available for a majority in India.
The northern states (Punjab, Haryana, Himachal Pradesh and Uttarakhand), along with southern and western states have a lower percentage of households using kerosene as a major source of light. Most of these states are well developed either industrially or agriculturally. In this context, where there is a wide regional gap of energy poverty in India, the recent decision to scrap subsidy on kerosene may place households in a more vulnerable position. The study also points to the inefficiency of different projects initiated by the Government of India to overcome energy poverty. The extreme positions adopted by the Establishment are alarming: on the one hand, India is advanced enough to join the Mars mission, on the other, a large section of the population still does not have basic electricity available in their homes.
Regions with Multi-dimensional Deprivation
During the last few decades, a number of academic and research studies on multi-dimensional deprivation, using a quantitative approach (Kakwani & Silber, 2008; Silber, 2007) have been published. In the ‘counting approach’ to study multi-dimensional deprivation, an emphasis has been given on a number of social indicators. Studies and surveys also have taken on an approach of compositing indicators and identifying different categories of deprivation (Das & Mistri, 2013; National Family Health Survey, 2005–06). In the present study, by using the Principle Components Analysis method, the factor score is computed on the basis of information of housing conditions, basic amenities and households without any assets. The score is termed as multiple deprivation indexes as we have considered negative indicators where households are deprived of facilities. The score is computed for each district by providing weights to each item which are not available within households and ranking of the districts is done accordingly (Bérenger et al., 2013). Regionalisation is done on the basis of these factor scores.
To assess the regions with multi-dimensional deprivation, a Multi-dimensional Deprivation Index (MDI) is constructed on the basis of ten variables. All the variables are negative in character. From the present analysis, Union Territories (UTs) and districts of UTs are left out to equalise the parity among the states and districts. MDI is the outcome of three distinctive indices, that is, Quality of Housing Index, Basic Amenities Index (BAI) and Asset-less Households (ALH). The variable details are given below:
Thus, two sets of deprivation indices are prepared where one comprises housing conditions and basic amenities and the second one includes households without having any assets. The basic assumption we attempt here is that available basic amenities are strongly reflective of one's asset status. Those who are denied basic housing and good living by providing water, electricity, clean fuel, toilet, bathroom and kitchen are denied being productive enough to generate sufficient incomes for asset accumulation.
By incorporating the first set of variables, that is, housing and basic amenities, a combined score is calculated for all the states and districts. In the states, namely Uttar Pradesh, Bihar, Jharkhand, Odisha, Madhya Pradesh and Chattisgarh, the incidence of deprivation is very high. The Human Development Report (2011–12) prepared by Institute of Applied Manpower Research (IAMR) under the Planning Commission (Government of India, 2011) indicates that these states experience an upswing of human development indicators. Yet they are at the bottom among the states in the ranking and come under the category of either very high or high level of multi-dimensional deprivation ( Figure 6A ). The EAG states (Bihar, Chhattisgarh, Jharkhand, Madhya Pradesh, Odisha, Rajasthan, Uttar Pradesh and Uttarakhand) are the home to high concentrations of marginalised groups (nearly 44 per cent of all Muslims, 52 per cent of all STs and 48 per cent of all SCs in the country). Interestingly, although an EAG state, Uttarakhand, after its bifurcation from Uttar Pradesh (2001), has recorded a low level of deprivation. On the contrary, being non-EAG states, both West Bengal and Assam have high level of multi-dimensional deprivation. The lowest deprivation club is formed by Kerala, Maharashtra, Punjab, Haryana and Uttarakhand where improved living conditions have provided enough opprtunity for asset creation also.

The same analysis is attempted at the district-level to understand the intrastate disparity in the level of multi-dimensional deprivation ( Figure 6B ). We are presenting figures which include asset deprivation. One important finding is that districts with housing and amenities deprivation mostly have asset deprivation also. The highest level of intra-state disparity is observed in Maharashtra which is a member of the low deprivation club but it also has districts which show high to very low levels of deprivation. On the other hand, the most uniform state is Kerala where all districts have low levels of deprivation followed by Bihar where all districts have high to very high levels of deprivation. Andhra Pradesh and Tamil Nadu have only one district each with a high level of deprivation where all other districts have low to very low levels of deprivation.
Conclusion
This article attempts to compare regions on the basis of housing conditions in various households by looking at the basic amenities available and their lack of assets in districts across India. The information on basic amenities and assets is taken as a proxy to measure wealth or the level of income of households. As we are trying to capture deprivation, negative indicators have been taken into consideration. The ranking of the districts (scale-free and composite index methods) is done according to their status with the non-availability of good housing conditions; non-availability of basic amenities and not having any assets which determine the extreme level of deprivation of these households. The present article attempts to argue that the denial of basic amenities like clean fuel, electricity will hold back India in controlling pollution and dealing with issues like climate change. Similarly, drinking water, bathing and toilet facilities are essential to maintain one’s good health and productivity. The EAG states identified on the basis of poor demographic indicators are some of most populous states with the highest level of deprivation and contributing to poor health, high mortality rates and low quality of living. The state and central governments are jointly responsible for the tardy implementation of existing programmes related to social sectors reforms. Thus the study concludes the importance for good governance and massive social mobilisation at the district level for better outcomes of social sectors development and also in reducing the inequality within and between states.
Declaration of Conflicting Interests
The authors declared no potential conflicts of interest with respect to the research, authorship and/or publication of this article.
Funding
The authors received no financial support for the research, authorship and/or publication of this article.
Footnotes
Acknowledgements
The authors would like to acknowledge the ORGI and Jawaharlal Nehru University for providing the academic infrastructure for conducting this research.