



Abstract
Segregation based on caste, religion, and ethnicity exists primarily in the urban housing market in India even in cosmopolitan urban centres like Mumbai, Delhi, Bengaluru, Kolkata, and Hyderabad. The present study maps segregation in Hyderabad and explores its intricate linkages with access to public amenities. This study examines caste-based segregation in urban space using multiple indexes like dissimilarity index (DI), isolation index, interaction index, correlation analysis, and mandal development index (MDI). It is observed that there is no clear link between caste-based DI and MDI. The correlation of MDI and caste-based DI illustrates that it is the location (core or periphery) that decides the level of infrastructural development. This investigation of the link between residential segregation measurement of DI and MDI leads us to conclude that the historical factors are equally crucial along with the social identities to explain urban segregation and discrimination.
Introduction
Residential segregation refers to the spatial separation of two or more social groups in a particular social structure of a specific region. While it is unrealistic to expect demolition and socially equitable redistribution of the historically segregated urban space, it becomes problematic when it is associated with discrimination in access to basic amenities (Bolt et al., 1998; Chen et al., 2011; Florida & Mellander, 2015; Haque, 2016; Jamil, 2017; Trounstine, 2015; Vithayathil & Singh, 2012). As claimed by scholars like Jamil (2017), Khairkar (2008), and Sidhwani (2015) residential segregation exists primarily in the urban housing market in India. It is predominantly based on caste (Berry & Rees, 1986; Bhan & Jana, 2015; Biswas, 2014; Khairkar, 2008; Mehta, 1968, 1969; Sidhwani, 2015) and religion (Contractor, 2012; Jamil, 2014; Thorat et al., 2015) in Indian cities. Secularised urban developments are often camouflaging new forms of exclusions in Indian cities produced due to the collusion of caste and capital (Banerjee & Mehta, 2017).
One of the earliest explanations about natural mechanisms producing an orderly and typical grouping of population and institutions was for North American cities provided by the Chicago School of Human Ecology. Ernest Burgess (1928) examined the concentrations of the Black population, Italians, and Poles in city wards in Chicago, Cleveland, Detroit, Manhattan, Philadelphia, and Pittsburgh. He developed a radial expansion map of racial and immigrant groups. It was also claimed in various studies that religion and race remain two axes along which group differentiation persists in North American cities (Duncan & Duncan, 1955; Glazer & Moynihan, 1970; Taeuber & Taeuber, 1965). Richard Rothstein (2017) contends that this enduring segregation results from a century of social engineering on the part of federal, state, and local governments that enacted policies to keep African Americans separate and subordinate. Similar to Jamil’s (2014) findings for India, a 2003 study in the USA claims that racial steering of residents away from specific neighbourhoods by realtors is shockingly persistent, even if illegal. Generations of economic and demographic shifts facilitated by public policy have produced a hyper-segregated metropolitan landscape, enabling predatory lending structures in and devaluation of minority neighbourhoods (Leeuw et al., 2008). Residential segregation is significant because where people live affects much of their lives, such as access to transportation, education, employment opportunities, health care, and basic amenities (Williams & Collins, 2001). While migration to Europe and North American cities led to clustering of people, motivating studies in these areas since the 1920s, in countries like India segregated neighbourhood remained a caste-based rural feature; Chen and Chen (2021) gave evidence of ethnic segregation in urban villages as migrant enclaves. Liu et al. (2019) observed that rural migrants in China tend to cluster rather more than local residents and urban migrants, with most of them concentrated in the outskirts of the city. Similarly, studies in Singapore highlighted that segregation cannot simply be socio-engineered away; it has profound consequences along both social and economic dimensions and creates schisms in everyday social life (Lee et al., 2021). Socio-spatial segregation that is commonly found in other places also exists in Hong Kong, though the mechanisms behind segregation processes are different (Lau, 2023).
Against this backdrop, the present study aims, first, to examine the relationship between the residential segregation and access to basic amenities based on the level of development of the area/unit of analysis. Second, it digs deeper into caste-based segregation at the intra-city level using multiple indexes. In the following section, we review the existing scholarships to identify patterns of segregation in Indian cities.
Patterns of Segregation in Indian Cities
Segregation is an organic part of the traditional Indian social structure that is based on caste. Thus, villages had residential segregation and discrimination based on caste. Nevertheless, urban centres that are supposedly heterogeneous, dense, and cosmopolitan show a pattern of segregation in housing which is rather non-derivable. Bharathi et al. (2019) find that not only are Indian cities highly segregated, but population size seems to have no association with the extent of segregation. In fact the largest cities are some of the most segregated. Across all city-size categories, the dominant trend has been persistence of the residential segregation by caste/tribe over time (Singh et al., 2019). Mumbai, the largest city of India, is a divided city, pervaded by socio-spatial fragmentation. The highest level of segregation in Mumbai is based on religion, followed by class, caste and tribe (Shaban & Aboli, 2021). The Sachar Committee Report (Sachar, 2006) claims that fearing for their security, Muslims are increasingly resorting to living in ghettos across the country (p. 14). Jamil (2015) found that these identities are manipulated and exploited by real estate agencies in Delhi, which lead to continued segregation and discrimination. Other studies have also pointed out that the spatial and social segregation of Muslims in urban centres is mainly because of the state’s apathy and negligence towards Muslims, the recurrence of communal violence and the perception of security concerns by Muslims themselves (Gayer & Jaffrelot, 2012; Thorat et al., 2015). Contractor (2012), in her study on Shivaji Nagar in Mumbai, argues that ghettoisation increases with new communal riots, and access to basic amenities is significantly affected by the identity of the individual in the city. Mumbai has community-based ‘vegetarian only’ housing societies.
Delhi and Calcutta have Muslim ghettos, crowded, run-down, and neglected. Segregated planned developments are becoming a trend in big cities endorsing the thesis of ‘black self-segregation’ experienced in some way in the USA. A planned apartment coming up in Delhi promises dream homes for ‘elite Muslim brotherhood’ (Bhowmick, 2014; Jamil, 2015). An only-for-Brahmins real estate development is going on in the outskirts of Bengaluru city by Shankara Agrahara. 1 Ahmedabad has always been divided on caste, community, and religious lines. But, Jaffrelot and Thomas (2012) say that the ghettoisation was relative in the sense that Muslim-dominated areas co-existed with Hindu-dominated ones. These mixed neighbourhoods disappeared after Muslims became the main victims in communal riots, which have been on par with their growing socio-economic marginalisation, writes Christophe Jaffrelot and Charlotte Thomas (2012) in their study of ghettoisation in Ahmedabad. Such developments seem to support the North American city type ‘black self-segregation.’ But these are more a result of subtle forces. Bharathi et al. (2021) in their study show how residential segregation across a large swathe of urban India mirrors the spatial geometry of rural India, questioning the claim of modernisation in India about the gradual withering of traditional ascriptive identities such as caste. In cities, caste hierarchies and identities experienced by migrants do not disappear but are rather reorganised and reproduced as new collective identities emerge along reformulated caste lines, which are unique to the urban context. Jeffrey Witsoe (2013) claims that the pervasive influence of caste networks explains why in getting a job or a loan, interacting with the police, dealing with mafia figures, interacting with or negotiating a bribe with a government official, or even renting a flat or commercial space in the capital, caste matters. The unevenness of urban development inherent in capitalism has led to the clustering of population and marginalisation of vulnerable populations such as widows, non-native residents, or migrants (McDuie-ra, 2012).
Studies on Indian cities inform us that the extent of segregation in India is similar to that in the United States. Further, Indian cities segregated along religious lines are also often segregated along caste lines. In contrast with the United States, however, cities with fewer minorities are more segregated. Caste segregation is associated with worse economic outcomes for both Scheduled Caste (SC)/Scheduled Tribe (ST) and non-SC/STs, but for the latter to a lesser extent. SC/STs have worse access to public goods in more segregated cities. Though Bharathi et al. (2019) confirmed no link between segregation and the size of the city, Adukia et al. (2019) tried linking the age of the city and segregation. Younger cities are less segregated than older cities by caste but not religion, suggesting that caste may be decreasingly active in urban areas (Adukia et al., 2019), there is high caste-based segregation at the smallest residential spatial scale (Vakulabharanam & Motiram, 2023). Stroope (2012) further has supported the decreasing active role of caste in urban areas. Levels of inequality and segregation are higher in cities in lower-income countries, but the growth in inequality and segregation is faster in cities in high-income countries. In most cities, high-income workers are moving to the centre or to attractive coastal areas, and low-income workers are moving to the edges of the urban region. In some cities, mainly in lower-income countries, high-income workers are also concentrating in out-of-the-centre enclaves or gated communities (van Ham et al., 2021).
Mostly the existing scholarships on residential segregation examine the extent to which different social groups live in different neighbourhoods. However, residentially, segregation can be the result of any ascribed or achieved characteristic like language or socio-economic status. Historical, political, economic, and cultural factors are often responsible for the production of segregated spaces and discrimination. Black self-segregation plays a statistically significant, albeit minor role in explaining housing segregation in the United States (Ihlanfeldt & Scafidi, 2002). In India, we do need more evidence to claim the existence of lower caste self-segregation or Muslim self-segregation. Few studies (Biswas & Putta, 2018; Chen et al., 2021; Florida & Mallenda, 2015; Jamil, 2014, 2017) also explore the ecology of segregation identifying beneficiaries of residential segregation such as those with access to various forms of social and cultural capital, and the other group with low levels of any form of capital coupled with the conditions that perpetuate segregation further (Freund, 2018).
The present study maps segregation in Hyderabad and explores its intricate linkages with access to public amenities. This study examines caste-based segregation in the urban space using multiple indexes like dissimilarity index (DI), isolation index, interaction index, correlation analysis, and mandal 2 development index (MDI). Other factors like language, education, and religion are also taken as points of analysis to link development-based discrimination with segregation.
Segregation and Hyderabad
Hyderabad is a city with a rich history. The Asaf Jahi dynasty laid the foundation of modern Hyderabad––what was earlier known as Bhagyanagar. In 1948, Hyderabad State became part of the Indian Union, and in 1956, it was made the capital of the Telugu-speaking state Andhra Pradesh. But as a centre of southern Indian states, it had a composite population that spoke Urdu, Telugu, Marathi, and Kannada. Its population was 1 million in 1951, and it was a municipal corporation. In 1956, Hyderabad State was split into Andhra Pradesh and Bombay, and the Telugu-speaking area became a part of Andhra Pradesh. In 2014, Andhra Pradesh was further split, and Telangana was formed with current Hyderabad as its capital. There are 150 municipal wards 3 and six zones under the administration of the Greater Hyderabad Municipal Corporation (GHMC). It covers the entire district of Hyderabad, 10 mandals from Ranga Reddy district covering Uppal, Balanagar, Saroor Nagar, Serilingampally, Qutubullapur, Malkajgiri, Rajendra Nagar, Hayath Nagar, Ghatkesar, and Keesara from Ranga Reddy and two mandals, Ramachandrapuram and Patancheruvu from Medak. These areas are also an integral part of the Hyderabad Metropolitan Region (HMR) under the jurisdiction of the Hyderabad Metropolitan Development Authority (HMDA).
Viswanadham (1977) studied Hyderabad’s ecological structure and drew a comparison between some of its ecological characteristics and the general features of large North American cities, highlighting more differences than similarities. He delineated segregated areas in Hyderabad based on religion, language, caste, and class and found caste segregation to be most pronounced among the SC. The most visible aspect of these blocks was that their dwellings were in striking contrast to those of other castes. They lived either in huts or dwellings built with recycled materials such as shack, polythene, torn cloths, iron sheets, and unused wood. In terms of spatial distribution, most of the areas close to the centre are inhabited by upper castes and high-income groups; and the two often seem to coincide. Demographic data of the 1970s and 1980s show that upper-class Muslims are found in large numbers in the northern part of Hyderabad. Those who belong to the lower- and middle-income groups are concentrated in the old city and the railway station area in the north-western part of Hyderabad. Gujaratis, Marwaris, and Maharashtrians live in separate clusters. Other linguistic minorities also show strong segregative tendencies. Prominent among them are Kannadigas and Tamilians. Small clusters of Kannadigas are found in the central area of the Hyderabad Division, and those of the Tamilians in different parts of the city. Unlike other Indian cities, Hyderabad’s population of Muslims is approximately triple the country’s average, and significantly larger than the comparison cities (Viswanadham, 1977). So residential segregation by religion is a more important axis of residential segregation to consider. However, the census data on religion is made available at the district level, which does not allow us to analyse residential segregation at the ward level or mandal level within a city.
Methods of Analysis
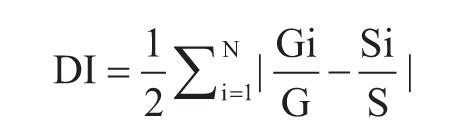
To measure segregation across states, districts, and the city at the ward level, DI, one of the widely used indexes of segregation in the existing literature on urban segregation has been used. It takes a value between zero (no segregation) and one (perfect segregation). DI is calculated by using the formula given below:
where,
Gi = Number of people belonging to a General caste and Other Backward Castes (OBC) categories in ith unit (village or ward) (General category indicates non-ST&SC population category),
G = Number of people belonging to a General caste and OBC categories in a larger unit (district or town),
Si = Number of people belonging to SC/ST in the ith unit (village or ward),
S = Number of people belonging to the SC and ST categories (district or town),
N = Total number of administrative units (wards or villages).
DI helps in understanding the degree to which the urban population is residentially homogeneous. When there are only two groups, the isolation and interaction indexes sum to 1.0; so, lower values of interaction and higher values of isolation each indicate higher segregation. However, when there are more than two groups, the interaction and isolation indexes will not sum to 1.0 (one must add the interaction indexes for all other minority groups to the interaction and isolation indexes for the original minority group to obtain unity). Furthermore, the interaction indexes representing minority exposure to majority members and majority exposure to minority members will be equal only if the two groups constitute the same proportion of the population. The formula used for the isolation index is mentioned below.
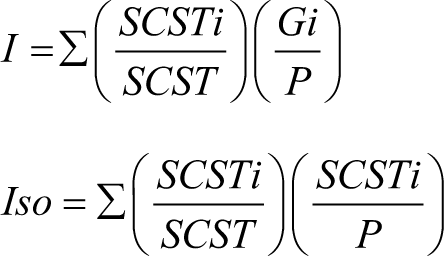
where,
I = Interaction index,
Iso = Isolation index,
SC/ST = Population of SC/ST in tract i,
SC/ST = The total population in city,
Gi = General population in tract i,
P = Total population.
An adjustment of the isolation index to control this asymmetry yields a third exposure index, the correlation ratio, also known as eta-squared.

where,
I = Interaction index,
P = Total population of the city/ward.
Unlike Pune, which has the Ward Infrastructure Service Environment (WISE) Index, Hyderabad has no development index; thus, a development index for the city to identify the most developed and least developed areas within Hyderabad municipality has been prepared. The development index is based on the services and amenities available in the mandals of Hyderabad city, including their size and total population. The data are classified into three categories––living conditions, amenities, and assets.
‘Living conditions’ includes information on the condition of the household, number of rooms, size, ownership status, type, etc. Amenities include drinking water (tap water from the treated source, tap water from the untreated source, water source within, near, and away from the premises), electricity as the main source of lighting, a latrine facility within the premises (or its absence, and therefore resorting to open defecation), piped sewer system, public latrine, bathroom (with or without a roof), drainage system (closed open or no drainage), and fuel used (LPG/CNG). Finally, ‘assets’ include banking facilities, radio, television, computer with or without Internet, telephone/mobile, bicycle, two- and/or four-wheeler.
The Census of India’s Primary Census Abstract provides ward-level demographic information about individuals, both male and female; SCs, STs, and Others; population in the age group 0–6; literacy rate; occupation, etc. Household Listing and Housing Census provides information at the household level, condition of household (good, liveable, and dilapidated); material used for wall, floor, and roof; number of rooms; ownership status; type of households, etc. To measure development, we identified positive and negative amenities. The positive amenities include access to cooking fuel (CNG or LPG, biogas, and kerosene); closed drainage system; electricity; and permanent structures and semi-permanent house structures. Negative amenities include using traditional fuel (firewood, crop residue, cow dung, and charcoal); lack of drainage; no electricity; no access to other modern energy sources such as solar energy; and no permanent housing structure.
When we look at the parameter of availability of a kitchen facility or access to a kitchen, variables like no kitchen, cooking in the open or kitchen outside the house are considered as negative factors. In contrast, the kitchen in the house or cooking inside is considered as a positive aspect. Parameters like disposal to open drains, human or animal scavenging, usage of community toilets due to there being no latrine within premises, and open defecation are negative aspects of sanitation. The positive aspects of sanitation are access to piped sewer systems, septic tanks, pit latrines, and open pits. The negative factors of the parameter of drinking water are access to untreated water sources, uncovered wells, and other sources. The positive factors are access to water from a treated source, covered well, hand pump, tube wells/bore wells, and river/spring.
The positive factors have been scored on a scale of 1–10. The scale for the negative factors also ranges from 1 to 10 where the minimum score would be 10 and the maximum 1. A ranking has been developed for all 28 mandals.
MDI for Hyderabad
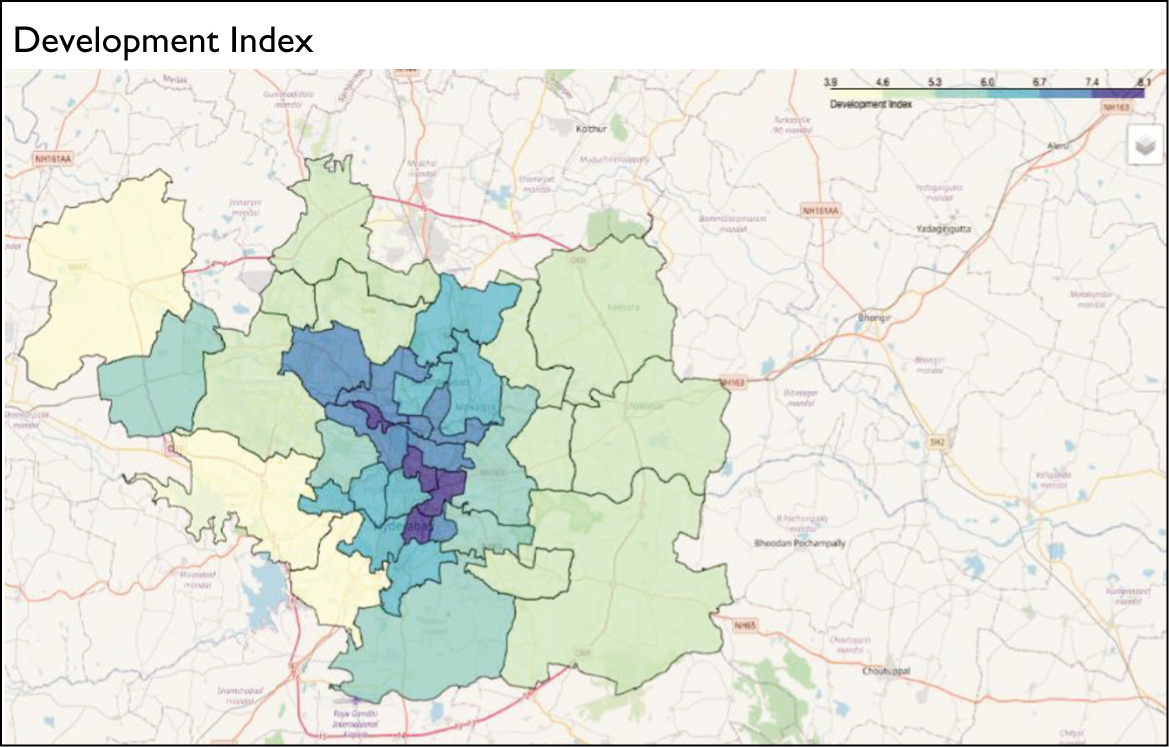
The first category of mandals comprises those which have a development index score of more than 7. The mandals of Ameerpet, Himayath Nagar, and Amberpet have the highest scores (see Table 1 ). The second category of the mandals comprises those mandals, which scored 4–6 in the development index. They are Patancheruvu, Qutubullapur, and Ghatkesar, Uppal, Saroor Nagar, and Ramachandrapuram. Rajendra Nagar mandal has the lowest MDI score (3.94).
Comparison of Indexes.

Figure 1 illustrates that the development of the mandals is more in the core area and less in the peripheral ones. In Figure 1 , the darker the colour, the more developed area it is. The peripheral municipal circles were merged into the Hyderabad Municipal Corporation to establish the GHMC in the late 2008s. The Special Economic Zone (SEZ) 4 locations in the sub-districts of Ranga Reddy are an expansion of Hyderabad and the agrarian economy of adjoining regions has transformed into service sector economy. The average MDI among the sub-districts comprising the HMR is 6.249. The mandals with less than the average MDI require more attention for development. These mandals, except Trimulgherry, Nampally, and Shaikpet, have been on the periphery of the city before and after the formation of GHMC. Similar to Wallerstein’s core–periphery model which provides that there is the exploitation of the periphery for the development of the core areas, in Hyderabad, though the revenue villages of the Shaikpet and Serilingampally mandals comprise commercial areas, they have below-average values of the development index, indicating discrimination in the level of development of core and periphery of the city. It means that though these areas are important in terms of the city’s new economic activities, the availability of basic amenities and urban facilities is not increasing at the required pace. Since we are trying to relate unequal development with segregation in the city, the attempt is to measure the level of segregation in the city and the mandals in the following section.
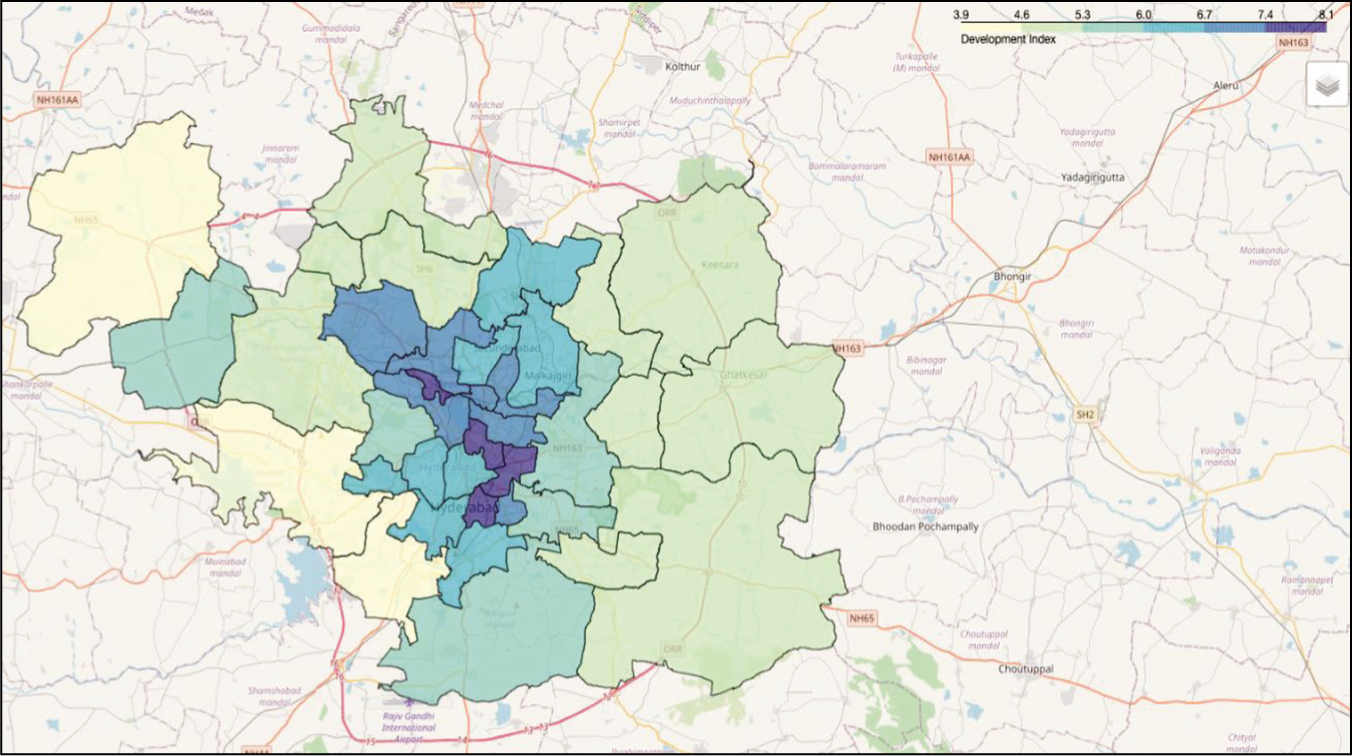
Source: Figure drawn based on authors’ calculations of development index.
Discussion: Linking MDI and DI
To analyse the development and discrimination linkage in Hyderabad, categories like caste, religion, language, and education have been taken into account. In this study, the population has been divided into two social categories: SC/ST and Others. The percentage of the population belonging to the SCs is highest in Marredpally, followed by Trimulgherry, Secunderabad, and Musheerabad. The mandals with the lowest SC population are Bahadurpura and Charminar. The highest concentration of ST population is found in Ameerpet and Bahadurpura; the lowest in Bandlaguda and Himayath Nagar. Both the General castes and OBCs are considered as ‘Others’ in using DI at the ward level across states, districts, towns, and cities.
DI is a measure of evenness. This index measures the percentage of a group’s population that would have to change residence for each neighbourhood to have the same percentage of that group as the overall metropolitan area. It is indicated in terms of zero and one, where zero means complete integration and one means complete segregation. Caste-based DI in 2011 for Hyderabad was 0.249 when we calculated it with Andhra Pradesh as the state. However, after the reshuffling of mandals and reconfiguration of the state, Hyderabad is now part of Telangana, and the caste-based DI is 0.196. As Hyderabad city’s General–SC/ST DI is 0.196, it means that almost 19 per cent of the total population would need to move to another neighbourhood to make the General and SC/ST population evenly distributed across all neighbourhoods.
The caste-based DI analysis indicates an average DI of 0.222 among the mandals comprising the HMR. The mandals, Bahadurpura, Bandlaguda, Rajendra Nagar, Golconda, and Charminar, have the highest DI values and indicate that they are segregated neighbourhoods. It is also to be noted that these mandals are those with a higher Muslim population. Except for Rajendra Nagar, all other areas represent the core of the city. A low level of caste-based DI is observed in the mandals––Ameerpet, Keesara, Serilingampally, Uppal, and Saidabad. Except Serilingampally, the other areas represent the core of the city and are dominated by the Hindu population. The DI is also calculated, taking into account the percentage of literacy in all the mandals. The concentration of the illiterate population is higher in the mandals of Nampally, Saidabad, Saroor Nagar, Khairthabad, and Asif Nagar. It shows that there exists segregation also in terms of literacy levels. All these mandals represent the core areas of HMR.
The average literacy DI calculated for the mandals comprising the HMR is 0.080. The lowest literacy DI is observed for Golconda, Himayath Nagar, Musheerabad, and Marredpally. In Figure 2 , as shown, the darker the area, the higher the DI. There is no definite pattern because when we compare the figures with the MDI, there are mandals with both higher and lower development index with higher and lower education-based dissimilarity levels (see Figure 3 ).
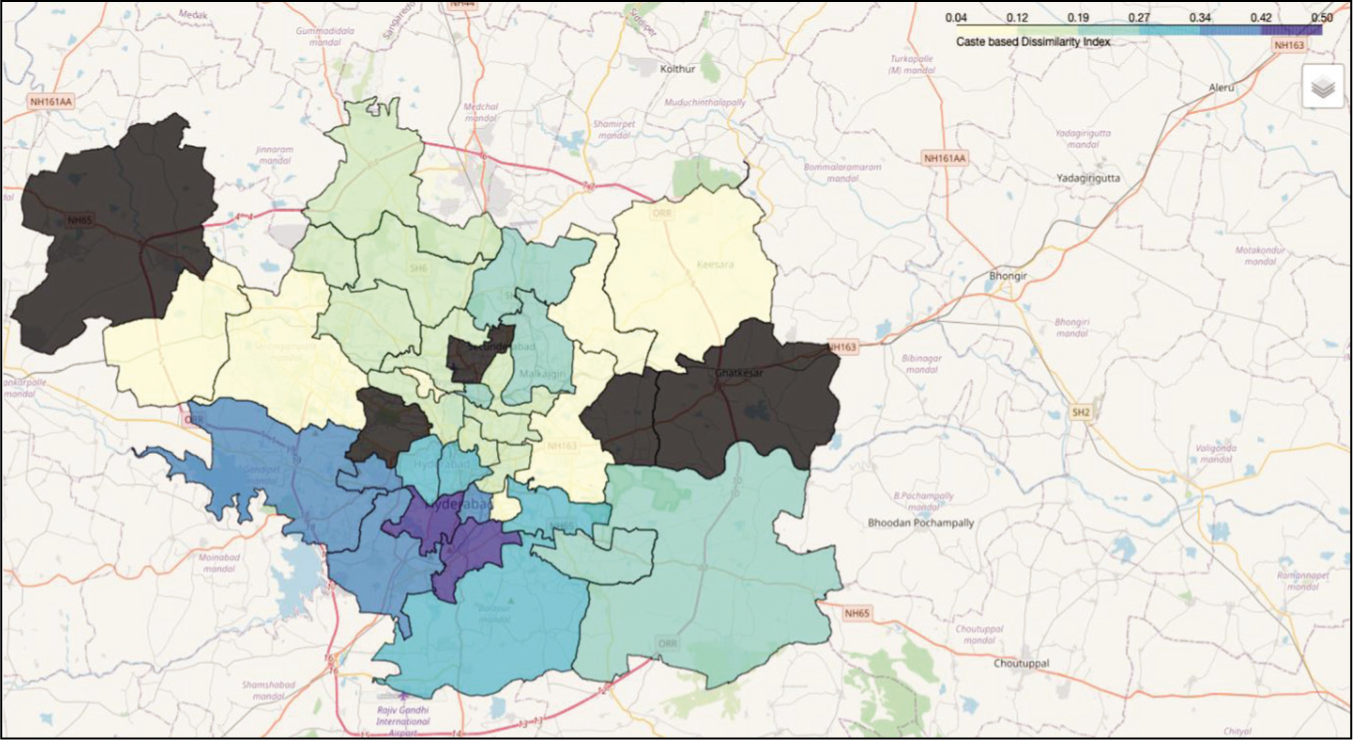
Source: Figure drawn based on authors’ calculations of caste dissimilarity index.
Black-coloured area represents mandals where ward-level data are unavailable since these are cantonments or restricted zones.

Source: Figure drawn based on authors’ calculations of literacy dissimilarity index.
Black-coloured area represents mandals where ward-level data are unavailable since these are cantonments or restricted zones.
Among the mandals with high concentration of non-Telugu and non-Urdu speaking people, Ameerpet has the highest MDI, followed by Himayath Nagar, Secunderabad, Trimulgherry, and Nampally. All these mandals have their MDI above the average MDI of the city (average development index is 6.249). This means that majority of the non-native speakers reside only in the developed mandals of the city, and where the Muslim population is less than the average of the whole city. The non-native language-speaking population is concentrated mainly in the core of the city.
Figure 4 puts the Muslim population, SC and ST population, non-native language speaking population, and MDI in one frame. It indicates that the combined concentration of all four categories is higher in the core city. Overlap of the Muslim population, native language-speaking population, and the development level can be seen in Charminar and Bahadurpura. Marredpally is the only developed mandal where SC/ST population is higher. Rajendra Nagar has the highest concentration of Muslims and the lowest development index. Hayath Nagar has the highest ST with Hindu population, but the MDI is lower. Charminar, on the one hand, has a high MDI, a higher Muslim population, and the lowest SC and ST population.

Source: Figure drawn based on authors’ calculations using Census data and calculation of indexes.
Thus, it can be seen that sequentially, the first criterion is the MDI followed by the percentage of the Hindu population and the location (the core or the periphery) that decides the concentration of the non-native speakers. The location, whether core or peripheral, decides the MDI, and there is no impact of language, religion, and social identities on the level of development of the mandals.
Assessment of Caste-Based Residential Segregation Using Multiple Indexes
Residential segregation measured by DI estimates the degree to which the SC/ST group 5 is distributed differently in comparison to the General population across a census tract, that is, a mandal. They range from 0.0 (complete integration) to 1.0 (complete segregation), where the value indicates the percentage of minority groups that needs to move to be distributed exactly like the General caste population. Segregation is less when the General and SC/ST populations are evenly distributed. Massey and Denton (1988) also proposed ‘Exposure Measure’ which is the degree of potential contact, or the possibility of interaction, between minority and majority group members (p. 287). Exposure mainly depends on the extent to which SC/ST and the General caste population share common residential areas and the degree to which the average SC/ST group member experiences segregation. Although the indexes of Evenness and Exposure 6 are correlated, they measure different things because Evenness Measures do not depend on the relative sizes of the two groups compared, while Exposure Measures do.
Caste-based DI (see Table 1 ) is higher in Asif Nagar (0.293), Nampally (0.299), Saroor Nagar (0.316), Charminar (0.356), Golkonda (0.381), Rajendra Nagar (0.416), Bandlaguda (0.458), and Bahadurpura (0.496). It means in Bahadurpura more than 49 per cent population needs to shift their residence in order to reach an equal distribution of the General population and SC/ST population. Ameerpet needs the residential shift of just 4 per cent population for an even distribution of the General and SC/ST population.
The interaction and isolation indexes measure the exposure, defined as the extent to which interaction occurs between the majority and the minority population in a region. The sum of the values of interaction and isolation indexes is equal to one. The areas or regions that have low values of the interaction index and high values of the isolation index indicate higher segregation levels. Those areas where the isolation values are low and interaction ones high are the areas where there is less or no segregation.
In our study, the average value of the interaction index is 0.89161 The highest is 0.9406 (Charminar mandal) and the lowest is 0.802 (Ghatkesar mandal). The calculation could not be done for Trimulgherry as it falls under the Secunderabad Cantonment Board. When these indexes were compared with the MDI, it was observed that Charminar, Ameerpet, and Himayath Nagar were mandals with the highest development index, and Marredpally and Bandlaguda had their development index above the average. Below-average isolation index was observed in Uppal, Ramachandrapuram, Musheerabad, Asif Nagar, Qutubullapur, Keesara, and Bahadurpura mandals. When mapped for the concentration of the SC population, low values of the caste interaction index were observed for Rajendra Nagar, Shaikpet, Malkajgiri, Secunderabad, and Ghatkesar.
The mandals with higher caste-based DI and higher literacy-based DI were mapped with their MDI. Of the 28 mandals’ literacy-based DI, Nampally had the highest followed by Saroor Nagar, Asif Nagar, and Secunderabad. There existed segregation based on literacy irrespective of the location of the mandals in the core or the periphery, MDI, and whether they had high or low values of caste-based DI. There was a higher literacy-based DI in areas irrespective of the concentration of the Muslim or SC or ST population and the MDI. There was no definite pattern or relationship between segregation and religion, caste, language, or the MDI because caste- and literacy-based DI was observed in both the highest- and lowest-developed census tracts. There existed some level of segregation in terms of literacy when the Muslim population was higher. Irrespective of the concentration of the ST population, there existed a disparity in literacy levels. The lowest literacy dissimilarity was observed in the mandals of Himayath Nagar and was preceded by Golconda, Musheerabad, Marredpally, Bahadurpura, and Malkajgiri. All these areas represented the core areas of HMDA. Hyderabad’s core areas had both lower and higher values of literacy DI. It highlighted the unequal distribution of resources in the core areas of the city.
The analysis shows that it cannot be ascertained whether the developed units were most segregated or not. There is no clear link between caste-based DI and MDI. Mandals like Ameerpet, Himayath Nagar, Amberpet, Charminar, and Balanagar had lower DI values and high-caste interaction index values. For literacy DI, Himayath Nagar and Musheerabad had high values of literacy interaction index and the lowest DI along with Golconda and Marredpally. The next assumption was that the level of segregation is higher in the core city and less in the periphery. The caste DI indicates that segregation is higher in the core than the periphery, and the same is observed in the literacy DI. The literacy isolation index highlights that it is the city’s core areas, where the lower and higher values are present. In contrast to the assumption of the Chicago School of Human Ecology that claims the concentration of the poor in the core areas of the city, in Hyderabad city the poor population inhabit the periphery that has a low level of development and poor service provisions.
The MDI figure (see Figure 1 ) illustrates that it is the core and periphery location that decides the level of high state intervention and economic activities. There is no clear link between caste-based DI and literacy-based DI and MDI. A subsidiary question was: Are the migrants the most segregated section in the city? Because the city’s political dynamics affect their situation more than their location in the city or their social identity, migrants are segregated. Central to hardships of the migrants in the city is a cultural gap between the migrant and local societies. If we consider the non-Telugu and non-Urdu speaking populations as migrants, they reside in the developed mandals and have access to basic amenities irrespective of their caste.
The MDI is followed by the percentage of the Hindu population and the location (i.e., the core or periphery) that decide the non-native speakers’ concentration. There is no impact of the SC and ST population on their presence. Skilled labours and a steady-income population will choose areas with better amenities, which are found in mandals with average and above-average development index. Charminar has the highest Muslim population and much less presence of migrants. Ghatkesar has a low development index and this mandal also has the presence of a smaller number of migrants. Rajendra Nagar, one of the mandals with the lowest MDI in the periphery, has approximately 50 per cent of the Muslim population. Agriculture is still a predominant occupation in this urban space and land use is restricted under GO. Ms. No. 111. 7
The uneven presence of social categories cannot always be held responsible for residential segregation in urban spaces. There can be other factors like self-segregation (Ihlanfeldt & Scafidi, 2002), the nature of public policies (Leeuw et al., 2008; Rothstein, 2017), cultural and historic conditions, accessibility of social capital (Remesh, 2012; Witsoe, 2013), social situations (Jamil, 2015; Jaffrelot & Thomas, 2012), capital and caste collusion (Banerjee & Mehta, 2017), and economic criteria like the housing price variation, etc. (Biswas & Putta, 2018).
This investigation of the link between residential segregation measurement of DI and MDI motivates us to examine the historical factors that are equally crucial besides social identities in explaining the present-day pattern of urban segregation and discrimination in a historical city like Hyderabad.
Historical Factors and Segregation in Hyderabad
The social landscape of the region is important to understand the social practices and social position of communities in India. It is not simply the economic geography of the city but also the social geography that plays a crucial role in defining the narrative of the urbanisation experience (Sam, 2012). The Hyderabadi Nizam rulers were emulating medieval politics, but the colonial model of modernity was apparent from the middle of the nineteenth century in Hyderabad. The railways accommodated a considerable number of dalits in labouring jobs in the Hyderabad and Secunderabad cities; English education was expanding, providing space for the emergence of dalit consciousness. Dalit families who escaped from the clutches of rural Telangana feudals and migrated to Hyderabad city had utilised these new avenues (Bhukya, 2014). This may be the reason for the high SC/ST population concentration in Marredpally, Trimulgherry, Secunderabad, and Ameerpet, which are known for railway yards, offices, and military establishments.
The Nizam government established a trust for the development of education and welfare of the SC/STs. During that phase, religion and conversion was not the foundation of the dalit–Muslim unity but their common plight under the Caste-Hindu feudal system. In Musheerabad, the clustering of the SC population can be attributed to the presence of tanneries and industrial establishments (Mustafa, 1968). In old cities, the kind of segregation observed is historically reproduced. For example, in Hyderabad in the pre-independence era, the Nizam administration divided the state into feudal segments, especially on the basis of religion, that is, the Samasthanams (land-owner-ruled provinces), Jagirs (gifted land by Nizams to Hindu zamindars), and Inams (gifted land to Muslims). Similar divisions are seen in the cities of Lucknow and Ahmedabad too. Though Hyderabad was the principal seat of power for the Muslim community, there were other communities which dominated certain areas. For example, in the years 1830 and 1832, Sikhs were a dominating presence in the areas of Kishanbagh, Attapur, colonies near Mir Alam Tank, and Rajendra Nagar (Singh, 2014).
In Nizam’s administration, upper castes like Reddys and Velamas had feudal powers along with Muslims (Satyanarayana, 1993), but the use of Urdu as the official language gave the bureaucratic power only to the Muslims. The Nizam’s policies created a divide among Muslims as only a selected few had ownership and control of land, resulting in a majority of the rest of the Muslims remaining poor and disadvantaged. The situation aggravated further as the lower-caste Hindus were also denied land ownership (Sherman, 2007). In the post-independence period, the Muslims of Marathi- and Kannada-speaking regions became a part of present-day Maharashtra and Karnataka. The migration of affluent Muslims from Pakistan and other parts of India to the new capital of Andhra Pradesh state occurred in the 1950s. In the Hyderabad State, the Muslims remained in the Hyderabad city in the old city area, which was stagnant, congested, and had reduced livelihood options (Naidu, 1990). Therefore, significant pressure was always there to develop this part of the city to bring it at par with the new city (Vithal, 2002). The decisions taken by the governing bodies over a period of time, migration trends, and the changing social milieu also partially shaped the residential patterns and access to basic amenities in the city.
Limitations
The Census of India releases block-level enumeration data for only basic population numbers that do not permit characterising segregation based on other socio-economic axes or characterise the uneven availability of public goods in different neighbourhoods. Thus, we tried to explain the situation using mandal-level data. This situation points to severe data limitations that have constrained scholarship, policy, and praxis surrounding urbanisation and segregation. Discussion on how globalisation shaped urban space-making in contemporary Indian cities could not be taken up. Another significant limitation here is that the study is a highly quantitative analysis that needs substantiation with data from ground-level surveys and narratives.
Conclusion
Our analysis has provided a systematic assessment of mandal-level urban segregation in Hyderabad refuting a dominant discourse of caste-based segregation to be a rural phenomenon. However, the study can be taken forward to assess the role of urban housing policies in the production of segregated urban spaces.
Residential segregation is both a reflection of the ideologies and practices which structure our social life. It is a socio-historic product of the uneven development of residential space and of the selective operation of the institutions that govern access to housing. Residential space ensures access to basic services, education, employment opportunities, health, and social services. Thus, residential segregation is linked to the capabilities of the residents, depriving the segregated population of the real opportunities to do and be what they value. Therefore, urban planners should take into account the inequalities in access to basic amenities embedded in residential segregation in developing urban infrastructure and housing policies.
Footnotes
Acknowledgements
We are extremely grateful to the anonymous reviewers of Social Change for their detailed comments, which helped in improving the quality of this article. We also express our gratitude to BITS-Pilani Hyderabad Campus for supporting the research through the Research Initiation Grant. We thank Mr Pranjal Gupta for his assistance in the project.
Declaration of Conflicting Interests
The authors declared no potential conflicts of interest with respect to the research, authorship, and/or publication of this article.
Funding
The authors disclosed receipt of the following financial support for the research, authorship, and/or publication of this article: The research for this article was funded by BITS-Pilani Hyderabad Campus through its Research Initiation Grant.