
Abstract
In this article, “Benford’s law” is applied to the “randomized response technique” (RRT) to increase the validity of answers to sensitive questions. Using the Newcomb–Benford distribution as a randomizing device has several advantages. It is easy to explain and follow the procedure, as no physical device such as a coin or a dice is necessary and the method guarantees full anonymity. As is well known, the price for the anonymity of the RRT is a decrease in the efficiency of the estimator. However, because of the subjective overestimation of certain numbers (Benford illusion), the conflict between the variance of the estimates and the degree of anonymity is less pronounced compared to other RRT methods. The suggested RRT variant has the potential to improve the efficiency of the estimator. Moreover, the assumption is that this method works well with self-administered questionnaires.
Imagine a little bet. Two people bet on the first digit of an unknown house number drawn at random. The loser has to pay one dollar to the winner. Player A wins if the digit is in the range 1 to 4. Player B wins if the digit is 5 to 9. Is this a fair bet? It is not. Counterintuitively, the bet is rather unfavorable to player B. The first digits of house numbers follow a logarithmic distribution known as Benford’s law (the Newcomb - Benford law, see below). The betters’ odds are 7:3 in terms of objective probabilities. The discrepancy between perceived and objective probabilities is one of the advantages using Benford distributed digits as a randomizing device for the “randomized response technique” (RRT).
The RRT anonymizes responses to sensitive questions in interviews, increasing the validity. With the proper administration of RRT, the respondent will be sure that an interviewer or researcher is unable to relate a positive answer to a sensitive question with the respondent’s true behavior. The technique proposed by Warner (1965) was often applied to self-reports of deviant behavior such as shoplifting, drug consumption, or illegal tax reduction (see Lensvelt-Mulders et al. 2005 for a meta-analysis). In this article, an improvement of the RRT is suggested by combining RRT with “Benford’s law” of the distribution of first digits.
The RRT Method
RRT starts with a randomizing device. Depending on the outcome of the randomization procedure, a respondent either has to answer the question of interest A or a “random question” B. Of course, the interviewer or researcher does not know if a person is responding to question A or question B. Assume that responses to both questions are “yes” or “no,”p is the probability that the respondent answers question A, 1 −p is the probability of answering random question B, and πB = p(“yes”|B) is the probability of a “yes” response to the random question. Then, we are looking for an estimate of πA = p(“yes”|A), the expected proportion of respondents answering “yes” to the question of interest. If we denote the overall proportion of “yes” in the sample by λ we have:

Solving for πA yields:

p and πB are determined ex ante by the researcher’s RRT design. A special case is the “forced response” design with πB = 1. In this case, a person is “forced” to respond “yes” to the random question.
The RRT has the advantage of guaranteeing anonymity, but not without costs. The price is a loss in efficiency. In addition to sampling error, the probabilistic RRT device enlarges the variance of the estimated proportion of positive responses to the sensitive question.
The Newcomb–Benford Distribution as a Randomizing Device
In face-to-face interviews, a pack of cards, a dice, a coin, or some other device may be used to generate randomized outcomes. For example, if a person tosses “head” he or she is instructed to answer the random question, if the result is “tail” the question of interest has to be answered. This technique has some difficulties in telephone interviews and is particularly problematic in self-administered interviews such as mailed questionnaires or online surveys. As an alternative, I suggest to make use of the Newcomb–Benford distribution.
It is well known that first digits of data from social or natural phenomena such as the size of populations or the house numbers in an address directory follow a logarithmic distribution. This distribution was originally discovered by Newcomb (1881), who noticed that tables of logarithms were disproportionally often consulted for small numbers. Newcomb was the first to formulate his observation as a mathematical law, and he also found the probability laws for second, third, and higher order digits. Newcomb’s law was rediscovered by Benford (1938) several decades later.
By the Newcomb–Benford law, the probabilities of first digits d = 1, . . ., 9 are:

By this formula, we have P(1) = .301, P(2) = .176, P(3) = .125, P(4) = .097, P(5) = .079, P(6) = .067, P(7) = .058, P(8) = .051, and P(9) = .046.
The term Benford’s law is used for short (although Newcomb’s law or the Newcomb–Benford law would be more appropriate). Benford himself collected a large mass of data from various sources (newspapers, street addresses, Reader’s Digest, area of rivers, population data, etc.) showing that the first digits of these data are rather well in accordance with the logarithmic distribution. Hill (1995) gave a proof of why the first digits of numerical data from so many different sources follow this law. The assumption is that one picks a random sample of distributions in a first step and selects random samples of numbers in a second step. By this procedure, first digits approximate—under certain conditions—to Benford’s law. Moreover, Benford’s law is scale invariant. If, for example, the digits of the area of lakes measured in square miles follow Benford’s law, then the digits will also be in accordance with this law as well if the area were measured in square kilometers (Hill 1995).
Several applications of Benford’s law are reported in the literature. Most notable are tests for the detection of accounting fraud, tax fraud, faked interviews in survey research, and election fraud, although the performance of the Benford tests is still a matter of controversy. 1
Note, however, that many kinds of data do not give rise to Benford-distributed digits. Data measured on scales with maximal or minimal values or artificially constructed numbers may yield a poor fit to the Benford distribution (Nigrini and Mittermaier 1997). Consequently, simply assuming that digits from a certain sample of numbers follow Benford’s law may be misleading. Instead, for the application of interest, one has to establish by empirical methods that the data are in accordance with Benford’s law.
In the case of Benford-distributed digits, by formula (2) the probability that the first turns out to be digit 1, 2, 3, or 4 is .699 or roughly .70. The probability of drawing a first digit among the set of remaining digits is .30. The 7:3 rule provides a mechanism to split the sample in a set of respondents answering the question of interest A and respondents answering the random question B. For example, subjects are asked to think of the address of a friend and to keep the house number in mind.
Depending on the first digit either belonging to the set {1,2,3,4} or belonging to the set {5,6,7,8,9}, a person has to answer question A or question B. Other sets may be constructed if a researcher prefers smaller or larger probabilities for the question of interest.
Of course, the method assumes that the first digits of house numbers generated by the respondents are Benford distributed. It can be demonstrated that the “objective” distribution of first digits of house numbers is of Benford type (Figure 1). Note that Benford (1938) already identified digits of street addresses to follow the logarithmic law.
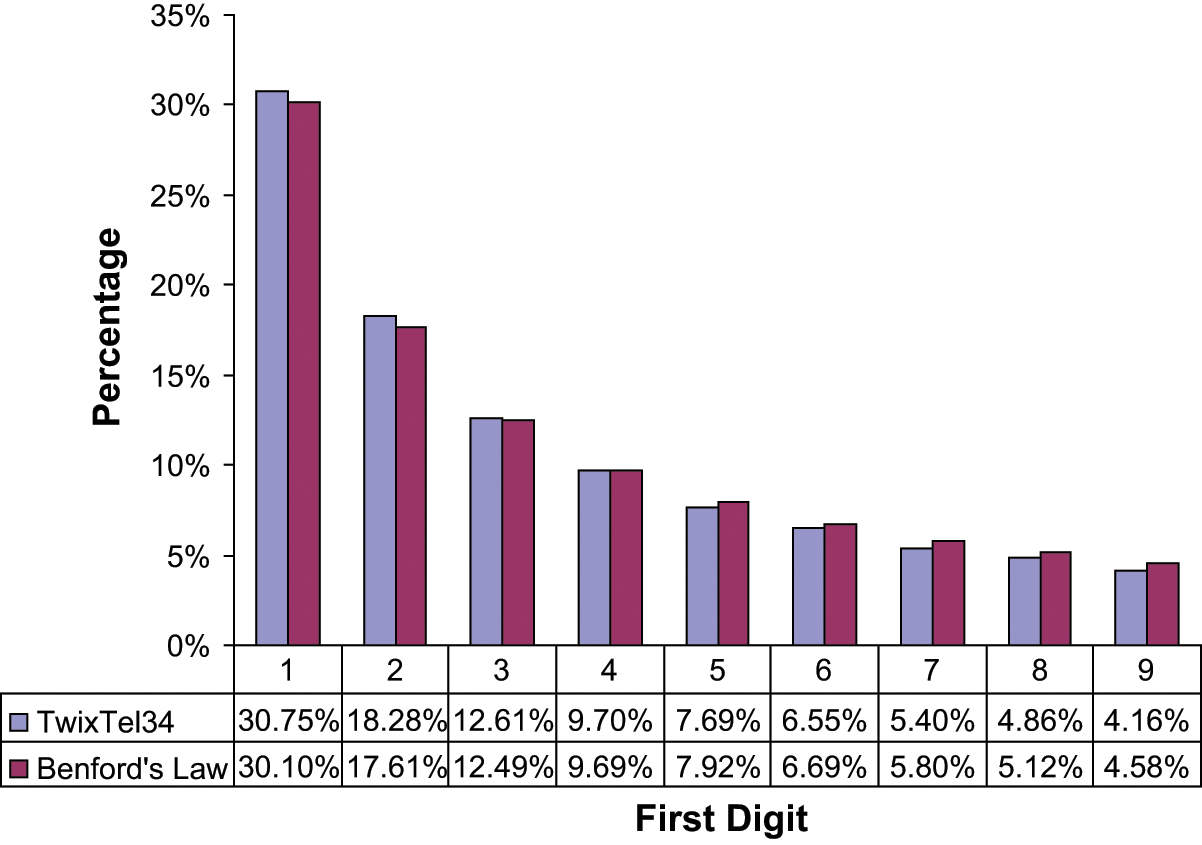
Distribution of almost 3 million first digits of Swiss house numbers.
The “Benford Illusion” and Other Advantages of the Method
As was noted above, the price for the anonymity of the method is an increase in the variance of the estimator for the proportion of yes responses (πA) to the question of interest.
The variance is (Fox and Tracy 1986; Moriarty and Wiseman 1976):

It follows that the variance of the estimator increases with the probability 1 − p to arrive at the “random question,” that is, at an increase of anonymity. In other words, there is a conflict between efficiency and anonymity.
Using the Benford distribution with RRT has the advantage of diminishing the conflict because the perceived probabilities and the objective probabilities differ. Moriarty and Wiseman (1976) were early advocates for using the discrepancy of perceived and objective probabilities in RRT research. 2 Many people believe that the chance to pick an address where the first digit is one, two, three, or four is much smaller than 70 percent. This discrepancy or “Benford illusion” as I name it has the positive effect that the perceived p, and, therefore, the perceived anonymity is larger than the objective p. With the little trick of the Benford illusion, the anonymity can be increased without loss in efficiency.
There are other advantages, too. The method does not require any physical device such as a coin or a die to generate random numbers. In most previous studies, the RRT is applied to sensitive questions in face-to-face interviews. It is unlikely that most people, asked to fill in online surveys or mailed questionnaires, follow instructions properly if a coin or dice is required. It remains to be demonstrated in further research whether the Benford method has the potential to be applicable to self-administered surveys as well as to telephone interviews.
Shoplifting: An Empirical Example of RRT Using Benford’s Law
Students attending sociology lectures at the Universities of Bern and Zurich were asked to fill in a questionnaire. Two-hundred ninety-five participants in Bern and 93 participants in Zurich had to recall a house number of friends or relatives, then focus on the first digit and memorize the digit. Then, respondents with a digit in the range 5 to 9 were instructed to skip the next question and to mark “yes.” Respondents with a digit in the range 1 to 4 were asked: “In the last five years, did you ever intentionally take a shopping item without paying for it?” In addition, students had to estimate the probability that the first digit of a randomly drawn house number is in the range of 1 to 4 or 5 to 9.
Thirty-seven of the 93 students of the Zurich sample marked “yes,” resulting in an estimate of .14 for πx. A simple method to compute the estimate is illustrated in Figure 2. Of course, formula (1) given above yields the same value. The standard error of the estimate, computed via formula (3), is .073. In the Bern sample, 114 of the 295 students answered “yes.” The estimate of the proportion shoplifting is .12 with an estimated standard error of .04.
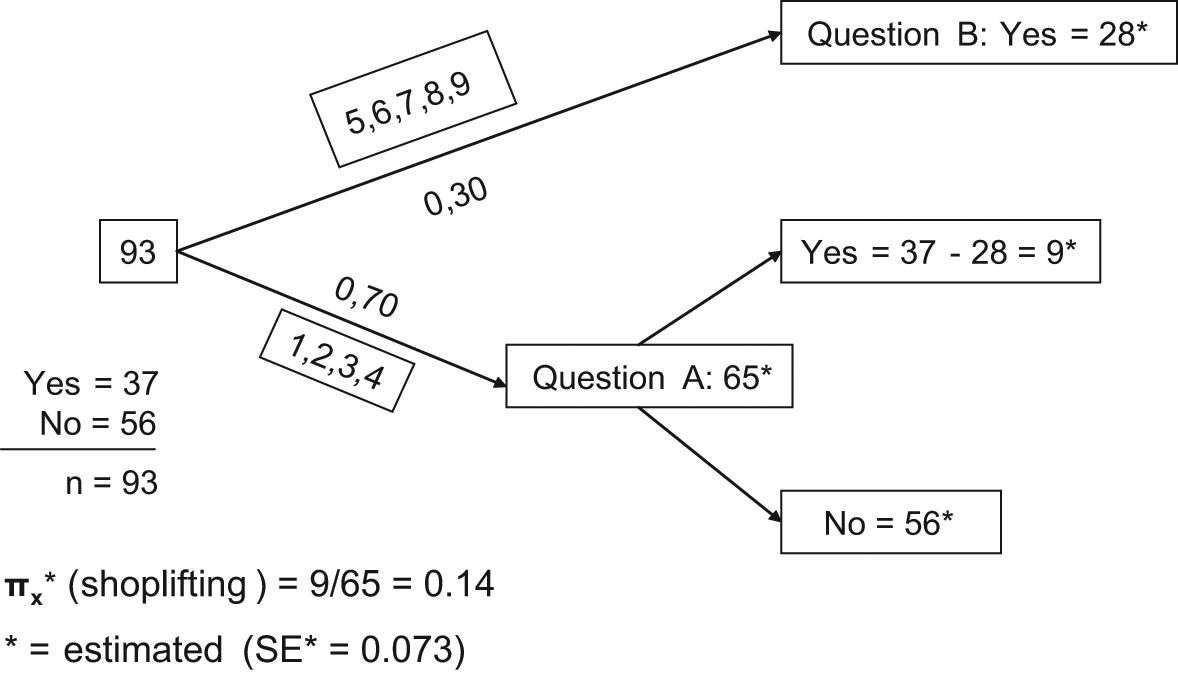
Estimated proportion of shoplifting in a randomized response technique (RRT)-Benford experiment.
Do the data support the hypothesis of the Benford illusion? The arithmetic mean of the frequency distribution of estimates for the probability to arrive at first digit 1 to 4 is .61 for the Bern sample and .54 in Zurich. Although this value underestimates the .70 probability of the Benford distribution, it is nevertheless relatively large and possibly larger than an estimate from a sample of the national population. A large part of the sample believes that the digits are distributed more evenly. This difference in proportions (|.70−.61|) is highly significant (t = 3.79, one-sided test) supporting the hypothesis of the Benford illusion.
Still another assumption of the procedure has to be proven. Implicitly, it has been assumed that subjects generate first digits of house numbers in accordance with Benford’s law. We already know that “Benford” approximates real house numbers very well (see Figure 1). Yet, we do not know if this is true for the numbers chosen by the subjects. To test for this assumption, the question to pick a house number of friends or relatives was included in a non-RRT survey on the evaluation of wages and income in Switzerland. 3 The result is very clear. The subjectively generated first digits of house numbers are very much in accordance with the Benford distribution (Figure 3).
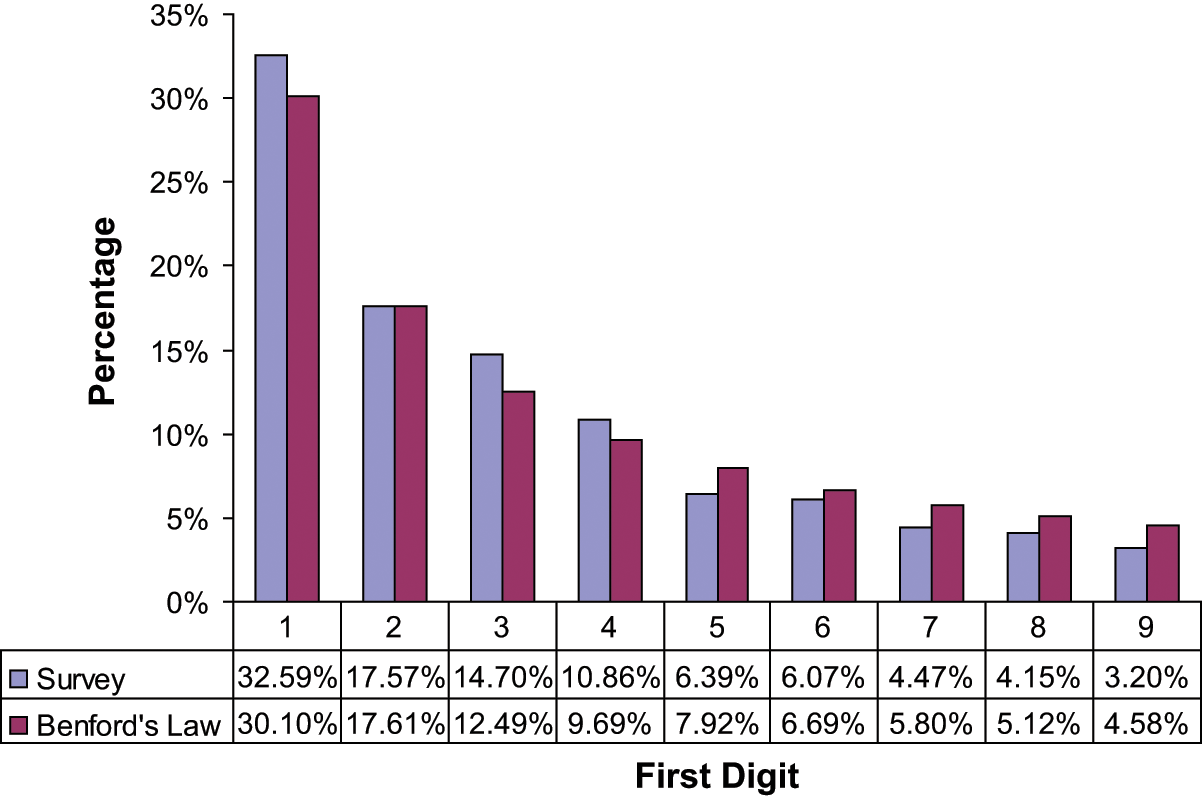
First digits of house numbers generated by a CATI survey.
Conclusion
In the empirical example, the Benford RRT was used in a written questionnaire subjects had to answer in a group situation. Will the method work as well with self-administered questionnaires without an instructor present? More empirical investigations are required to answer this question, though the potential exists as it is easy to explain and follow the procedure, and no physical device such as a coin or a die is necessary and the method guarantees full anonymity. Due to the overestimation of certain numbers (Benford illusion), the conflict between the variance of the estimates and the degree of anonymity is less pronounced compared to other methods. Further, the Benford method is flexible, allowing researchers to choose proper probabilities for the question of interest. Of course, the method is useful for designs not based on “forced responses” as well and it is worthwhile to compare the proposed method with alternative randomizing mechanisms, exploring the validity of the alternative methods in empirical studies.
Footnotes
Acknowledgements
The author would like to thank Stefan Wehrli for providing the results of the analysis of the Swiss Telefone CD (Figure 1). Ben Jann suggested to include the “house number question” in his survey on “wages in Switzerland.” The author is grateful for the results of his analysis (![]() ). The author would like to thank Martin Abraham (Bern) and Marc Szydlik (Zurich) who conducted the data collection in their lectures. For valuable hints and support, the author thanks Matthias Naef, Stephanie Eckman, and Ray Weathers.
). The author would like to thank Martin Abraham (Bern) and Marc Szydlik (Zurich) who conducted the data collection in their lectures. For valuable hints and support, the author thanks Matthias Naef, Stephanie Eckman, and Ray Weathers.
Declaration of Conflicting Interests
The author(s) declared no potential conflicts of interest with respect to the research, authorship, and/or publication of this article.
Funding
The author(s) disclosed receipt of the following financial support for the research, authorship, and/or publication of this article: This research was supported by a grant from the “Deutsche Forschungsgemeinschaft” (DFG) as a part of the priority program on “Survey Methodology.”.