
Abstract
The rapid proliferation of cell phone use and the accompanying decline in landline service in recent years have resulted in substantial potential for coverage bias in landline random-digit-dial telephone surveys, which has led to the implementation of dual-frame designs that incorporate both landline and cell phone samples. Consequently, researchers have developed methods to allocate samples and combine the data from the two frames. In this article, we review point and interval estimation methods of proportions that can be used to analyze overlapping dual-frame surveys. We use data from the survey of attitudes toward immigrants and immigration (Opinions and Attitudes of the Andalusian Population regarding Immigration survey), a dual-frame telephone survey conducted in Andalusia, Spain, to explore these different statistical adjustments for combining landline and cell phone samples. Our application obtains good results for calibration, fixed weight, pseudo-empirical likelihood, and single-frame procedures. We recommend that one of these internally consistent estimators be used in practice. The results of these methods of estimation show that the negative image toward immigration continues to spread.
Introduction
Traditionally, surveys have been carried out using three main methods of data collection: face-to-face interviews, mail surveys, and telephone interviews. Over the last 20 years, the picture has changed sharply. Telephone surveys have become a popular mode of data collection, especially following the creation and development of computer-assisted telephone interviewing (CATI) systems. Telephone interviews are often considered a less costly alternative to e-mail and face-to-face interviews and the population coverage reaches acceptable levels.
From 2000 to the present, there has been a steady increase in the use of telephone surveys, which have replaced all other data collection methods (the majority of which were face-to-face interviews). The telephone survey presents numerous advantages compared to a face-to-face one. In some subject areas (e.g., electoral studies), face-to-face surveys have been completely ousted by telephone interviewing. Moreover, studies have reported improved results from phone surveys compared with face-to-face interviews (Abascal, García, and Landaluce 2012; Díaz de Rada 2011).
However, telephone surveys also present some drawbacks with regard to coverage, due to the absence of a telephone in some households and the generalized use of mobile phones, which are sometimes replacing fixed (land) lines entirely (see Pasadas et al. 2011; Trujillo, Domínguez, and Pasadas 2005; Vicente, Reis, and Santos 2009). The potential for coverage error as a result of the exponential growth of the cell phone-only population has led to the development of dual-frame surveys. In these designs, a traditional sample from the landline frame is supplemented with an independent sample from the banks of numbers designated for cell phones.
By drawing samples from both cell phones and landline phones instead of from a single frame, it is possible to reduce survey costs, improve the coverage of the overall sample (Brick et al. 2006; Busse and Fuchs 2012; Lu et al. 2013), and even potentially increase response rates, depending on the specific survey being conducted (Opsomer 2011).
Some surveys have used a screening dual-frame survey design, in which people belonging to the landline telephone frame are removed from the cell phone frame before sampling commences, and only people living in cell phone-only households are interviewed (Brick, Edwards, and Lee 2007). No new statistical methods are required to estimate totals in such a survey, since essentially a stratified sample is taken.
The screening approach can introduce a potential for bias due to nonsampling errors (Kennedy 2007), and in many cases, it may not be possible or practical to remove list-frame units from the landline frame before sampling (it is not known beforehand whether a household member sampled using one frame also belongs to the other one).
Instead, in an overlapping dual-frame survey, independent probability samples are taken from frame A (the landline frame) and frame B (the cell phone frame). Information from the samples must be combined to estimate population quantities, and there are many options for estimators. The estimation of a population total for dual-frame surveys was first investigated by Hartley (1962, 1974). Lund (1968) and Fuller and Burmeister (1972) subsequently improved on Hartley’s results, and Bankier (1986) and Skinner (1991) have proposed alternative estimation techniques. More recently, Skinner and Rao (1996), Lohr and Rao (2006), Mecatti (2007), Rao and Wu (2010), Singh and Mecatti (2011), and Ranalli et al. (2013) have considered new multiple frame estimators for the population total. These methods are usually formulated under an ideal dual-frame survey setup (two frames can cover the entire target population).
In the analysis of a social survey, the response variables encountered are often discrete. For example, this would be the case for public opinion research, marketing research, and government survey research. In these cases, the estimation of a proportion is a commonly used statistic for summarizing data (the proportion of voters in favor of a presidential candidate, the unemployment rate, etc.). The customary sample proportion is calculated as the percentage of individuals with a specific attribute divided by the total number of individuals in the sample. At the time of data collection, the sizes of the two frames are known. However, these two frames, in conjunction, do not usually cover the entire population, as many people do not belong to either of them. If the population size is unknown and must be estimated, the estimation for proportions is more complex than that for a total, and yet this problem has hardly been discussed in the literature on multiple frames. In this article, we estimate the size of the conjunction of two frames and the proportion of interest in the population, using the methods described in the third section.
After describing the Opinions and Attitudes of the Andalusian Population regarding Immigration (OPIA) survey in the second section, in the third section, we consider the problem of the estimation of a proportion in our dual-frame telephone survey and then examine the effect of various estimation strategies designed to reduce the sampling error. In the fourth section, we present a jackknife technique variance estimation for all estimators considered. The fifth section presents the results of the different estimation strategies in our survey data set. Finally, in the sixth section, we conclude with some thoughts about methods that could be used in future surveys that sample both landline and cell phone numbers.
Survey of OPIA 2013
The 2013 survey of OPIA is a population-based survey conducted by the Institute of Social Studies of Andalusia (IESA), a public scientific research institute specializing in the social sciences. Its aim is to reflect the opinions of the Andalusian population with regard to various aspects of immigration and refugee policies in Spain and toward immigrants as a group. This survey was conducted in a period characterized by one of the most severe economic crises in the modern history of Andalusia, which has dramatically increased rates of unemployment, a situation that has notably changed attitudes toward immigration in Andalusia. This survey is based on a sample of persons drawn from both landline and cell phone frames.
Population Coverage Through Landlines and Cell Phones in Andalusia
In Andalusia, the proportion of survey subjects only reachable by landline communication has decreased to below 10 percent. In economic good times, and due to rising numbers of Internet connections, the proportion of people only reachable by cell phone also declined. However, in recent years, this proportion has risen to around 20 percent. The number of people not reachable by phone now only represents a residual percentage of the population (less than 2 percent; Figure 1, Table 1).

Evolution of landline and cell phone coverage for people over 16 years old.
Coverage in 2013.
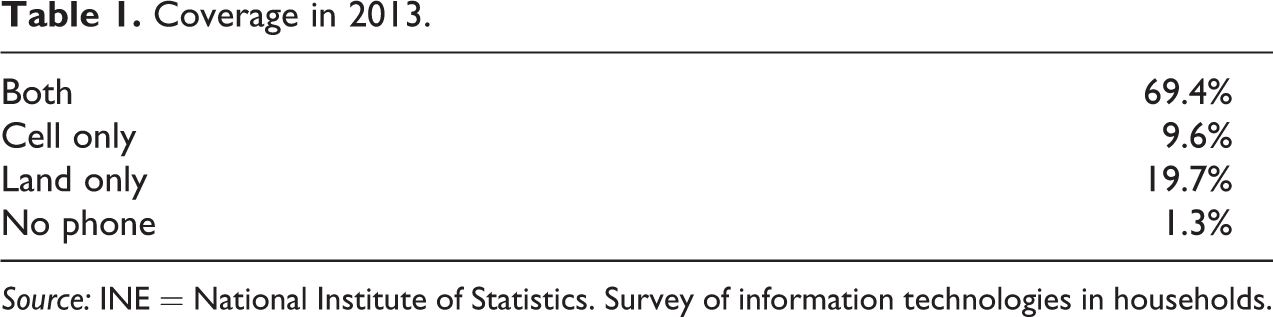
Source: INE = National Institute of Statistics. Survey of information technologies in households.
The distributions of landlines and cell phones vary considerably depending on the age of the population. Figure 2 shows that, taking into account only people for whom the availability of a landline depends on their own decision, that is, not considering people living with their parents, the younger the population, the higher the percentage having only a cell phone. This value exceeds 40 percent for people aged less than 33 years.
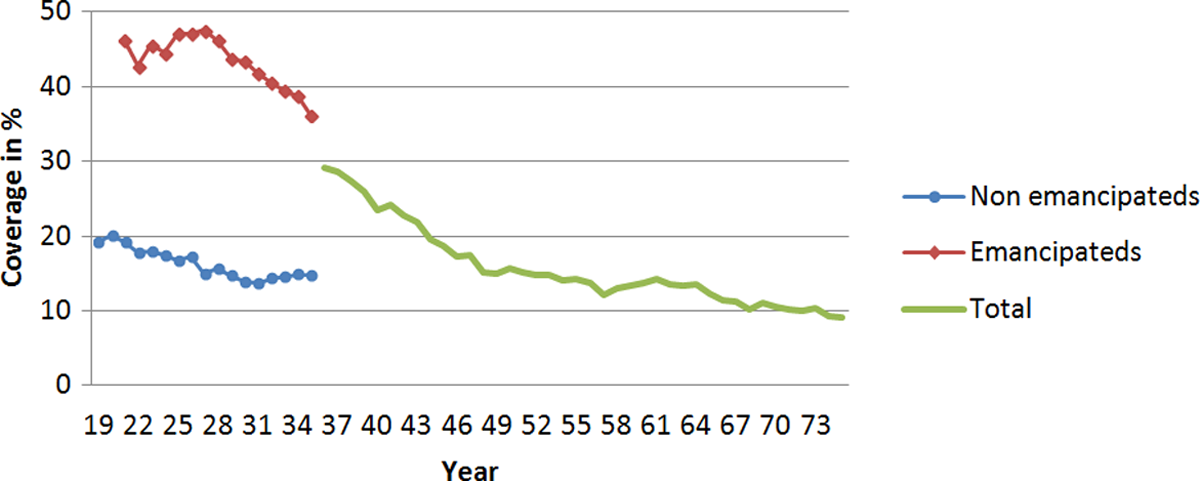
Percentage of people with only cell phone, by age.
A worrying issue in this respect, due to the difficulties posed in correcting it, is the income gap between those with only a cell phone and the rest of the population (Vicente and Reis 2009). In Figure 3, it can be seen, taking into account the age and the state of emancipation, that there are very large differences in the percentages of people who have only a cell phone, depending on personal income. For example, for people living independently and aged between 30 and 44 years, 60 percent of individuals have only a cell phone when their household income is below 900 euros, and this percentage is 10 percent when their income exceeds 2,500 euros.

Percentage of population with only cell phone, by income, age, and emancipation.
In this survey, the IESA decided to carry out telephone interviews with adults using both landlines and cell phones. Taking into account the time and budget available, 2,402 interviews were performed by qualified interviewers, specially trained in survey techniques. The number of interviews to be conducted via landline and via cell phone was determined by calculating the optimum proportion (in the sense of minimum variance) for each type of telephone, taking into account the costs (Pasadas and Trujillo 2013) and the percentage of possession of each type of device (following Hartley 1962). As a result, the sample sizes ascertained were 1,919 for landlines and 483 for cell phones. The interviews were carried out by the Statistics and Surveys sections of IESA from April 22 to May 13, 2013, using Computer Assisted Telephone Interviewing (CATI) data input techniques.
Descriptions of Frames and Sampling Designs
Following Hartley’s (1962) classical notation, two samples are drawn independently from two frames, A and B. Let
Sample sizes of land (A) and cell (B) phones are
At the time of data collection, frame sizes of land (A) and cell (B) phones were
Sample Sizes for the OPIA Survey.

Note: OPIA = opinions and attitudes of the andalusian population regarding immigration. Land and cell in the columns refer to the frame from which the units were chosen, while in the rows, they refer to frame in which the units actually reside.
The land-phone sample was also stratified by provinces in the region of Andalusia, as shown in Table 3.
Stratification in Land-phone Sample.
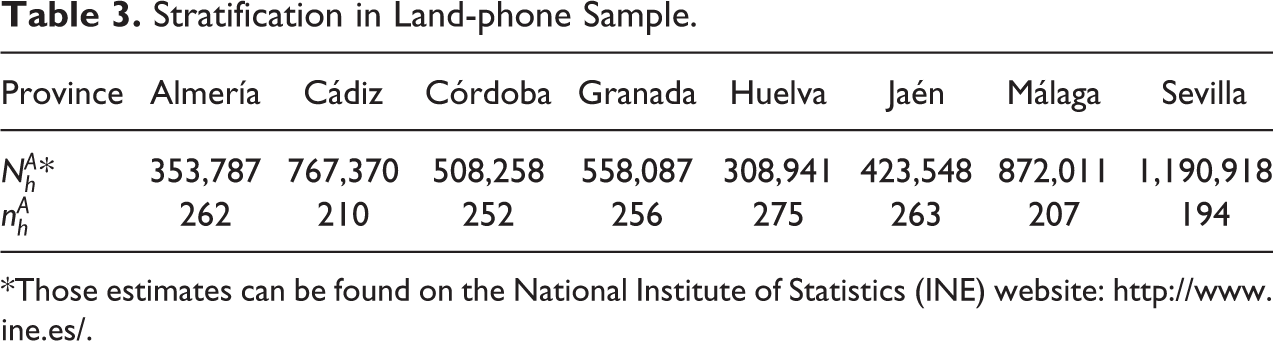
*Those estimates can be found on the National Institute of Statistics (INE) website: http://www.ine.es/.
Cell phone interviews were carried out with no control over the distribution by provinces owing to the difficulty of determining the location of this type of telephone. Hence, more interviews were performed in the most populated provinces than in the less populated ones.
Initial Weighting Adjustments
This section describes the procedures used to create the weights for each sample. The base weights are the ratio of the number of telephone numbers in the frame to the number sampled. The weights were further adjusted to account for people who had multiple chances of being sampled because they had more than one telephone number.
First-order inclusion probabilities were computed from a stratified random design in frame A and modified taking into account the number of fixed lines (
Estimation in Dual-frame Telephone Surveys
We consider the problem of estimating the population proportion
If the population size is known, an estimator
Single-frame Approach
Bankier (1986) and Kalton and Anderson (1986) proposed estimators that treated all the observations as if they had been sampled from a single frame, with adjusted weights in the intersection domain relying on the inclusion probabilities for each frame. In those situations, as in our example, in which we know the inclusion probability of the units in the sample under both sampling designs, the weights are defined as follows for all units in frame A and in frame B:
Note that the units in the overlap domain, which are expected to be selected with a probability
Single-frame estimator (SF)
Kalton and Anderson’s (1986) single-frame estimator is given by: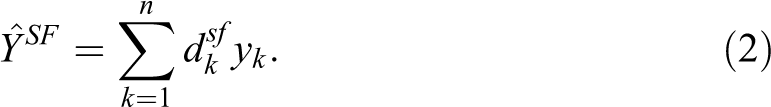
The single-frame weights are the same for all response variables, and so the estimators are internally consistent. For complex surveys, however, single-frame estimators may not be efficient. Skinner (1991) provides a theoretical study of the efficiency of the raking ratio estimator for multiple-frame survey.
For the calculation of an unbiased estimator of the variance of a single-frame (SF) estimator, we adopted the approach proposed by Rao and Skinner (1996)
where
Calibration estimator (CAL)
In the OPIA survey, 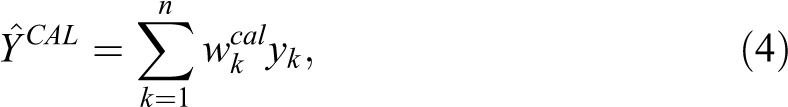
with weights
An estimator of the variance of calibration estimator can be obtained using the residuals of regression of y on
Single-frame raking ratio (SFRR)
The SF estimator does not use any auxiliary information about the population totals 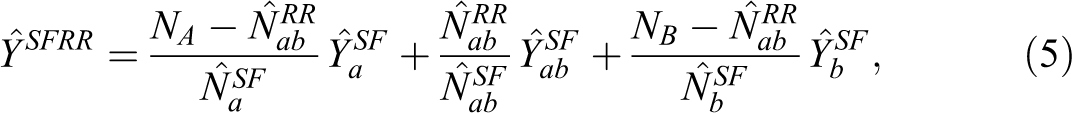
where
If 
with weights
The variance for the single-frame calibration estimator is then determined using the residuals of regression of y on
Dual-frame Approach
In situations in which we do not know the inclusion probability of the units in the sample under both sampling designs, dual-frame methods can be considered. For comparison, these methods are also considered in our example.
We can write
where
Fixed weight adjustment (FWA)
The simplest weight modification to preserve approximate unbiasedness, as described by Hartley (1962), yields
Brick et al. (2006) used 
In order to calculate an estimator of the variance, we have taken into account that samples from frames A and B are drawn independently and that the value for θ is fixed. Thus,
where equation (24) is used to compute the variance estimations.
Hartley (HAR; 1962, 1974) proposed choosing θ in equation (8) so that the variance of 
and the estimator has the form
However, this optimal estimator is a function of the variances and covariances of the estimated domain totals and then the optimal estimates will differ for different response variables. In cases where estimation of 
can be used instead. In our example, using equation (24) to estimate the three variances found in the latter expression of
Fuller and Burmeister (1972) proposed modifying Hartley’s estimator by incorporating additional information regarding estimation of the overlap domain. The resulting estimator is as follows:
where
Pseudo Maximum Likelihood (PML) Skinner and Rao (1996) proposed modifying the maximum likelihood estimator for a simple random sample suggested by Fuller and Burmeister (1972) to obtain a PML estimator for a complex design. The PML estimator, unlike the Hartley and Fuller-Burmeister estimators, is linear in y and is of the form
where
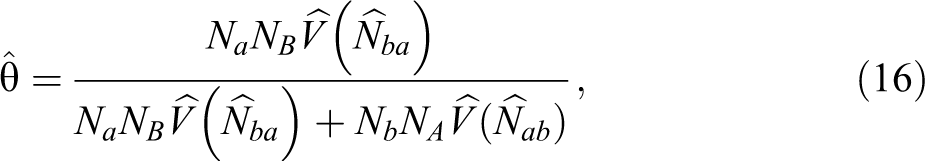
or estimate it as
In practice, the variances in equation (16) are unknown and must be estimated from the data. The PML estimator uses the same set of weights for each response variable and thus avoids some of the difficulties associated with the Hartley and Fuller-Burmeister estimators.
To estimate the variance of the PML estimator, we followed the method proposed by Rao and Skinner (1996), which provides a consistent estimator of variance in the form
where, in this case,
Pseudo Empirical Likelihood (PEL). Recently, Rao and Wu (2010) extended the PEL approach proposed by Wu and Rao (2006) from one-frame surveys to dual-frame surveys following a stratification approach and considering an estimation of the population mean of y,
where
Instead of calculating the explicit variance of the estimator, confidence intervals are obtained using the bisection method described by Wu (2005). This method constructs intervals in the form
Jackknife Variance Estimation
We also use jackknife estimation to determine the variance of the estimators compared (Wolter 2007). The variance estimators presented in the third section can be computed in many different ways, depending on the specific estimator. Moreover, in small samples, they may poorly estimate the variability of estimators because they estimate the asymptotic variance rather than the exact variance. Instead, the jackknife approach is a common method for variance estimation that can be used whatever the estimator. Thus, estimated variances obtained through this method can be used to compare the efficiencies of the estimators. For the sake of brevity, in this section dual or SF estimators are denoted by
In the case of a stratified design, as in frame A, let frame A be divided into H strata and let stratum h have 
where
If we consider a nonstratified design, as in frame B, the jackknife estimator for the variance of 
where
For any estimator
Results for the OPIA Survey
To examine the performance of the dual-frame estimation methods in practice, we applied them to the dataset from the OPIA survey.
Three main variables are included in this study, related to “goodness of immigration,” “amount of immigration,” and “confidence in immigration.” The variables are the answers to the following questions: And in relation to the number of immigrants currently living in Andalusia, do you think there are … ? Too many, A reasonable number, Too few In general, do you think that for Andalusia, immigration is … ? Very bad, Bad, Neither good nor bad, Good, Very good In general, how much confidence do you have in immigrants? None at all, Very little, It depends, Quite a lot, Very much.
Each category of each variable is treated separately as an attribute, so that for any of the attributes of interest, 
respectively, and similarly for the other estimators. For the FB estimator, the matrix to solve the minimum variance is singular in estimating the population size N and this estimator is not included.
The weights 
As Särndal (2007) says, the calibration gives a unique weighting system, one that is perfectly clear and transparent and applicable to all study variables.
In the dual-frame approach, there is no single
All dual-frame estimators have one thing in common: the weighting of the estimations for the overlap domain, either with 1/2 or with one of estimations of θ in equation (11), (13), or (16). In SF estimators, the weighting is given by probabilities under both sampling designs.
All the estimators considered in this article require estimates of the domain sizes
In a similar way, we denote the Horvitz–Thompson estimator of any y variable in domain a as
The variances in Table 4 are computed using Deville’s (1993) method to avoid second-order probabilities (although in this case it is possible to easily compute them). This method yields, given a y variable whose population total Y is estimated using the Horvitz–Thompson estimator based on a sample s, 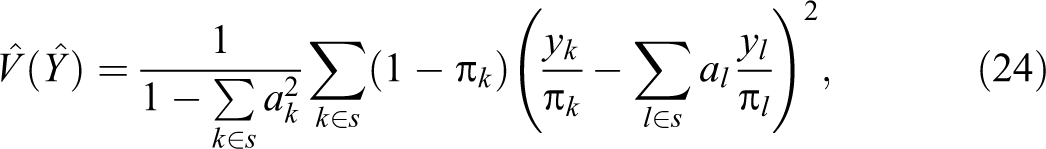
Estimates of Domain Sizes and Coefficients of Variation.
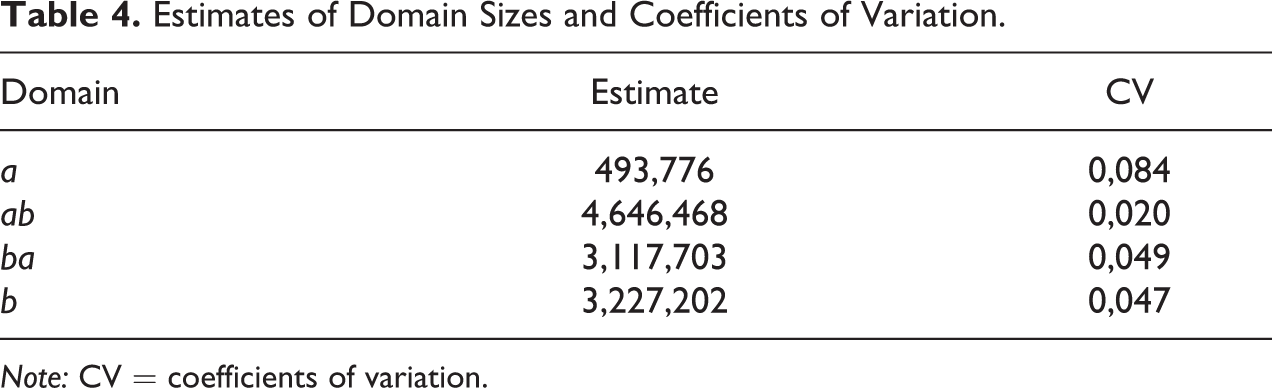
Note: CV = coefficients of variation.
where
Tables 5 –7 show the point and 95 percent confidence level estimation of proportions of the main variables. Two different sets of confidence intervals are calculated: one, based on the jackknife variance estimation described in the fourth section and the other, based on the variance estimations described in the third section. Other tables could be obtained if finite population correction factors were used in jackknife variance estimation, but they are not included here because the results would be very similar.
Point and 95 Percent Confidence Level Estimation of Proportions Using Several Methods for Variance Estimation.
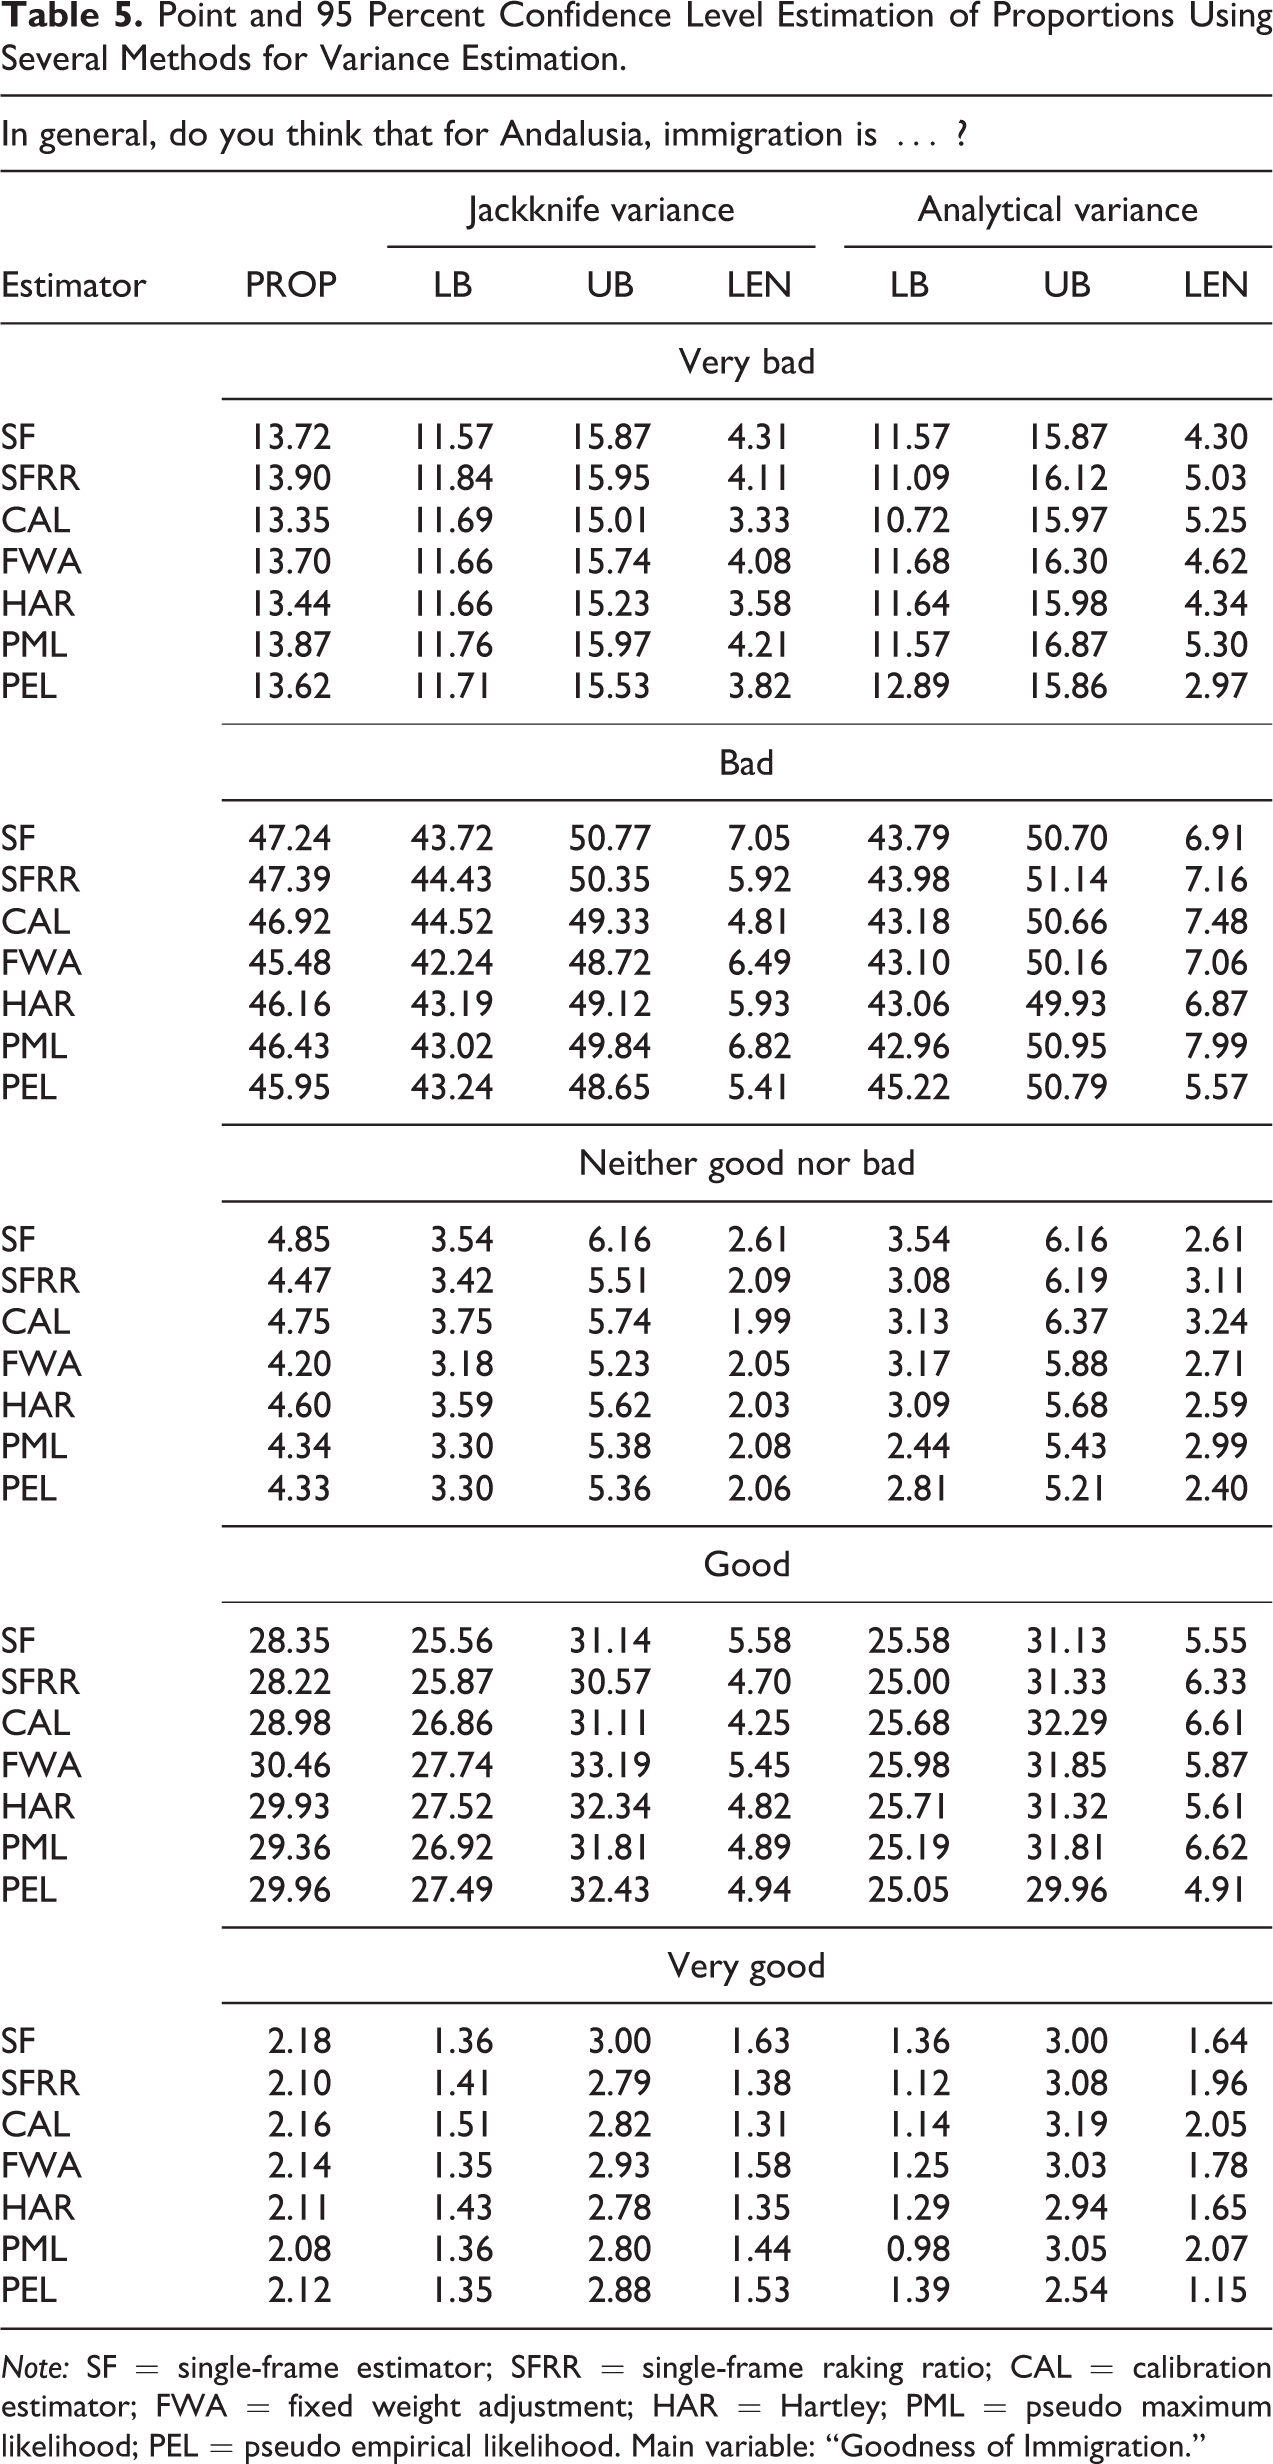
Note: SF = single-frame estimator; SFRR = single-frame raking ratio; CAL = calibration estimator; FWA = fixed weight adjustment; HAR = Hartley; PML = pseudo maximum likelihood; PEL = pseudo empirical likelihood. Main variable: “Goodness of Immigration.”
Point and 95 Percent Confidence Level Estimation of Proportions Using Several Methods for Variance Estimation.

Note: SF = single-frame estimator; SFRR = single-frame raking ratio; CAL = calibration estimator; FWA = fixed weight adjustment; HAR = Hartley; PML = pseudo maximum likelihood; PEL = pseudo empirical likelihood. Main variable: “Amount of Immigration.”
Point and 95 Percent Confidence Level Estimation of Proportions Using Several Methods for Variance Estimation.
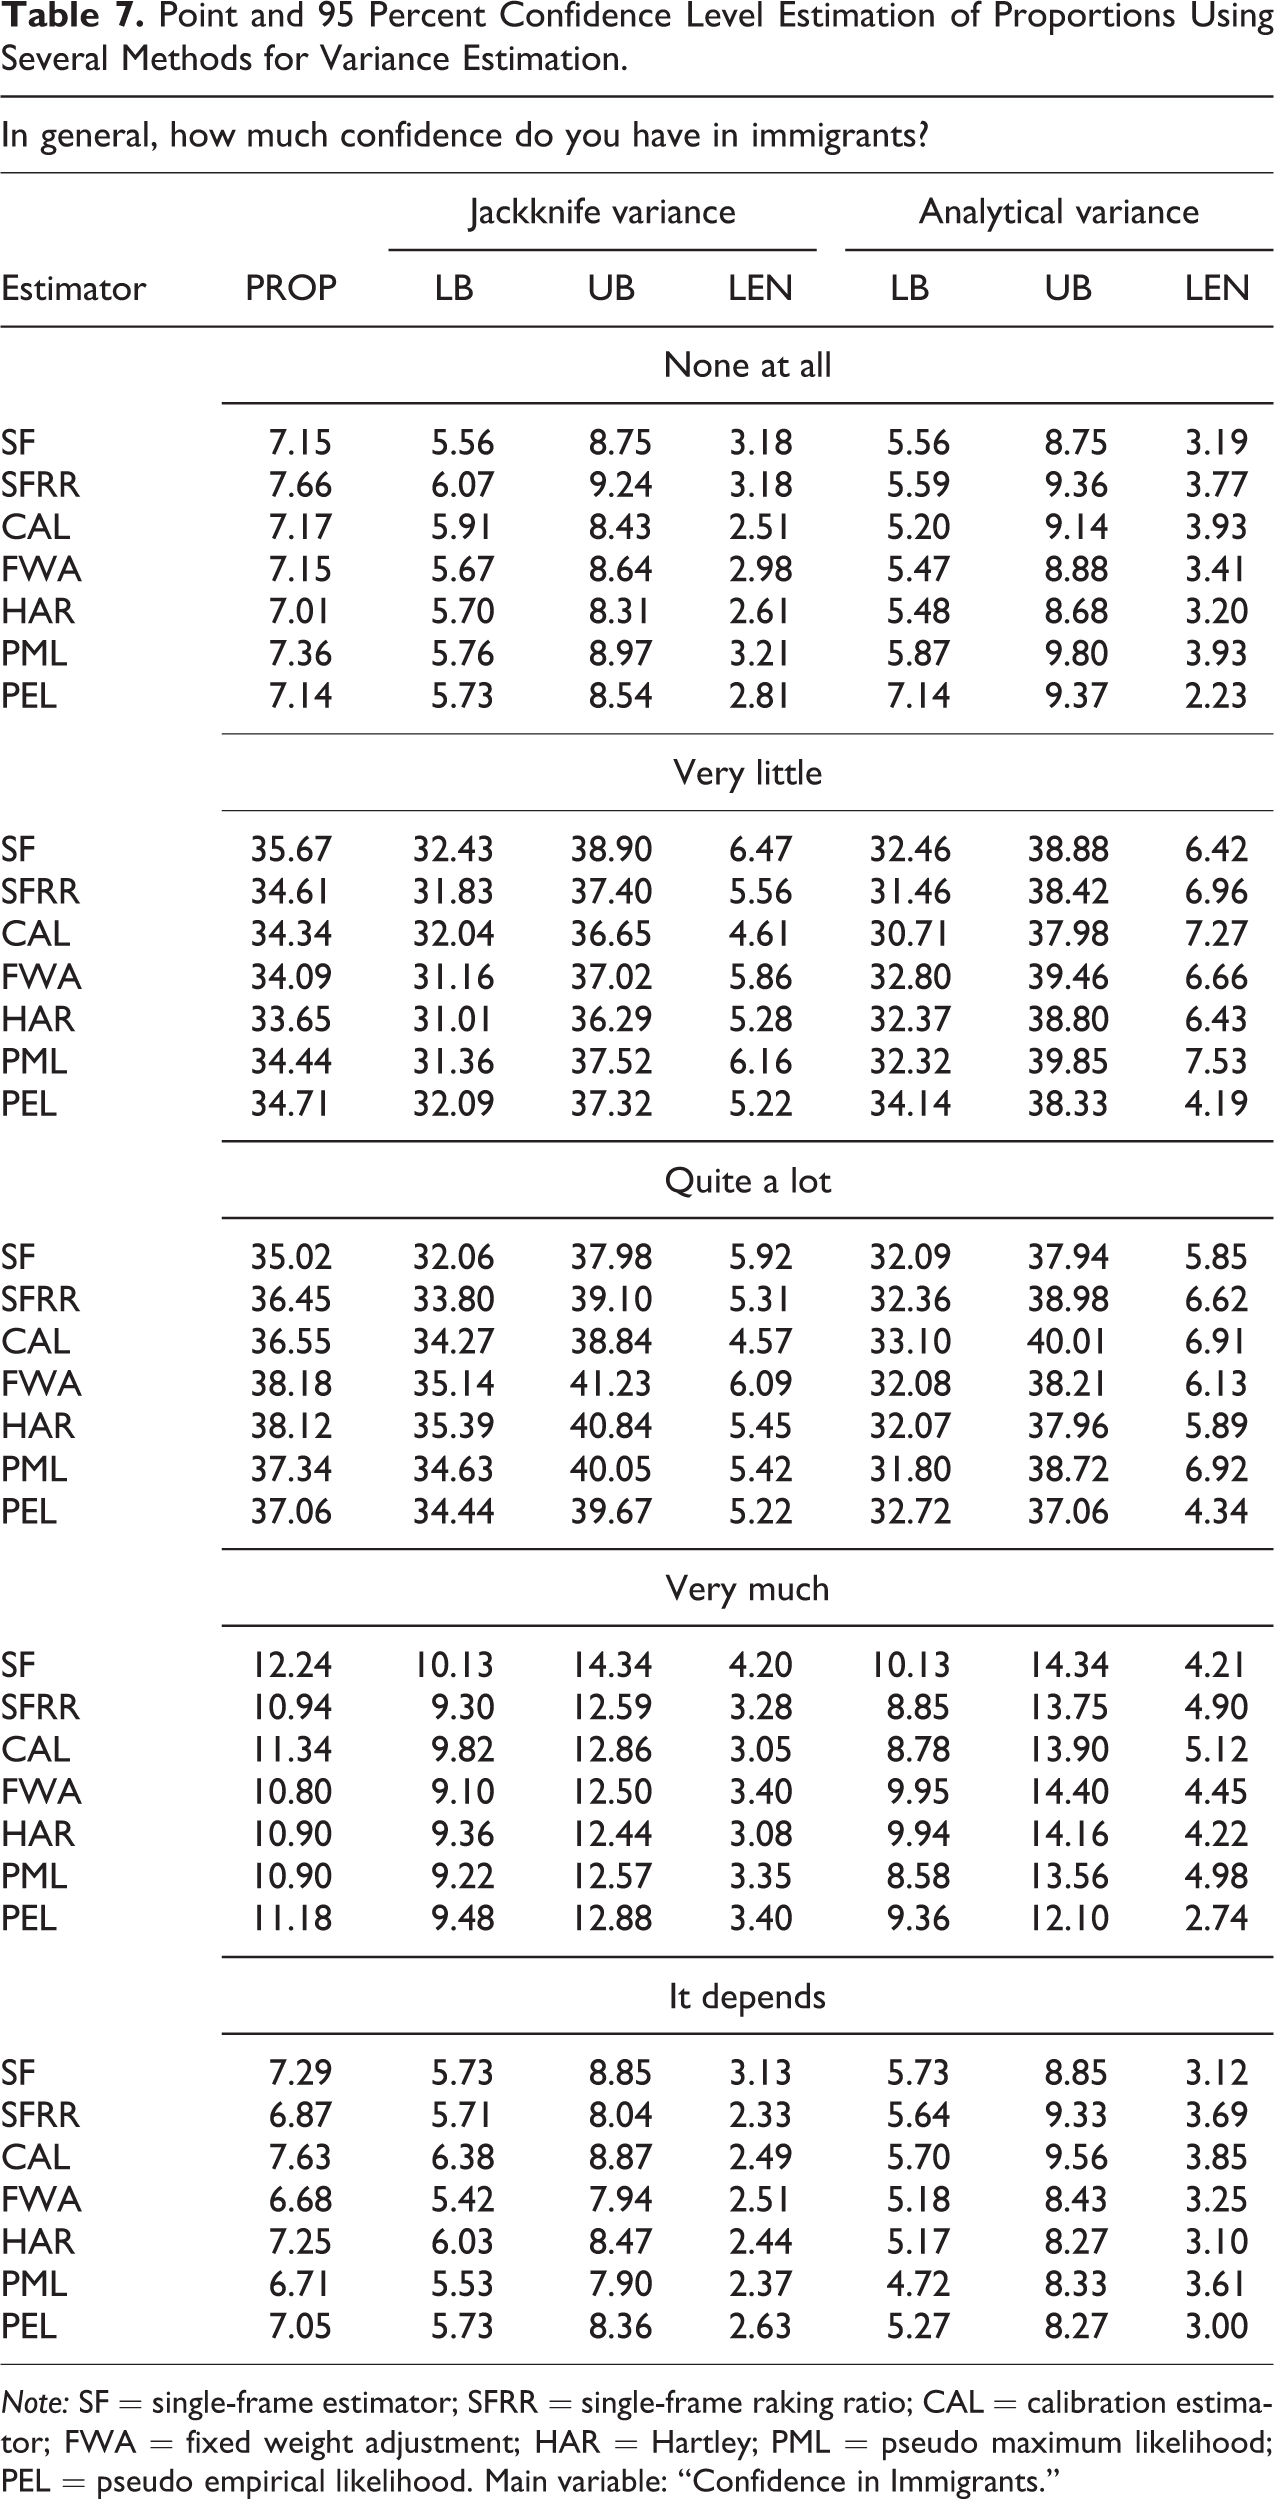
Note: SF = single-frame estimator; SFRR = single-frame raking ratio; CAL = calibration estimator; FWA = fixed weight adjustment; HAR = Hartley; PML = pseudo maximum likelihood; PEL = pseudo empirical likelihood. Main variable: “Confidence in Immigrants.”
For the outcomes shown in Tables 5–7, we obtained the following findings: There are no important differences between the estimates produced with the single- or dual-frame approach. Among all the estimation strategies, the calibration method performs best and produces the smallest confidence interval. Calibration estimation can be implemented easily using existing software for SF populations. There are several R packages for obtaining estimations using the calibration technique, as the Sampling package. The jackknife method often produces better intervals than methods based on the estimated variance given by the authors (except for the PEL intervals)
At the time of data collection, the frame sizes for land phones (A) and cell phones (B) were
Frame Sizes.
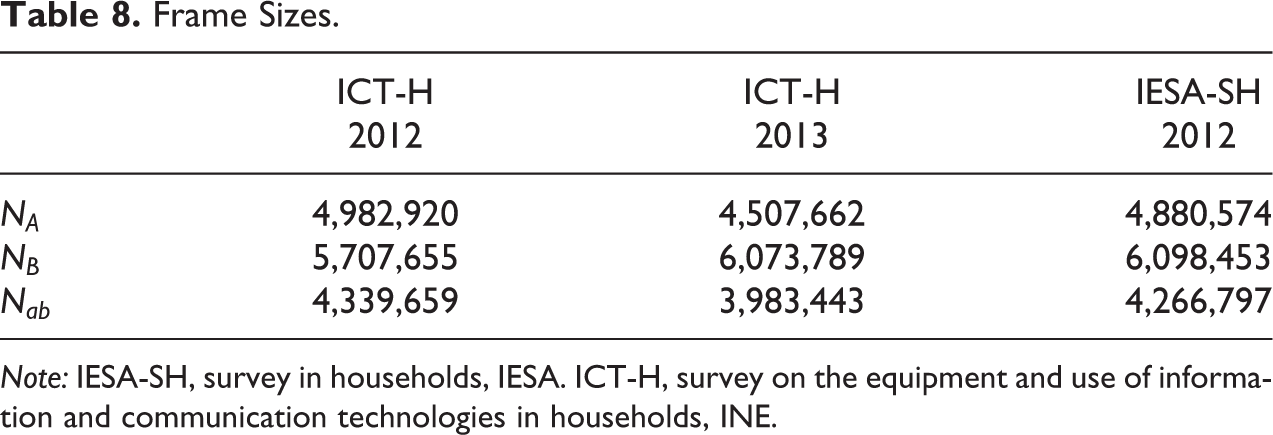
Note: IESA-SH, survey in households, IESA. ICT-H, survey on the equipment and use of information and communication technologies in households, INE.
Average (AVG) and Coefficient of Variation (CV) of Four Point Estimations.

Note: SF = single-frame estimator; SFRR = single-frame raking ratio; CAL = calibration estimator; FWA = fixed weight adjustment; HAR = Hartley; PML = pseudo maximum likelihood; PEL = pseudo empirical likelihood. Main variable: “Goodness of Immigration.”
Average (AVG) and Coefficient of Variation (CV) of Four Point Estimations.

Note: SF = single-frame estimator; SFRR = single-frame raking ratio; CAL = calibration estimator; FWA = fixed weight adjustment; HAR = Hartley; PML = pseudo maximum likelihood; PEL = pseudo empirical likelihood. Main variables: “Amount Immigration,” “Confidence in Immigrants.”
The estimates obtained by each method, using different values of frame sizes obtained from three sources, are, in general, similar. It is concluded that the estimators are only slightly influenced by the source used to estimate the population sizes for landline and cell phones.
Conclusion
This article addresses some of the issues involved in using dual-frame methods for landline and cell phone surveys. Multiple-frame surveys are very useful when it is not possible to guarantee complete coverage of the target population and may result in considerable cost savings in comparison with an SF design with comparable precision. However, this technique is not often applied by national statistical agencies or by private survey agencies due to its complexity and the difficulties inherent in analyzing multiple-frame surveys with standard survey software.
Several estimators have been proposed and the first question to be considered is how to choose the most suitable one for this application.
Calibration, fixed weight, PML, and SF estimators all give internal consistency, since the same set of adjusted weights is used for all variables. In our application, good results were obtained with these procedures. We recommend that an internally consistent estimator be used. With repeated surveys, the simplicity and transparency of a fixed-weight estimator may be preferred. Fixed-weight adjustments may make year-to-year comparisons easier in an annual survey, where the domain proportions are relatively constant over time. Fixed-weight estimators are also more amenable to weight adjustments for nonresponse and domain misclassification. Standard survey software may then be used to estimate population proportions and totals using the modified weights.
On the other hand, variance estimation is more complicated when dual-frame estimators are used. Resampling methods such as jackknife estimation may then be used to estimate variances. Jackknife intervals are easy to compute and give accurate intervals.
The dual-frame estimates obtained from the variables considered in this study suggest that the use of different values for frame and overlap domain sizes extracted from different sources had no substantial impact on the level of efficiency obtained.
In this study, the use of auxiliary variables was not considered for estimating the study variables. The use of demographic variables such as age, income, or emancipation in the calibration and PEL methods can improve the estimates, because these variables can have a considerable impact on the distribution of landlines and cell phones.
We also highlight the need to implement these methods in both commercial and noncommercial software for survey estimation. In this respect, we are now working on an R package for point and interval estimation for a two-frame estimator.
Finally, let us note that the results obtained in applying these methods in the OPIA survey indicate that negative views toward immigration continue to spread and that currently 59 to 61 percent of those surveyed in Andalusia state that immigration is bad or very bad for the region (in the previous edition of the study, in 2011, the corresponding figure was 58 percent, and in the first such survey, in 2005, it was only 51 percent). Perceptions regarding the number of immigrants, however, have changed in the opposite direction: There is now a lower percentage of people who say there are too many immigrants (from 51 percent in 2011 to current levels of 40–42 percent), while the other scores have risen slightly.
Footnotes
Declaration of Conflicting Interests
The author(s) declared no potential conflicts of interest with respect to the research, authorship, and/or publication of this article.
Funding
The author(s) disclosed receipt of the following financial support for the research, authorship, and/or publication of this article: This study was partially supported by Ministerio de Educación y Ciencia (grant MTM2012-35650, Spain) and by Consejería de Economía, Innovación, Ciencia y Empleo (grants SEJ2954 and HUM1413 Junta de Andalucía).