
Abstract
To measure what determines people’s attitudes, definitions, or decisions, surveys increasingly ask respondents to judge vignettes. A vignette typically describes a hypothetical situation or object as having various attributes (dimensions). In factorial surveys, the values (levels) of dimensions are experimentally varied, so that their impact on respondents’ judgments can be estimated. Drawing on the literature in cognitive psychology and survey methodology, we examine two research questions: Does the order in which dimensions are presented impact the vignette evaluations and change substantive conclusions? Under which conditions are order effects mostly likely to occur? Using data from a web survey of 300 students, we analyze several possible moderators: features of the vignette design, characteristics of respondents, and interactions between these features. Results show that strong order effects can occur, but only when the vignettes are of a minimum complexity or respondents show a low attitude certainty.
Introduction
The factorial survey method is well established in the social sciences as a method of assessing respondents’ beliefs about the world, judgment principles, or decision rules (see Wallander 2009, for a review of applications). Instead of single-item questions, respondents are confronted with multidimensional stimuli (vignettes) that resemble real-life judgments or decision-making situations. Within these vignettes, some attributes (dimensions) are experimentally varied in their values (levels). This experimental variation allows the researchers to assess the exact impact of each of the dimensions on the evaluation task (Alexander and Becker 1978; Jasso 2006a; Rossi and Anderson 1982). In this article, we examine whether the order in which dimensions are presented to the respondent has any effect on the evaluations and test hypotheses about the moderators of order effects.
Factorial surveys are used increasingly in academic and nonacademic research, including the social sciences, law studies, and consumer research. Classical applications consist of the evaluation of fairness of income (Alves and Rossi 1978; Hermkens and Boerman 1989; Jasso and Rossi 1977; Jasso and Webster 1997, 1999; Shepelak and Alwin 1986), the criteria for welfare payments and fair tax rates (Liebig and Mau 2002, 2005), and the rating of social status of households (Meudell 1982; Nock 1982; Rossi 1979; Rossi et al. 1974). In addition, factorial surveys have been used to reveal respondents’ definitions of sexual harassment (Garret 1982; O’Toole et al. 1999), appropriate sentences for criminals (Berk and Rossi 1977; Hembroff 1987; Miller, Rossi, and Simpson 1986), criteria for the desirability of immigrants (Jasso 1988), and for deserving medical treatment (Hechter et al. 1999). Further applications are decision rules of professionals like teachers or nurses (Ludwick et al. 2004; O’Toole et al. 1999), the preconditions for social norms (Diefenbach and Opp 2007; Jasso and Opp 1997), trust (Buskens and Weesie 2000), or discriminating behavior (John and Bates 1990), or even possibilities of overcoming social dilemmas (Abraham, Auspurg, and Hinz 2010). Similar multifactorial survey experiments that are known as conjoint analyses and choice experiments are used in economics to measure consumer preferences or willingness to pay for (non-tradable) goods like recreation areas or medical care (Amaya-Amaya, Gerard, and Ryan 2008; Louviere, Hensher, and Swait 2000).
Although factorial surveys are frequently used, there is only little research on methodological issues. Issues that have been studied include the effects of complexity (i.e., the number of vignettes and dimensions) on the consistency of responses, learning, and fatigue effects (Sauer et al. 2011; Sauer et al. 2014); the effects of illogical combinations of vignette dimensions (Auspurg, Hinz, and Liebig 2009); the impact of the range of levels of dimensions (Jasso 2006b) and of different response scales (Jasso 2012; Markovsky and Eriksson 2012); and strategies for sampling vignettes (Dülmer 2007; Steiner and Atzmüller 2006). The effects of the order in which respondents evaluate vignettes have been demonstrated and are sometimes addressed by first giving the respondents some base vignettes that are the same for all respondents (Garret 1982; O’Toole et al. 1999) or by randomizing the order in which vignettes are presented (Rossi and Anderson 1982). The order in which dimensions are used within vignettes has to our knowledge not received any attention.
Survey researchers have documented various types of order effects for decades (Schuman 1992; Tourangeau 1999; Tourangeau, Singer, and Presser 2003). The task of evaluating vignettes in a factorial survey is however different from the task of answering standard survey items, and so it is not a priori clear how the findings on order effects from the survey methods literature apply. First, items in a survey may be sensitive to the context set by preceding questions, while response categories may be prone to primacy or recency effects. In a factorial survey, both effects may occur. Respondents have to integrate a lot of information into a single response scale, which may lead to primacy or recency effects caused by the order in which dimensions are presented. At the same time, the ordering of dimensions might cause context effects—dimensions appearing later in the vignette might be interpreted in the light of prior ones. Second, to answer a categorical question respondents have to choose a response category, or all categories that apply. In a factorial survey, respondents have to translate all information presented in the vignette into a value on the response scale and think about possible trade-offs and interactions between characteristics. Third, vignettes are more complex and consist of more text than standard survey items. Based on the findings from the survey methods literature, it is to be expected that the order in which dimensions are presented in factorial surveys may affect evaluations. It is however not a priori clear to what extent order effects exist, under which conditions they are most likely, and what the implications for the design of factorial surveys are. We address two main research problems. First, we examine whether the order of vignette dimensions matters for the results obtained from factorial survey designs: Does the order of dimensions impact on the absolute effect sizes, and therefore on the statistical significance of the effects of vignette dimensions on evaluations? If this were the case, hypothesis testing, which is one of the main aims of factorial survey design, would be compromised. Does the order of dimensions have any effect on the relative importance of vignette dimensions? Several applications use the factorial survey to rank the importance of dimensions (see, e.g., Hermkens and Boerman 1989; Miller et al. 1986). The relative importance affects the calculation of trade-offs between dimensions, and of common estimates such as just gender pay gaps (JGPGs) or willingness to pay. What are the practical implications of order effects—are they strong enough to change substantive conclusions? Second, we examine under which conditions dimension order effects are mostly likely to occur. Drawing on the literature in cognitive psychology and survey methodology, we assume that order effects are most likely when the vignettes are very complex, when respondents have lower cognitive ability, have less knowledge of the topic, and are less certain in their attitudes. In addition, we examine the possible impact of dimension importance in moderating order effects. In the remainder text, we refer to effects of the order of dimensions as “order effects;” whenever we discuss the effects of vignette order, we explicitly label them as “vignette order effects.”
Theoretical Background and State of Research
Order effects can be defined as changes in answers to survey questions that are produced by varying the order in which questions or response options are presented (Krosnick and Alwin 1987:202). A large number of survey experiments have demonstrated the existence of order effects. Yet order effects are not easy to predict and there is still no general explanation for their occurrence. In the following, we summarize the main theoretical assumptions and empirical findings from cognitive psychology and survey research, from methodological research on factorial survey designs, and from research on other related experimental survey methods (conjoint analyses and choice experiments).
Order Effects in Cognitive Psychology and Survey Research
Several potential mechanisms have been identified that could trigger the occurrence of order effects: limitations of cognitive memory, context effects, and satisficing behavior. The research has further identified potential moderator variables that may strengthen or dampen order effects. Empirical evidence testing these hypotheses is however mixed.
Mechanisms leading to order effects
Limitations of cognitive memory were first theorized to cause order effects: Items presented early in a list are more likely to enter long-term memory, while items presented at the end are more likely to enter short-term memory. Therefore, items presented at the beginning or end of the long lists are more likely to be recalled than items in the middle (see Krosnick 1992:205). Theories on the functioning of our working memory further suggest that when questions are read out to respondents, recency effects are most likely, meaning that respondents are more likely to select items listed last. In contrast, when questions are presented visually primacy effects are most likely, meaning that respondents are more likely to select items listed first (Krosnick and Alwin 1987; Schwarz, Hippler, and Noelle-Neumann 1992). Applied to factorial surveys, where vignettes are typically presented visually, limitations of cognitive memory could mean that respondents attach more importance to a dimension if it is placed at the beginning of the vignette text.
Order effects may also be caused by the context set by preceding questions. Priming effects occur when information presented earlier establishes a cognitive framework or reference point that guides the interpretation of later information. Preceding survey context can prime schemata—sets of closely related arguments—that lead to different interpretations of later items (Bradburn 1992:319). The context also determines what information the respondent has in mind when evaluating a survey question (Sudman, Bradburn, and Schwarz 1996; Tourangeau et al. 2003). Applied to vignette evaluations, context effects could mean that respondents may interpret a dimension differently, depending on the order in which they read—and cognitively process—the dimensions.
Satisficing behavior is a further potential explanation for order effects. Based on Simon’s (1957) principle of satisficing, Krosnick (1991, 1992) theorized that respondents do not necessarily make sufficient effort to answer survey questions optimally, but in some circumstances shortcut the response process to provide satisfactory answers requiring least effort. This means that information presented in more visible positions, such as the first or last, might be subject to deeper cognitive processing than information presented in the middle part of vignettes and therefore have more impact on evaluations. Applied to factorial survey designs, satisficing means that respondents might sometimes base their evaluations on only few—and possibly only the first or last—dimensions, and not take account of further dimensions.
Moderators of order effects
Respondents’ cognitive ability is relevant to all three potential mechanisms through which order effects can occur. Satisficing is more likely for respondents with low cognitive ability or low educational background, presumably because the response task is more burdensome for them (Holbrook, Green, and Krosnick 2003; Narayan and Krosnick 1996). Memory limitations increase with age and as a result primacy and recency effects are stronger with older respondents (Schwarz and Knäuper 2000). However, low educational background or older age do not always increase the likelihood of order effects (see, e.g., Holbrook et al. 2007; McClendon 1991). Respondents with more limited memory capacity may store less contextual information in their working memory. As a result, evaluations made by older respondents may be less affected by the order of questions (Knäuper et al. 2007).
Respondent motivation and fatigue is a further relevant moderator. In long questionnaires, order effects have been found to be more pronounced for questions placed late in the questionnaire (Holbrook et al. 2007).
The difficulty of the response task is a further important moderator of order effects. The risk of satisficing is generally hypothesized to be the higher, the more complex, and therefore burdensome, the response task is (Schwarz et al. 1992:189). Previous studies have shown that order effects are more pronounced in questions including more sentences, words, or letters (Bishop and Smith 2001; Holbrook et al. 2007; Payne 1949; Schuman and Presser 1981).
How important the respondent finds a particular piece of information may also determine whether order effects occur (Krosnick 1988). Questions that are important to the respondent may be less prone to order effects, since the relevant information for answering the question is likely to be more easily accessible in memory (reflected in shorter processing times; see Krosnick 1989).
The certainty of respondents’ attitudes on the topic of evaluation might be a further determinant of order effects (Schwarz 2007; Tourangeau and Rasinski 1988). Strong and previously formed attitudes should in general be more resistant to context influences than attitudes that are formed on the spot (Lavine et al. 1998:359). Indifferent respondents, or those with weak and uncertain attitudes and judgment rules, are more likely to draw on context information that is momentarily salient or accessible and are therefore probably more sensitive to order effects (Hippler and Schwarz 1986; Lavine et al. 1998). The overall evidence so far is, however, mixed (Lavine et al. 1998). There is also so far no consensus in the literature on how concepts like attitude strength, importance, and attitude certainty are related to each other and which of these concepts is most important in triggering order effects (Krosnick and Petty 1995:11). Tourangeau et al. (1989a, 1989b) however showed that question order effects were more likely with respondents who show a high ambivalence in their attitudes, suggesting that attitude certainty is an important moderator.
The respondent’s knowledge on and familiarity with the substantive issue is a further potential moderator of order effects (Bradburn 1992:321; McClendon 1991; Tourangeau, Rips, and Rasinski 2000). Experts on a topic should need less cognitive effort and might find thinking about the issue more interesting and as a result be influenced less by context information than novices (see findings by Bickart 1992; Smith 1992).
To conclude, there are no straightforward predictions and explanations of order effects and so far, no single theory can predict their occurrence (McClendon 1991). Although each of the moderator variables referred to are related to mechanisms that could plausibly cause order effects, the empirical evidence so far is mixed (see, e.g., Schuman 1992; Schwarz 2007; Smith 1992; Tourangeau 1999, for other reviews). One reason for the stagnation might be that it is necessary to specify more precisely the underlying cognitive mechanisms (memory problems vs. context effects vs. satisficing). Another explanation could be that some of the mechanisms interact with each other or some moderator variables define necessary preconditions for order effects. For example, respondents’ cognitive ability might matter only for very complex evaluations tasks. There have been few attempts to test competing mechanisms or to specify the concrete conditions for order effects. A further reason may be that studies testing for order effects have mostly employed data from very heterogeneous respondent samples. With heterogeneous samples, sociodemographic characteristics such as age and education can be used as proxies for cognitive ability. The sociodemographic characteristics might however also be indicative of other constructs such as selection criteria for educational tracking (Krosnick 1989:206). Even more problematic, age cohorts and educational levels are certainly related to respondents’ opinions and attitudes. Thus, it is difficult to disentangle the “true” opinions and attitudes the researcher is interested in and methodological effects that might invalidate their measurement. The strong interrelatedness of sociodemographics with both attitudes and moderator variables involved in the causation of order effects might explain why existing research has so far failed to detect clear causal patterns.
Methodological Research on the Design of Factorial Surveys
How the order of dimensions affects results in factorial survey designs has, to our knowledge, not been examined. Previous studies have however examined how the complexity of vignettes affects responses, learning, and fatigue effects. These previous studies are relevant to our research in that they provide a useful background for studying conditions under which order effects are more or less likely to occur in factorial survey designs.
Sauer et al. (2011) and Auspurg et al. (2009) experimentally varied the number of dimensions used per vignette and, in some cases, additionally varied the number of vignettes presented to each respondent. The results suggested that vignettes consisting of about 8 dimensions were in general well manageable, while vignettes consisting of 12 dimensions produced signs of inconsistent evaluations, especially for respondents with lower education. Learning effects were apparent in the first 10 vignettes: Respondents evaluated the vignettes in an increasingly consistent way and with increasing speed. Fatigue or boredom effects became apparent after the 10th vignette: In particular, older respondents (>60 years) gave less consistent responses than younger respondents. Learning and fatigue effects were more pronounced with very complex vignettes, consisting of 12 rather than 8 or 5 dimensions. Response heuristics were also found in factorial survey analyses: when evaluating the first vignettes, respondents seemed to take account of a large number of dimensions and when evaluating later vignettes, respondents seemed to concentrate on a restricted number of more salient dimensions and to ignore less salient ones (Sauer et al. 2014).
Given the strong evidence of order effects in both general survey research and other experimental survey methods (see below), the lack of research on order effects in factorial surveys is astonishing. One reason why the order of dimensions has not received any attention may be the practice of designing vignettes as running text. In designing text vignettes, researchers aim to place and combine dimensions such that the flow of the text is as natural and smooth as possible. Some dimensions, like the gender of vignette persons or their earnings, may fit more logically at the beginning or end of a text vignette than somewhere between other dimensions. This implies that rotating the order of vignette dimensions, which could be a way of mitigating order effects, conflicts with the aim of designing smooth vignette texts. This also implies that the optimal order of dimensions in vignette texts may differ across languages, if languages have a different logic of ordering words and phrases within sentences and paragraphs. If the order of dimensions does impact evaluations, this could affect the validity of international comparisons. An alternative to text vignettes is presenting the vignette dimensions in tabular form. Vignette dimensions can easily be rotated in a tabular format, and the order is no longer specific to the syntax of a language. Tabular and text vignettes have so far not been contrasted empirically. Our own initial analyses of an experiment related to this study suggest that tabular vignettes produce similar evaluations to text vignettes, when vignettes are not overly complex (consisting of 8 dimensions).
Order Effects in Conjoint Analysis and Choice Experiments
Even though order effects have not received any attention for factorial surveys, order effects have been studied in other related experimental survey methods. Conjoint analysis and choice experiments resemble factorial survey designs in that respondents are asked to evaluate several short descriptions of objects or situations, consisting of dimensions that vary in their levels. The main difference between the three experimental methods is the nature of the response task: In conjoint analyses, respondents are typically asked to rank different alternatives (profile cards); with choice experiments, respondents have to choose one out of several alternatives that are jointly presented in a choice set; and in factorial surveys, the respondents are typically asked to evaluate each example case (vignette) sequentially on a rating scale. Conjoint analyses are primarily used in marketing research to assess the utility of product features and willingness to pay for these (Carrol and Green 1995; Orme 2006). Choice experiments are mainly used in transportation research, health, and environmental economics to assess the willingness to pay for public goods and objects not (yet) traded in markets (Bennett and Blamey 2001; Louviere et al. 2000; Ryan, Gerard, and Amaya-Amaya 2008).
Research on the effects of dimension order in conjoint analysis and choice experiments may be informative for factorial surveys, even if the methods differ in the nature of the response answer tasks, fields of application, research aims, and statistical methods used for data analyses. The evidence on whether dimension order matters is however mixed. For both methods, there are studies that have found no effects (for choice experiments: Borghans, Romans, and Sauermann 2010; Farrar and Ryan 1999; Olsen et al. 2005; for conjoint analyses: Orme, Alpert, and Christensen 1997), and studies that have found order effects that were often large enough to considerably change the relative impact of single dimensions and to alter the estimated monetary values of dimensions (e.g., for conjoint analysis: Johnson 1989; Perrey 1996; for choice experiments: Chrzan 1994; Scott and Vick 1999). The pattern of order effects corresponded in part to primacy and recency effects (i.e., higher importance of dimensions when placed in the first or last position compared to middle positions; e.g., Glenk 2006; Kjaer et al. 2006; Perrey 1996; Scott and Vick 1999). The results of some studies did however not conform to any expected pattern (e.g., Chrzan 1994).
Some studies have examined the conditions under which order effects are more likely. Familiarity with the object was a strong moderator in a conjoint analysis study by Kumar and Gaeth (1991): Order effects only occurred when respondents evaluated unfamiliar products. Two studies reported by Glenk (2006, 2007) examined the role of respondents’ educational background, understanding of the response task, and dimension importance in moderating order effects in choice experiments. Surprisingly, order effects were stronger for respondents with higher levels of education, but also for respondents with lower choice task-specific capability (measured by a five-point self-evaluation rating of how well the respondent had understood the choice task). Respondents for whom the income dimension was likely to be more important (i.e., respondents with low income) also exhibited more pronounced order effects. Glenk (2007) nevertheless concluded that he was “not able to explain in detail why the ordering effects […] may have occurred” (P. 25) and stressed the need for further research. A study by Kjaer et al. (2006) focused on the repeated evaluation of very similar stimuli by respondents in choice experiments. According to the theory of satisficing, respondents are likely to evaluate the choice sets using “rules of thumb” or response heuristics, instead of optimizing their decision rules. For instance, they might employ dominant decisions (also known as “lexicographic” or “non-compensatory” decision making) and solely pay attention to the most important dimensions, considering further dimensions only to differentiate if two choice options have similar utility. While the authors found a recency effect (the price dimension had more impact on evaluations when placed last than first), they did not detect any relationship between the order effect and the use of dominant decision rules. The authors however questioned the generalizability of their results, due to the prominent role of the monetary dimension in choice evaluations.
In sum, the studies on conjoint analyses and choice experiments also suggest that the occurrence and magnitude of order effects may be caused by different mechanisms and depend on moderator variables. There are also possible interactions of order effects with response heuristics. More systematic research attempting to deepen the theoretical and empirical knowledge about the mechanisms causing order effects in conjoint analysis and choice experiments is however lacking. Most applications and methodological guidelines seem to accept the fact that order effects occur and only attempt to neutralize them by randomizing the order of dimensions.
Hypotheses
Theory and empirical research suggest the existence of order effects. Cognitive psychology and empirical evidence predict that primacy or recency effects might occur. Hence, we derive the following two main hypotheses:
We further examine under which conditions order effects are more or less likely to occur. The practical implications differ, depending on whether the magnitude of order effects mainly depends on questionnaire design or respondent characteristics. Therefore, we organize our analyses into hypotheses that are primarily related to the design of the factorial survey, hypotheses related to respondent characteristics, and hypotheses about how different moderator variables might interact to produce order effects.
Impact of the Complexity of Factorial Survey Modules
Theory and empirical findings suggest that order effects may be caused by some combination of memory limitations and respondent satisficing, both of which are more likely the more complex an evaluation task is. Methodological research on factorial surveys has shown that respondents are able to evaluate vignettes with 8 dimensions consistently. When the number of dimensions is increased to 12, there are signs of cognitive overburdening. Therefore, we expect the following hypothesis:
Vignettes consisting of different numbers of dimensions inevitably differ not only in their complexity but also in the substantial information presented to respondents. To verify that it is really the complexity of the evaluation task that matters, and not just the additional information, we examine further aspects. Survey research proposes that complexity varies with the nature of the response format. Rating closed answer scales has been shown to be an easier task than, for example, answering open questions about fair amounts of income or willingness to pay (e.g., Bijlenga, Bonsel, and Birnie 2011). Similarly, answering two instead of one target question for each vignette is likely to be a more complex task. We therefore expect that
The vignette evaluation task is also more cognitively demanding, the more the vignettes each respondent has to evaluate. Previous research has shown that fatigue or boredom effects occur after the respondent has evaluated about 10 vignettes. After this point, respondents appear to focus on the most salient dimensions and to ignore other less salient ones when computing their evaluations. This is consistent with the idea that respondents develop response heuristics in the course of evaluating a series of vignettes. It is difficult to predict how possible response heuristics and order effects might interact. Presumably, the resulting response patterns depend on which dimensions enter into response heuristics, and if these dimensions are per se more or less prone to order effects. For example, if respondents focus increasingly on the most important dimensions when evaluating a series of vignettes, and only important dimensions are prone to order effects, then the overall order effects will be stronger for later than earlier vignettes. Similar effects might be true for fatigue leading to less concentrated response behavior that is in general more prone to order effects. In addition, the order of dimensions may itself influence which dimensions are most important to respondents. In this case, not only would some dimensions gain importance during the sequence of vignettes, but the extent of order effects for these specific variables would also increase.
In sum, the current state of research does not enable clear predictions about the likely nature of interactions between order effects and response heuristics or fatigue effects. Nonetheless, we expect the magnitude of order effects to vary during the course of vignette evaluations and in particular to change after about 10 vignettes have been evaluated:
Impact of Respondent Characteristics
One of the main predictions from cognitive psychology is that order effects are more pronounced, the less cognitively sophisticated the respondents are. Furthermore, the extent of order effects seems to depend on the attitude certainty and on how familiar respondents are with the survey topic. We therefore expect the following hypotheses:
Additionally, the survey literature suggests that the magnitude of order effects depends on whether questions or items are personally important to respondents. Correspondingly, one might expect order effects within the factorial surveys to be moderated by the extent to which respondents consider single dimensions to be essential for the evaluation task. We therefore expect the following hypothesis:
Interaction of Moderator Variables
Finally, there is evidence from prior research that single moderator variables interact with each other. The theory of satisficing predicts an interaction of respondents’ cognitive ability with the task difficulty, and other interactions have sometimes been demonstrated or supposed. The current state of research only allows a very general prediction:
Survey and Experimental Design
Sample, Survey Mode, and Questionnaire Content
To overcome the problem caused by potential interrelatedness of sociodemographic characteristics with both attitudes and moderator variables, we use a relatively homogeneous sample. This facilitates an experimental design that minimizes potential confounding factors that might impact on the identification of the moderators of order effects. Social science students at three German universities were recruited for an online survey in 2009. The mean age was 23.9 years (standard deviation [SD] = 4.4) and most respondents majored in sociology (62.2 percent). The mean number of semesters was 3.4 (SD = 2.2), and 38.1 percent of students were male (see Online Appendix Table A3). The topic of the survey was the fairness of earnings, which is probably the most common subject of factorial survey designs (see Alves and Rossi 1978; Hermkens and Boerman 1989; Jasso and Rossi 1977; Jasso and Webster 1997, 1999; Shepelak and Alwin 1986, for some applications). The questionnaire contained a series of sociodemographic questions, the factorial survey module, some items about attitudes related to justice and the importance of single dimensions for fair earnings, attitude certainty, knowledge about the earnings distribution in Germany, and further sociodemographic questions. 1
Factorial Survey Module and Experimental Design
In the factorial survey module, all respondents had to evaluate 20 different vignettes describing fictive employees. The employees were characterized by 8 or 12 variable dimensions (including gross earnings) that were known to influence justice evaluations from prior factorial surveys, justice, and labor market research (see Online Appendix Table A1 for the definition of dimensions and levels). Respondents had to rate each vignette, evaluating how fair they thought the gross earnings were. In the vignettes, occupations were described verbally (e.g., “medical doctor” and “hairdresser”), but for the analyses, we used occupational prestige scores (the Magnitude Prestige scale, see Christoph 2005). 2 The gender of the vignette person was also signaled by the occupation, since for female vignette persons the feminine forms were used (e.g., “Ärztin” instead of “Arzt”; only for clerks the masculine and feminine forms are the same in German).
As the number of all dimension levels gave rise to more than one million possible combinations, we generated a D-efficient sample of 240 vignettes excluding illogical cases (e.g., medical doctors without a university degree). D-efficient samples optimize two desirable characteristics of experimental designs: maximal “orthogonality” (i.e., a minimal intercorrelation between all single dimensions) and maximal variance and “level balance” of the single dimensions (i.e., all dimension levels occur with about the same frequency). Both design features allow estimating the influence of single dimensions with maximum precision and therefore offer maximum statistical power to detect their impact on evaluations (for details, see Atzmüller and Steiner 2010; Kuhfeld 2009; Kuhfeld, Tobias, and Garrat 1994). The vignette sample selected had a D-efficiency measure of 90.7. In a second step, we applied the two target criteria for D-efficient designs to the 240 vignettes to combine them into 12 sets of 20 vignettes.
The order of the 20 vignettes was randomized for each respondent. This randomization neutralized possible effects of vignette order and facilitated the identification of learning and fatigue effects. The dimensions were listed in tabular format, since this allowed a more flexible variation of the dimension order than presenting them as running text. All respondents were allowed to move forward and backward in the questionnaire and to correct earlier responses to reduce the risk of censored responses, in which the presented response scale is not sufficient to measure the respondent’s reactions when evaluating multiple vignettes (Auspurg and Hinz 2015). However, preliminary analyses of a similar study suggest that only a minority of respondents (fewer than 10 percent) move backward in the questionnaire to change their evaluations.
To test the methodological research questions, we used a 2 × 2 × 2 multifactorial experimental design. Two different dimension orders (orders 1 and 2) were crossed with two versions of vignette complexity (8 and 12 dimensions) and two versions of evaluation complexity (one and two target questions about the vignette).
The table containing the vignette dimensions was always split into two columns for convenience and clarity. Therefore, four dimensions appeared either in first or in last position and might have been especially eye-catching (see Table 1).
Order of Dimensions.
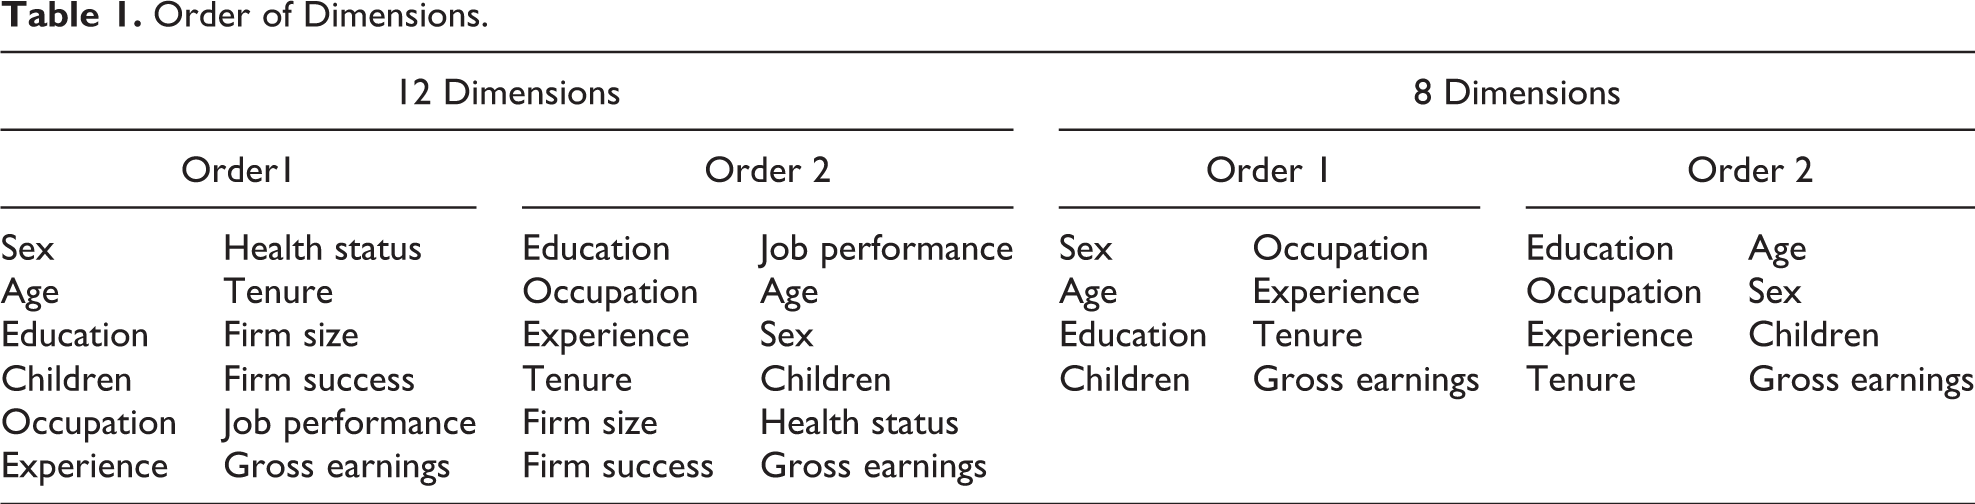
In order 1, the vignette dimensions were sorted in a similar way as the text vignettes used in a parallel study. This was a typical order of vignette dimensions and is summarized in Table 1: The vignettes started with gender and age, followed by dimensions describing the education level, employment characteristics, and sociodemographic background of the vignette person. The last cell in the table contained the gross earnings.
Within order 2, first all dimensions about employment-related characteristics of the vignette person were listed, followed by dimensions describing the sociodemographic background of the vignette person. Only the earnings dimension was again listed in the last cell, since it seemed more natural to end the vignettes with this dimension and since it was expected to have an extraordinarily high impact on the justice evaluations regardless of its position.
Two further experimental splits were used that varied the complexity of the vignettes and the complexity of the evaluation task. To increase the complexity of the vignettes, 12 rather than the more common 8 dimensions (Sauer et al. 2011) were used per vignette. The additional four dimensions were chosen to reflect characteristics that were already well known to have substantial impact on justice evaluations (i.e., health status, firm size, firm success, and job performance). This was done to ensure that the added information was indeed of relevance to the respondents. Adding more dimensions increased not only the information for respondents but also the length of vignettes as one part of complexity. The mean number of characters in the 8-dimension split was 221 characters (with a SD of 8.0 and a median of 221 characters), while the 12-dimension split consisted of a mean number of 354 characters (SD 10.0, median 353). That is, with increasing the number of dimensions by 50 percent, the mean number of characters increased by 60 percent. The additional information respondents must incorporate into their evaluations is therefore likely to be more salient than the length of the text per se. Both aspects of complexity are typically confounded, and it is out of scope of this article to disentangle their effects.
In addition, the complexity of the evaluation task was manipulated by using one versus two target questions about the vignette. The first target question asked respondents to evaluate the fairness of gross earnings: “Are the monthly gross earnings of this person fair or are they, in your view, unfairly high or low?”, using an 11-point rating scale ranging from −5 “far too low” to 0 “fair” to +5 “far too high.” For our analyses, we use only this rating scale to assess the robustness of vignette evaluations to order effects. The second target question was added for a random half of respondents. Respondents who had rated the earnings as “unfair” were asked an open question about what they thought fair earnings would be: “If you rated the earnings as unfair, what do you think would be a fair amount of gross earnings for the described person?” This design was similar to other studies that have used multiple evaluations per vignette and/or open response scales (Ganong and Coleman 2006; Ludwick et al. 2004). In our study, respondents rated between 7 and 20 vignettes as unfair (mean = 15.9, SD = 2.4). That is, all respondents in this split were asked the follow-up question for some vignettes, and we test whether having a follow-up question affected the likelihood of order effects in the initial question that all respondents were asked. Both manipulations of complexity that we test—adding dimensions and adding a follow-up question—are confounded to some extent with length. However, the number of dimensions and the number of evaluations are key design choices researchers have to make and we therefore focus on these aspects of complexity
To ensure that correlations and variances of vignette dimensions were similar for all experimental treatments, respondents were randomly allocated to the eight treatment groups (which were fully crossed) and randomly allocated to the sets of 20 vignettes created by the sampling procedure described earlier. That is, how the vignette was presented to the respondent depended on the randomization to treatments, and each vignette created by the sampling procedure had predefined values of all 12 dimensions. For a random half of respondents, the second question was added; for the random half of respondents allocated to the 8-dimension version, the dimensions health status, firm size, firm success, and job performance were simply deleted; and for one-half of respondents, the dimensions were presented in order 1 and for the other half in order 2. That is, we employed a between-respondent design, whereby the 20 vignettes presented to a respondent were all of the same experimental design. Online Appendix Figure A1 shows the screenshot of an example vignette, with 12 dimensions and the follow-up question.
Table 2 documents the sample sizes for respondents and vignette evaluations. For each of the eight experimental cells, at least 30 respondents and about 600 to 700 vignette evaluations were achieved. The eight experimental groups were balanced in terms of case numbers and respondent characteristics, including sex, degree studied for, partnership status, location, and average time studying (see Online Appendix Table A2), although there were some differences in mean ages and income levels between groups. Only a few students had children or were born outside Germany, but those who did were distributed across treatment groups. The balanced numbers and characteristics confirm that the random allocations to treatment groups were successfully implemented.
Number of Respondents, Scale, and Open Evaluations per Treatment Group.

Note: Missing evaluations excluded. All respondents answered at least one vignette.
Operationalization of Respondent Characteristics
All constructs we use to test our hypotheses were measured by item questions that followed the factorial survey module. These were:
Cognitive ability
Respondents were asked to rate their performance at university: “What do you think, how is your performance at university?” using an 11-point rating scale ranging from −5 “below average” to 0 “average” to +5 “above average” (Online Appendix Table A4). For our analyses, we classified students as either “high” or “low” ability based on a median split. We used a self-assessment instead of actual grades since performance measurements based on grades are hardly standardized across Germany universities (even within the field of social sciences: Müller-Benedict and Tsarouha 2011).
Attitude certainty
Following common definitions, attitude certainty is the subjective sense of conviction or the extent to which one is confident or sure of one’s attitude (Sharon, Holtz, and Miller 1995:215; Tormala and Rucker 2007). As a proxy for this conviction, we used a subitem belonging to the scale “justice ideologies” (Stark, Liebig, and Wegener 2008). Respondents were asked to rate the statement “The way things are these days, it is hard to know what is just anymore” on a five-point rating scale (Online Appendix Table A4). Respondents who either “strongly” or “somewhat” agreed with the statement were classified as having low attitude certainty (36 percent), and respondents who neither agreed nor disagreed, or disagreed (somewhat or strongly) were classified as having high attitude certainty (64 percent). 3
Knowledge of the subject matter
Respondents were asked an open question about mean gross earnings in Germany to assess their knowledge on the subject matter of fair earnings: “What do you think is the average monthly gross salary for full-time employees in Germany?” The actual value was 3,141 euros per month in 2009 (Statistisches Bundesamt 2015). Responses were approximately normally distributed (with mean = 2,616; median = 2,500, SD = 831, see also Online Appendix Table A4). 50 percent of respondents indicated amounts within 641 euros from the true value and were coded as having “good knowledge.” The remaining 50 percent indicated amounts outside this range or refused to answer the question and were classified as having “little knowledge.” Although merely a measure of knowledge of earnings, this measure is correlated with knowledge of general economic principles. For instance, in a general population survey of about 1,600 respondents in Germany in 2009, this measure of knowledge was significantly correlated with a standard scale of “economic literacy” (measured using a short version of the instrument by Soper and Walstad [1987]: r = .171, p = .000).
Importance respondents ascribe to each vignette dimension
Toward the end of the questionnaire, respondents were asked to rate how much impact each of the vignette dimensions should have in order to achieve a fair distribution of earnings: “In your opinion, what impact should the following items have for fair levels of gross earnings?—Age of employees, gender, ….” The response scale was a 7-point rating scale ranging from 0 “no impact at all” to 6 “very large impact.” We determined each respondent’s median rating across all dimensions, and then classified each dimension as being important to the respondent if the valuation was above the respondent’s median, and unimportant if the dimension was rated below or equal to the respondent’s median. 4
In addition, after completing the factorial survey module, respondents were asked to assess the overall complexity of the evaluation task: “All in all, how easy or difficult was the evaluation of these hypothetical cases for you?” using an 11-point rating scale ranging from −5 “very difficult” to +5 “very easy” (Online Appendix Table A4). We used a median split to classify respondents as either finding the task difficult (59 percent, levels −5 to −2) or easy (41 percent, levels −1 to +5). Answers to this question were expected to be strongly influenced by respondents’ cognitive abilities, attitude certainty, and knowledge since respondents short of one or more of these features should find the evaluation task relatively difficult. We use this measure as an additional possibility to assess the overall impact of respondent characteristics for moderating dimension order effects.
The correlations between respondent characteristics were low: r = .06 for attitude certainty and ability, r = .06 for knowledge and ability, and r = .08 for attitude certainty and knowledge. Even if the single constructs are partially related to each other, they clearly measure different things. The respondents’ rating of how difficult they found the vignette task was not correlated with knowledge (r = −.08) or attitude certainty (r = −.02) but was negatively correlated with ability (r = −.16, p = .007).
Results
Does the Order of Vignette Dimensions Matter?
Impact on absolute effect sizes
Table 3 shows the results of ordinary least squares (OLS) regression models estimating the influence of vignette dimensions on the vignette evaluation for the 12 dimension conditions. As the data have a hierarchical structure (several evaluations stem from single respondents; see Hox, Kreft, and Hermkens 1991, for details), we estimated clustered robust standard errors that adjust for the unequal variances of error terms caused by the clustering of evaluations within respondents (Rogers 1993).
Effect of Order on Coefficients, Standard Errors, and Semi-partial R 2 Values.

Note: The F- and p values are from Wald tests of the interaction of each variable with the order of dimensions. For variables with more than two categories, the statistics are from joint tests of all interactions related to the variable. Degrees of freedom (1, 137) for all tests of two-category variables and (2, 137) for all tests of three-category variables.
aSemi-partial R 2 values based on the heuristic approach proposed by Johnson (2010) and estimated with the Stata ado domin. Estimates are normed to sum to 100 percent (which represents the overall proportion of explained variance).
bMPS = magnitude prestige scale. All estimations are based on the 12-dimension split.
*p < .05.
**p < .01.
***p < .001.
The first two columns report regression coefficients and standard errors from separate models for the order 1 and order 2 conditions. Positive (negative) coefficients denote that the earnings of the vignette person were judged unfairly too high (low). Results are all in all plausible and in line with justice theories. For example, persons with university degree should have higher earnings than persons without any vocational degree (β = −.625 in order 1 and β = −.612 in order 2); or the more children a person has, the higher their earnings should be (β = −.074 in order 1 and β = −.099 in order 2). Earnings of the vignette person were integrated as a logarithmic variable to model the nonlinear relationship with fairness evaluations.
The order of dimensions mattered for some estimates. The dimensions “age of vignette person,” “experience,” and “risk of bankruptcy” only reached statistical significance (5 percent level) in the order 1 condition. Because the number of cases was similar for both models and the vignette sample was exactly the same, the only explanation for these differences apart from sampling variation are order effects. Other dimensions had stronger effects in the order 2 than order 1 condition. For example, the absolute value for the regression coefficient of “performance above average” was about 1.5 times larger. Other coefficients even changed signs, for instance, those for age, tenure, and firm size. The dimensions sex, health status, and firm size were not significant in either order.
To test whether the differences caused by the order of dimensions are statistically significant, we estimated a joint model of order 1 and order 2 vignettes, including interaction terms of each dimension with a binary indicator of the order, and tested the null hypothesis H0 that the interaction terms were all jointly zero applying a Wald test (this “omnibus” hypotheses test that there are no differences at all is also known as “Chow test,” for details, see Wooldridge 2003). The result suggests that the order of dimensions does matter and that evaluations differed across order 1 and order 2 vignettes (F = 2.06, p = .013). We further tested for order effects of individual vignette dimensions by employing Wald tests for the interactions of single dimensions with the order indicator. For dimensions with three categorical values, the results are from joint tests of the interactions for both dummy variables included in the model. The F and p values of these Wald tests are displayed in the columns labeled “Interactions” in Table 3. The order effects were statistically significant for three dimensions (“age,” “experience,” and “long tenure”), that is, for a quarter of all vignette dimensions. Thus, we find support for the first hypothesis: The order in which vignette dimensions are presented influences their impact on vignette evaluations (Hypothesis 1a).
There was no clear evidence that dimensions have more impact on evaluations when they are placed in first position. For “gender,” the results suggested weak primacy effects: The regression coefficient was larger in order 1, where the dimension was in first position, than in order 2. Neither coefficient was however statistically significant, and neither was the interaction of gender with order in the pooled model. For “education,” there were no differences in coefficients or significance levels between order 2, where it was in first position, and order 1. For the other dimensions that appeared in the first or last cell of a column in either order, there were also no clear patterns. Sometimes the absolute coefficient values were larger when dimensions were placed in first or last position, sometimes not. Significant order effects only appeared for dimensions placed in middle positions. Hence, we do not find support for the hypothesized primacy or recency effects (Hypothesis 1b).
Impact on relative importance
One of the main advantages of factorial survey designs is that they reveal information on the relative importance of dimensions. Respondents are forced to trade-off the impact of different dimensions in their evaluations. Usually, semi-partial R 2 values that measure the proportion of variance explained by each dimension are used to draw conclusions about the relative importance of different dimensions (Wallander 2009). 5
Columns 5 and 6 in Table 3 report the semi-partial R 2 value for each dimension based on separate models for order 1 and order 2. For ease of comparison, the values from each model are standardized to sum to 100 percent. The last two columns in Table 3 report the rank position of each dimension. The rank correlation (Spearman’s ρ) between the semi-partial standardized R 2 values of order 1 and order 2 is .909 (p = .000). Figure 1 illustrates the difference in semi-partial R 2 values of each dimension between order 1 and order 2, using mean values for ties. In both orders, the dimension “earning” was by far the most important, followed by the dimensions “occupation,” “performance,” “education,” “performance of the firm,” and “number of children.” Order effects only changed the relative importance of three dimensions: experience was ranked 7th in order 1 and 10th in order 2, “male” was ranked 10th versus 11th, and “tenure” was ranked 11th versus 7th. These findings suggest that the order in which dimensions were presented only influenced the effect of less important dimensions. The effect of the most important dimensions was not altered by the order in which they were presented (Hypothesis 1a). Where the dimensions were placed revealed no clear pattern, again not providing any support for the hypothesized primacy or recency effects (Hypothesis 1b).
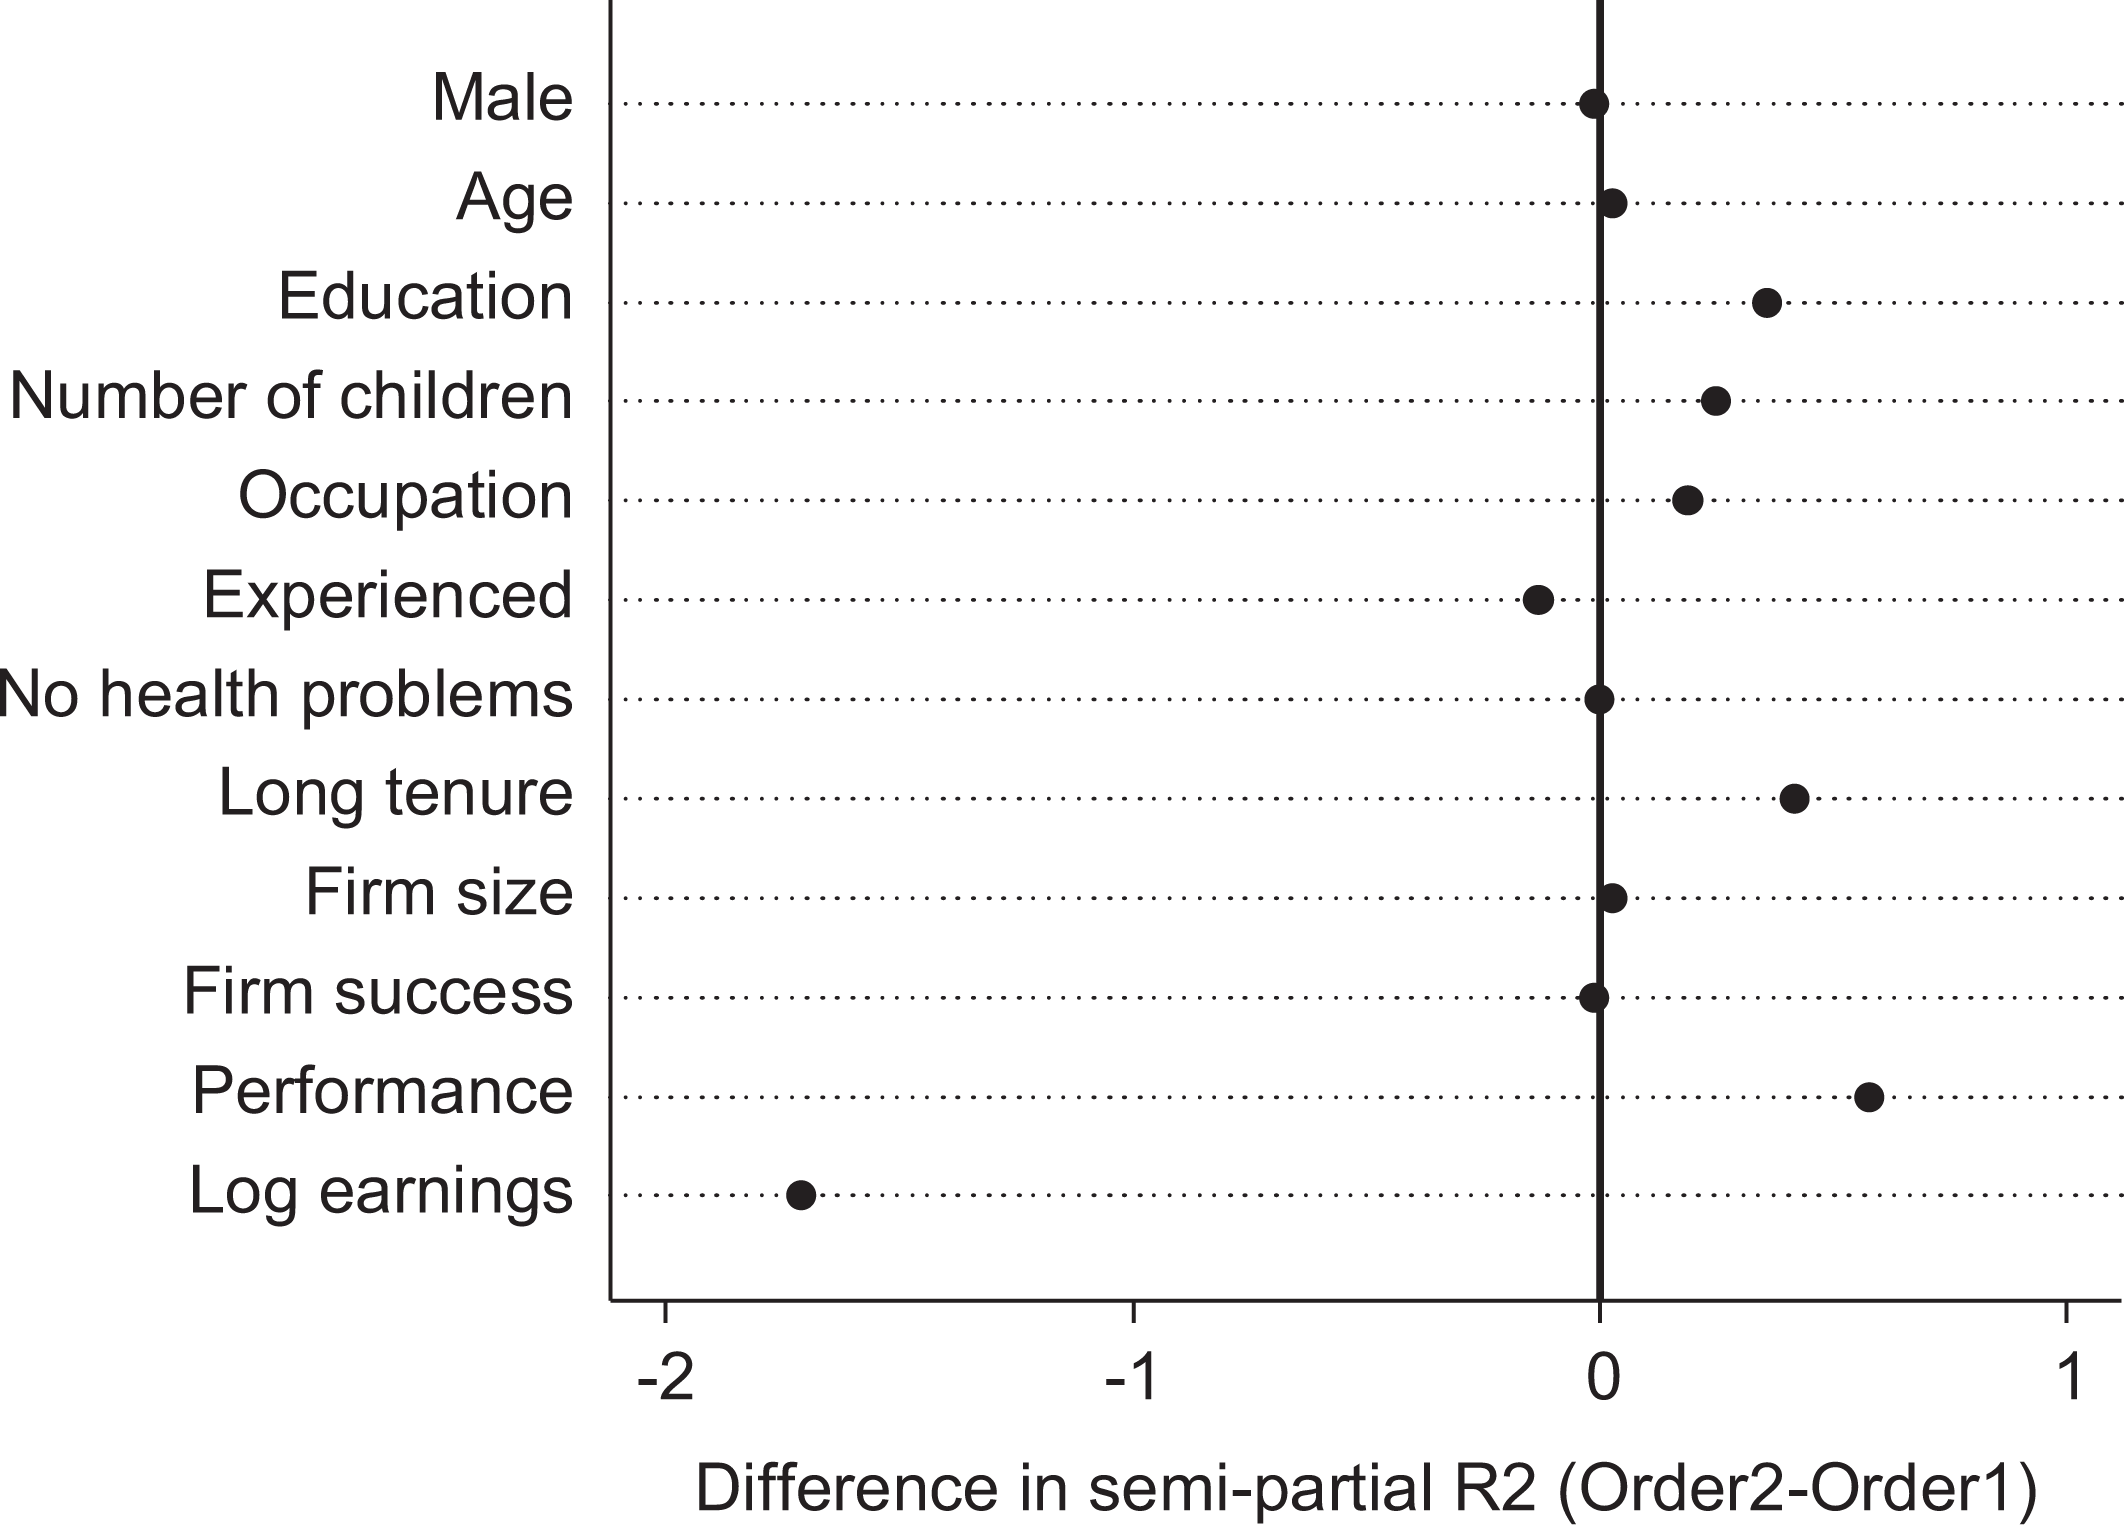
Impact of dimension order on relative dimension importance. Note: Mean rank position used for ties.
Practical relevance
A common target measure in factorial surveys is the fair amount of earnings derived from the vignette evaluations. Some applications estimate fair returns to different levels of education or just gender pay gaps between equally qualified men and women (JGPGs; see, e.g., Jasso and Rossi 1977; Jasso and Webster 1999, for applications). The intuitive logic is to ask which amount of earnings one group has to earn more or less, compared to the reference group, for the mean fairness evaluation to be the same across both groups. To estimate the fair differences between groups, the regression estimates are used to calculate the trade-offs between single dimensions. When using a binary indicator for the groups compared and a logarithmic transformation of earnings, the just pay gap in percentage (%JPG) can be calculated from the following formula (see the Technical Appendix section in supplementary material for details):
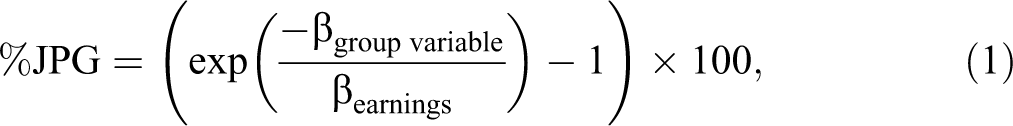
with exp(·) denoting the exponential function and β the regression coefficients from the OLS regression of the vignette evaluations on all vignette dimensions. In both order conditions, there is evidence of a JGPG favoring male vignette persons: In order 1, respondents evaluated an earnings gap of 341 euros between men and women as fair (which is equivalent to 7.2 percent of mean vignette earnings). In order 2, the JGPG is much smaller at only 35 euros (0.7 percent). With order 2 vignettes, one would conclude that there is no substantial JGPG, while the magnitude of the JGPG with order 1 vignettes is considerable. Note that the differences between male and female vignette persons were not caused by differences in their labor market or demographic characteristics. Due to the D-efficient vignette design, male and female vignette persons were on average described as having the same characteristics. For just returns to education, the order effects are smaller: the just return to a vocational qualification (compared to no vocational qualification) amounts to 579 euros per month with order 1 vignettes (12.2 percent) and 605 euros (12.6 percent) with order 2 vignettes. For a university degree, the estimated just rates of return are 1,511 euros (31.8 percent) and 1,459 euros (30.4 percent), respectively.
For the JGPG, the results suggest that order effects can have large practical implications for the conclusions drawn from vignette evaluations. Since the JPGs are based on two dimensions, already small differences in the impact of single dimensions can substantially affect conclusions.
Which Conditions Trigger Order Effects?
Effects of factorial survey design
To test under which conditions order effects are more likely to occur, we again estimated regression models pooling the evaluations for order 1 and order 2 vignettes, including interaction terms for each dimension with the order indicator. We estimated separate models for the less and more complex vignette conditions. For each model, we used Wald tests to assess whether the interaction terms are jointly zero, that is, testing the null hypotheses of no order effects. 6 When the vignette complexity conditions resemble each other in their degrees of freedom (numbers of observations), the F values resulting from the Wald tests can be used to compare the magnitude of order effects across models: The higher the F value, the larger the difference in the impact of dimensions between order 1 and order 2. In other cases, the significance levels (p values) give some indication under which conditions order effects occur.
Table 4 shows the results separately for the more and less complex vignettes. As expected (Hypothesis 2a), order effects were in general more pronounced with more complex vignettes (F = 0.82, p = .594 for 8 dimensions and F = 2.06, p = .013 for 12 dimensions). When complexity was added by asking two instead of one target question, order effects also appeared in the 8 dimension condition (F = 2.03, p = .049). This provides some evidence for the hypothesis that order effects are more pronounced when the nature of the target question is more complex (Hypothesis 2b). For the already complex vignettes using 12 dimensions, adding further complexity through the second target question did not make any difference.
Impact of Design Characteristics on Strength of Order Effects.
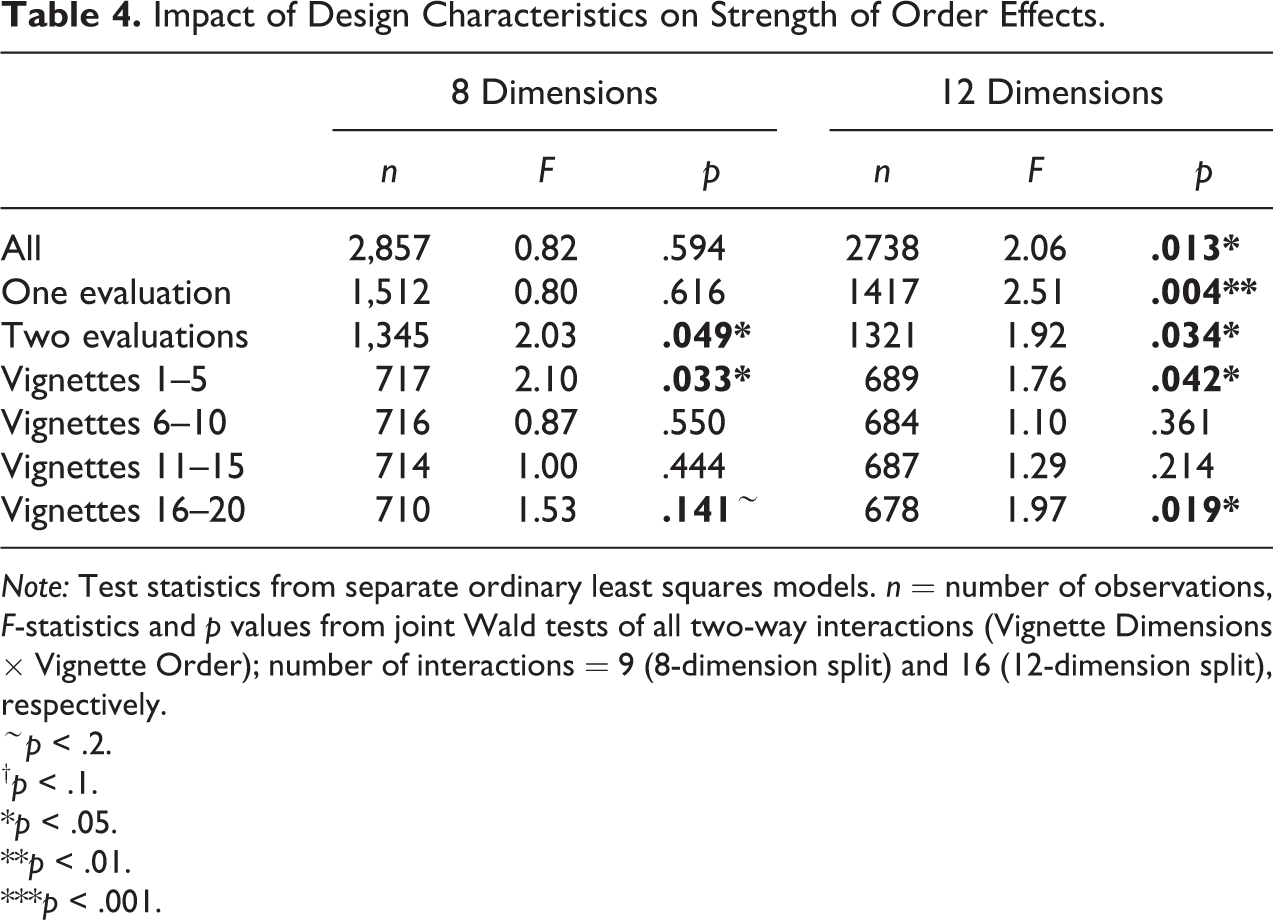
Note: Test statistics from separate ordinary least squares models. n = number of observations, F-statistics and p values from joint Wald tests of all two-way interactions (Vignette Dimensions × Vignette Order); number of interactions = 9 (8-dimension split) and 16 (12-dimension split), respectively.
∼ p < .2.
† p < .1.
*p < .05.
**p < .01.
***p < .001.
We further tested whether the apparent difference in the extent of order effects between the more and less complex conditions was significant, using what we will refer to as a “moderator test.” Using a similar test logic to the one described for Table 4, we conducted Wald tests of whether moderator variables (such as the number of dimensions or, for Tables 5 –7, respondent characteristics) had a significant impact on the risk of order effects. These Wald tests assess whether the three-way interactions between the vignette dimensions, their order, and the respective moderator variable are jointly significant. Because interaction effects have lower statistical power than main effects, we follow the suggestion by Cohen (1969) to consider p values up to .1 (for two-way interactions) or .2 (for three-way interactions) as statistically significant. The moderator test supports the conclusion that order effects are more likely with 12 than with 8 dimensions (joint test of three-level interactions: Dimensions × Order × Number of Dimensions; F = 2.34, p = .015). For the 8-dimension condition, the moderator test also supports the conclusion that order effects are more likely when respondents are asked two rather than one question about each vignette (joint test of three-level interactions: Dimensions × Order × Number of Evaluations; F = 1.43, p = .179).
Impact of Respondent Characteristics on Strength of Order Effects.
Note: Estimations for subgroups: test statistics from separate ordinary least squares models. F-statistics and p values from joint Wald tests of all two-way interactions (estimations for subgroups)and three-way interactions (moderator tests), respectively. All estimations for subgroups are based on at least 49 respondents and 992 observations.
∼ p < .2.
† p < .1.
*p < .05.
**p < .01.
***p < .001.
Interactions of Respondent Characteristics in Triggering Order Effects.
Note: 12-dimension split. Estimations for subgroups: test statistics from separate ordinary least squares models. F-statistics and p values from joint Wald tests of all two-way interactions (estimations for subgroups) and three-way interactions (moderator tests), respectively. All estimations for subgroups are based on at least 23 respondents and 459 observations.
∼ p < .2.
† p < .1.
*p < .05.
**p < .01.
***p < .001.
Interactions of Respondent Characteristics in Triggering Order Effects.
Note: 8-dimension split. Estimations for subgroups: test statistics from separate ordinary least squares models. F-statistics and p values from joint Wald tests of all two-way interactions (estimations for subgroups) and three-way interactions (moderator tests), respectively. All estimations for subgroups are based on at least 23 respondents and 459 observations.
∼ p < .2.
† p < .1.
*p < .05.
**p < .01.
***p < .001.
To analyze how order effects change in the course of evaluating the sequential vignettes, we pooled vignettes in positions 1–5, 6–10, 11–15, and 16–20, as there were too few vignettes to produce stable results for individual vignette positions. Both with 8 and 12 dimensions, order effects were most pronounced in the first and last 5 vignettes evaluated (Table 4). For the middle 10 vignettes, there were no significant order effects. This provides some support for the hypothesis that the magnitude of order effects depends on learning and fatigue effects (Hypothesis 2c; due to the low numbers of cases, we refrain from moderator tests).
Effects of respondent characteristics
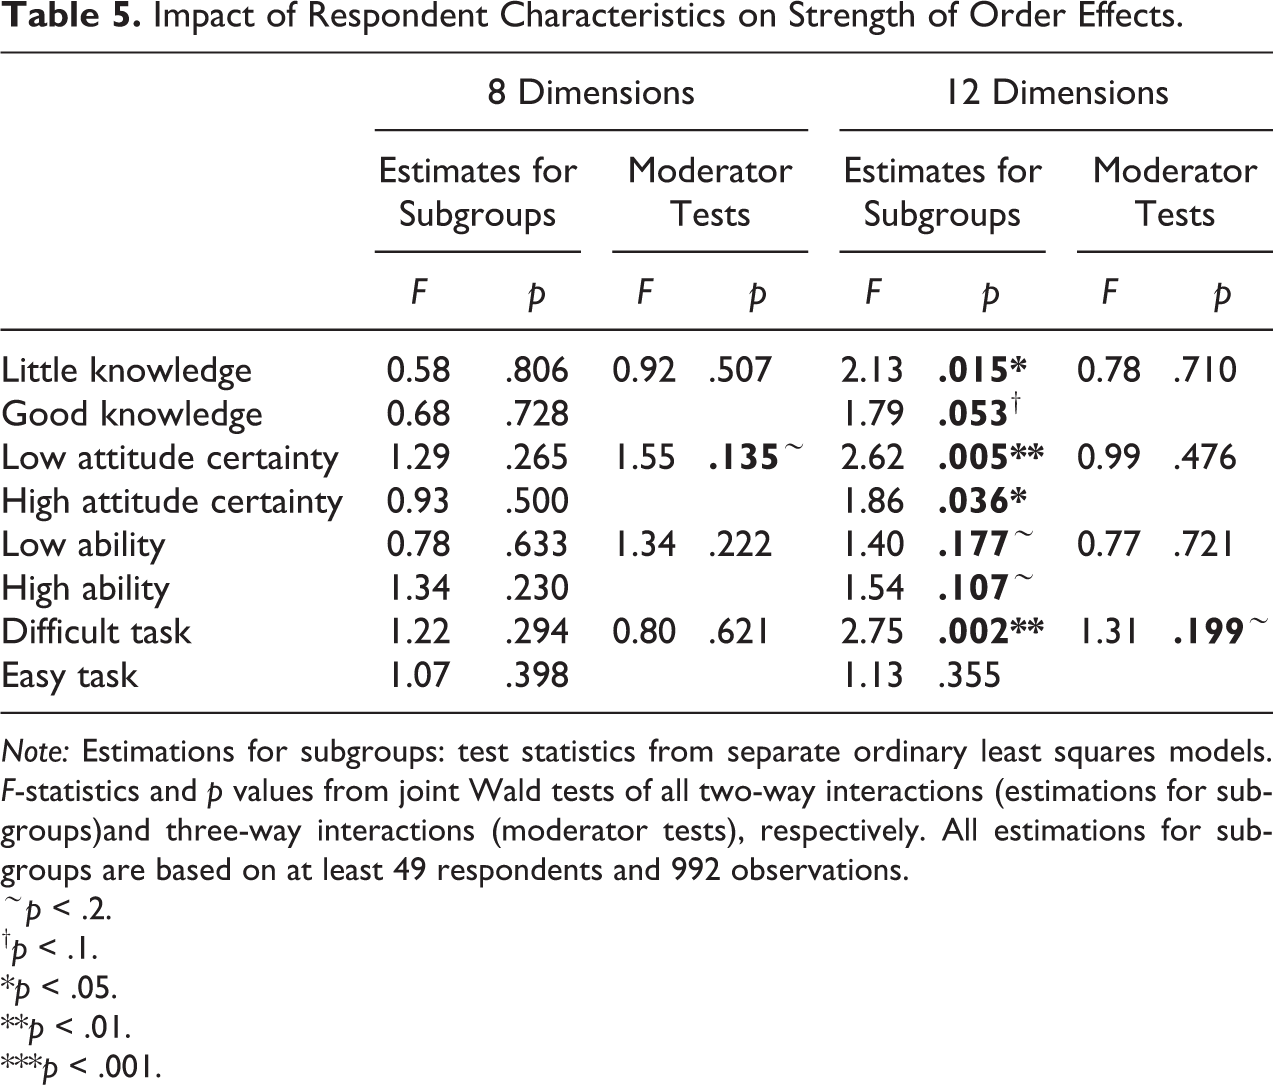
Table 5 shows the results of Wald tests of the joint significance of all dimensions interacted with order, estimated separately for the 8- and 12-dimension conditions and by respondent characteristics (columns labeled “Estimates for subgroups”). With 8 dimensions, there are no significant order effects at all. The 12 vignette condition shows results that are mostly in line with our hypotheses: Order effects were more pronounced when respondents had little knowledge of the substantive matter (Hypothesis 3c) and when respondents had only a comparatively low attitude certainty (Hypothesis 3b). Contrary to our expectations, order effects were not stronger for respondents with lower cognitive ability (Hypothesis 3a). This result held when controlling for possible heterogeneity in the self-assessment of cognitive ability, by estimating fixed effects for the universities and classes in which the experiments were run. The last two rows in Table 5 indicate the strength of order effects separately by the respondents’ own ratings of how difficult they found the task of evaluating the vignettes. With 12 dimensions, the respondents’ self-assessment is predictive of order effects. While respondents who thought evaluating the vignettes was a relatively easy task showed no significant ordering effects (F = 1.13, p = .355), respondents who found the task difficult produced highly significant order effects (F = 2.75, p = .002). However, moderator tests reveal only little evidence that single moderators matter. Only the differences by attitude certainty in the 8-dimension split and by respondents’ self-assessed task difficulty in the 12-dimension split were statistically significant (see columns labeled “Moderator Tests” in Table 5).
Impact of dimension importance
The analysis of semi-partial R 2 values (Table 3) provides some initial evidence that the importance of dimensions matters: The most important dimensions seemed robust against order effects. Dimension importance was however derived as an aggregate measure across all respondents, whereas the literature suggests that what matters is how important a dimension is personally to a respondent. For each dimension, we therefore estimated the strength of order effects separately for respondents who rated that particular dimension as relatively unimportant versus important. For both respondent groups, we measured the strength of order effects by estimating the impact of each dimension on vignette evaluations (i.e., the OLS coefficients) for orders 1 and 2 vignettes separately, and computing the percentage difference between the two estimates. Some dimensions were rated unimportant (e.g., sex) or important (e.g., performance) by nearly all respondents. For these dimensions, the numbers of cases were too small to estimate stable regression coefficients for both groups of respondents and orders of dimensions. We therefore analyzed the six dimensions for which there was enough variance between respondents in the importance they attached to the dimension. For four of those dimensions, the order effects were slightly larger for respondents who rated the dimension as relatively important (black bars in Figure 2). For the dimensions “children” and “tenure,” however, the opposite was true: The order effects were larger for respondents who thought children or tenure were relatively unimportant (gray bars). None of the differences in order effects between respondents who thought the dimension was relatively important or unimportant were statistically significant (tested by estimating the three-way interaction of Dimension × Personal Relative Importance of that Dimension × Dimension Order). All in all, the results do not suggest a clear pattern and do not provide support for the hypothesis that dimensions that are personally important to respondents are less prone to order effects (Hypothesis 3d). 7
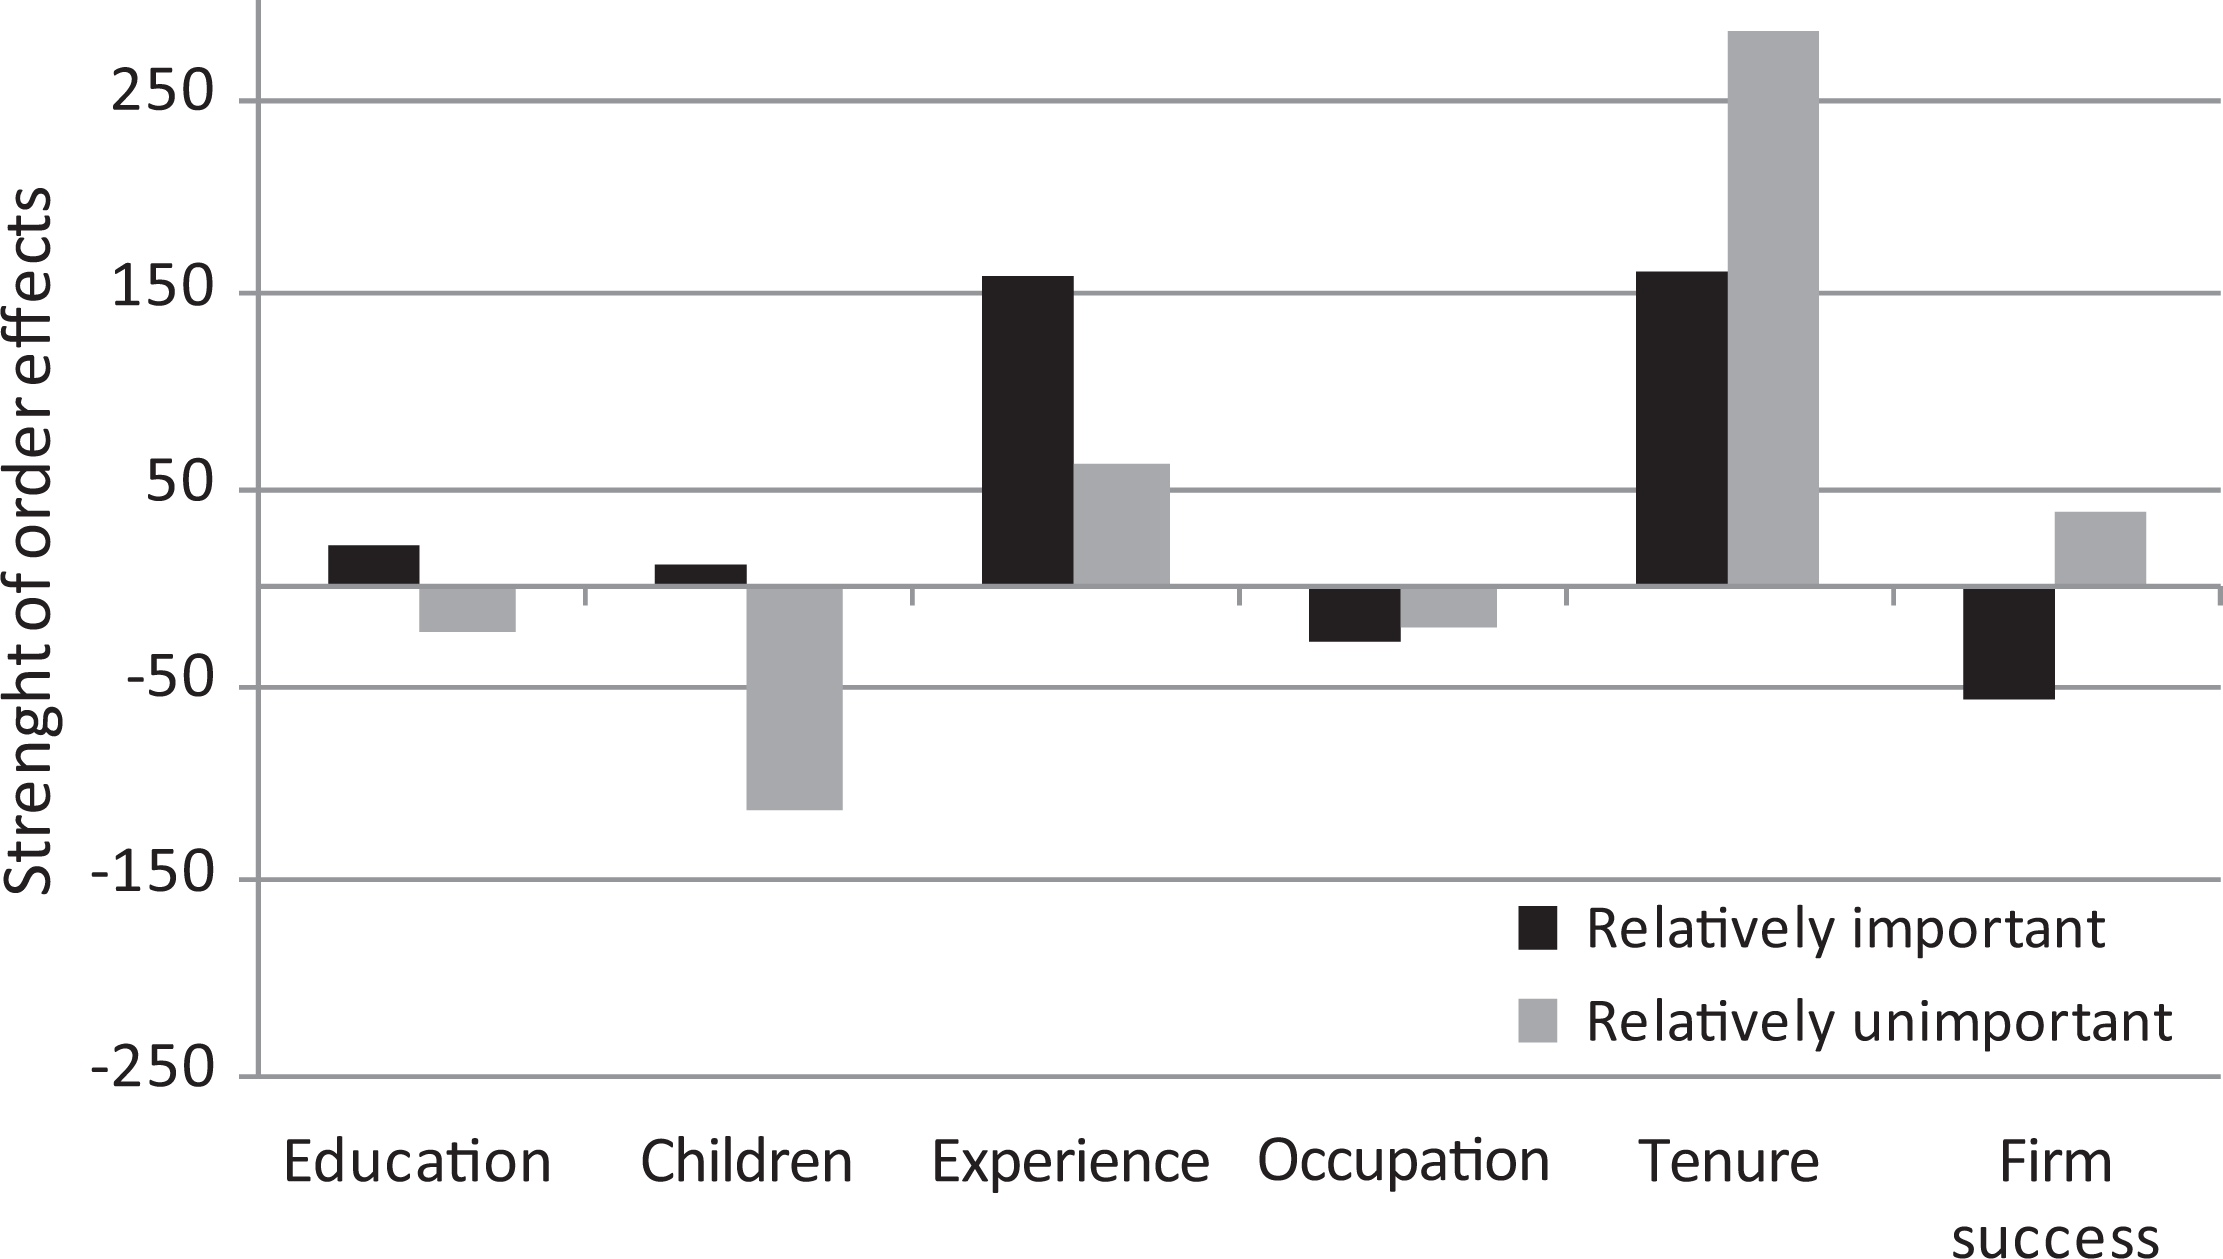
Strength of order effects by dimension importance. Note: Strength of order effects was measured as the percentage difference in ordinary least squares regression coefficients (i.e., the impact of a dimension on the fairness evaluation) in orders 1 and order 2:
Interactions of respondent characteristics
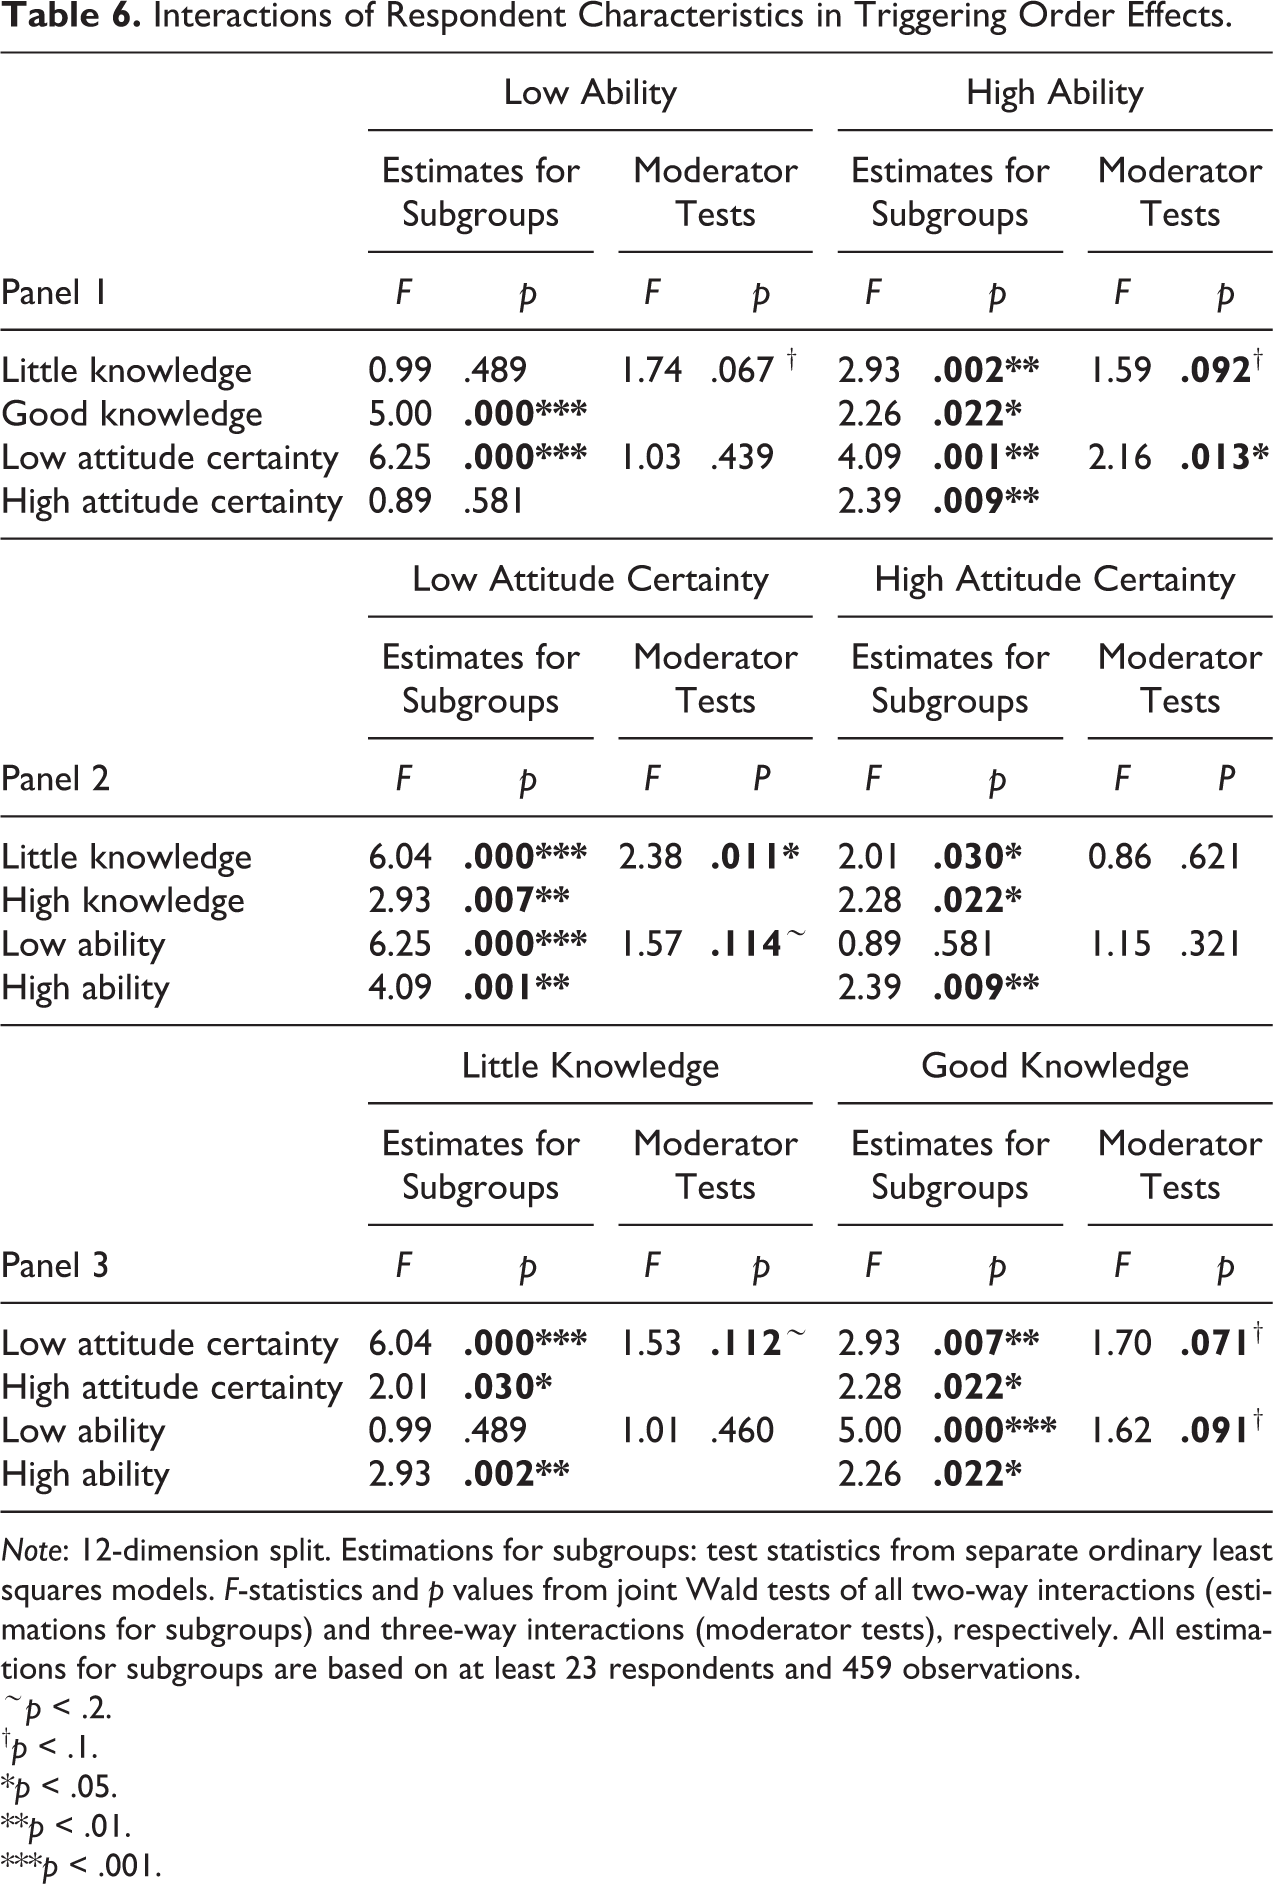
The results above suggest that complexity of vignettes is a necessary condition for order effects. We further tested whether any of the risk factors on the part of respondents are necessary conditions, and whether they interact at all. Are respondents completely immune, also in the 12-dimension condition, to order effects if they have several characteristics that make them less susceptible, such as good knowledge and high attitude certainty? Conversely, are respondents that have several risk factors even prone to order effects if vignettes have a low complexity (8 dimensions)? Table 6 displays the F and p values from joint Wald tests of the interactions of each dimension with dimension order, estimated separately for different combinations of respondent characteristics using the 12-dimension condition. The columns labeled “moderator test” contain the results from the three-way interactions of each dimension with dimension order and the moderator variable. Table 7 documents the corresponding results for the 8-dimension condition. The tables report multiple significance tests and some of these tests might have reached statistical significance only by chance. For that reason, we focus on the most important patterns found under different conditions.
Low attitude certainty appears to be the most important precondition for order effects. Regardless of whether respondents in the 12-dimension condition had low or high cognitive ability (panel 1 in Table 6), order effects were stronger for respondents with low attitude certainty than with high attitude certainty (the F tests show higher values for respondents with low attitude certainty throughout, and for the high-ability group, the moderator test is statistically significant: F = 2.16, p = .013). Similarly, regardless of whether respondents had little or good subject knowledge (panel 3), order effects were stronger for respondents with low attitude certainty than those with high attitude certainty (moderator test: little knowledge F = 1.53, p = .112; high knowledge F = 1.70, p = .071). Finally, for respondents with low attitude certainty (left-hand side of panel 2), order effects were significant regardless of the level of subject knowledge, and regardless of the level of cognitive ability. However, order effects were stronger when low attitude certainty was combined with little knowledge (moderator test: F = 2.38, p = .011), and stronger when low attitude certainty was combined with low ability (moderator test: F = 1.57, p = .114).
However, even for respondents with high attitude certainty (right-hand side of panel 2), there were significant order effects, meaning that in the 12-dimension condition there was no group that was clearly immune against order effects. 8
The other moderator variables showed no consistent effects. For instance, for respondents with high ability, order effects were stronger if they had little subject knowledge than if they had good knowledge (panel 1, moderator test: F = 1.59, p = .092). Conversely, for respondents with low ability, order effects were stronger if they had good knowledge (panel 1, moderator test: F = 1.74, p = .067). Similarly, there were no clear patterns regarding the combinations of knowledge with other moderator variables—with the exception of low attitude certainty always producing stronger order effects.
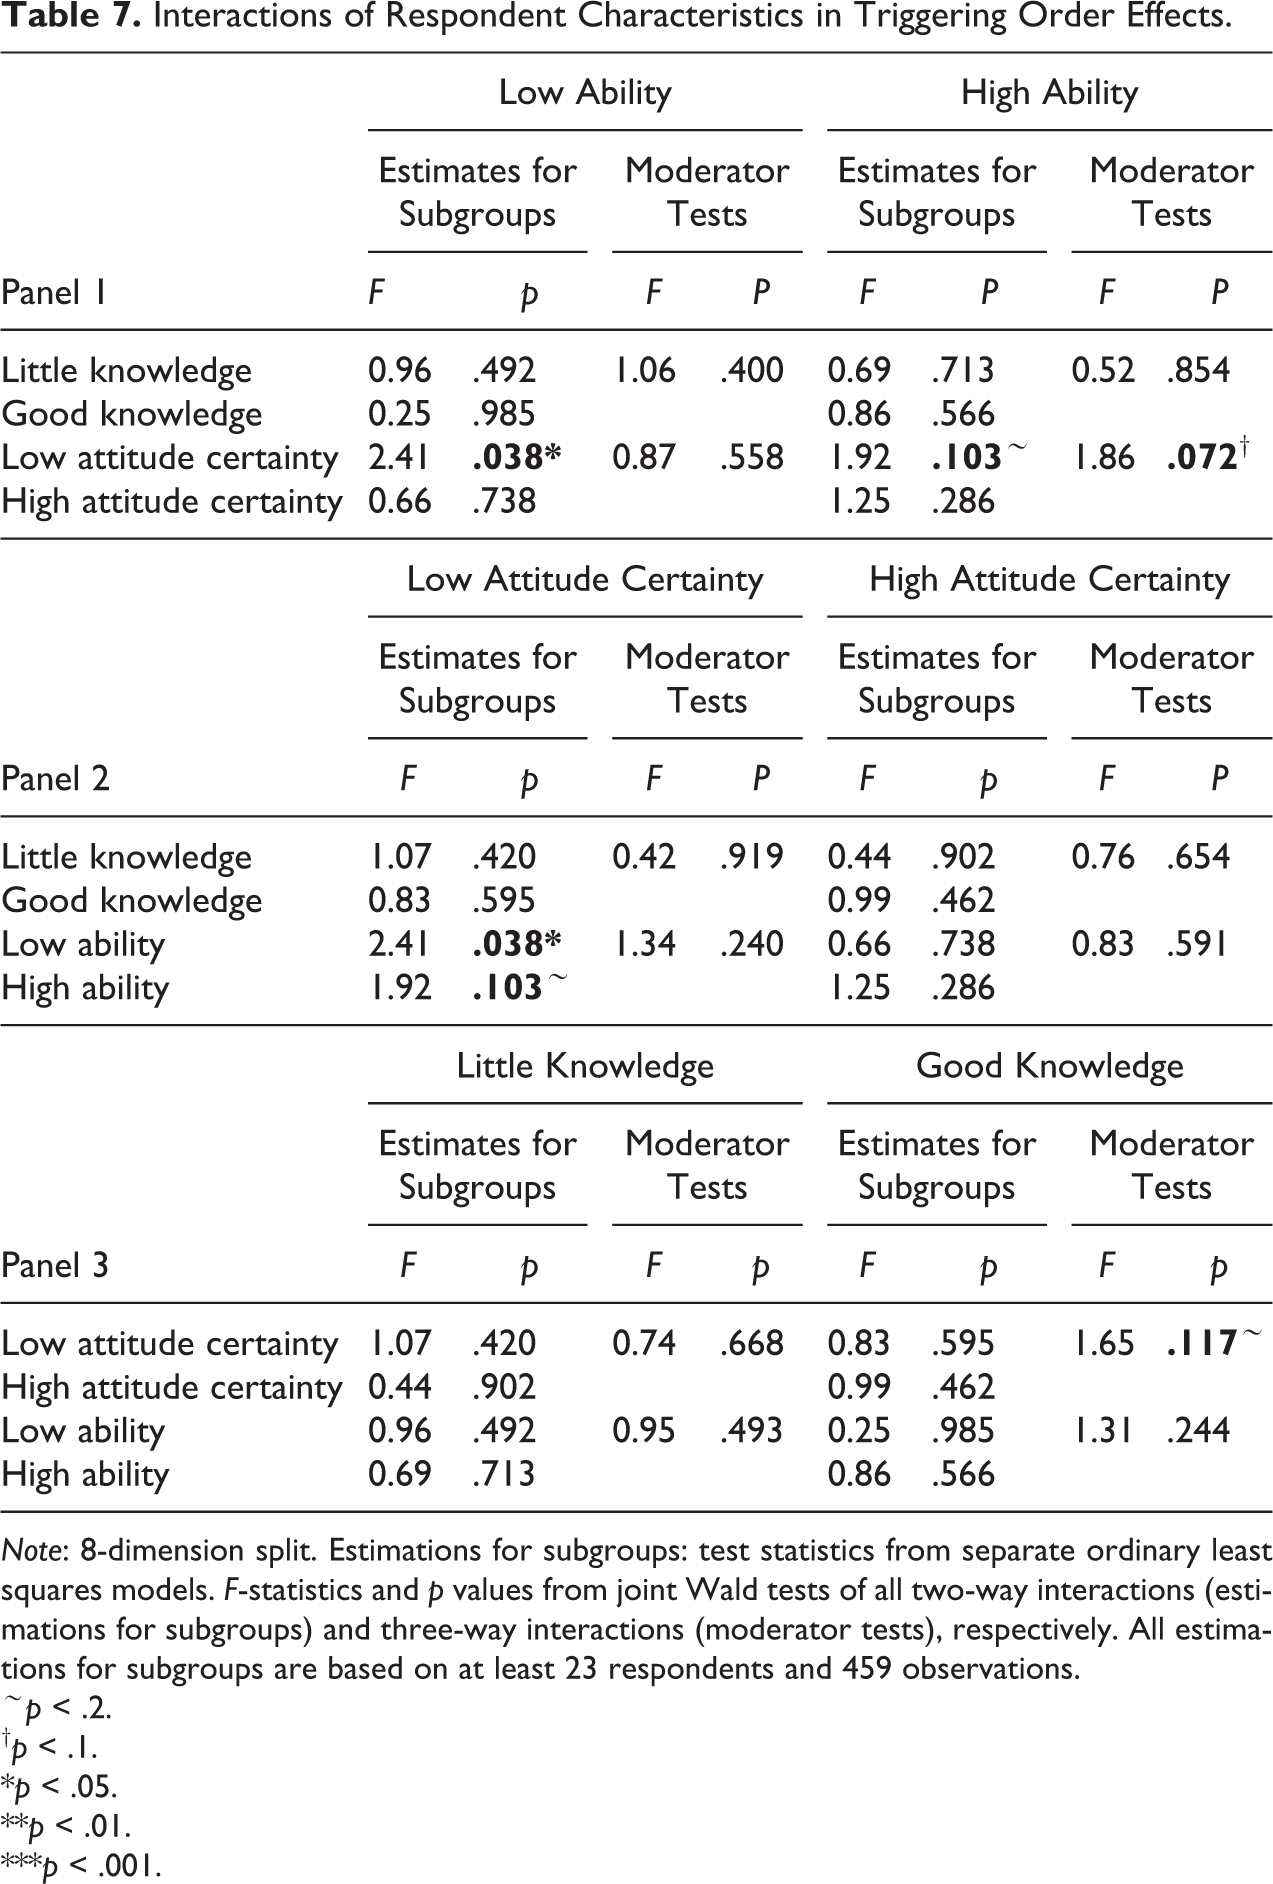
The results for the 8-dimension condition (Table 7) support the conclusion that low attitude certainty is the most important precondition for order effects, although the order effects were again weaker than in the 12-dimension condition reported in Table 6. Regardless of whether respondents had low or high ability (panel 1 in Table 7), order effects tended to be stronger for respondents with low than high attitude certainty. For about half of the respondent groups with low attitude certainty, 8 dimensions seemed to be complex enough to trigger significant order effects (see panel 2, left-hand side). For respondents with high attitude certainty, order effects were never significant, regardless of respondents’ level of ability or subject knowledge. Order effects were also not significant for any of the combinations of subject knowledge and ability.
The results therefore provide only partial support for the hypothesis that order effects are more pronounced when more conditions apply (Hypothesis 4).
Robustness Check
As a robustness test for our results, we verified that the effect of vignette complexity was not merely an artifact of the larger number of statistical tests performed with 12 rather than 8 dimensions. The dimensions for which order mattered according to Table 3 were all part of the core 8 dimensions—which suggests that the higher sensitivity for order effects in the 12-dimension condition was not merely caused by the lager number of dimensions tested (and therewith the increased risk of type I errors in significance testing). We additionally reestimated Tables 4 –6 using OLS regressions predicting fairness of earnings for the 12-dimension group, but testing the null hypothesis of no order effects (i.e., the joint Wald test of dimensions and their interaction with the order indicator) using only the core 8 dimensions. The results were comparable to those reported here, suggesting that the impact of vignette complexity is not a statistical artifact.
The order of vignette dimensions may have influenced responses to the questions about how important respondents thought the individual dimensions should be in determining a fair distribution of earnings, since these items were positioned “posttreatment” after the factorial survey module. If this was the case, the causality we assume could be reversed. That is, instead of order effects being driven by the importance of dimensions, order effects may have influenced the importance ratings. To test for such carry-over effects from the factorial survey module to the questions about dimension importance, we conducted a split-ballot experiment in a follow-up study. The survey included a factorial survey module that was the same as the order 1 condition in this study, and also included an 8- versus 12-dimension experimental split. The survey also included the same questions about the importance of the individual items as in this study. Half of the respondents were assigned to rate the importance questions after the factorial survey module (as in this study), and half were assigned to rate the importance questions first. We used two-sample t-tests to compare all 11 importance questions across the two sample splits. Only for 1 of the 11 importance questions, there was a significant difference in the mean rating (at 5 percent level), depending on whether respondents rated the importance before or after evaluating the vignettes. This was the rating of the importance of the vignette persons’ job experience: t = 2.005, df = 70, p = .049. We concluded that there is little evidence of carry-over effects (the mean p value summarized over all 11 questions was .480), meaning that one would probably have observed very similar results if the importance questions had been asked pretreatment.
For the two moderator variables “respondent knowledge” and “difficulty of the task,” metric instead of binary measurements could be used (i.e., the absolute distance to the true mean gross earnings, or the original values of the 11-point rating scale on difficulty). The binary coding was chosen to make the statistical power comparable to that of other moderator variables and to allow illustrating the effects in a meaningful way by means of subgroup comparisons across the resulting two splits (three-way interactions with metric variables do not allow straightforward interpretations because of the many different main effects and two-way interactions one has to consider). When reestimating Tables 5 –7 with metric measures, their higher statistical power means lower p values of moderator tests, and in Table 5, this leads to the effect of knowledge in the 8-dimensions condition becoming statistical significant, and the same is true for the effects of knowledge in the first panel of Table 7. But our main conclusions still hold: The effects of knowledge still reveal no clear pattern, and the evidence for both a high attitude certainty and a low difficulty reducing order effects becomes even stronger.
Finally, using ordered logistic regressions that act more conservatively in regard to the scale level of the dependent variable (assuming only ordinal but no interval scale level for the 11-point rating scale on the fairness of vignettes) or tobit models that take into account that the closed-ended rating scale might have led to censored responses revealed very similar effect sizes of regression coefficients for both dimension orders in Table 3. Because of their more straightforward interpretation, in particular regarding interaction effects (Ai and Norton 2003), we report only OLS results.
Conclusions
In this article, we examined whether the order of vignette dimensions affects research conclusions from factorial surveys—and under which conditions order effects are likely. Based on a review of the literature on order effects in surveys, and the limited existing literature on the design of vignette-based methods, we systematically examine the interaction of several risk factors, by examining how characteristics of the survey design and respondents interact to produce order effects. Although we study order effects in a factorial survey, the results are relevant to other vignette-based methods such as conjoint analysis and choice experiments and extend previous studies on those methods. The risk of order effects has so far been ignored for factorial surveys and our results have practical implications, which we discuss in the following.
The results first show that the order in which vignette dimensions are presented can affect research conclusions from factorial surveys. For a quarter of dimensions, the absolute impact on vignette evaluations changed significantly when dimensions were presented in an alternative order, and for some dimensions the relative importance also changed. Estimates of JPGs between men and women were 10-fold larger with one order than the other, and just returns to education where not affected. With the exception of respondents with low attitude certainty, the order of dimensions however only mattered when the response task was complex and vignettes either consisted of 12 instead of 8 dimensions, or included a second target question about each vignette. The result that only very complex vignette modules (with more than 8 dimensions) produce order effects corroborates prior research showing that the difficulty of the response task is an important moderator for both order effects in general and for methodological effects in factorial surveys. The fact that complexity is an important moderator might also explain why studies on conjoint analyses and choice experiments have only partly found evidence of order effects, and to our knowledge, there have so far been no studies testing the moderating effect of task difficulty.
The results second support hypotheses suggesting that respondent characteristics matter. Order effects were stronger for respondents who had low attitude certainty (which was defined as the extent to which one is confident or sure of one’s attitudes regarding justice evaluations)—but respondent characteristics mattered more when the vignette task was complex. Contrary to expectations and previous findings, respondents’ cognitive ability was not associated with order effects. Combinations of certain characteristics however increased the magnitude of order effects, especially for respondents with low attitude certainty. That is, the results suggest that task complexity is a precondition for order effects, that the effects are stronger if several risk factors coincide, and that low attitude certainty can trigger order effects even when there is low task complexity. These findings support one of our main assumptions and conclusions drawn by other authors that there is no simple theory to predict order effects (McClendon 1991). A new contribution to the literature is the finding that attitude certainty was by far the most important respondent characteristic, showing more consistent effects than respondents’ knowledge or ability.
Third, the magnitude of order effects varied depending on the sequential position of a vignette. Order effects tended to be larger for the first and last five vignettes respondents evaluated. This suggests a link between order effects and respondent learning and fatigue in the course of answering the 20 vignettes. This fits to previous research showing that in long questionnaires order effects are more pronounced for questions placed late in the questionnaire (Holbrook et al. 2007). Contrary to expectations, we found no evidence of primacy effects, that is, respondents did not appear to attach more importance to dimensions when they were listed first. This was similar to other studies of vignette-based methods, which were also not able to reveal a clear pattern of which positions are particularly prone to order effects. We also found no clear evidence that the importance of dimensions matters. Overall, dimensions considered most important by all respondents were immune to the order. The personal importance attached to dimensions was however not associated with order effects.
These findings have important implications for the interpretation of results from factorial surveys. If our results are replicated in other studies, researchers should be cautious when interpreting the effects of dimensions that are of minor importance and when reporting trade-offs between single dimensions. For respondents with high attitude certainty (e.g., experts on a topic), there appears to be little risk of order effects. Factorial surveys are however typically used for heterogeneous samples, since they enable an easy implementation of experimental approaches within population samples (Sauer et al. 2011; Wallander 2009). In such applications, order effects could be particularly problematic. Differences in the evaluations of respondents with low or high attitude certainty might partly represent their different sensitivity to order effects—instead of the differences in attitudes the researcher is interested in. Similarly, comparisons across different (international) surveys might be impaired by order effects.
The findings also have important practical implications for the design of factorial surveys. In order to reduce the risk of order effects, it is advisable to minimize the complexity of the evaluation task such that it is manageable for all respondents. Previous research suggests that vignettes consisting of about 8 dimensions are cognitively well manageable by respondents, not only for student samples but also for heterogeneous respondent samples (Sauer et al. 2011; Sauer et al. 2014). Similarly, asking only one question about each vignette, rather than two, reduces the risk of order effects. Alternatively, one could routinely randomize the order of vignette dimensions to neutralize any potential order effects. Randomizing the order of dimensions may, however, conflict with a smooth flow of vignette texts, especially when text instead of tabular vignettes is used. We return to this issue.
Our study has some limitations that point to the need for further research. First, as in other previous studies (e.g., Holbrook et al. 2007), we were only able to examine conditions under which order effects occur. We did not find evidence of hypothesized primacy or recency effects. Instead, we found significant order effects for dimensions placed in middle positions. However, the experimental design with only two alternative dimension orders did not allow testing more specific hypotheses about the underlying causal mechanisms and so we were not able to identify the causes of order effects in dimensions occupying middle positions. Further, the dimensions added to the 12-dimension condition included both dimensions that are known to be of high and of low importance to respondents. Nevertheless, some results might be specific to the dimensions that were added. Therefore, replications are needed with other factorial survey modules using other substantive topics and dimensions.
Second, our manipulations of complexity were to some extent confounded. Adding dimensions or a second question about the vignettes were both confounded with vignette length. Adding a second question was further confounded with asking an open rather than a closed question. Increasing the number of dimensions was confounded somewhat with the order of dimensions. Although for order 1 the first and the last dimensions were the same with 8 as with 12 dimensions, the position of the dimensions in between was altered by the four additional dimensions. The same was the case for order 2. There is no way of varying the number of dimensions without changing the order of some mid-positions when using standard tables that are symmetric in the number of lines per column. Future studies might, however, test different orders of vignette dimensions for each level of complexity, to reduce the confounding of both order and complexity effects. When varying the dimensions that are added to vignettes, further research could also try to design experiments that are better able to disentangle the effects of the number of dimensions versus the length of vignette texts. We used a very classic application of factorial survey modules, and hence typical text length for vignettes with 8 or 12 dimensions. Nevertheless, experiments trying to separate both aspects of complexity could shed more light onto the aspects of complexity that are most risky regarding order effects.
Third, the relatively small number of respondents meant that we were not able to perform detailed analyses of how order effects, learning and fatigue effects evolve, and interact, as respondents progress through the 20 vignettes. Initial analyses (grouping the vignettes into sets of five to increase sample sizes) suggested that there are some interactions: As respondents learn or become fatigued, they concentrate on fewer dimensions. At the same time, the extent of order effects decreases. For the final five vignettes, these effects tend to reverse again, with respondents taking account of a larger number of dimensions, and order effects increasing again. These changes in respondent behavior are consistent with our main results, suggesting that order effects are related to cognitive overburdening, which occurs when respondents try to incorporate more information into their decision making. Further studies could use larger numbers of respondents and/or vignettes to obtain more detailed insights into learning and fatigue effects. It is likely that order effects are stronger when respondents have to evaluate a larger numbers of vignettes. How the number of vignettes impacts on order effects is, however, an open question that remains to be tested.
Fourth, the fact that cognitive ability was not related to order effects is surprising given our findings that task complexity matters, and given previous research testing the effects of ability (e.g., Holbrook et al. 2007; Narayan and Krosnick 1996). This could be the result of either our homogenous student sample or our measure of ability. The student sample was used deliberately to avoid potential confounds in a population sample, where differences in cognitive ability are likely to be related both to true differences in the attitudes measured and to differences in the susceptibility to order effects. This nevertheless suggests the need to replicate a study of order effects using a general population sample, which would vary more in terms of cognitive ability. The measure of ability, using a self-assessment of student performance, was chosen because university grades are not necessarily comparable between the universities from which the sample was drawn. However, students may not have much information about their performance yet, as they were on average only in their third semester, and asking about their relative performance may be too vague a question to capture true differences in underlying capabilities. This suggests the need for using better measures of cognitive ability in future studies. Similarly, one might employ more fine-grained measurements of respondents’ knowledge, such as respondents’ knowledge of the determinants of earnings or of principles of justice.
Fifth, the vignettes in our study were presented in tabular format (as typically used in choice experiments and conjoint analysis), although factorial surveys typically present vignettes as running text. The tabular format was chosen because varying the order of dimensions is easier than in text format. It remains to be tested whether our results replicate when vignettes are presented in text format. More generally, it remains to be tested whether presenting vignettes in tabular format produces comparable data to text vignettes. To our knowledge, this has not been studied, neither for factorial surveys nor conjoint analysis or choice experiments. Our own initial analysis of an experiment related to the data used in this article suggests that with vignettes consisting of 8 dimensions, evaluations based on text and tabular formats are comparable. If confirmed and replicated, this finding would have important implications. Instead of the current standard text vignettes, it may be advisable to design factorial surveys using tabular vignettes, since that would allow mitigating any potential order effects by routinely randomizing the order of dimensions. All in all, our results suggest that researchers may need to be more concerned about order effects, not only in standard surveys but also with experimental vignette-based measurement.
Footnotes
Authors’ Note
This article uses data from the research project “The Factorial Survey as a Method for Measuring Attitudes in Population Surveys”. We thank Carsten Sauer and Stefan Liebig for their valuable support with data collection and Thomas Hinz and all reviewers for comments on earlier drafts of this article.
Declaration of Conflicting Interests
The author(s) declared no potential conflicts of interest with respect to the research, authorship, and/or publication of this article.
Funding
This article used data from the research project “The Factorial Survey as a Method for Measuring Attitudes in Population Surveys”, funded by the German Research Foundation (DFG) at the Universities of Konstanz and Bielefeld (Priority Programme 1292 on Survey Methodology; grant number HI 680/7-1). The authors received funding from the Konstanz-Essex Development Fund (project “Factorial Surveys: studying decision making and generating empirically based methodological guidelines”).
Notes
References
Supplementary Material
Please find the following supplemental material available below.
For Open Access articles published under a Creative Commons License, all supplemental material carries the same license as the article it is associated with.
For non-Open Access articles published, all supplemental material carries a non-exclusive license, and permission requests for re-use of supplemental material or any part of supplemental material shall be sent directly to the copyright owner as specified in the copyright notice associated with the article.