
Abstract
Background:
Reliability of nonprobability online volunteer panels for epidemiological purposes has rarely been studied.
Objectives:
To assess the quality of a questionnaire on sexual and reproductive health (SRH) administered in a nonprobability Web panel and in a random telephone survey (n = 8,992; n = 8,437, age 16–49 years). Especially, we were interested in the possible difference in the association of sociodemographic variables and some outcome variables in the two surveys that are in the reliability of analytical epidemiological studies conducted in such panels.
Methods:
Interventions to increase response rate were used in both surveys (four e-mail reminders, high number of call attempts and callbacks to refusals). Both were calibrated on the census population. Sociodemographic composition, effects of reminders, and prevalence were compared to their telephone counterpart. In addition, the associations of sociodemographic and sexual behaviors were compared in the two samples in multivariate logistic regressions.
Results:
The online survey had a lower response rate (20.0 percent vs. 44.8 percent) and a more distorted sociodemographic structure although the reminders improved the representativeness as did the analogous interventions on the telephone survey. Prevalences of SRH variables were similar for the common behaviors but higher online for the stigmatized behaviors, depending on gender. Overall, 29 percent of the 63 interactions studied were significant for males and 11 percent for women, although opposite effects of sociodemographic variables were rare (5 percent of the 171 tested for each gender).
Conclusion:
Nonprobability online panels are to be used with caution to monitor SRH and conduct analytical epidemiological studies, especially among men.
Introduction
Internet surveys are appealing to survey designers in the current context of decreasing participation rates to traditional survey modes and especially the telephone (Lan 2009; Schouten, Cobben, and Bethlehem 2009) as well as the increasing households equipment rates in most developed countries (De Leeuw, Hox, and Dillman 2008; Dillman 2007; Internetworldstat 2014). Survey agencies have thus developed large online panels that offer the opportunity to conduct surveys at reduced costs and with reduced fieldwork durations, mostly for marketing purposes. Except for some limited cases (the Longitudinal Internet Studies for the Social sciences panel in the Netherlands http://www.lissdata.nl/lissdata/, the German Internet Panel http://reforms.uni-mannheim.de/internet_panel/home/, the Longitudinal Internet Studies for the Social sciences panel in France http://elipss.fr/elipss/recruitment/, the German Social Science Infrastructure Services panel in Germany http://www.gesis.org/en/services/data-collection/gesis-panel/, and the knowledge panel in the United States http://join.knpanel.com/), the panels rely on volunteers and are not probability based. Potential panel members are recruited through various protocols (phone and invitations on popular Web pages). Based on their responses to a sociodemographic screening, they are selected to become a panel member (following Coupers’ typology of Web surveys, we refer here to online access panel type; Couper 2000: 477). This process and the size of the panels (more than hundreds of thousands of members) guarantee a sociodemographic diversity of the members and is used as a claim of representativeness on which to rely.
Online access panels are also appealing because they may offer a more suitable setting for the reporting of sensitive behaviors. Data collection modes differ indeed in communication channels (verbal, nonverbal, and paralinguistic), in media-related factors (familiarity with the medium, social conventions of the interaction, if any, between interviewer and interviewee, etc.), and in interviewer effects (clarifications and motivations provided through the interview; inhibition of socially undesirable answers; see De Leeuw 2008 for an overview). The modes of data collection affect respondents’ answers by influencing the amount of effort needed to answer the question or respondents’ willingness to answer questions honestly (Holbrook, Green, and Krosnic 2003). The first type of influence can lead to a range of response errors referred to as “satisficing effects” (Krosnic 1991), while the second type of influence can lead to a tendency to give socially desirable answers. It is admitted that self-administered questionnaires, including online self-administered questionnaires, lead generally to lower social desirability bias compared to telephone and face to face, explaining the higher prevalences of reported stigmatized behaviors on the online sample (Dayan, Schofield Paine, and Johnson 2009). This may be judged favorably, although research found that item nonresponse and “don’t know” responses could also be favored in the online mode (Heerwegh and Loosveldt 2008), leading to lower-quality data. Given the fact that panel members participate regularly and in exchange for financial incentives, they may become professional respondents and not respond the same way than average people.
Most of all, nonrandom sampling of participants raises concern over selection bias. Bias is primarily caused by limited and uneven Internet coverage, exposure to the invitation to participate, self-selection in the recruitment phase of new panel members, and finally nonresponse to the survey that is administered within the panel. Recently, a report by the American Association for Public Opinion Research (AAPOR) summarized the state of the art regarding the online panel surveys and their postdata collection statistical treatments (AAPOR 2013). Two main weighting strategies are generally used: poststratification or calibration on one side and propensity score weighting on the other, but both can be mixed. The first set of methods aims at producing the same totals on auxiliary variables than the known totals of the target population, mainly sociodemographic characteristics that are obtained through very large and unbiased surveys or census, such as age ranks, sex, educational level, nationality, place of residence, and so on. The assumption is that these sociodemographic variables are linked both to panel recruitment and survey participation and with the variables of interest: Thus, with correct sociodemographic margins, the estimates of the variables of interests will be unbiased (Dever, Rafferty, and Valliant 2008). The second method is based on the work of Rosenbaum and Rubin (1983). Using a reference survey that is pooled with the online survey (for the identical questions), it is possible to model the probability of being respondent in the online survey instead of in the reference survey (i.e., the propensity score); then the panel sample can be matched to the reference sample or can be weighted according to the propensity score: The matched (or the weighted) online sample and the reference sample are then balanced according to the covariates introduced in the propensity score modeling. This method allows introducing sociodemographic variables as well as other supplementary variables called webographic variables (Schonlau, Van Soest, and Kapteyn 2007). These latter variables, generally opinions on various social subjects or Internet practice, may help correcting the selection bias of the online recruitment and of the online survey. However, a poststratification or a calibration procedure is still needed after or before this method—evidences are not very clear on the order (Loosveldt and Sonck 2008; Valliant and Dever 2011). The conclusion of the AAPOR report is that the results of both methods are mitigated, depending on the thematic of the surveys, the variables used for the weighting, the online survey characteristics, and so on. But many articles find that both methods tend to reduce the biases in estimates derived from the online surveys, although they might also increase some biases (Dever et al. 2008; Lee and Valliant 2009; Loosveldt and Sonck 2008; Schonlau et al. 2009; Valliant and Dever 2011).
In light of these limitations, the balance between efficiency and risks of bias related to the use of large convenient panels for public health research remains an open question. There have been attempts to use these online access panels for collecting epidemiological and health surveillance data (Ekman et al. 2006; Ekman and Litton 2007; Henry et al. 2010; Link and Mokdad 2005; Marcus et al. 2012) but few in Europe, especially concerning sensitive topics (Dayan et al. 2009). Surveying online without any interviewer who can potentially (although not voluntarily) influence the respondents may be viewed as an advantage for the most sensitive and personal topics. On the opposite, the usually recommended duration of the questionnaires is shorter online than in face-to-face or in telephone surveys, which can be a limitation for the development of these research. Additionally, Internet is still developing in many countries, practices are changing, and studies need to be replicated in various national contexts.
Most methodological studies comparing online surveys to a reference survey focus on the biases of the estimates, while studies about variance estimation on nonprobability surveys are scarce (Isaksson and Lee 2005; Lee and Valliant 2009). But some questions remain open: Is it possible to conduct long and complex surveys on sensitive topics in an online access panel and to draw reliable conclusions about the associations between the sociodemographic variables and the variables of interest? A positive answer would give some confidence in using access panels to explore topics before setting up a random survey or to conduct complementary epidemiological surveys. Secondly, while weighting a nonprobability sample to ensure some representativeness based on a set of observed variables is always possible, we do not have any clues about the robustness of statistical associations in two samples with different data collection modes. To answer these questions, we compared survey responses obtained from an online access panel to those of a reference national survey using random digit dialing. The reference survey—the fertility, contraception, and sexual dysfunction (
The aim of this online experiment was to (1) test the feasibility of conducting a long and complex questionnaire exploring sensitive research topics on the Internet, (2) test the effectiveness of a reminder procedure for nonrespondents and compare its potential effect to those observed in the telephone
Methods
Presentation of the Phone Reference Survey
The
The sample was obtained by a two-stage sampling procedure (household and interviewee) stratified by phone type (landline and mobile phones). Only one person was selected per household. Random digital dialing was used to generate the phone numbers. A letter of information was sent to all households whose phone number appeared in the phone directory. The same letter was read or sent by e-mail during the interview for those who had not received it. To improve response rate, a systematic recall of refusals was conducted. In addition, a high number of call attempts was allowed in order to increase the chances of including hard to reach populations. Practically, 9.9 percent of the questionnaires were obtained after 21 calls or more, and 18.9 percent of the questionnaires were obtained after recall of initial refusals. This survey was carried out by phone between June 2010 and January 2011, covering 145 working days of fieldwork. The final participation rate was 44.8 percent; nearly 30 percent of numbers never answered, while 20.2 percent maintained their refusal to participate in the survey and 5.1 percent were impossible to interview (language problems and prolonged absence). In addition, 3.8 percent of respondents did not complete the full questionnaire. The complete methodology has been presented elsewhere (Legleye et al. 2013).
The age rank was 15–49 but in this article, due to comparability reasons with the online survey, only the 16- to 49-year-old were retained for the analysis (208 questionnaires among the 8,645 were discarded).
Presentation of the Online Panel
The online FECOND survey is the replication of the previous survey on an access panel of a large survey agency that comprised more than 450,000 individuals in France (age 16+) at the time of the survey. The panel is recruited by various ways: invitations on popular Web sites (eventually with an incentive to recruit the people) or during random telephone interviews conducted by the survey agency. Before entering the panel, the volunteer is asked a series of questions dealing with some basic sociodemographic characteristics, such as age, sex, occupation, diploma, and so on. The registration is validated after the volunteer has signed a contract with the firm. Members are rated on their participation as well as on the coherence of their answers to some questions and those with bad marks are excluded. Each panel member is asked by e-mail to participate each week (or almost) in a short survey (no longer than 20 min), and he or she receives vouchers for his or her participation, whose amount is proportional to the survey length (5 euros for 20-min questionnaire). It is worth recalling that the latest data on Internet equipment showed that in 2012, 79 percent of the individuals from the general population have access to Internet at home (Gombault 2013) and that the equipment rate is above 90 percent for the 16- to 49-year-olds.
Sampling and Contact Procedure in the Online Survey
For the present study, the sample of participants was randomly selected from the panel, after stratification by sex, educational level (low: less than high school, medium: high school, and high: college or university degree), and age (16–19, 20–24, 25–29, 30–34, 35–39, 40–44, and 45–49) with proportional allocation. Selected individuals were divided into three independent blocks that were successively used exhaustively to build the respondents’ sample. This latter procedure mimics the usual sampling procedure in random telephone surveys. The total sample size was 45,000. In the FECOND online survey, the study was first announced by an e-mail, written and signed by the principal investigators that described the main objectives of the survey. The e-mail also indicated respondents would receive a voucher proportional to the length of the questionnaire. Additionally, the e-mail also mentioned that no other survey would be proposed to the sampled panel members during two weeks. This was decided in order to maximize the participation rate. Finally, the panel members had 4 weeks to participate: a follow-up e-mail (reminder) was sent each week until the end of the data collection, which was also unusual. We preferred this method over the classical method of quotas in order to avoid replacement, over self-selection of the respondents, and to allow for reminders. This method also makes possible some control over the fieldwork process and allows computing response rates, although not exactly the same as for probability-based surveys (Callegaro and Disogra 2008). Of course, it cannot correct for the selection bias in the panel membership. The size of the respondents’ sample was 8,992 (complete questionnaires).
FECOND Survey Instrument
The online and telephone surveys used the same survey instrument to investigate a range of SRH outcomes, including current contraceptive use, pregnancy histories, including abortions and sexual orientation, and sexually transmissible infections. The questionnaires were identical except the necessary adaptations to accommodate self-administration as opposed to computer-assisted telephone interview. In addition, a few coherence checks were added to the online survey in order to validate the key responses generating important skip patterns.
Measures
In this study, we consider eight key sociodemographic characteristics available in the French census (sex, age, country of birth, educational level, employment status, household size, living situation, and place of residence) to assess the representativeness (or the distortion) of the respondents sample. We then consider nine key sexual and reproductive outcomes, which represented common sexual behaviors (sexual intercourse in the last 12 months and the last sexual intercourse with regular partner), stigmatized behaviors (same-sex sexual intercourse and sexual violence), and gender-differentiated behaviors (abortion and multiple partners).
Weighting Procedures
Nonuniversal coverage and nonresponse are common in general population surveys. They are usually addressed by poststratification procedures, which consist of weighting the sample to reflect the structure of the target population (Haziza 2009). Weights were calibrated to correct for sampling distortion using the French census as the target population. We used a specific type of calibration adjustment with the SAS® macro called calibration on margins from the French National Institute for Statistics and Economic Studies available online from http://www.insee.fr (Sautory 2003). The variables considered were sex, age (seven categories), educational level (five categories), employment status (two categories), birthplace (two categories), living situation (three categories), household size (four categories) and place of residence (five categories), with no interaction (variables categories are as detailed in Table 1). This procedure was applied identically to both phone and Internet samples and the choice is discussed below.
Sociodemographic Profile of Respondents in Each Sample and by Efforts Allocated to Interview (%, Second-order Rao-Scott χ2 Distance, and p Value).
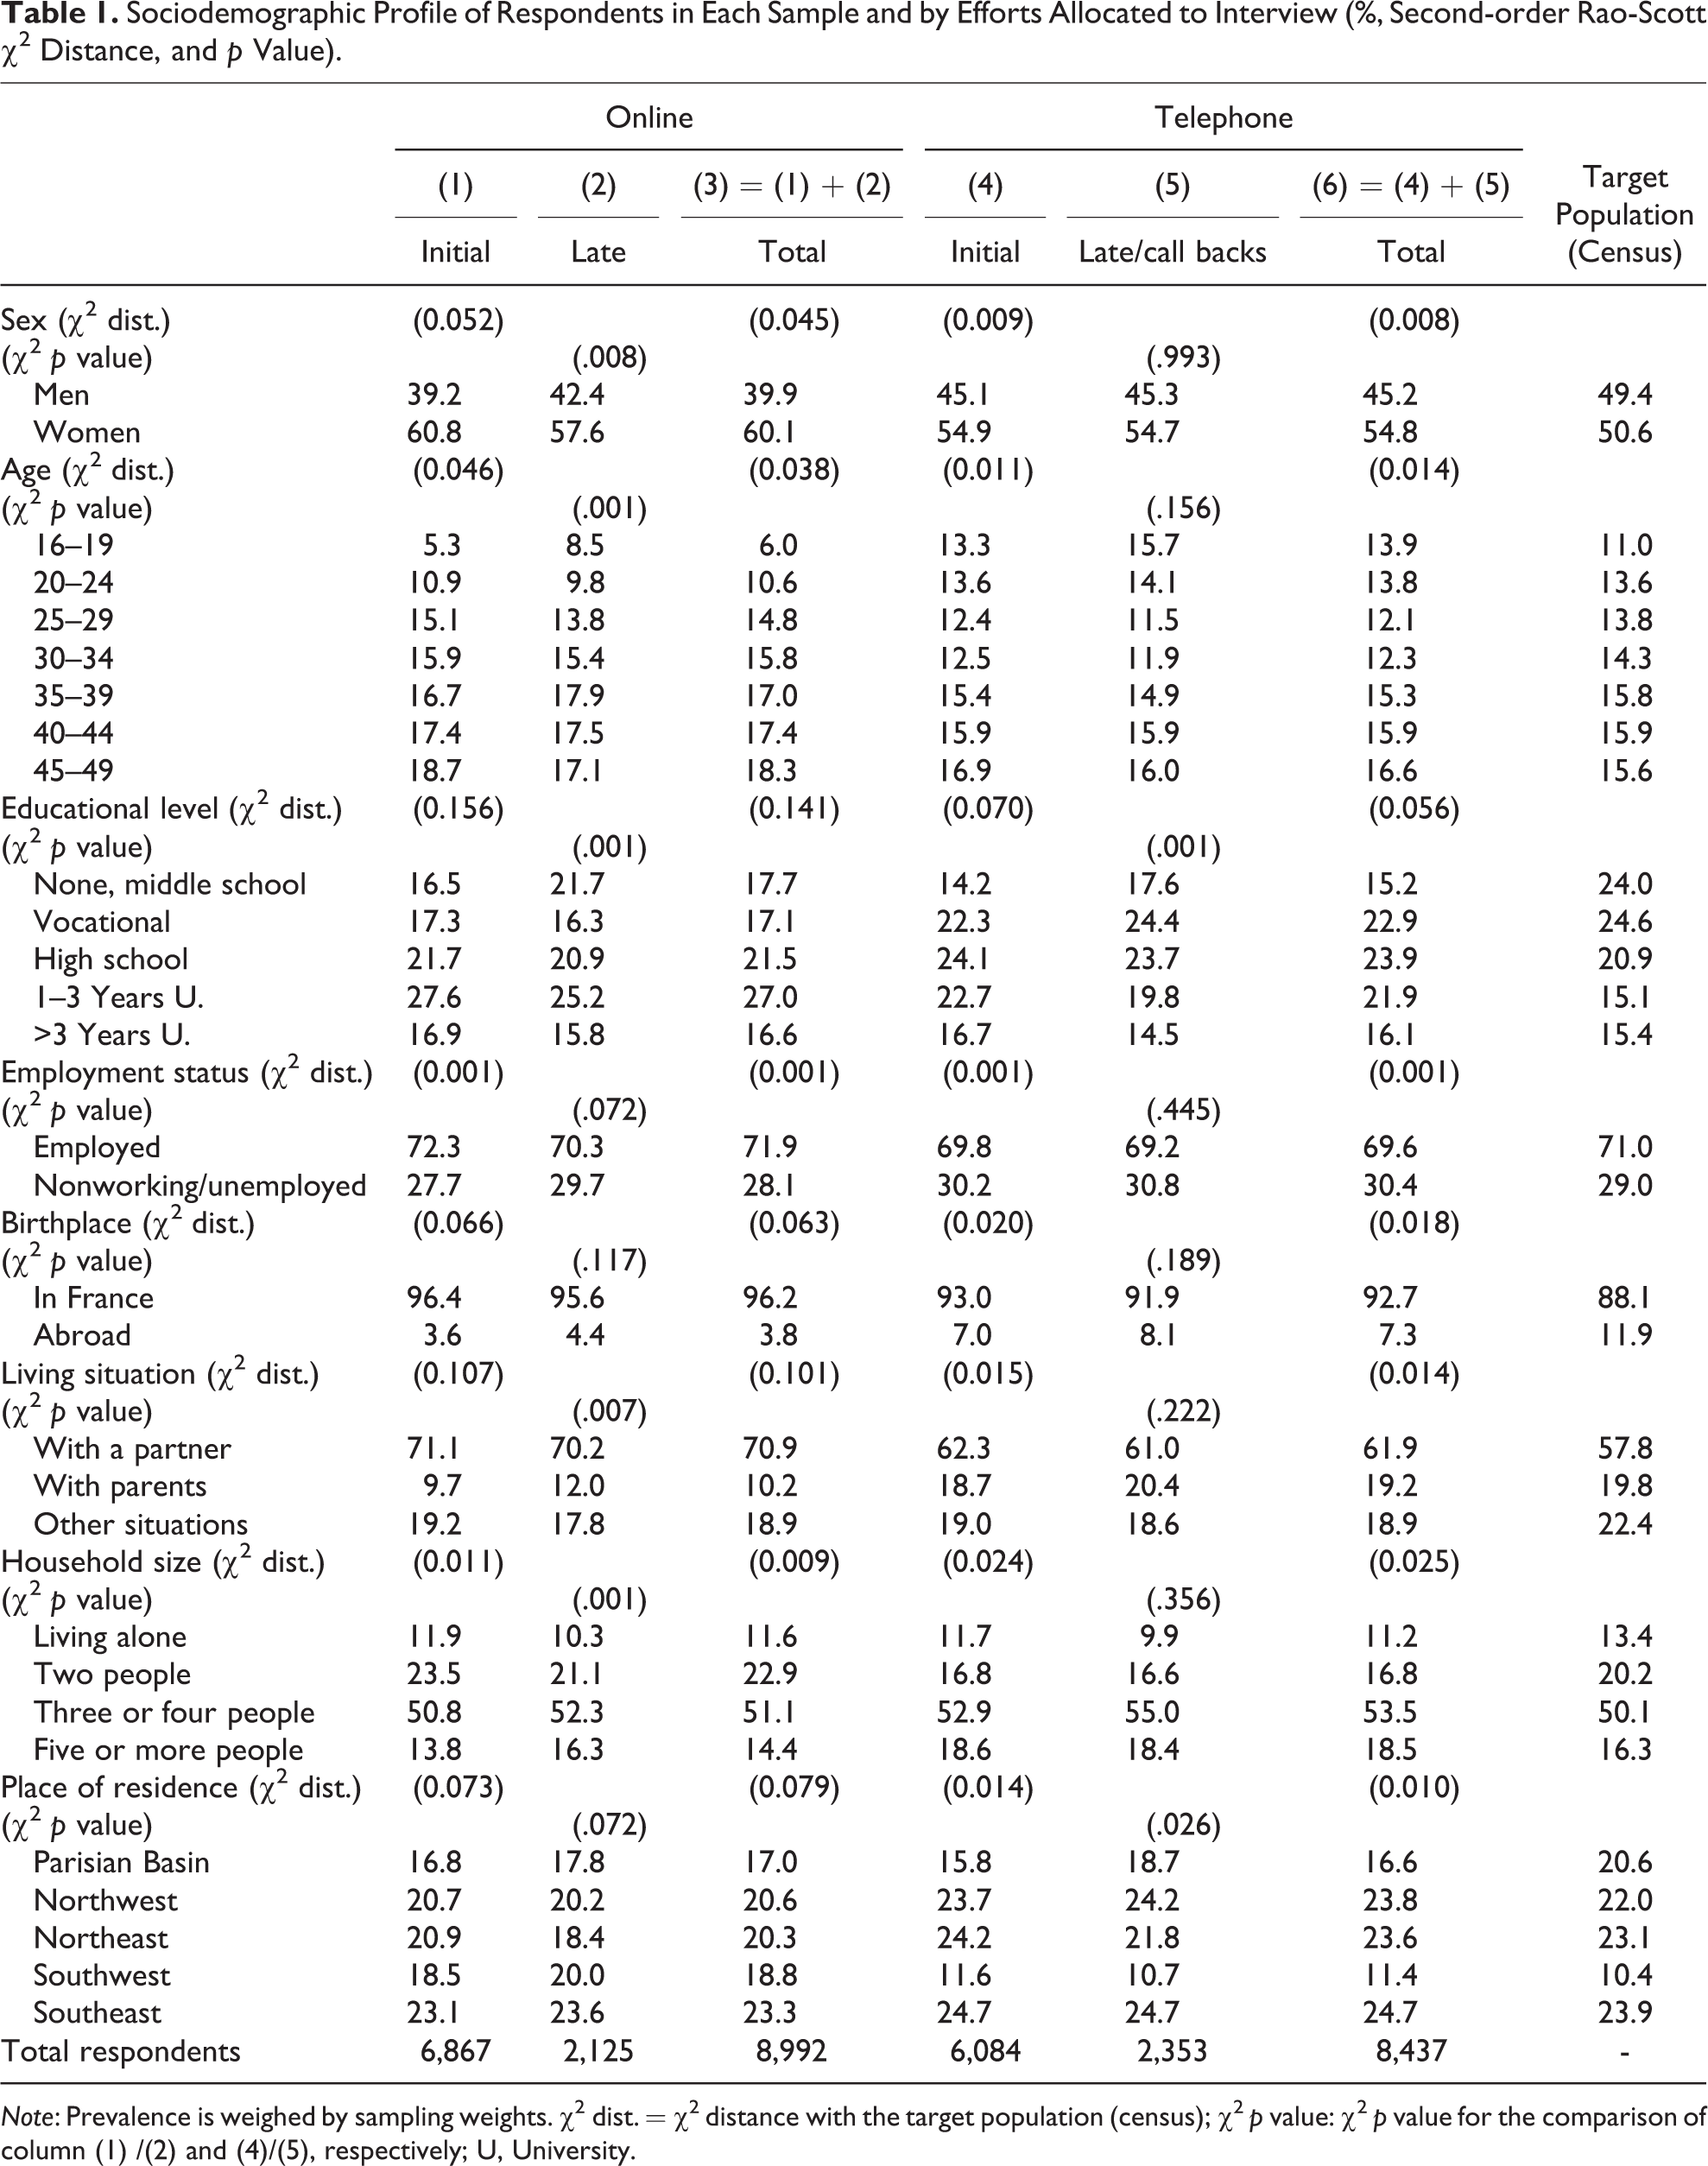
Note: Prevalence is weighed by sampling weights. χ2 dist. = χ2 distance with the target population (census); χ2 p value: χ2 p value for the comparison of column (1) /(2) and (4)/(5), respectively; U, University.
Statistical Analysis
The first part of the analysis seeks to assess the differences in sampling distortion between the online and telephone surveys, by comparing each sample (before calibration but with sampling weights) with the structure of the general population living in France based on the 2008 census. The comparison considers the eight major sociodemographic characteristics (see above). We use a χ2 distance that is the second-order Rao-Scott χ2 divided by the sample size to provide an aggregated measure of the distortion of one sample in reference to the target population: the lower the distance, the lower the distortion, the better the representativeness for this variable. This measure permits comparisons between two samples of different sizes (it is not affected by sample size as is the classical χ2 statistics) and it takes the complex sampling of the surveys into account (Aguirre-Torres 1994; Scott 2007). Our secondary goal is to estimate the effect of late respondents in the online survey (those who participated only after a reminder) on the structure of the total online sample and compare this effect to the analogous effect of including hard to reach respondents in the telephone survey (late respondents or those who initially refused). This was done by using second-order Rao-Scott χ2 tests, in order to take the complex sampling into account. The results are presented in Table 1. Please note that the use of the classical Pearson χ2 did not change the conclusions for this part of the analyses.
The calibrated prevalences of several SRH indicators in the two samples are presented in Table 2. Finally, we compared the associations of sociodemographic variables and some key variables of interest in the two samples (Tables 3 –6). This was done using multivariate weighted logistic regressions with bivariate interactions: The two samples were pooled and one model was run for each outcome and each gender separately.
Prevalence of Some Variables of Interest (Calibrated Samples).

Note: Pearson χ2 p value for the comparison of the calibrated online sample and the calibrated telephone sample.
a(%online − %telephone)/%telephone.
Associations Between Sociodemographic Variables and the Common Sexual Behaviors According to Data Collection Mode (Multivariate Logistic Regressions) for Men (Logit Coefficients and p Values).
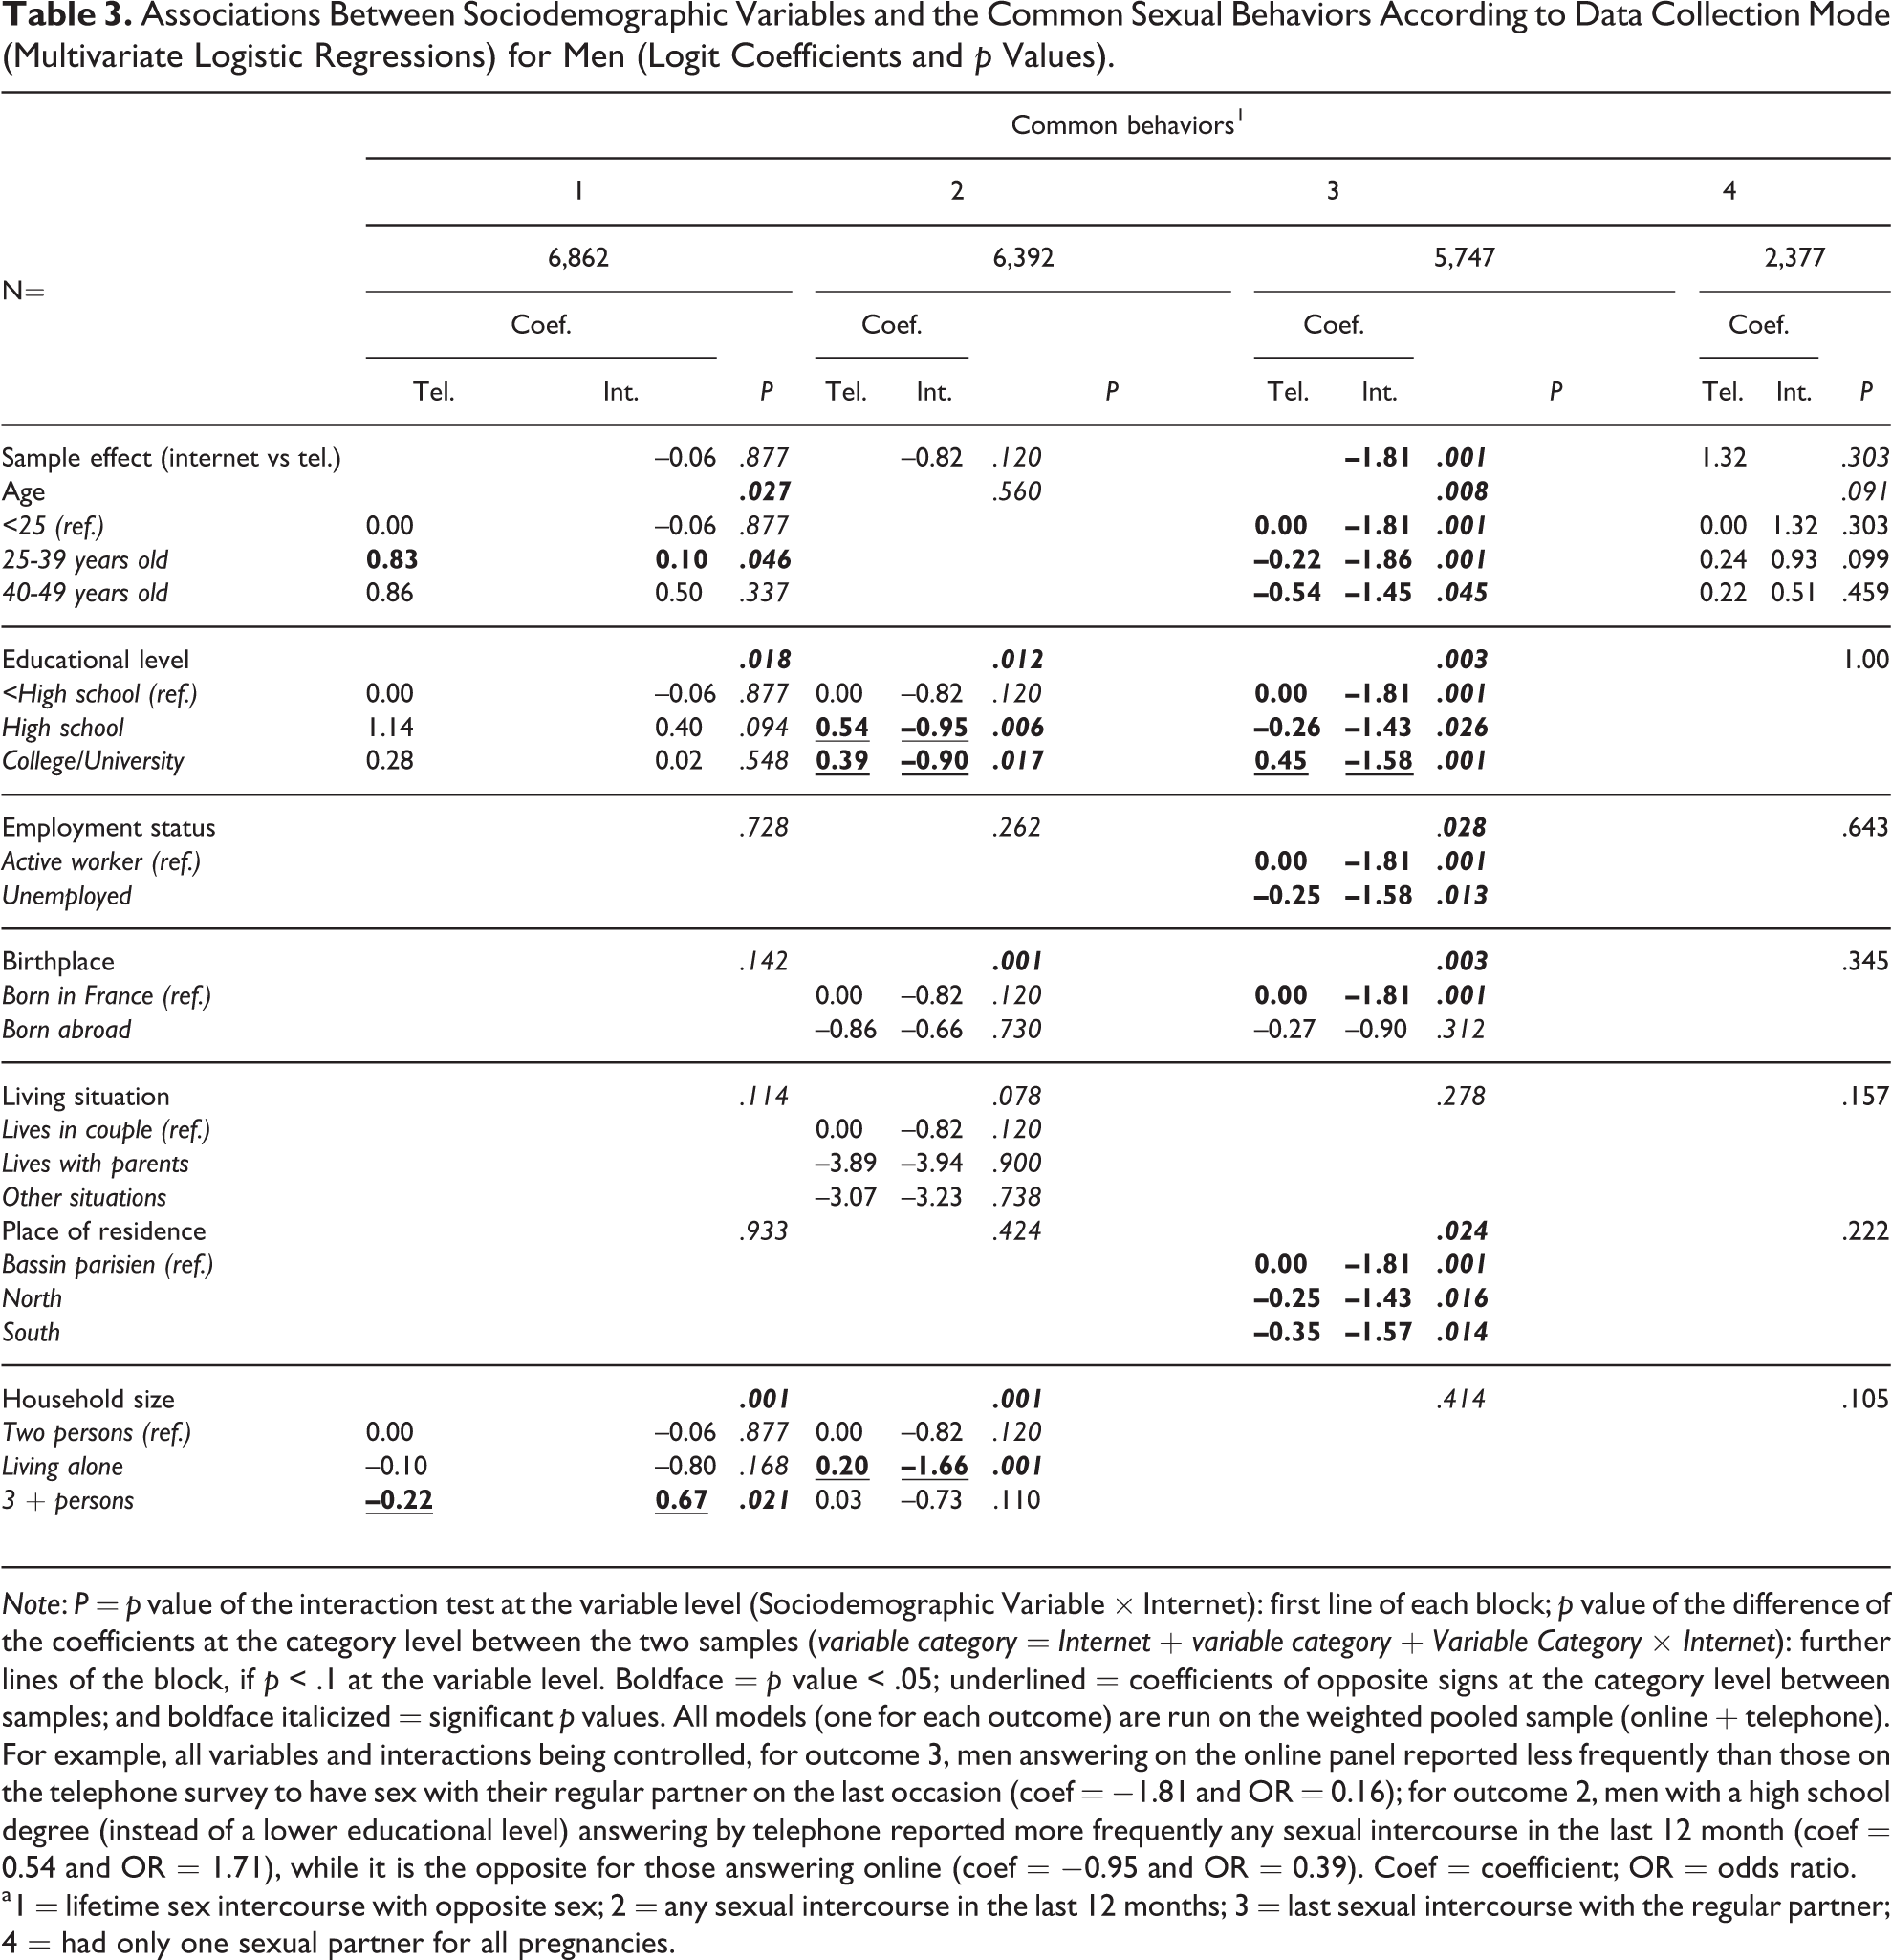
Note: P = p value of the interaction test at the variable level (Sociodemographic Variable × Internet): first line of each block; p value of the difference of the coefficients at the category level between the two samples (variable category = Internet + variable category + Variable Category × Internet): further lines of the block, if p < .1 at the variable level. Boldface = p value < .05; underlined = coefficients of opposite signs at the category level between samples; and boldface italicized = significant p values. All models (one for each outcome) are run on the weighted pooled sample (online + telephone). For example, all variables and interactions being controlled, for outcome 3, men answering on the online panel reported less frequently than those on the telephone survey to have sex with their regular partner on the last occasion (coef = −1.81 and OR = 0.16); for outcome 2, men with a high school degree (instead of a lower educational level) answering by telephone reported more frequently any sexual intercourse in the last 12 month (coef = 0.54 and OR = 1.71), while it is the opposite for those answering online (coef = −0.95 and OR = 0.39). Coef = coefficient; OR = odds ratio.
a1 = lifetime sex intercourse with opposite sex; 2 = any sexual intercourse in the last 12 months; 3 = last sexual intercourse with the regular partner; 4 = had only one sexual partner for all pregnancies.
Associations Between Sociodemographic Variables and Stigmatized and Gendered Behaviors According to Data Collection Mode (Multivariate Logistic Regressions) for Men (Logit Coefficients and p Values).
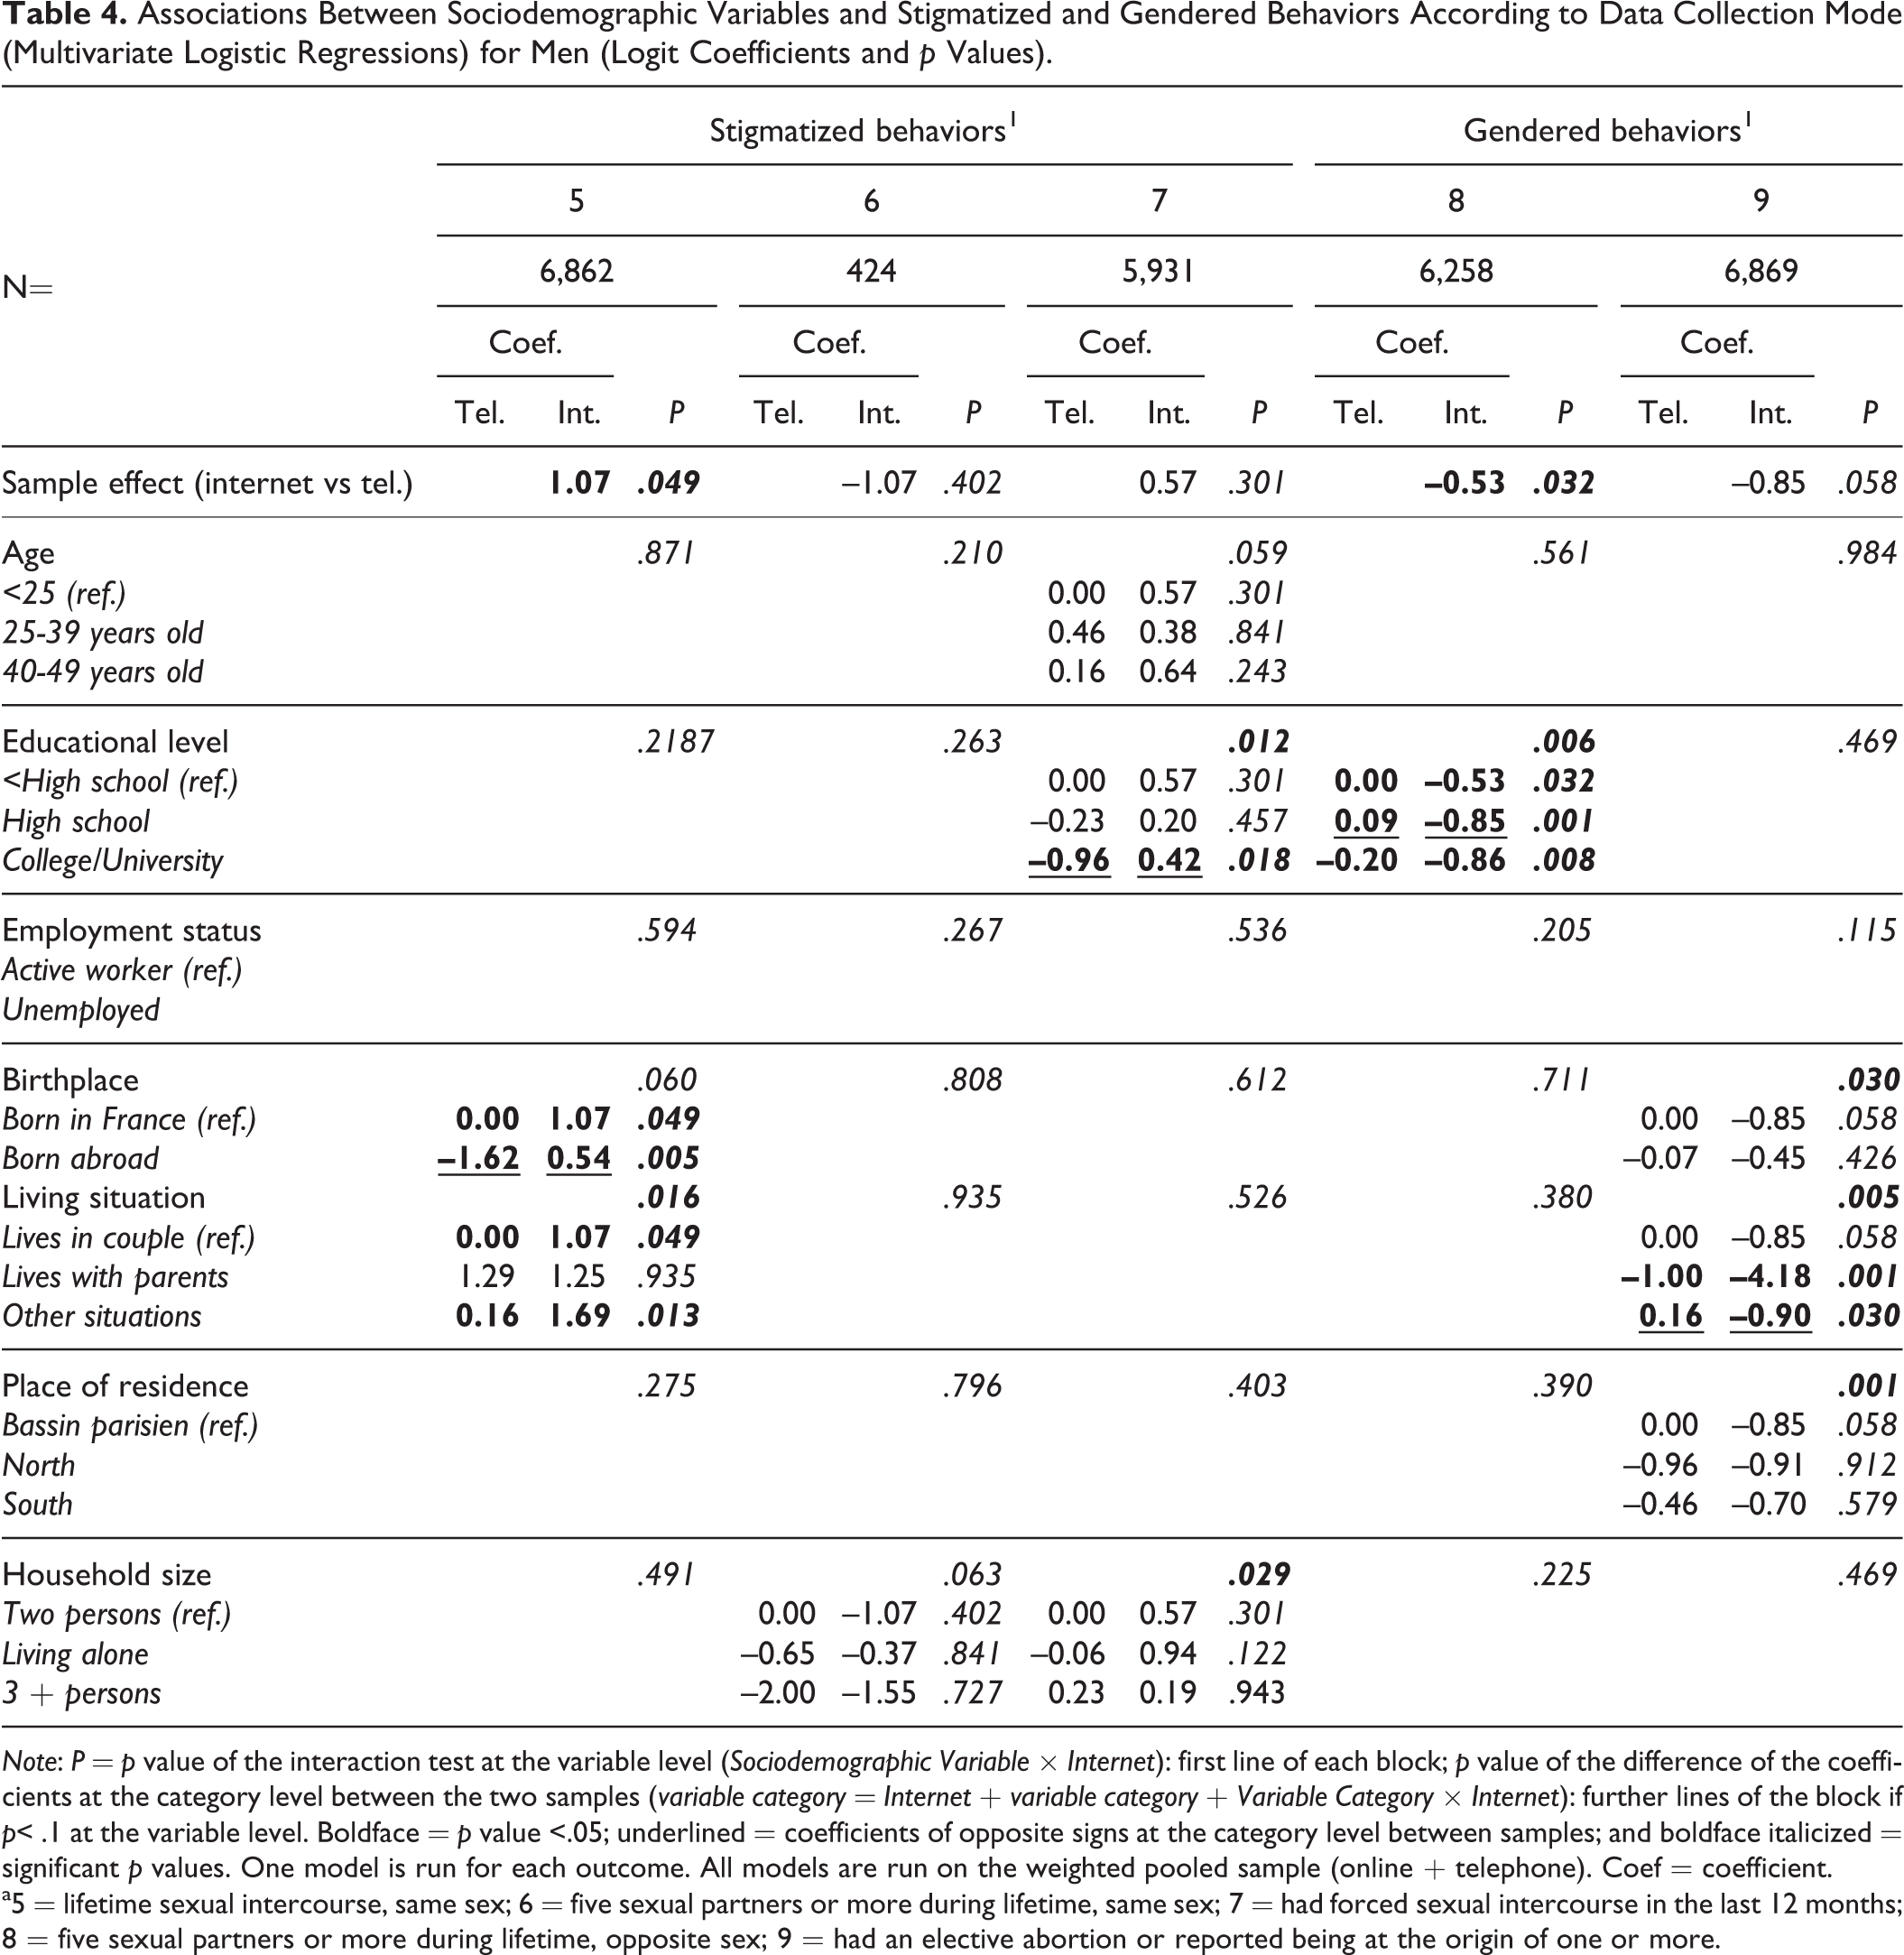
Note: P = p value of the interaction test at the variable level (Sociodemographic Variable × Internet): first line of each block; p value of the difference of the coefficients at the category level between the two samples (variable category = Internet + variable category + Variable Category × Internet): further lines of the block if p< .1 at the variable level. Boldface = p value <.05; underlined = coefficients of opposite signs at the category level between samples; and boldface italicized = significant p values. One model is run for each outcome. All models are run on the weighted pooled sample (online + telephone). Coef = coefficient.
a5 = lifetime sexual intercourse, same sex; 6 = five sexual partners or more during lifetime, same sex; 7 = had forced sexual intercourse in the last 12 months; 8 = five sexual partners or more during lifetime, opposite sex; 9 = had an elective abortion or reported being at the origin of one or more.
Associations Between Sociodemographic Variables and Common Sexual Behaviors According to Data Collection Mode (Multivariate Logistic Regressions) for Women (Logit Coefficients and p Values).
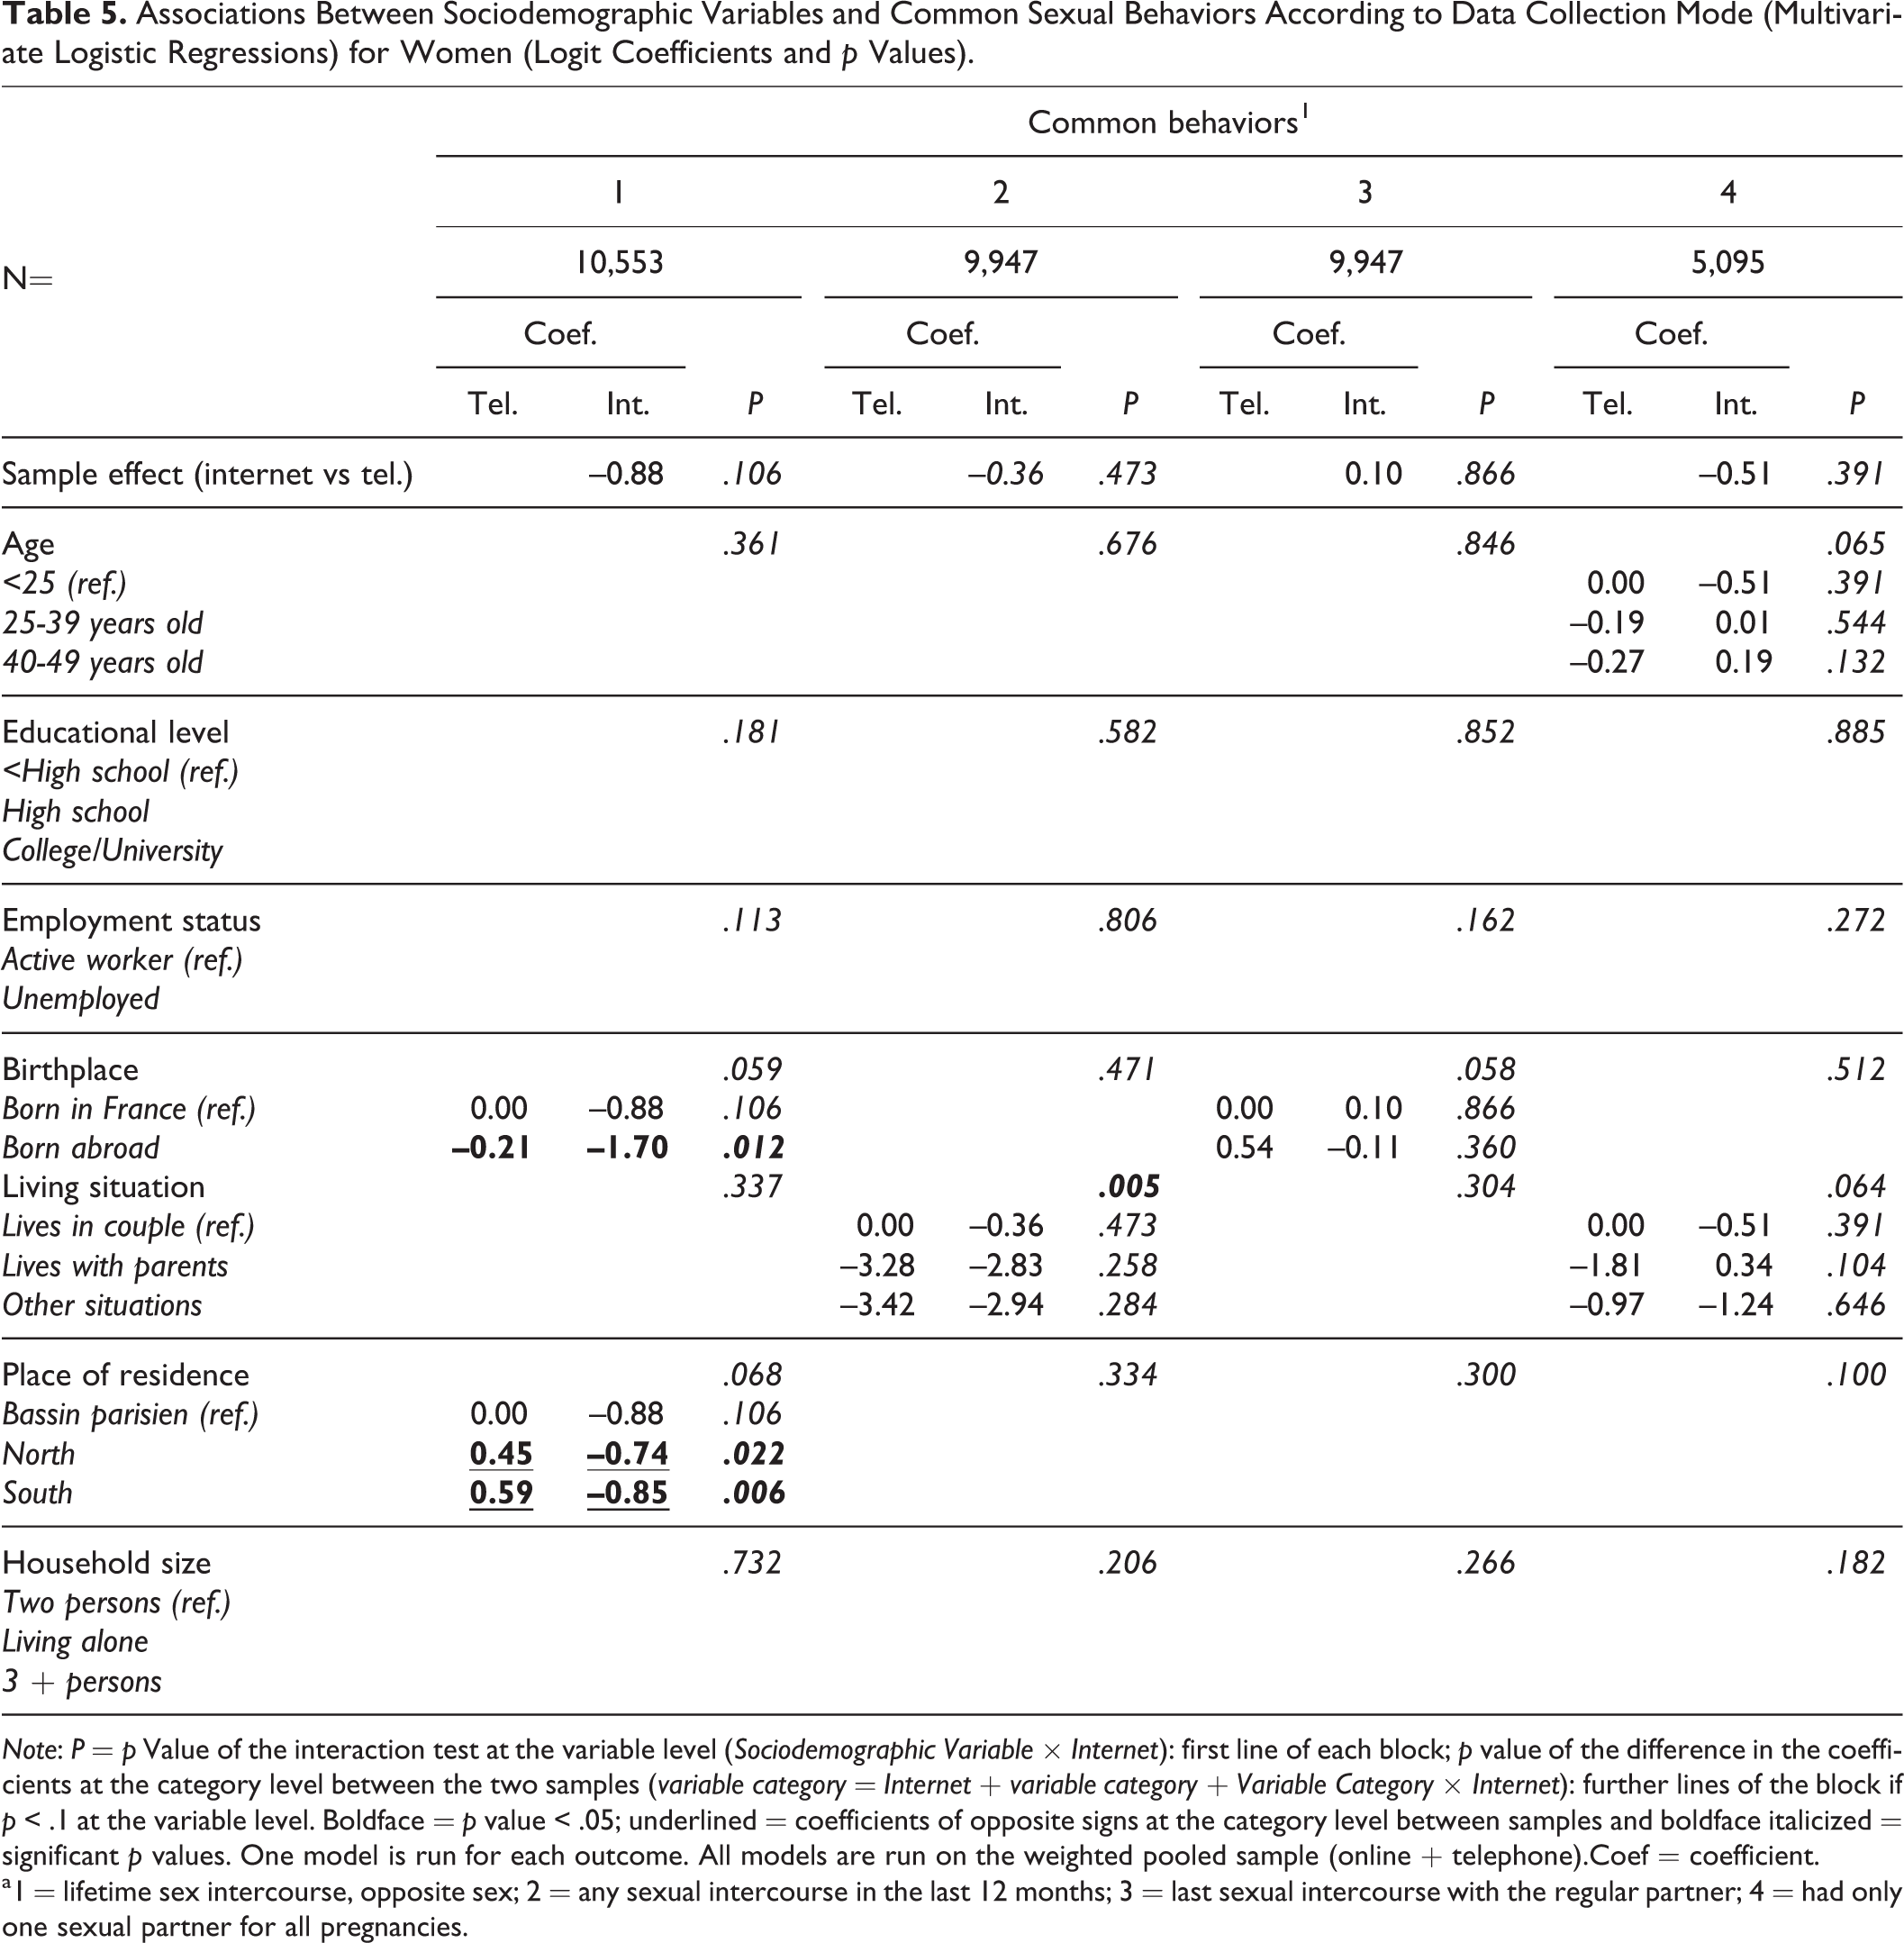
Note: P = p Value of the interaction test at the variable level (Sociodemographic Variable × Internet): first line of each block; p value of the difference in the coefficients at the category level between the two samples (variable category = Internet + variable category + Variable Category × Internet): further lines of the block if p < .1 at the variable level. Boldface = p value < .05; underlined = coefficients of opposite signs at the category level between samples and boldface italicized = significant p values. One model is run for each outcome. All models are run on the weighted pooled sample (online + telephone).Coef = coefficient.
a1 = lifetime sex intercourse, opposite sex; 2 = any sexual intercourse in the last 12 months; 3 = last sexual intercourse with the regular partner; 4 = had only one sexual partner for all pregnancies.
Associations Between Sociodemographic Variables and Stigmatized and Gendered Behaviors According to Data Collection Mode (Multivariate Logistic Regressions) for Women (Logit Coefficients and p Values).
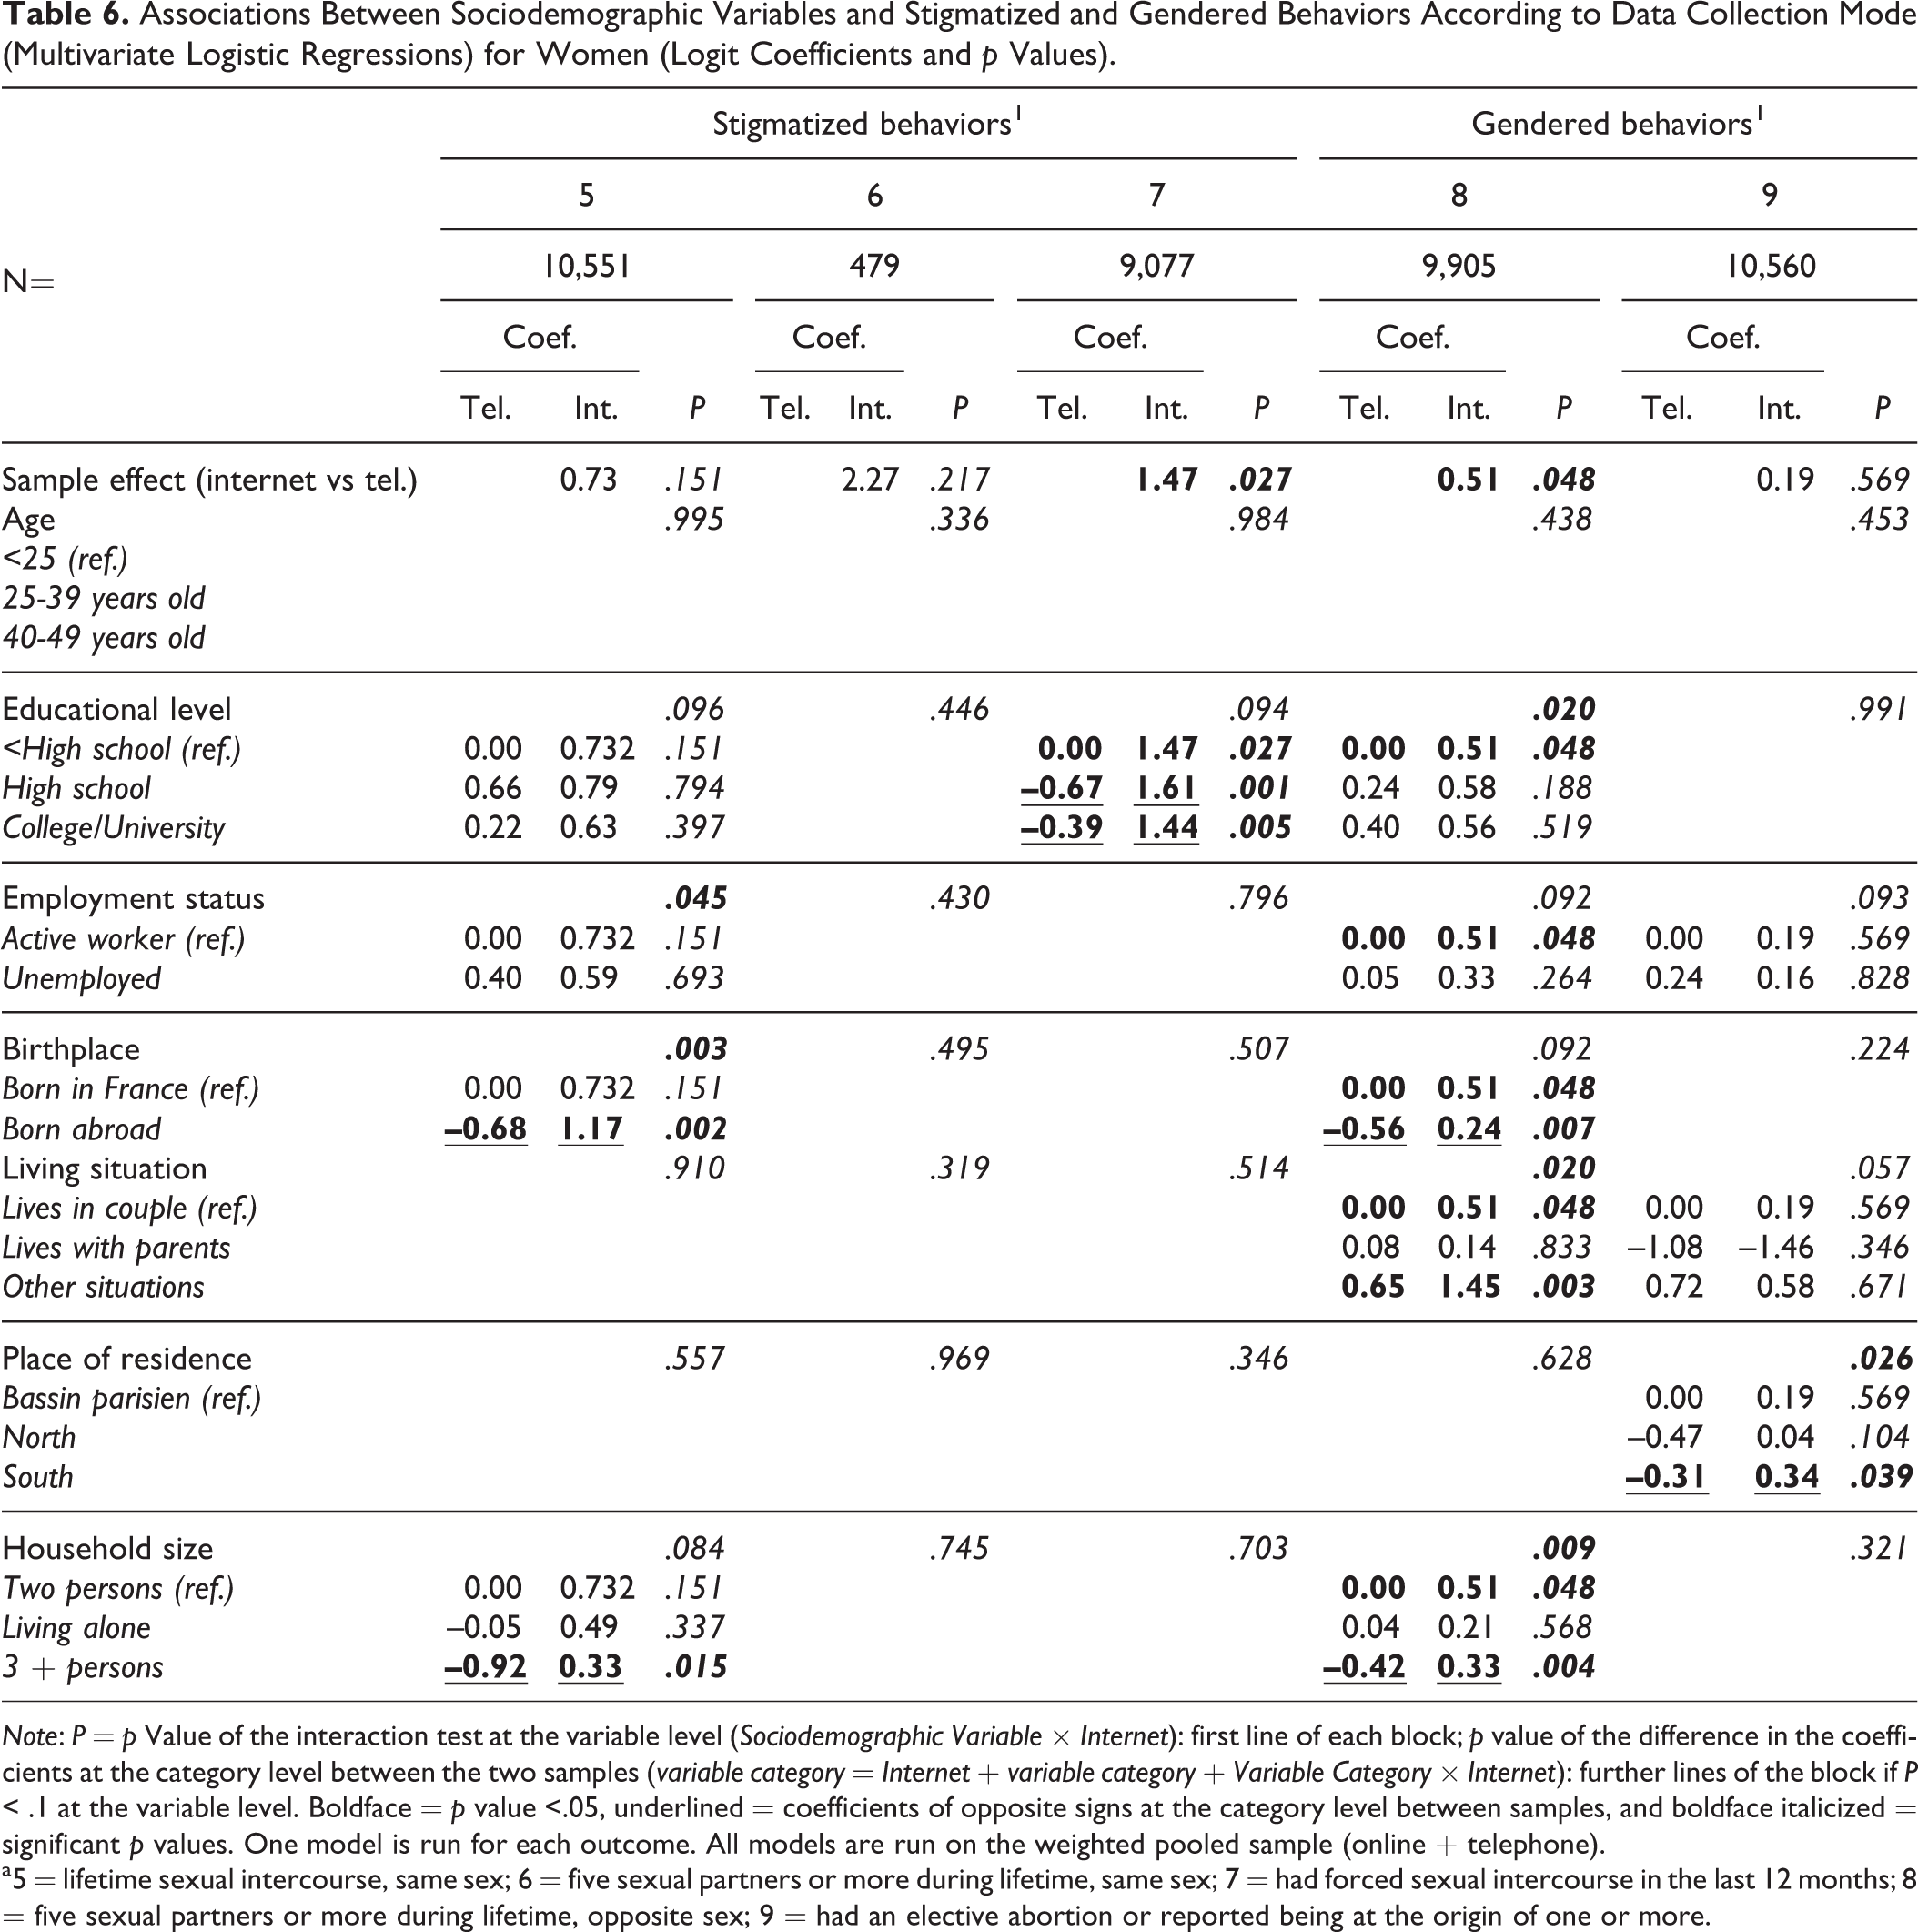
Note: P = p Value of the interaction test at the variable level (Sociodemographic Variable × Internet): first line of each block; p value of the difference in the coefficients at the category level between the two samples (variable category = Internet + variable category + Variable Category × Internet): further lines of the block if P < .1 at the variable level. Boldface = p value <.05, underlined = coefficients of opposite signs at the category level between samples, and boldface italicized = significant p values. One model is run for each outcome. All models are run on the weighted pooled sample (online + telephone).
a5 = lifetime sexual intercourse, same sex; 6 = five sexual partners or more during lifetime, same sex; 7 = had forced sexual intercourse in the last 12 months; 8 = five sexual partners or more during lifetime, opposite sex; 9 = had an elective abortion or reported being at the origin of one or more.
For each model, the independent variables are sociodemographics, Internet, Internet × Sociodemographics, where sociodemographics = age, educational level, employment status, birthplace, living situation, place of residence and household size; Internet = dichotomous variable indicating the sample (1 = Internet, 0 = telephone).
Testing the significance of the variable Internet aims at assessing the residual effect of the data collection mode in our model. Testing the interaction of a sociodemographic variable and the variable Internet aims at assessing whether the effect of the sociodemographic variable differs between the two samples. Testing the differences in the coefficients of a sociodemographic variable between the two samples aims at identifying which category of the variable has different effects in the two samples and whether these are eventually opposite.
All analyses were run separately for men and women in order to identify gender-differentiated behaviors. The threshold for statistical significance was set at .05. All analyses were computed with SAS V9.4 and weighted.
Results
Fieldwork Management, Length, and Complexity of the Questionnaire
As in the telephone survey, the questionnaire on the reproductive history of women was difficult to program, as there were coherence checks during the completion and possibility (or constraints) to go back to the questionnaire to correct some answers. These loops were difficult to implement and to test.
In the telephone survey, the duration of the fieldwork was 145 working days (for 8,645 questionnaires of people aged 15–49 years and 8,437 aged 16–49), compared to 34 in the online survey (for 8,992 questionnaires of people aged 16–49 years). The average duration of the questionnaire was 41 min in each mode (connections of duration over 180 min were discarded for this computation in order to exclude questionnaires that were not actively filled in during the connection).
The response rate of the online survey was 20.0 percent, compared to 44.8 percent to the telephone survey. Noteworthy, the abandon rate during completion (leading to incomplete questionnaires) was 14.6 percent online, compared to 3.8 percent for the telephone survey. These questionnaires were discarded from the analysis (Legleye et al. 2013).
Sample Composition
Considering the χ2 distance as a measure of the distortion of the respondents’ sample (computed with the sampling weights only) with the sociodemographic structure of the target population—the census—the online survey (column 3) was more biased than the telephone survey (column 6), with the exception of employment status and household size (Table 1). Internet and telephone samples show common significant overrepresentations of certain subpopulations: women, people aged 45–49, people with high school or college graduation, native-born individuals, individuals living in couple, and the people in household with three or four members. Conversely, both samples markedly underrepresented men, young people (20–24 years old), people with the lower educational levels, born abroad, living with one parent or alone, and in the region near Paris. These results are common in surveys, especially telephone surveys. However, there were also opposite biases in the two samples: the online survey underrepresented the 16–19 years old, inactive or unemployed people, those living in large households (five members or more), or in northwest, northeast, and southeast of France, whereas it was totally the opposite for the telephone survey. Conversely, the online survey overrepresented those aged 25–29, 30–34, and 35–39 years, active people, and those living in households with two members only, while the opposite was true in the telephone survey.
Utility of Reminders
Table 1 also shows the effect of the effort aiming at improving the response rate in including late respondents or initial refusals. For the online survey, the late respondents that responded after at least one e-mail reminder represented 23.6 percent of the respondents’ sample. According to the χ2 p values, there were significant differences between initial (column 1) and late respondents (who participated after a reminder e-mail; column 2) for all sociodemographic variables except employment status, birthplace, and place of residence. Adding these late respondents to the initial respondents to get the final Internet sample (column 3) improved the sample structure compared to the initial respondents only (column 1): the χ2 distance to the target population diminished for seven of eight characteristics (sex, age, educational level, employment status, birthplace, living situation, and household size) but increased for place of residence. These changes are nevertheless rather small.
For the telephone survey, 23.9 percent of the respondents were interviewed after a refusal or after more than 20 calls. There were significant differences between the initial (column 4) and late respondents’ samples only (column 5) for educational level and place of residence. The inclusion of hard to reach respondents (column 6 compared to column 4) led to a diminished distortion of the sample (according to the χ2 distance) for five of eight characteristics (sex, educational level, birthplace, living situation, and place of residence), but to small augmentation of the distortion for household size while it did not change anything for age and employment status. The differences in χ2 distances were also moderate.
Prevalence of SRH Behaviors
Consider first the calibrated samples. Table 2 shows that 9 of 18 prevalences of the variables of interest studied here significantly differ between the two calibrated samples. Differences in the “common behaviors” were rather small between the two samples for “lifetime sexual intercourse with the opposite sex” (1), “had any sexual intercourse in the last 12 months” (2), “had last sexual intercourse with the regular partner” (3), or “had only one sexual partner for all pregnancies” (4). Only the differences for (1; both gender) and (2;women) are significant, with slightly higher prevalences by telephone. On the opposite, differences for the commonly “stigmatized behaviors” are very important. They go in the same direction for both genders (higher prevalences in the online survey) for lifetime sexual intercourse with a partner of the same sex (5), “had 5 or more sexual partners of the same sex during lifetime” (6), and “had forced sexual intercourse in the last 12 months” (7). The discrepancies are in the proportion of 1–2.7 for men in (5), of 1–1.5 for the men in (6), of 1–1.9 for women in (5), and of 1–3.5 for women in (7). Finally, the direction of differences varies with the gender for the “gender-dependent behaviors”: the proportion of men reporting 5 or more sexual partners of the opposite sex during life (8) is higher by telephone (47.0 percent vs 38.3 percent), while it is the opposite for women (23.5 percent vs. 31.2 percent); and the proportion of women reporting an elective abortion (9) is higher for women by phone (10.1 percent vs. 8.5 percent), while it is the opposite for men (14.1 percent vs. 13.2 percent), although these latter differences were not significant.
Note that the threshold 5 used for dichotomized variables (6) and (8) was defined as the median number of sexual partners during life + 1 in each sex.
Associations Between Sociodemographic Variables and SRH Behaviors
Finally, we were interested in the relationship between the sociodemographic characteristics and the prevalence of the behaviors of interest. The online and telephone samples were pooled and weighted logistic regressions of the nine behaviors studied in Table 2 were run, controlling for the sociodemographic variables presented in Table 1, the sample (online vs. telephone), and with interaction between sample and sociodemographic variables. Testing the significance of these bivariate interactions allows answering the question “what are the sociodemographic characteristics that are differently associated with the variables of interest in the two samples?” Analyses were run separately for men (Tables 3 and 4) and women (Tables 5 and 6), and variables of interest were numbered (from 1–9) and grouped as in Table 2. In order to simplify the analysis, ages were grouped in three categories (16–24, 25–39, and 40–49), educational level grouped in three categories (low, medium, and high), place of residence grouped in three categories (Parisian basin, north, and south), and household sizes grouped in three categories (living alone, household of two persons, and household of three persons or more). In each model, seven bivariate interactions of variables (Sample × Sociodemographic variable) are tested. When an interaction was significant, we tested that the effect of the sociodemographic category (compared to the reference category) differed between the two samples with a Wald χ2 test. In all, 9 × 7 interactions at the variable level and 9 × 19 tests at the category level were tested for each gender.
Tables 3 and 4 show that for men, all sociodemographic characteristics and their bivariate interactions with the sample variable being controlled, answering on the online panel decreased the frequencies of answers for two variables of interest out of nine (3 = had last sexual intercourse with the regular partner; 8 = had five sexual partners or more during lifetime, opposite sex), meaning that it remains a nonreducible difference in average frequency of these two behaviors between the two samples. More precisely, men who answered on the online panel reported less often having sex with their regular partner on the last occasion (coefficient [coef] = −1.81 and odds ratio [OR] = 0.16), and reported less often five partners or more of the opposite sex during life (coef = −0.53 and OR = 0.59). On the opposite, men answering online were likely to report a lifetime sexual intercourse with a partner of the same sex (coef = 1.07 and OR = 2.91). The magnitude of these three effects is important. Overall, 18 tests of interactions at the variable level were significant (of 7 × 9 tests, i.e., 29 percent) and 9 (out of 9 × 19, i.e., 5 percent) tests at the category level revealed associations of opposite effects between the two samples (i.e., coefficients of opposite signs and significantly different in the two samples are given in boldface and are underlined). For example, compared to the men with less than a high school degree, those with college/university degree were more likely to report that their last sexual intercourse occurred with the regular partner in the telephone sample (coef = 0.45 and OR = 1.57), while it was the opposite in the Internet sample (coef = −1.58 and OR = 0.21). The sociodemographic variables involved with opposite signs at the category level were educational level (two levels for outcome 2, one level for outcomes 3, 7, and 8); household size (one level for outcome 1 and one for outcome 2); birthplace (one level for outcome 5); and living situation (one level for outcome 9).
The 18 significant interactions at the variable level were more frequent for the common behaviors (11 for 4 outcomes) than for the stigmatized (3 for 3 outcomes) or the gendered behaviors (4 for 2 outcomes).
Tables 5 and 6 shows that for women, all being controlled, two behaviors remained more prevalent on the online panel: (7) “forced sexual intercourse in the last 12 months” (coef = 1.47 and OR = 4.34) and (8) “5 or more sexual partners of the opposite sex during life” (coef = 0.51 and OR = 1.67). Only 7 tests of interactions were significant at the variable level (of 9 × 7 tests, i.e., 11 percent). Overall, 9 (of 9 × 19 tests, i.e., 5 percent) at the category level revealed associations of opposite effects in the two samples—in boldface and underlined. The variables involved were place of residence (2 levels for outcome 1), educational level (2 levels for outcome 7), birthplace (1 level for outcomes 5 and 8), place of residence (1 level for outcome 9), and household size (1 level for outcomes 5 and 8).
The seven significant associations at the variable level were less frequent for the common behaviors (one for four outcomes) than for the stigmatized behaviors (two for three outcomes) or than for the gendered behaviors (four for two outcomes).
Discussion
Summary of the Results
This study on the replication of the
Second, it showed that it is worth sending reminders to initial nonrespondents in the panel, because it improves participation rate while at the same time improves the representativeness of the respondent sample. Additionally, the selected panel members did not receive any other solicitation from the panel during the first 2 weeks after the beginning of the data collection, which is very uncommon. This latter disposition probably contributed to increase the participation rate. However, we could not test the effectiveness of each of these procedures separately in our study. The participation rate was nevertheless significantly lower online than by telephone (20.0 percent vs. 44.8 percent) and the abandon rate three times higher (14.6 percent vs. 3.8 percent). These results may be a consequence of the unusual sensitive topic of the survey and of its length: the panel members do contract with the survey agency for regular (mostly weekly) short surveys on commercial topics, with no reminder. As a consequence, the
Third, this study showed that the prevalence of some variables of interest differs between the two calibrated samples but that the differences greatly vary with the nature of the studied behaviors: they are small, negligible, or not significant for the most prevalent behaviors but very important for the stigmatized ones. For these latter, the highest prevalences are reported online. There are evidences that stigmatized behaviors or life events are generally underreported by telephone. In our study, the results of the online survey may be closer to the real situation for sexual intercourse with same-sex partners and for forced sexual intercourse. For example, according to the previous French telephone survey on SRH held in 2006, 3.9 percent of the women and 4.0 percent of the men aged 18–69 ever had a sexual intercourse with a partner of the same sex, prevalence that is markedly lower than those measured in the calibrated panel (Bajos and Bozon 2012). This result is in accordance with the literature on mode effect that consistently reports higher prevalences of sensitive behaviors in self-administered questionnaires than in telephone surveys (Beck, Guignard, and Legleye 2014; Beck and Peretti-Watel 2001; De Leeuw 2008; Firdion and Riandey 1993; Kreuter, Presser, and Tourangeau 2009).
We also show that some differences can vary according to gender: men tend to report more often “five or more sexual partners of the opposite sex during lifetime” by telephone, whereas it is the opposite for women. For this question, the online survey may also be closer of the real situation as it is well known that men tend to overreport the number of their sexual partners when they can take some symbolic advantage of it, mainly in presence of an interviewer (Wellings et al. 2006). On the opposite, prevalence for elective abortion does not significantly differ between surveys, while abortion is commonly underreported in surveys (Rossier 2003). These results may globally be seen in favor of the online survey.
Fourth, the results show that only few sociodemographic variables were significantly differently associated with the variables of interest of the
These results suggest that using a nonprobability online panel survey before or in complement of a telephone survey—considered as the benchmark study—to explore SRH or to increase the sample size may be considered with caution, especially for men. In terms of associations between interest variables and sociodemographic characteristics, for women, almost all conclusions would be correct (around 90 percent), but a nonnegligible part would be erroneous among men (around 29 percent). However, for both genders, the sociodemographic characteristics rarely have opposite effects in the Internet sample compared to the telephone sample (5 percent).
In addition, the significant associations between sociodemographic variables and interest variables are more frequent for common variables among men, whereas they are more frequent for stigmatized and gendered behaviors among women, suggesting a specific bias selection of the male population answering online that is not reduced by the calibration procedure. More precisely, education contributes to 5 of the 18 significant interactions among men (i.e., 28 percent) and to 3 of 9 effects of opposite signs (i.e., 33 percent). The corresponding values are one (14 percent) of seven and two (22 percent) of nine among women. That education has so frequently different effects on SRH behaviors in the two samples among men may reflect a specific selection bias related to men who enroll in the panel. Epidemiologists should be aware of this limitation for analytical studies.
Selection Bias and Data Collection Mode Effect Correction
The comparison of the calibrated samples shows many differences in prevalences. This was expected as our comparison of samples is not based on a randomized procedure: the selection bias remains undetermined in the panel as the members are issued from a population of active Internet users (coverage bias) who were exposed to solicitations for entering the panel mainly because of their particular use of the Internet (exposure bias), and who were finally volunteers to join the panel (self-selection bias). It is worth reminding that these differences occur despite the very high Internet equipment rate of the age range of the general population (more than 90 percent for the 16- to 49-year-olds). Additionally, as reminded before, the differences may also be due to the data collection mode itself.
Do the observed differences that were obtained in an observational study reflect selection bias or data collection mode effects? Based on the theory of the propensity score (Rosenbaum and Rubin 1983, 1984) that aims at reducing the selection bias in observational studies, methodologists have come to the conclusion that measures of mode effect may be provided through propensity score adjustment or weighting (Austin 2011; Dever et al. 2008). Namely, after these procedures, the remaining effect is that of data collection mode between online and telephone surveys, either in multivariate analysis (adjusting for the propensity score of answering on the Internet) or in bivariate analyses (weighting the online survey using the propensity score; Schonlau et al. 2003; Varedian and Forsman 2002). That the propensity modeling removes all selection effects is nevertheless still questionable.
We did not use this methodology to weigh our panel. However, using the calibration procedure in both surveys has the same effect: Differences in prevalences between the two weighted samples could be interpreted as a pure data collection mode effect in the case where the variables used in the calibration procedure were able to correct for selection bias. Additionally, based on the propensity score theory and the empirical work of comparison of propensity score and traditional regression analyses in the epidemiological field (Stürmer et al. 2006), we can use the models presented in Tables 3 –6, and consider only the association of the sample (online vs. telephone) with the nine variables of interest as a proxy measure of the data collection mode effect that would be obtained using propensity scores based on the sociodemographic variables. Again, we are not sure that the variables used in the calibration, the same as those used in the multivariate modeling, are able to remove all selection bias. Nevertheless, a study showed that calibration is able to remove a large part of the biases (Lee and Valliant 2009).
In addition to sociodemographic variables, researchers used attitudinal (or “webographic”) variables to build the propensity score (Schonlau et al. 2007; Thompson et al. 2013). The rationale is that the panel membership is not reducible to sociodemographic characteristics but that opinion about general subjects such as some important social problems, Internet, data protection, and so on also matter to model the probability of volunteering and remove the online selection bias. In this study, we could not use webographic variables because our questionnaires did not contain any variable suitable for that purpose. As a result, we would have exactly the same weights if we had used propensity score with our sociodemographic variables before a calibration procedure. Furthermore, using a propensity score (in complement of a calibration procedure or not) is not a guarantee to get smaller biases or variances and there are limited evidence that using nondemographic variables is of great help (AAPOR 2013; Lee 2006). We also used a very large set of sociodemographic variables for our calibration, some of them being clearly linked to the variables of interest (age, household composition, education, and employment) that may lead to substantial bias and variance reduction (Dever et al. 2008; Valliant and Dever 2011).
The use of webographic variables is indeed promising, but to our opinion, it is likely that being a panel member, which involves a personal choice, associated with a certain readiness to declare one’s opinions/behavior to others, is not reducible to sociodemographic variables and classical webographic variables. Furthermore, the procedure may suffer from data collection effect bias especially on the opinion questions used as webographic variables: One idea would be to add scales aiming at controlling the social desirability (Holbrook et al. 2003; Loo and Thorpe 2000) and the satisficing of the respondent (Nenkov et al. 2008) on telephone and online survey. Nevertheless, this procedure would not be exempted from data collection mode effects. This raises doubts concerning the fact differences between the two samples, either in bivariate analysis or in multivariate analysis, may ever reflect pure data collection mode effects when using nonprobability samples.
Limitations
First, our conclusions may not stand for other sensitive topics or other age ranks, for which the Internet equipment may be lower. We only use a single online panel for this study and the results may also vary with the companies holding panels because of different recruitment strategies, as shown recently in the SRH domain (Erens et al. 2014).
We did not study the nonresponse bias or at least the difference in SRH behaviors between early respondents and late respondents who participated only after the reminders. But as in the FECOND telephone survey (Legleye et al. 2013), it is likely that the late respondents would show different behaviors compared to the others, that is in favor of any means that could improve the response rate.
Conclusion
Our results show that online Web panels may be used cautiously for studying some sensitive behaviors in the sense that conclusions regarding the associations of sociodemographic variables and sexual and reproductive behaviors present different effects on the Internet sample compared to the telephone sample, especially for men. However, the proportion of effects with different signs is low for both genders (5 percent).
Footnotes
Author’s Note
Data are available on request. Please contact the corresponding author. The Fecond research team comprises N. Bajos and C. Moreau (principal investigators), A. Bohet (supervisor), A. Andro, L. Aussel, J. Bouyer, G. Charrance, C. Debest, D. Dinova, D. Hassoun, M. Le Guen, S. Legleye, E. Marsicano, M. Mazuy, E. Moreau, H. Panjo, N. Razafindratsima, A. Régnier-Loilier, V. Ringa, E. de La Rochebrochard, V. Rozée, M. Teboul, L. Toulemon, C. Ventola.
Declaration of Conflicting Interests
The author(s) declared no potential conflicts of interest with respect to the research, authorship, and/or publication of this article.
Funding
The author(s) received no financial support for the research, authorship, and/or publication of this article.