



Abstract
Using Canadian data from 1976 to 2014, I study the size distribution of strikes with three alternative measures of strike size: the number of workers on strike, strike duration in calendar days, and the number of person calendar days lost to a strike. I use a maximum likelihood framework that provides a way to estimate distributions, evaluate model fit, and also test against alternative distributions. I consider a few theories that can create power law distributions in strike size, such as the joint costs model that posits strike size is inversely proportional to dispute costs. I find that the power law distribution fits the data for the number of lost person calendar days relatively well and is also more appropriate than the lognormal distribution. I also discuss the implications of my findings from a methodological, research, and policy perspective.
Keywords
During the last several decades, a great deal of research has focused on power law distributions, which are skewed and heavy tailed. These distributions have been found in physical phenomena, such as the severity of earthquakes, the size of moon craters, the amount of Internet traffic to and from websites, the size of forest fires, and the intensity of solar flares (Clauset, Shalizi, and Newman 2009; Newman 2005); economic phenomena (the size of cities, the distribution of wealth, executive compensation; Gabaix 2016); and organizational phenomena (e.g., the size of firms [Axtell 2001, 2006] and the size of trade unions [Pencavel 2014]). Power law distributions are also associated with self-organized systems. Self-organization occurs when the processes in a system, which can appear to be random fluctuations, become more organized over time without being influenced by factors or stimuli outside the system. Self-organizing systems have been observed in physical and biological contexts (Newman 2005), as well as in economic systems, such as how cities are founded and grow (Krugman 1996).
A recent strand of research studying conflict has noted that power law distributions also describe the size of conflicts. Conflict size could include measures such as the number of causalities in wars, for example, among others, Richardson (1948, 1960), Roberts and Turcotte (1998), Cederman (2003), and Friedman (2015), and the causalities from terrorist attacks (Clauset, Young, and Gleditsch 2007). Biggs (2016) noted that other types of less violent conflicts, such as the number of participants in riots and demonstrations, can also be described with power law distributions. The power law distribution in the size of a conflict is quite important since a power law distribution implies that most of the distribution of causalities or the number of participants in a conflict can be accounted by a small number of observations. This is like the 80:20 principle first noted by Pareto when he studied income and wealth distributions, where about 80 percent of the wealth was held by the 20 percent of the population (the richest) that is another distinguishing characteristic of power law distributions (Newman 2005).
My interest is in another form of conflict that is (typically) not violent but still quite important to many economies because of the economic costs and social consequences that arise when they occur. More specifically, I focus on strikes that arise (primarily) during collective bargaining. Strikes occur when there are impasses in contract negotiations that cannot be settled by the parties who are bargaining or by neutral third parties (conciliators or mediators), although they can also reflect political action on the part of unions. These strikes can be costly to society because workers lose their earnings and firms can have their output and, consequently, revenues reduced when their workers are on strike. Currie and McConnell (1991) estimated the costs of strikes in the public sector using lost wages, which would likely be a lower bound on the true costs of a strike. Currie and McConnell noted that the mean public sector strike consumed 41,700 working days and cost nearly $3 million (Canadian) in forgone wages. 1 Currie and McConnell did not estimate or compute the lost output to the economy, but these costs are likely much larger than the lost wages especially if one were to also consider strikes in the private sector. For example, summing the estimates of lost gross domestic product (GDP) by industry in Maki (1986, table 3), the total lost output due to strikes in 1971 amounts to 5.1 percent of GDP. 2 A key question from the perspective of many stakeholders is whether the size distribution of strikes is characterized by a power law distribution, where a few large strikes account for most of the strike activity. In other words, are the costs and consequences of strikes to a society due to a few large strikes, that is, does some sort of relationship like the 80:20 principle of Pareto for wealth, also hold for the distribution of strikes? Some earlier research, for example, Biggs (2005, 2016), has found evidence of power law distributions in the size of strikes in historical data from the United States and France as well as data from the United Kingdom.
There are a few (theoretical) mechanisms that can give rise to power law distributions in the size of strikes. First, the joint costs model is based on the idea that strikes are related to the inverse of dispute costs, that is, lower dispute costs are associated with an increased propensity to strike and longer strikes. Second, there is the “safety valve” theory where strikes express the dissatisfaction of union members and occur when this dissatisfaction reaches a critical point. As will be discussed subsequently, both of these models have connections and parallels in the physical sciences where similar sorts of mechanisms have been found to be consistent with the existence of power law distributions in various phenomena. Third, as noted earlier, there is some empirical evidence that firm and union size follow power law distributions. Consequently, strikes occurring in these firms and unions could thus also have a power law distribution. Campolieti (2016) suggested that the power law distribution in union size could arise from a preferential attachment mechanism (Easley and Kleinberg, 2010; Mitzenmacher 2004), in which unions that establish a lead in membership extend it over time as they attract more new members. Fourth, some earlier research (Biggs 2005) studying strikes with historical data has found evidence that strike activity propagates and creates positive feedback or waves as collective action spreads across a region and/or industry sector. This propagation of strike activity can also give rise to power law distributions in the size of strikes.
I study the size distribution of strikes with Canadian data from 1976 to 2014. The Canadian data on strikes have long been recognized as being of the best quality (Currie and McConnell 1991) because they constitute a census of all strikes (as a result of mandatory reporting requirements) and thus are not subject to reporting limits (e.g., 1,000 or more workers as in contemporary U.S. strike data) and the data are not binned or grouped. I use three measures of strike size: the number of workers on strike, the duration (length) of the strike in calendar days, and the number of person calendar days lost to a strike (number of workers on strike × the duration of the strike in calendar days). While the number of workers on strike and strike duration have been previously studied, the number of person calendar days lost to a strike has not been considered before in the empirical literature, although it has long been recognized as potential measure of conflict size. Unlike some earlier analyses, I obtain my estimates using a maximum likelihood estimator (MLE) and avoid the biases that can arise when using ordinary least squares (OLS) to estimate a power law distribution. The maximum likelihood approach I use provides a way of estimating the exponent of the power law distribution as well as the lower bound for the distribution. In addition, I compute goodness-of-fit tests for the power law distribution and compare the power law distribution with an alternative model, which is not possible when using OLS to estimate a power law distribution. More specifically, I also fit a lognormal distribution, which is also useful for modeling heavy-tailed and skewed data, to the strike size data and test it versus the power law distribution to determine which of these distributions is more appropriate. Overall, I find that the power law distribution does fit the size distribution of strikes in Canada, when measured as the number of lost person days, quite well and that the power law distribution is also supported relative to the lognormal distribution.
The next section provides some background on power law distributions, describing how a power law distribution is estimated with maximum likelihood, and some of the theories that could generate a power law distribution for strike size. The third section provides a description of the data I use and some institutional background. The fourth section discusses the empirical results. The fifth section provides a summary of the principal empirical findings as well as their implications.
Background on Power Law Distributions, the Estimation of Power Law Distributions, and Mechanisms That Could Generate a Power Law Distribution
A power law distribution takes the form

for x ≥ xmin > 0, where xmin is the lower bound on the power law behavior, that is, at or above xmin the distribution exhibits the properties of a power law distribution, and α is the exponent. The parameter α, the power law exponent, determines the skew of the distribution. In particular, smaller values of αindicate greater skew in the distribution as well as fatter tails (Gabaix 2016). The power law distribution is also heavy tailed, so that there are more large observations than would be expected with a normal or exponential distribution. When plotted in the double logarithmic scale (also known as a log–log plot), a power law distribution will produce a straight line. Finally, the power law distribution also displays scaling, that is, if x has a power law distribution denoted as p(x) = Cx−α and we multiple x by 2, then p(2x) = Cx−α × 2−α.
When estimating a power law distribution, there are thus two parameters to estimate: (1) the exponent α, which describes the scaling in the distribution, and (2) xmin the cutoff or lower bound for the power law distribution, that is, the smallest value of x for which power law behavior holds. The most common approach to estimate a power law distribution relies on OLS. The OLS approach while very easy to implement is problematic for a number of reasons, which are discussed in Durlauf (2005) and Clauset et al. (2009).
An alternative to the OLS approach is to use maximum likelihood to estimate the parameters of a power law distribution. The MLE for the power law exponent in equation (1) is expressed as,

where n is the number of observations in the tail (i.e., the number of observations ≥xmin) and the standard error of

where S(x) is the empirical cumulative distribution function (CDF) of the data for observations with a value of at least xmin and P(x) is the CDF for the power law distribution that best fits the data with x ≥ xmin. Thus, my estimate of xmin, denoted
I assess the goodness of fit of the models I estimate using the KS test. As in equation (3), the KS test considers the distance between the data and the assumed model. If the p value for the KS test statistic is large, then the assumed model is a good (plausible) fit to the data.
I also undertake some model comparison tests to determine whether there is support for a power law distribution or an alternative distribution, which is also heavy tailed and skewed. Clauset et al. (2009) advocated the use of Vuong’s (1989) likelihood ratio statistic for model selection. Vuong developed his likelihood ratio test statistic to test the differences between two models. Vuong’s framework considered models which may be nested, nonnested, or overlapping, and it thus lends itself naturally for model selection, unlike OLS-based methods. In particular, Vuong’s likelihood ratio statistic can be positive or negative depending on which model is a better fit to the data (i.e., which model has the highest likelihood value). Thus, the Vuong test is a directional likelihood ratio test statistic, so it can be greater than 0 or less than 0 depending on which model is better supported by the data. 3 For example, if we compare a power law distribution with an alternative distribution and the test statistic is positive, then the Vuong test would support the power law distribution. On the other hand, a negative value for the test statistic would provide support for the alternative model. We can determine whether the sign is statistically significant or not by computing the p value for the test statistic, which Vuong (1989) showed has a χ2 distribution. If the p value of the test statistic is small, for example, Clauset et al. (2009) recommend 0.10 as a conservative benchmark, then the test statistic is a reliable indicator of which model is more appropriate.
I consider the lognormal distribution,

where μ and σ are the parameters to estimate as an alternative to the power law distribution. 4 Lognormal distributions have been found to fit many economic and physical phenomena with heavy tails (Mitzenmacher 2004). I also use maximum likelihood to estimate the lognormal distribution. I obtain the estimates of the power law and lognormal distributions using the R files that accompany Clauset et al. (2009). 5
A relevant question to consider is why would a power law distribution describe the size of strikes? In other words, what sorts of mechanisms could create strike size distributions that are power laws? There are a few plausible explanations.
One plausible mechanism for the emergence of a power law relationship in strike size is the joint costs model. The joint costs model posits that the probability and duration of a strike are inversely proportional to dispute costs, for example, among others, Kennan (1980), Redder and Neumann (1980), and Siebert and Addison (1981). Consequently, factors that can increase the costs of strikes (i.e., the sum of costs to both the firm and the union) should reduce the incidence of strikes as well as their duration when they occur. Ashenfelter and Currie (1990) also present a great deal of evidence that disputes (contract impasses) are more common when they are less costly (i.e., an inverse relationship). The joint costs model is like the “inverse of quantities” generating mechanism for power law distributions discussed in Newman (2005) as to why power laws can arise in physics.
An alternative mechanism that could create a power law in the size distribution of strikes is the “safety valve” theory of strike incidence (Mitchell 1981; Morris 1959). The safety valve theory hypothesizes that strikes express the accumulated resentments of workers in a bargaining unit. Unhappiness and dissatisfaction buildup within a bargaining unit, spreading from one member to another and eventually this dissatisfaction reaches a level where the bargaining unit strikes to release these tensions. The safety valve theory is also used in other conflict studies, for example, wars could reflect the release of built up tensions between nations and alliances (Gilpin 1981). The “safety valve” theory can be viewed as a “forest fire model” that models the spread of dissatisfaction within a bargaining unit. Typically, forest fire models have been used to model the spread of strikes across an industry sector or a region (Biggs 2005) or for the spread of other forms of conflict, for example, wars as in Cederman (2003). 6 However, a limitation of the safety value theory is that it only conceptualizes strikes as being worker initiated, that is, it does not allow for the possibility that strikes can also be initiated by firms (lockouts). The joint costs model does not suffer from this shortcoming.
While the joint costs model, in effect, views the collective bargaining process as a “black box,” because it does not attempt to explain the bargaining process (Kennan 1986), the joint costs theory does predict that policy variables and other variables related to the bargaining environment can decrease the number of strikes by increasing the costs of going on strike (e.g., bans on replacement workers or reinstatement rights for workers on strike) or reducing uncertainty, misinformation, and divergent expectations (Campolieti, Hebdon, and Dachis 2014; Gunderson, Kervin, and Reid 1986). This suggests that there could be a role for collective bargaining legislation to mitigate the impacts of strikes on society and the economy. In contrast, the safety valve theory can be viewed as a self-organizing relationship for strikes. Like a forest fire model, which are known to be characterized by self-organizing behavior (e.g., among others, Cederman 2003; Roberts and Turcotte 1998), strikes self-organize in the sense that when dissatisfaction within the bargaining unit reaches a critical point, a strike occurs. If a self-organizing relationship holds, strikes would be little affected by legislation, since the discontent within the bargaining unit would not be affected by outside factors, such as conciliators or other policy instruments.
Power law distributions have also been hypothesized to occur in strike data because of the propagation of collective action (Biggs 2005). As discussed earlier, the propagation of collective action can create strike waves, which Biggs (2005) showed are like models of forest fires, where strikes spread across firms in a region and/or sector.
Finally, an alternative reason for the strike size distribution to have a power law distribution is that the distributions of firm and union size have been found to have power law distributions. Axtell (2001, 2006) found that the U.S. firm size distribution (measured by the number of employees) has a power law distribution (with an exponent of about 1). Pencavel (2014) also found evidence of a power law distributions in the union membership data from the United States and the United Kingdom. Campolieti (2016) has found evidence of power law distributions as well as other heavy-tailed distributions in Canadian union membership data. As noted earlier, Campolieti suggested that the power law distribution in union size could arise from a preferential attachment mechanism. With preferential attachment, newly organized union members, and possibly smaller existing unions, would gravitate toward larger unions. Consequently, the unions that develop a lead in membership would tend to reinforce that lead over time if a preferential attachment mechanism is at play. The presence of a power law distribution in union size could thus create a power law distribution in strike size when these unions experience strikes.
Data and Institutional Background
The data used in the analysis come from Human Resources and Skills Development Canada’s Labour Canada Program Work Stoppage Database for the period between 1976 and 2014. This period is characterized by a secular decline in strike activity, in terms of both the number of strikes and their duration, which began in the early 1980s (Akyeampong 2001; Campolieti, Gunderson, and Hebdon Forthcoming; Uppal 2011). However, prior to the early 1980s, there was a rising trend in strike activity that began in the mid-1960s (Godard 2011; Gunderson, Hebdon, and Hyatt 2009). As noted by Gunderson et al. (2009) and Godard (2011), the trends in the Canadian strike data since the 1960s are similar to those that have been observed in the United States and the United Kingdom.
The strikes in the data I consider are predominately occurring during contract negotiations. 7 However, there are a few very short strikes (typically, one day) that are the result of some political action, union solidarity or sympathy, but these sorts of strikes are not overly common (2.1 percent of all strikes). The strikes in these data are also predominately initiated by unions (87.6 percent). 8 Another interesting feature of the Canadian data is the composition of the strikes. The decrease in strike activity that has occurred since the beginning of the early 1980s tends to be much more pronounced in the private sector relative to the public sector, so that public sector strikes are more common in the last two decades of the data I consider (Campolieti et al. Forthcoming; Gunderson et al. 2009). Gunderson et al. (2009) provided a neoclassical interpretation of these trends for private sector strikes, arguing that the size of the pie that unions and firms share has been on the decline for the last few decades because of globalization, outsourcing, and free-trade agreements, which means that there is less to fight over, and as a consequence, there are fewer strikes. Godard (2011) argued that neoliberal and managerial ideologies have repressed industrial conflict and this has been reflected in the decline in strike activity in Western countries. Godard also suggested that these changes mean that workers may attribute injustice not to individual employers, but rather to national or global political elites, so that industrial conflict may now manifest in the form of broader political unrest instead of strikes.
The Canadian data on strikes are generally regarded as very high quality because of the mandatory reporting requirements and its depth of coverage (Currie and McConnell 1991). For example, unlike U.S. strike data which are restricted to strikes with 1,000 or more workers or data from the United Kingdom that only include strikes that involve at least 10 workers, the Canadian data are a census of all strikes (i.e., there are no limits on the size of the bargaining units included in the data). Consequently, the size of the strikes in the Canadian data ranges from those with a handful of workers to those with tens of thousands of workers. The observational unit in the data is the strike. In most cases, these strikes are at the bargaining unit (union local) level, that is, a strike by the union representing workers at a particular workplace of a firm. In many cases, a union local can represent workers at different work sites at the firm and a strike would thus involve all the workers employed by the firm. In some cases, the strikes involve multiple unions. For example, some of the strikes in the data are “protests” by public sector unions and involve the membership of a few unions in that jurisdiction or in one case across Canada. The strikes involving multiple unions can also represent sectoral bargaining, for example, all workers in the hospital sector or all teachers in a jurisdiction. Each of these strikes is distinct, so the data reflect a single entry for that strike, that is, the total number of workers on strike as well as the duration of the strike, and so the data do not contain multiple entries for each of the unions that participated in a strike. Also, the Canadian data are not grouped (or binned) in any way, so each individual strike that occurs during the study period is included in the data. None of the strikes in the data I use are censored, that is, the end date on each strike included in the data is recorded. In other words, all the strikes in my data are complete or were settled. This means that I have the full distribution of strikes, it has not been truncated at either the lower or upper tail.
The strikes occur in the various provincial, territorial, and federal jurisdictions of Canada. 9 Each of these jurisdictions enacts collective bargaining legislation that can have effects on the incidence of strikes as well as their duration. Generally, the intent of most of this legislation is to prevent strikes and shorten their length when they occur. For example, many jurisdictions require compulsory conciliation, where a government appointed third-party meets with both the union and employer to facilitate a new contract, as well as cooling off periods (that can range from 2 to 14 days), which occur after conciliation and before a strike can be called. Currently, all jurisdictions in Canada require mandatory (secret ballot) strike votes before a strike can occur and some jurisdictions even allow for employer initiated strike votes. A few jurisdictions also have bans on replacement workers; however, reinstatement rights for workers who go on strike are much more common (e.g., six provinces and the Federal jurisdictions include them in their collective bargaining statutes). Campolieti et al. (2014) provide a summary of collective bargaining legislation in Canada as well as its possible effects on strike incidence and duration.
I measure strike size with a few alternative concepts. First, I consider the number of persons on strike. Second, I consider the duration (length) of the strike. Strike duration can be measured as the number of work days or the number of calendar days lost. Working days lost is available in the work stoppage data I use, as it is computed by Labour Canada. While this is a very relevant measure of strike duration, it may not be available in all strike data so I also consider a measure of lost time based on calendar time. The number of calendar days lost is computed as the difference between the day the strike is settled and the day the strike began and is a very common measure of strike duration in empirical studies, for example, among others, Gunderson and Melino (1990), Budd (1996), and Campolieti et al. (2014). Biggs (2016) noted that both the number of workers involved in a strike and strike duration could be viewed as one dimensional measures of strike size, so they might be able to capture the number of workers on strike but not the variation in the length of the strike and vice versa. Third, I consider the number of person calendar days lost, which is number of persons on strike multiplied by the duration of the strike, where the duration of the strike is measured in calendar days. 10 This is a measure of strike size that has not been considered before in the empirical literature, although its relevance as a measure of strike size has been emphasized in the earlier literature (e.g., among others, Biggs 2016; Spielmans 1944; Tilly 1978). By combining the number of participants with the duration (length) of the strike, the number of person calendar days lost is a two-dimensional measure of strike size and thus addresses the limitations of the one-dimensional measures using either the number of participants or the duration of the strike.
Empirical Results
Prior to presenting the estimates of the strike size distribution, I examine some of the descriptive statistics for the measures of strike size I consider. Table 1 presents the mean, median, standard deviation, skewness and kurtosis measures, the maximum value in the data, and the percentage of the data in the upper tail. The standard deviations show that there is a great deal of dispersion in these data and they always exceed the mean (the standard deviation is 2–13 times larger than the mean) and median (the standard deviation is 6–118 times larger than the median) of the strike size measures I consider. An alternative measure of dispersion in the data is the Gini coefficient. 11 If there is a great deal of dispersion in the strike size distribution, then the Gini coefficient should be close to 1. If there is very little dispersion in the size distribution of strikes, then the Gini coefficient should be close 0. The Gini coefficients for each of my three measures of strike size are all quite large ranging from 0.69 to 0.90, with the largest Gini coefficient for the person calendar days lost. The maximum values of each of my three measures of strike size are also considerably larger than the mean and median, especially for the number of workers on strike and the number of person calendar days lost. More importantly, most of the distribution is accounted for by the upper tail of the data (where the upper tail is defined using the values of xmin estimated in Table 2) for both the number of workers on strike and the number of person days lost (89 percent and 76 percent, respectively), while strike duration has a somewhat smaller amount in the upper tail (42.5 percent), this is substantially larger than what would be expected for a normal or exponential distribution. These figures are quite considerable since the proportion of the observations in the upper tail are relatively small, 17.4 percent, 6.1 percent, and 4.9 percent, for the number of workers on strike, strike duration, and lost person days. All three outcome measures show a great deal of skew as well as extremely heavy tails (large kurtosis values). The summary statistics in Table 1 indicate that all three measures of strike size are consistent with very skewed and heavy-tailed distributions.
Descriptive Statistics.

Note: The Gini coefficient is computed using all observations in the data. Percentage in the upper tail is computed as the sum of all the observations in the upper tail divided by the sum of all the observations in the data, where the upper tail of the data is defined by the estimates of xmin in Table 2 for each of the measures of strike size I consider.
Estimates of Power Law Distribution.

Note:
The estimates of the power law distribution are presented in Table 2 for each of the three measures of strike size that I consider. For the number of workers on strike, I estimate a power law exponent of 1.91 and a lower bound on the tail, xmin, of 325, that is, a power law distribution holds for strikes when the number of workers on strike is greater than or equal to 325. For strike duration, the estimate of the power law exponent is 2.78 and the lower bound on the power law distribution is 192 days. Using the person calendar days lost as a measure of strike size, the estimate of the power law exponent is 2.01 and xmin is 46,900 person calendar days lost. The p values for the KS test statistic for goodness of fit vary quite widely across the strike size measures I consider. I bootstrap the p values for the KS test to account for the fact that the parameters of the power law distribution (i.e., α and xmin) are estimated. 12 For the number of workers on strike and the duration of the strike, the p values for the KS test overwhelming reject the power law distribution (p values < .001) as a fit to the data. However, the KS test statistic p value for the person calendar days lost to a strike is more supportive of the power law distribution as a good fit to the data.
I also plot the fitted power law distributions against the raw data in a log–log plot in Figures 1 –3, which present the data in double logarithmic scale. These figures help visualize the data, showing whether the linear relationship that is characteristic of a power law distribution appears and how well the estimated power law distribution fits the data. The log–log plots for all three of the measures of strike size show a linear relationship emerges in the log–log plot. However, the cutoff for the power law distribution, xmin, which is denoted in Figures 1 –3 with a vertical dashed line is at a point in the upper tail, not necessarily when the straight line in the log–log plot emerges. For example, there are 16,759 strikes in the data, but when I consider the person calendar days lost to a strike, there are only 821 strikes greater than or equal to the lower bound for that strike size measure. The plots in Figures 1–3, for all three measures of strike size indicate that the data contain fewer very large strikes (in the upper reaches of the distribution) than the power law distribution would predict. This suggests that perhaps a distribution that provides more curvature in the upper tail, such as the lognormal, could fit the data.
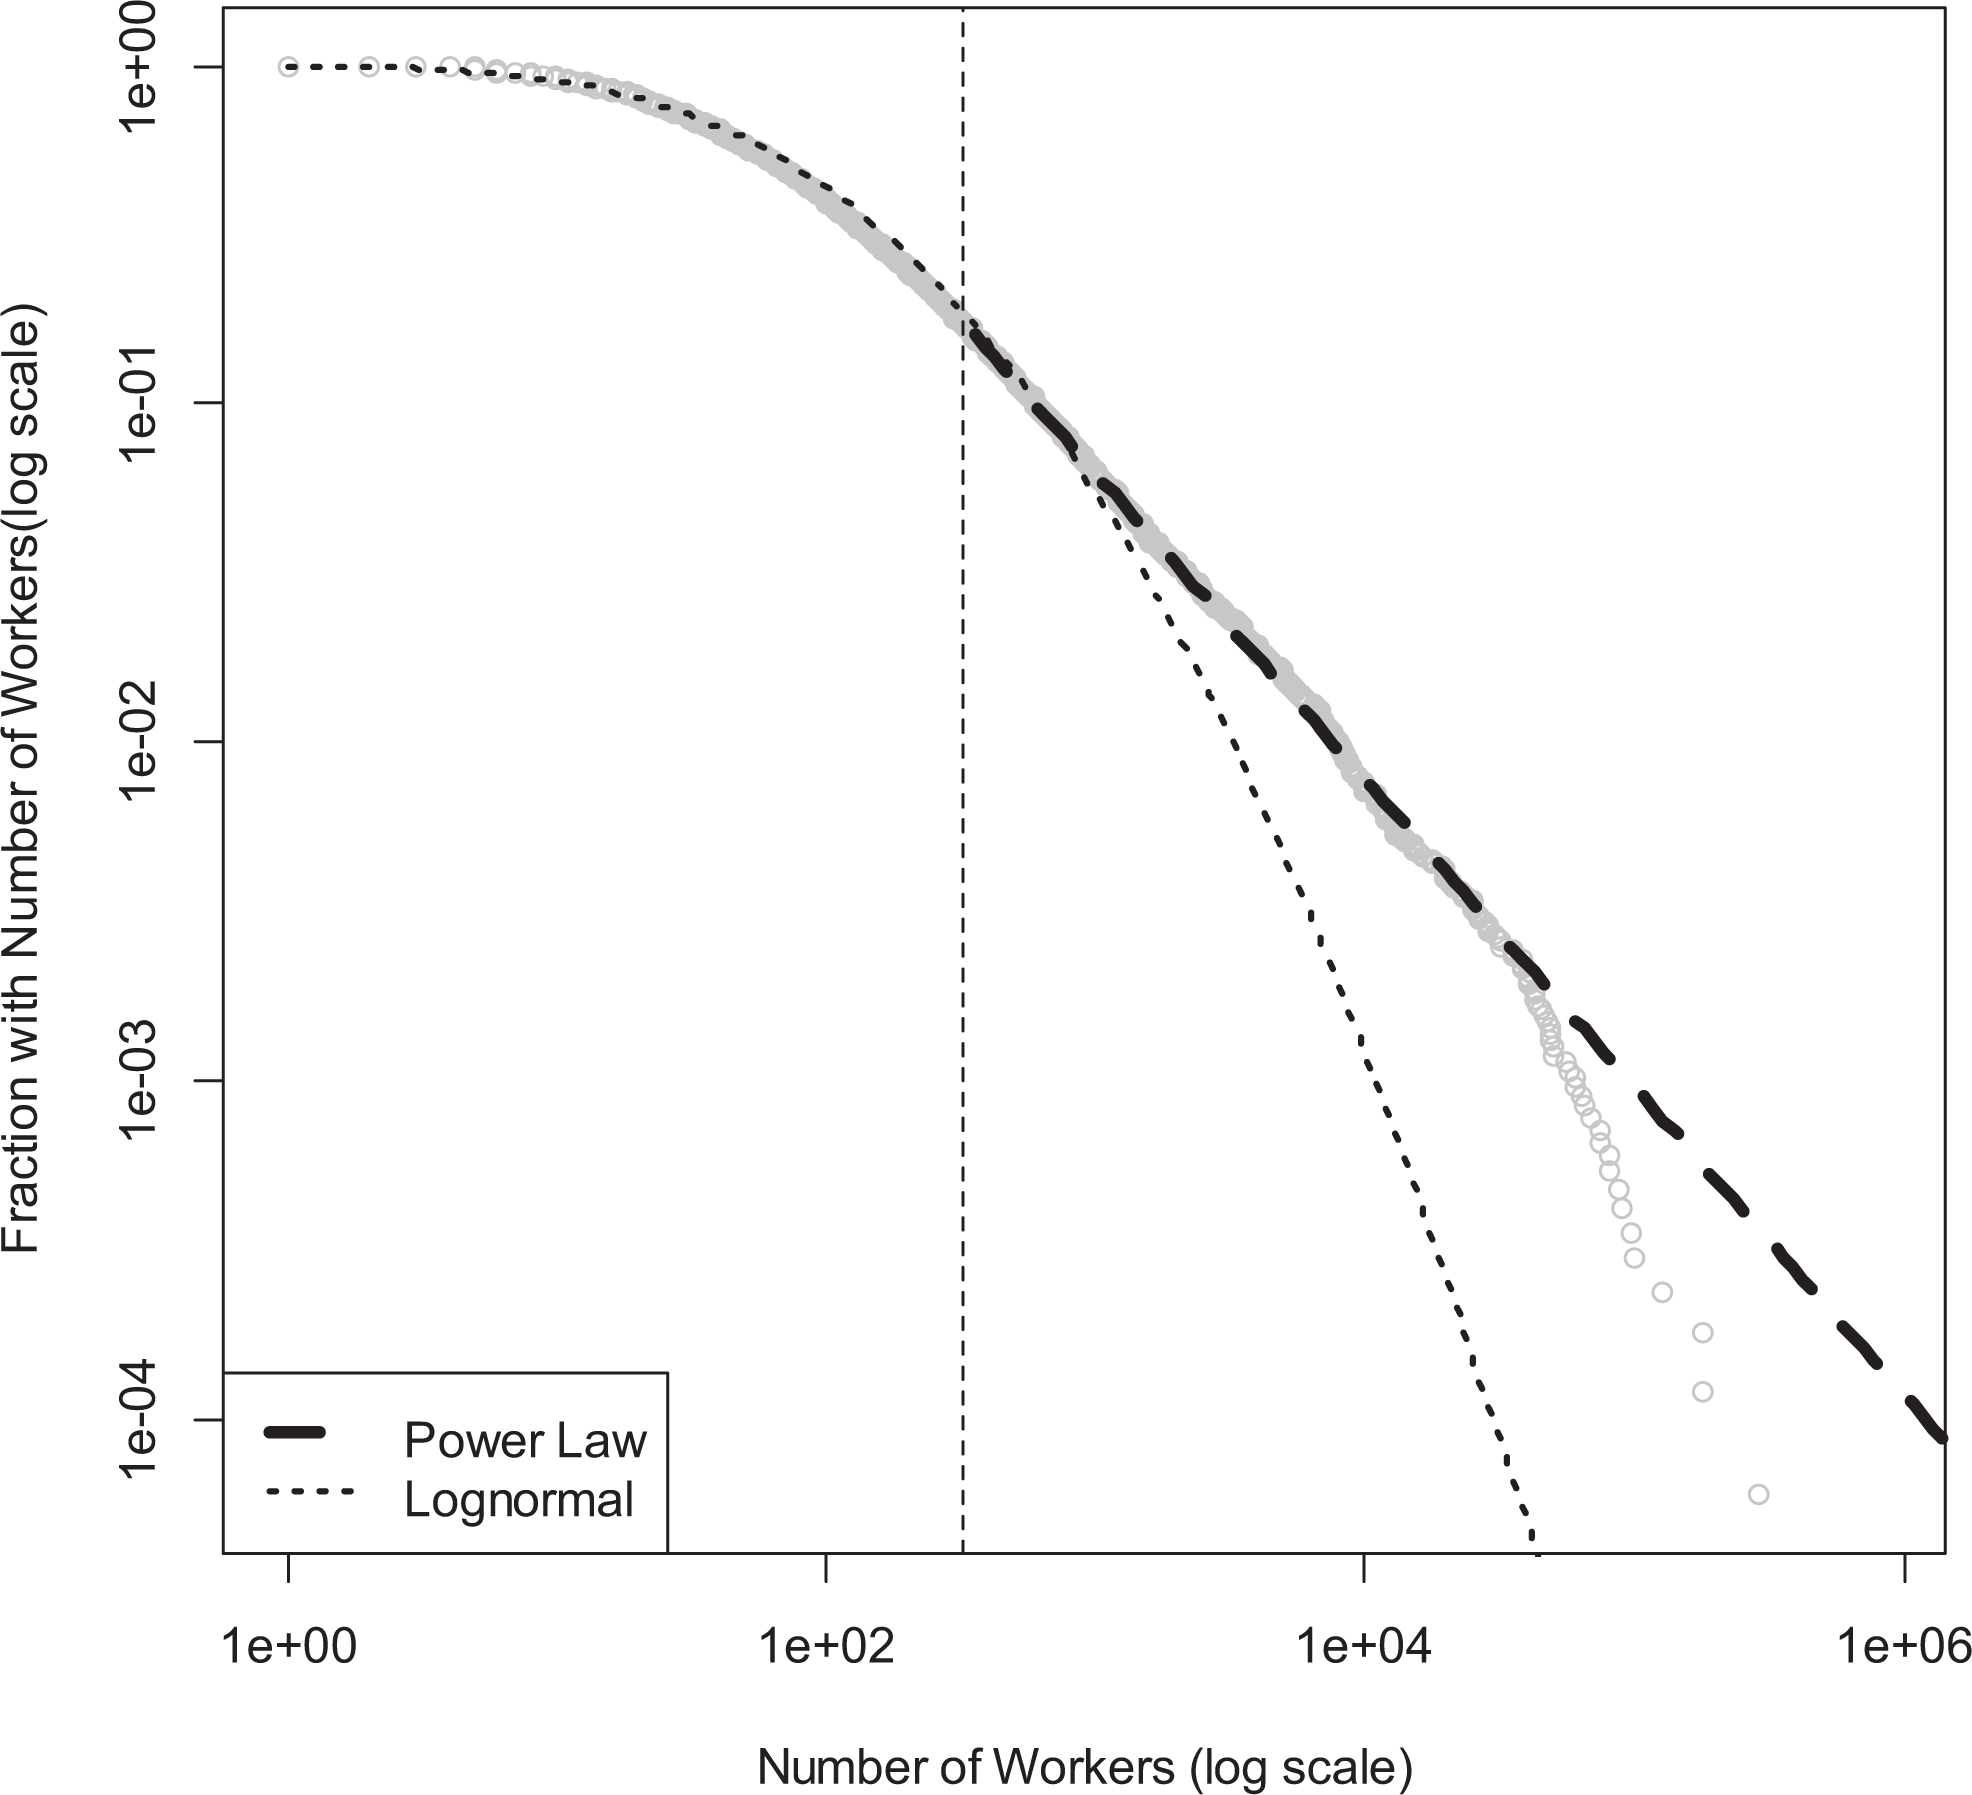
Log–log plot for number of workers on strike, with fitted power law and lognormal. Gray dots are data points; vertical line denotes estimate of xmin for lower bound on power law distribution.

Log–log plot for duration (length) of strike in calendar days, with fitted power law and lognormal distributions. Gray dots are data points; vertical line denotes estimate of xmin for lower bound on power law distribution.

Log–log plot for number of person calendar days lost, with fitted power law and lognormal distributions. Gray dots are data points; vertical line denotes estimate of xmin for lower bound on power law distribution.
Previous evidence on power law distributions and scaling behavior in strikes has been documented in historical data. For example, Biggs (2005) examined the number of participants in strikes during the late-nineteenth century that took place in Chicago and Paris. Biggs estimated power law exponents using OLS that ranged between 1.9 and 2 for these data and xmin of about 100–150. More recently, Biggs (2016) also considered the scaling behavior in strike size with data from the United Kingdom using data from 1950 to 1984. Biggs fit a power law distribution with maximum likelihood to these U.K. strike data (i.e., the number of participants) and obtained estimates of the power law exponent of about 2.2 and xmin of 1,000–2,499. However, the data Biggs used were binned, that is, these contained reported frequencies for nonoverlapping intervals of data, while my data report individual observations. Overall, my estimates for the power law exponent from the Canadian data are consistent with the historical data from the United States and France as well as the United Kingdom, although my estimates of xmin differ from those in the previous literature.
Another feature of power law distributions is the characteristic that is sometimes referred to as the 80:20 principle in Pareto distributions, where the fraction of a variable above a particular threshold is held by a small percentage of the population. In the data that I consider, the question would be whether the bulk of the strike size distribution is accounted for by some small fraction of the population of strikes. This proportion of the total strike size distribution held by some fraction, P, of the population can be computed as P(α−2)/(α−1), where α is the estimate of the power law exponent. I compute these fractions for different proportions and plot them in Figure 4. Newman (2005) noted that if the power law exponent, α, is less than 2, then the share of anything that lies in the tail approaches 1 for any fraction that is considered. Consequently, I do not present the plot for the analysis of the number of workers on strike since the estimate of the power law exponent is less than 2. The plot for strike duration shows a relatively steady and smooth increase as the proportion considered increases. For example, Figure 4 illustrates that 20 percent of the strikes account for 49 percent of all the strike days and 40 percent of the strikes account for 67 percent of all the strike days. For the number of person calendar days lost, where the estimate of the power law exponent is just slightly larger than 2, the plot indicates that the amount of probability in the tail increases much more quickly (e.g., 20 percent of strikes account for 99 percent of the person calendar days lost to strikes).

Plot of share of probability distribution accounted for by a fraction of the population. The figure plots the proportion of the total strike size distribution held by some fraction, P, of the population, which are computed as P(α−2)/(α−1). The values of the power law exponent, α, are taken from Table 2 and are 2.78 for strike duration in calendar days and 2.01 for person calendar days lost.
I present the estimates of the lognormal distribution in Table 3. The lognormal distribution has different parameters than the power law distribution, so it is not straightforward to compare the parameter estimates. I also computed the KS goodness-of-fit tests for the lognormal distribution. As with the analysis of the power law distribution, I also use the bootstrap to obtain p values for the KS test statistics that take into account the parameters of the lognormal distribution are estimated. The p values for the KS test statistics in Table 3 overwhelmingly reject the lognormal distribution as a plausible fit to the data for all three measures of strike size. I present some visual evidence on the fit of the lognormal distribution to the data in Figures 1–3, which also contain plots of the fitted power law distribution. These figures illustrate that for the number of workers on strike and the lost person calendar days, the lognormal distribution would under predict the large strikes (in the upper tail), although the lognormal distribution fits the data below the upper tail quite well. Using strike duration as a measure of strike size, the lognormal distribution tends to overpredict the number of large strikes in the data but does fit the data below the upper tail quite well.
Estimates of Lognormal Distribution.

Note: The mean and standard deviation are the estimates of parameters of the lognormal distribution. The p value for the Kolmogorov–Smirnov test is bootstrapped with 2,500 replications.
I also undertake a formal model comparison and use Vuong likelihood ratio tests to determine whether the power law or lognormal distribution is most appropriate for the data and present the test statistics in Table 4. Recall that the power law distribution is only defined in the upper tail, that is, values ≥ xmin. This means that the Vuong tests are only comparing the lognormal distribution with the power law distribution in the upper tail, that is, values ≥ xmin. Comparing the power law distribution with a lognormal distribution, the power law distribution clearly fits the data better than the lognormal distribution for the number of workers on strike and strike duration as well as the number of person calendar days lost.
Vuong Test Comparing the Power Law and Lognormal Distributions.

Note: p values for Vuong test are from a χ2 distribution.
My estimates suggest that the person calendar days lost measure of strike size follows a power law distribution but its components, the number of workers on strike and strike duration, do not. The power law distribution in the number of person days lost to strikes most likely results from a combination of the skewed and heavy-tailed nature of the number of participants combining with the duration of strikes, although the strike duration distribution on its own is not as skewed or heavy tailed as that for the number of participants. However, as indicated by the Kaplan–Meier survivor function (see Figure 5), although many strikes are quite short (they settle quickly), they are not in the upper tail (i.e., they are to the left of the estimate of xmin for the power law distribution that is indicated in Figure 5 with a vertical dashed line). The Kaplan–Meier survivor function in Figure 5 also illustrates that there are some extremely long strikes in the upper tail. Studies of strikes based on microdata have highlighted that smaller bargaining units are less likely to strike but have longer strikes when they do strike (Campolieti, Hebdon, and Hyatt 2005). I find that there is a small negative correlation between the number of workers on strike and strike duration (−0.02) in my data that is statistically significant at the 5 percent level of significance.

Kaplan–Meier survivor function for strike duration (calendar days). Vertical line denotes xmin = 192 for lower bound on power law distribution estimated for strike duration.
I examined the 10 largest strikes for each measure of strike size to see if there were any common characteristics or whether there were any marked differences in the characteristics of the strikes across these three measures of strike size. For the 10 largest strikes by the number of workers involved, 8 were in the public sector, only 3 of the 10 were strikes of protest involving some political issue (the other 7 strikes occurred because of bargaining impasses) and 5 of these strikes lasted 1 day. The 10 longest strikes in the data were all in the private sector and they were due to contract bargaining impasses (wages or working conditions were the primary issues in these strikes). The 10 longest strikes lasted at least 1,500 days but involved from 10 to 156 workers (in fact, 3 of the 10 longest strikes involved less than 20 workers). The 10 largest strikes measured by person lost days were comprised of 4 private sector and 6 public sector strikes. The principal issue in these strikes was either wages (9 of the 10) or job security. These strikes also involved at least 10,000 workers and lasted between 60 and 308 days. The common feature of all the largest strikes for all three measures of strike size is that they are predominantly the result of bargaining impasses. I also examined the characteristics of strikes for each of these three measures of strike size outside the 10 largest strikes and observed similar patterns. While there are large strikes resulting from political action, sympathy or union solidarity, these are not overly common and are also very short, only 1 day in length. More importantly, they are also isolated and sporadic, that is, they do not occur in waves. 13 This suggests that the power law distribution for strike size is not likely generated by the propagation of collective action (positive feedback or strike waves), since collective bargaining legislation in Canada requires a number of criteria to be met before a legal strike (or lockout) can occur, for example, all Canadian jurisdiction require a strike vote before a strike (or lockout) can occur, most mandate conciliation and all require a cooling off period before a legal strike (lockout) can occur. 14 This is consistent with Biggs (2005) who suggested that a power law distribution for the number of workers who strike might not hold when collective bargaining becomes institutionalized since this would prevent the positive feedback in collective action he observed in the strikes from the nineteenth century as they spread across sectors and/or regions.
The number of workers on strike has been considered as a measure of strike size in much of the earlier literature. As noted earlier, there is some empirical evidence suggesting that firm and union size have power law distributions (e.g., Axtell 2001, 2006; Campolieti 2016; Pencavel 2014), so that they may also create a power law distribution in the number of workers on strike. However, my estimates (the p values for the KS goodness of fit) reject the power law distribution for the number of workers on strike. Campolieti (2016) studied the union size distribution in Canada with data from 1913 to 2015, considering power law distributions as well as other heavy-tailed distributions. While Campolieti did find some evidence for a power law distribution in the upper tail of the union size distribution, he also found evidence for lognormal and stretched exponential distributions in the upper tail. More importantly, for most of the years that overlap with my study period, Campolieti could not distinguish between these three distributions in the upper tail. 15 This suggests that perhaps the underlying distribution of unions in Canada does not follow a power law and so the strike size distribution as measured by the number of participants would be best explained by another distribution. However, it is also important to note that strikes might only involve some locals (bargaining units) and not the entire membership of a union. Consequently, the lack of a power law distribution in the number of workers on strike could reflect that a much smaller number of workers (relative to a union’s total membership) are striking.
The empirical findings do suggest that a power law distribution fits the size distribution of strikes when size is measured as the number of person calendar days lost. 16 This empirical finding has implications from both a theoretical and public policy perspective. On the one hand, if the safety valve theory is at play, then strikes could be a self-organizing phenomena and there could be little room for policy makers to use legislation to reduce the societal costs of strikes. On the other hand, a power law distribution could exist in the size distribution of strikes even if there was no self-organizing behavior at play (Freckleton and Sutherland 2001; Sornette 2002). This means that public policy could play a role in mitigating the impacts of strikes. There is some evidence from the empirical literature on strikes in industrial relations and economics that suggests collective bargaining legislation has impacts on both the incidence and duration of strikes, for example, among others, Gunderson et al. (1986), Gunderson and Melino (1990), Budd (1996, 2000), and Cramton, Gunderson, and Tracy (1999). This suggests that labor relations legislation could reduce the size of strikes by increasing the costs to striking, by bringing together divergent bargaining positions, or by providing information and reducing uncertainty. My findings do not provide definitive guidance as to whether the joint costs model or safety valve theory is more consistent with generating the strike size distribution. However, since some earlier research has found that labor relations legislation has an effect on strike incidence and duration, this suggests that strikes may not be the result of self-organizing behavior and, consequently, that the joint costs model could be more consistent with the strike size data than the safety valve theory.
Concluding Remarks
I consider the size distribution of strikes using data from Canada covering the period between 1976 and 2014. The measures of strike size I consider include the number of workers on strike, strike duration in calendar days, and the number of person calendar days lost to a strike. All three of these measures are characterized by summary statistics that suggest skewed and heavy-tailed distributions. I fit power law and lognormal distributions to these data using MLEs. I find that the power law distribution fits the data relatively well for the measures of strike size based on the number of person days lost to a strike but not for the number of workers on strike or strike duration. I also find that the lognormal distribution is a poor fit to all these measures of strike size. For the measures of lost work days, the Vuong likelihood ratio tests indicate that the power law distribution is more consistent with the upper tail of the data than the lognormal distribution.
This article presents a framework for estimating and evaluating the fit of distributions as well as testing against alternative distributions. This approach will be very useful for future research that considers whether the distribution of the data is consistent with the theories that are hypothesized to generate them. The usefulness of this approach is not limited to research considering the distribution of strike or conflict size, so it can also be applied to the study of other phenomena. While I discussed a few theories that could generate power law distributions in strike size, two measures of strike size I considered did not have a power law distribution. This means that there are still some unanswered questions in terms of what generates the size distribution of strikes when measured by the number of participants and the length of strikes. These measures of strike size tend be considered more frequently in the literature on strikes, so it is important to have a better understanding of the forces and processes that create their distributions.
One implication of my analysis for legislators and policy makers is that the bulk of the costs associated with strikes are accounted for by a small segment of the strikes that occur. Moreover, the “large” strikes seem to derive from both the number of workers on strike and the length of strikes. This suggests that labor relations legislation should be working on both of these dimensions of strike size, that is, preventing strikes and shortening their duration when they do occur. Although I can rule out two explanations for the power law distribution in strike size, my analysis does not provide a clear answer as to whether the joint costs or safety valve theories give rise to this power law distribution in strike size based on the number of person calendar days lost. However, previous empirical evidence considering the effects of collective bargaining legislation on strike incidence and strike duration suggests that perhaps the joint costs model could be at play, since the safety valve theory implies strikes would be self-organizing and should not be effected by collective bargaining legislation. This remains an important question for future research to consider because it would provide greater insights into the role that public policy can play in reducing the costs associated with strikes as well as the mechanisms that generate strikes having disproportionate economic and social costs.
Footnotes
Author’s Note
The data and computer programs (R scripts) used to generate the results are available from the author.
Acknowledgment
The author would like to thank Melissa Wawrzkiewicz for her help editing the article.
Declaration of Conflicting Interests
The author(s) declared no potential conflicts of interest with respect to the research, authorship, and/or publication of this article.
Funding
The author(s) received no financial support for the research, authorship, and/or publication of this article.