
Abstract
Scholars increasingly rely on indirect questioning techniques to reduce social desirability bias and item nonresponse for sensitive survey questions. The major drawback of these approaches, however, is their inefficiency relative to direct questioning. We show how to improve the statistical analysis of the list experiment, randomized response technique, and endorsement experiment by exploiting auxiliary information on the sensitive trait. We apply the proposed methodology to survey experiments conducted among voters in a controversial antiabortion referendum held during the 2011 Mississippi General Election. By incorporating the official county-level election results, we obtain precinct- and individual-level estimates that are more accurate than standard indirect questioning estimates and occasionally even more efficient than direct questioning. Our simulation studies shed light on the conditions under which our approach can improve the efficiency and robustness of estimates based on indirect questioning techniques. Open-source software is available for implementing the proposed methodology.
Keywords
Introduction
While many social scientists use surveys to measure individual opinion and behavior on a range of sensitive topics, including racial discrimination, corruption, drug use, and sexual behavior, the validity of survey measurements is often compromised by misreporting and nonresponse. Scholars increasingly rely on indirect questioning techniques to alleviate such bias (e.g., Gingerich 2010; Gonzalez-Ocantos et al. 2012; Janus 2010; Krumpal 2012; Kuklinski, Cobb, and Gilens 1997; Lyall, Blair, and Imai 2013). Three survey methodologies that have recently attracted much attention are the list experiment (also known as item/unmatched count technique), randomized response technique, and endorsement experiment. These techniques seek to elicit truthful answers to sensitive survey questions by obscuring individual responses, thus affording respondents greater privacy. Some validation studies have found that indirect questioning techniques can significantly reduce bias relative to direct questioning (e.g., Coutts and Jann 2011; Rosenfeld, Imai, and Shapiro 2016; van der Heijden et al. 2000), though others report more pessimistic results (e.g., Wolter and Preisendörfer 2013).
Despite their promise and increasing popularity, the major drawback of indirect questioning techniques is that the resulting estimates are often much less efficient than those obtained under direct questioning. Therefore, the bias reduction may be offset by an increase in variance. Although scholars have developed new multiple regression techniques (see Blair and Imai 2012; Blair, Imai, and Zhou 2015; Bullock, Imai, and Shapiro 2011, and references therein) and proposed to combine multiple direct/indirect questioning techniques (Aronow et al. 2015; Blair, Imai, and Lyall 2014), these new methods often fail to fundamentally overcome the problem of efficiency loss inherent in indirect questioning. As a result, a considerably greater number of respondents are required to obtain precise estimates through indirect questioning techniques.
In this article, we show how to improve the statistical analysis of indirect questioning techniques by exploiting auxiliary information about the prevalence of sensitive traits in the population under study. Information of this kind can come from many sources, including censuses, administrative records, and expert evaluations, and is often available for topics that are sensitive and private in nature, such as turnout and voter choice (Karp and Brockington 2005), disease prevalence (Martin et al. 2000), income (Kim and Tamborini 2014; Schräpler 2004), unlawful or fraudulent behavior (van der Heijden et al. 2000), and contact with the criminal justice system (Kling, Ludwig, and Katz 2005; Wolter and Preisendörfer 2013; Wyner 1980). The key characteristic of the auxiliary information we consider is that, although a reliable measure of the sensitive trait is unavailable at the individual level, the same trait can be measured fairly accurately at an aggregate level. We demonstrate that such aggregate information can be harnessed in multivariate analyses to sharpen inference about the relationships between sensitive traits and other characteristics of individuals and in hierarchical analyses to generate more accurate estimates of the prevalence of sensitive traits in subpopulations.
In addition, combining individual- and aggregate-level information can reduce the potential bias of sensitive survey techniques. Bias reduction is an important consideration because sensitive survey techniques are not guaranteed to produce valid estimates (e.g., Wolter and Preisendörfer 2013). We construct individual-level estimates such that they are consistent with true aggregate-level information. This approach has been used elsewhere. For example, to overcome the fundamental difficulty of inferring individual behavior from aggregate data (Cross and Manski 2002; Duncan and Davis 1953), the recent literature on ecological inference proposes to incorporate individual-level information (e.g., Greiner and Quinn 2010; Imai and Khanna 2016). We show that this approach is also effective for improving the estimates from sensitive survey techniques.
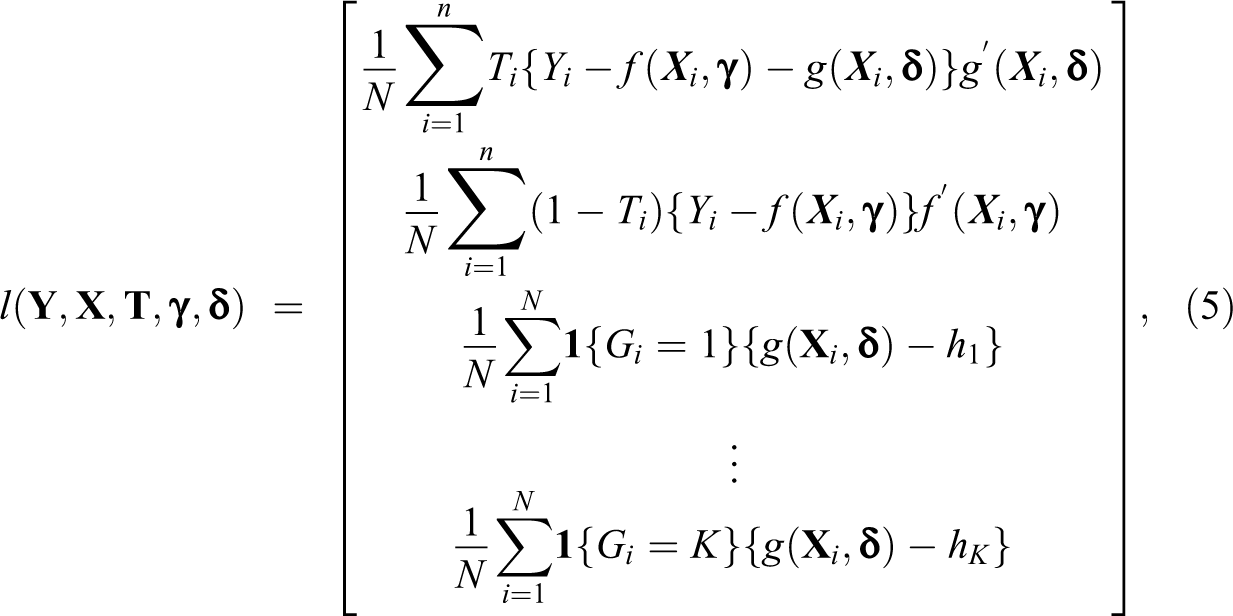
In the second section, we first show how to incorporate auxiliary information into statistical analyses of the list experiment and randomized response technique. This is done by applying the generalized method of moments approach (e.g., Handcock, Rendall, and Cheadle 2005; Hellerstein and Imbens 1999; Imbens and Lancaster 1994) to the multiple regression models of Imai (2011) and Blair et al. (2015). For the endorsement experiment, we embed auxiliary information in the Bayesian hierarchical model of Bullock et al. (2011) through the specification of the prior distribution. In all cases, the proposed methodology does not modify the original multiple regression models. Instead, auxiliary information is represented either as additional moment conditions (for the list experiment and randomized response technique) or as prior distributions (for the endorsement experiment). Thus, the interpretation of the fitted models remains unchanged.
In the third section, we apply the proposed methodology to survey experiments on an antiabortion referendum in the 2011 Mississippi General Election. Rosenfeld et al. (2016) administered and analyzed these experiments for the purpose of validating the accuracy of the list experiment, randomized response technique, and endorsement experiment. We incorporate the county-level official election results as auxiliary information and examine how each indirect questioning technique fares in recovering the sensitive trait at a lower level of aggregation. Specifically, we use precinct-level official election results on the sensitive referendum as a known benchmark to demonstrate the efficacy of our proposed approach. The availability of precinct-level results allows us to validate our methods.
Using this validation study, we find that auxiliary information substantially improves prediction: incorporating county-level election results reduces the root mean square error (RMSE) of precinct-level predictions by up to 60 percent and more than doubles the correlation between the estimates and their corresponding truths. We also find that incorporating auxiliary information substantially increases the statistical efficiency of indirect questioning estimators, at times even surpassing that of direct questioning. 1
At the individual level, we find that auxiliary information also improves the efficiency of regression coefficient estimates, revealing statistically significant differences in support for abortion across partisan affiliation and educational attainment. We view this as encouraging evidence for the utility of our method, as partisanship and higher education are among the strongest predictors of abortion attitudes in research based on efficient but potentially biased direct questioning (e.g., Adams 1997). By contrast, the initial analysis of our data by Rosenfeld et al. (2016) did not reveal statistically significant differences in partisanship or education due to the greater standard error of indirect questioning, though indirect techniques did achieve less biased estimates overall. By incorporating auxiliary information, we are thus able to mitigate one of the major drawbacks associated with indirect questioning techniques: their inefficiency relative to direct questioning.
In the fourth section, we conduct simulation studies to explore the conditions under which the proposed methodology is effective for improving inference about multivariate relationships. We find that our method is most effective when respondent characteristics vary greatly across groups such as states, counties, and precincts—that is, when respondents are highly segregated. Intuitively, when respondents who differ along a covariate are perfectly segregated, the group-level information conveys precise knowledge about the aggregate relationship between that covariate and the sensitive trait. However, when respondents are less segregated, the proposed methodology mainly improves inference for the intercept in multiple regression models. Our method is also less effective when covariates are highly correlated. Finally, the fifth section provides concluding remarks. The proposed methodology is implemented via the open-source statistical software, endorse: R Package for Analyzing Endorsement Experiments (Shiraito and Imai 2015), list: Statistical Methods for the Item Count Technique and List Experiment (Blair and Imai 2016), and rr: Statistical Methods for the Randomized Response Technique (Blair, Zhou, and Imai 2016), all of which are available through the Comprehensive R Archive Network (http://cran.r-project.org/).
The Proposed Methodology
In this section, we propose a new methodology that enables researchers to incorporate auxiliary information into the statistical analysis of the list experiment, randomized response technique, and endorsement experiment. Here, we show how to exploit the availability of auxiliary information on the outcome variable at an aggregate level and improve multiple regression analyses performed at a lower level of aggregation. Specifically, we represent auxiliary information as additional moment conditions for the multivariate analyses of the list experiment and randomized response technique. For the endorsement experiment, we incorporate it as part of the prior distribution for the Bayesian hierarchical measurement model. We use the Mississippi study (Rosenfeld et al. 2016) as a running example, but a similar methodological approach can be applied to different designs of these indirect questioning techniques.
List Experiment
The list experiment obscures individual responses by aggregating the sensitive trait with other control traits. The standard list experiment design begins by randomly dividing a sample of N respondents into two groups. The respondents in the control group (
In the Mississippi study, the respondents in the control group were asked the following question: Here is a list of four things that some people have done and some people have not. Please listen to them and then tell me HOW MANY of them you have done in the past two years. Do not tell me which you have and have not done. Just tell me how many: • discussed politics with family or friends, • cast a ballot for Governor Phil Bryant, • paid dues to a union, and • given money to a Tea Party candidate or organization. How many of these things have you done in the past two years? • Voted “yes” on the “personhood” initiative on the November 2011 Mississippi General Election ballot.

where
In this article, we exploit auxiliary information about the population mean of the sensitive trait for different groups. In our empirical example, we use the aggregate official election results, which contain the population proportion of yes votes in each of 19 counties in Mississippi, in order to improve the multivariate analyses of the list experiment carried out among a sample of voters. Formally, we assume knowledge of the following moments:

for each
To incorporate the auxiliary information given in equation (2), we consider the following moment condition:
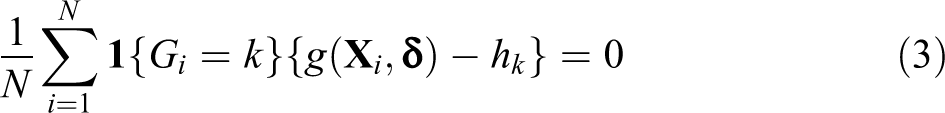
for each
Using equation (3) as an additional moment condition, we obtain the following generalized method of moments (GMM) estimator of

where
and
We have assumed that the population-level moments are known exactly. This assumption is appropriate for our application. However, in many circumstances, researchers may be concerned about the accuracy of auxiliary information and are not willing to assume that the population moments are known exactly. In such situations, we can specify a variance for the population-level moments in the GMM framework (Imbens and Lancaster 1994). Alternatively, we can conduct a sensitivity analysis by specifying a plausible range of values in order to examine the robustness of the resulting estimates to measurement error in auxiliary information.
Finally, an alternative strategy is to simply incorporate the auxiliary information as a covariate. Although straightforward to implement, this approach does not ensure that the model is consistent with the known prevalence at an aggregate level and hence cannot reduce bias. It also does not yield a statistical test that can be used to gauge whether modeling assumptions are appropriate. By contrast, our approach ensures that the predicted aggregate prevalence based on the model is consistent with the true prevalence (and if not, the overidentifying restriction test will be able to detect such a model misspecification). Thus, from a theoretical perspective, our approach is better suited to the present setting. In Online Appendix A, we also conduct an empirical comparison between our methodology and this alternative approach.
Randomized Response Technique
The randomized response technique, originally proposed by Warner (1965), obscures individual responses by adding random noise to respondents’ answers (see Blair et al. 2015, for a recent review). Under the “forced response” design, respondents are asked to use a randomization device, such as a coin flip, whose outcome is unobserved by the researcher. The randomization device determines whether the respondent is asked to answer the sensitive item truthfully or to reply with a forced answer, either “yes” or “no.” This technique affords the respondent some privacy because the enumerator is unsure if any individual response represents a truthful answer or a forced response.
In the Mississippi study, the following script was used to administer the randomized response technique, which included one practice round. Notice that, if a respondent answered the sensitive question affirmatively, the enumerator would not have been able to tell whether her response represented the outcome of a coin flip or an honest answer.
4
To answer this question, you will need a coin. Once you have found one, please toss the coin two times and note the results of those tosses (heads or tails) one after the other on a sheet of paper. Do not reveal to me whether your coin lands on heads or tails. After you have recorded the results of your two coin tosses, just tell me you are ready, and we will begin. First, we will practice. To ensure that your answer is confidential and known only to you, please answer “yes” if either your first coin toss came up heads or you voted in the November 2011 Mississippi General Election, otherwise answer “no.” Now, please answer “yes” if either your second coin toss came up heads or you voted “yes” on the “personhood” initiative, which appeared on the November 2011 Mississippi General Election ballot.

where
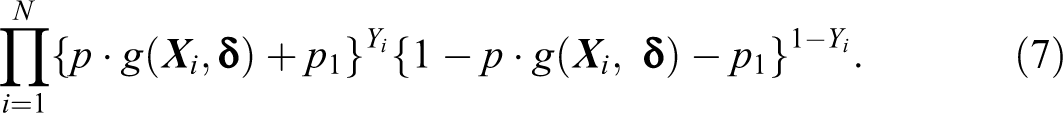
In the method of moments framework, the maximum likelihood estimate of
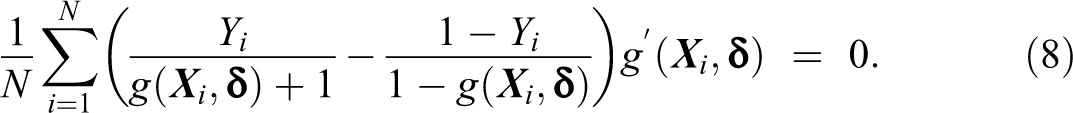
As before, the auxiliary information given in equation (3) can be easily incorporated to obtain the GMM estimator of
Endorsement Experiment
Endorsement experiments provide an indirect measure of support for socially sensitive actors by examining how endorsements by those actors influence support for a range of policies. This strategy exploits evaluation bias: The psychological tendency to evaluate items more positively when paired with other favorable items. In the Mississippi study, researchers sought to measure support for a sensitive policy (i.e., an antiabortion referendum). Therefore, they flipped the usual endorsement experiment design and measured how association with the policy item affected support for actors.
Under this design, a sample of N respondents are first divided into two groups. In the control group ( We’d like to get your overall opinion of some people in the news. As I read each name, please say if you have a very favorable, somewhat favorable, somewhat unfavorable, or very unfavorable opinion of each person. Phil Bryant, Governor of Mississippi? Very favorable Somewhat favorable Don’t know/no opinion Somewhat unfavorable Very unfavorable Refused Phil Bryant, Governor of Mississippi, who campaigned in favor of the personhood initiative on the 2011 Mississippi General Election ballot?
Our analysis of the endorsement experiment is based on the following statistical model proposed by Bullock et al. (2011). The observed response variable is a M category ordered response,

where
Finally, we model ideal points and support parameters as a function of respondent characteristics


The model is completed by specifying conjugate prior distributions on


Unlike the list experiment and randomized response technique, we incorporate the auxiliary information for the statistical analysis of the endorsement experiment through the specification of the prior distribution within the Bayesian hierarchical modeling framework. As before, the auxiliary information we consider is the aggregate proportion of individuals who would affirmatively answer the sensitive question within each subgroup of the population. In the current context, we can formally express this as follows,

for each group
To do this, we define

where

Thus, given the default value of
This approach contrasts with our extensions of the list experiment and randomized response technique in that it is difficult to incorporate auxiliary information into endorsement models with covariates. This is because there is no straightforward way to generate prior distributions for the coefficients of covariates that are consistent with the aggregate information. While it is possible to improve inference for the coefficients of individual-level covariates within a more complicated Bayesian framework (e.g., Hanson et al. 2014; Jackson et al. 2008; Raftery, Givens, and Zeh 1995), one advantage of our approach is that it is possible to improve predictions for lower-level units in hierarchically structured data. We demonstrate this in our empirical application, where we are able to significantly improve prediction of precinct-level election results by incorporating the county-level results.
To do this, we simply define

where
Finally, an additional advantage of this Bayesian approach is that there is no need to modify the original Markov chain Monte Carlo algorithm proposed by Bullock et al. (2011). In fact, the posterior sampling can be done using the endorse package (Shiraito and Imai 2015) by simply modifying the specification of the prior distribution.
An Empirical Validation Study
In this section, we apply the proposed methodology to an empirical reanalysis of survey experiments conducted among voters in the November 2011 Mississippi General Election. Of special interest in this election was the so-called personhood amendment, which would have revised the Mississippi constitution to declare that life begins at conception. In the run-up to the election, public opinion polls showed substantial support for the amendment. However, the amendment was ultimately defeated by a margin of 42.4 percent to 57.6 percent. As explained in the previous section, after the election, researchers conducted the list experiment, randomized response technique, and endorsement experiment among a stratified sample of 2,655 individuals who voted in the Mississippi General Election, according to voter records maintained by the Mississippi Secretary of State (see Rosenfeld et al. 2016, for more details).
Using official election results from the Mississippi Secretary of State, we are able to demonstrate the value of incorporating auxiliary information on the sensitive item. Specifically, we exploit 19 subpopulation moments—representing the official vote share of each county included in the study—to improve the efficiency of parameter estimates in models with individual-level covariates. In addition, because official vote tallies are available at the precinct level, we are able to show how incorporating county-level information improves predictive validity at a lower level of aggregation by comparing our precinct-level estimates to the corresponding official election results. Of course, if researchers were genuinely interested in estimating the precinct-level vote share, the availability of the precinct-level results would make this analysis redundant. However, our interest is in validating the proposed methodology; therefore, the precinct-level results serve as a known benchmark against which to judge the efficacy of our approach. In practice, our method is applicable to any lower-level unit (subpopulation) for which the distribution of the sensitive trait is unknown. These include, for example, different levels of a covariate such as age (e.g., Imbens and Lancaster 1994).
Precinct-level Results
We begin by incorporating the county-level official election results as auxiliary information and assessing how well each indirect questioning technique recovers the precinct-level election results. The results allow us to quantify how these methods perform with the addition of the auxiliary information. The models for the list experiment and randomized response technique include as the covariates party ID, gender, and age, all of which are recorded in the voter history file. These models incorporate county-level information through the GMM approach discussed in the List Experiment and Randomized Response Technique subsections. The models we use are based on the logistic regressions described by Imai (2011) and Blair et al. (2015) and are implemented via the R packages, list and rr.
After fitting each model, we follow Rosenfeld et al. (2016) and use the resulting parameter estimates to predict vote choice for all individuals who official records indicate cast a ballot in the 19 Mississippi counties included in our study. Aggregating these predictions yields regression-adjusted estimates of support based on poststratification for the sensitive item in the population of interest. Using official voter-file information on the population in this way allows us to make predictions at the precinct level where the number of survey respondents is very small. To compute the standard error of these predictions, we simulate 1,000 replicates of the model parameters from the multivariate normal distribution and calculate the standard deviation of the resulting set of predicted values.
For the endorsement experiment, we use a different approach as it is not straightforward to incorporate auxiliary information into the model with covariates. The model for the endorsement experiment, as explained in the Endorsement Experiment subsection, incorporates the county-level information into a Bayesian hierarchical modeling framework through the specification of informative priors. In particular, we assume the prior distribution for the precinct coefficients
Figure 1 compares the precinct-level estimates with and without county-level auxiliary information for each of the three techniques. In each plot of the figure, we compare the estimates and their associated 95 percent confidence intervals on the y-axis against the corresponding actual vote share on the x-axis. The first column reports the baseline estimates without the addition of auxiliary information, while the second column reports estimates that incorporate the official county-level vote shares. The 45° red line thus indicates perfect correspondence between the estimates and the actual vote share, while points above (below) represent over- (under-) estimates.
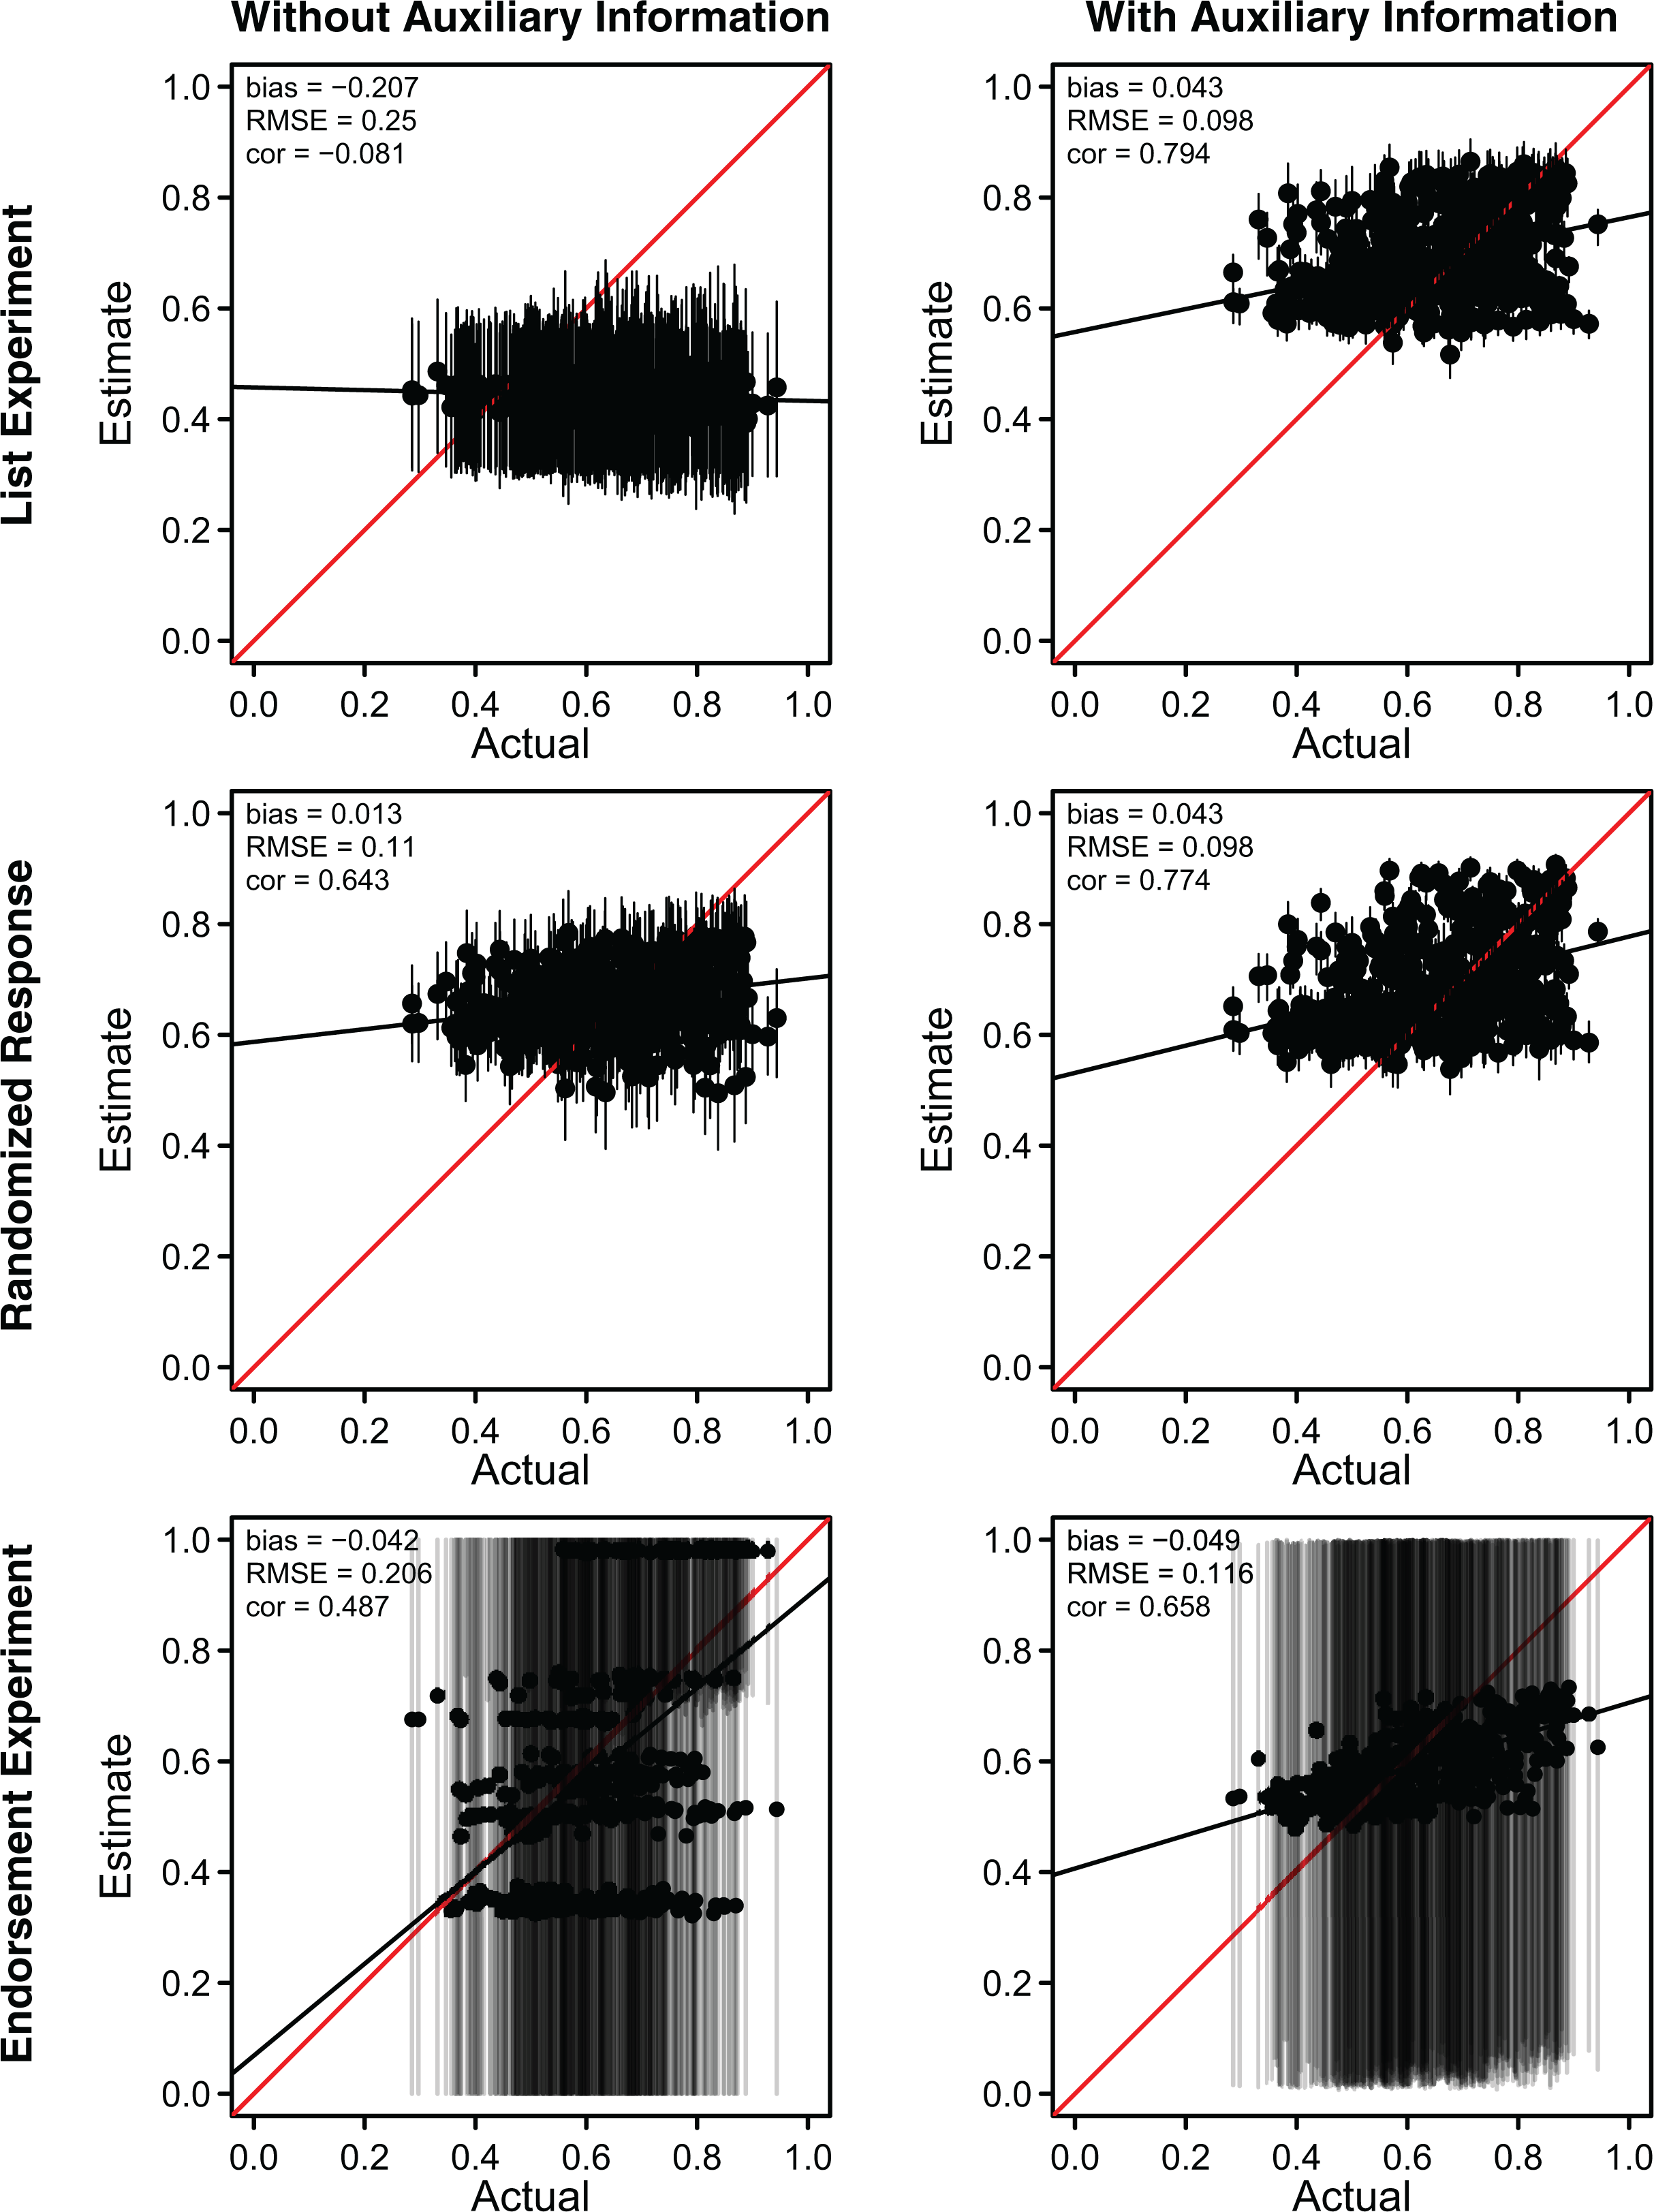
Predicted versus actual election results with and without auxiliary information. This figure compares the precinct-level election results with predictions based on the list experiment, randomized response technique, and endorsement experiment. The first row corresponds to the standard estimators without auxiliary information, while the second row corresponds to the estimators with county-level auxiliary information. Auxiliary information reduces the root mean square error of precinct-level predictions by up to 60 percent and substantially increases the correlation. All estimates are regression-adjusted with individual covariates from voter files except for the endorsement experiment with auxiliary information for reasons discussed in the Endorsement Experiment subsection.
We find that auxiliary information substantially improves prediction. Incorporating county-level election results reduces the RMSE of precinct-level predictions across all three methods. In the case of the list experiment, the county-level information reduces the RMSE by more than 60 percent. The RMSE of the endorsement experiment estimates falls by more than 40 percent. Adding auxiliary information also significantly strengthens the correlation between the estimates and their corresponding true values. The improvements are largest for the list experiment, which was initially least accurate, and more modest for the randomized response technique, which was initially more accurate. For the endorsement experiment, both correlation and RMSE are significantly improved by adding auxiliary information (ρ = .487 vs. .658 and RMSE = .206 vs. .116).
Thus, for all three methods, the benefits of auxiliary information for lower-level predictions are evident in the lower RMSE and higher correlation with the true values. Incorporating auxiliary information also reduces bias in the list and endorsement experiments, though not in the randomized response technique where bias was initially very low. Finally, as the smaller confidence intervals in the second column of Figure 1 suggest, incorporating the county-level election results reduces the standard errors of the estimates—a further benefit of exploiting auxiliary information which we demonstrate more fully in the next section. The auxiliary information thus helps to offset the greater variance of indirect questioning relative to direct questioning.
Comparison with Direct Questioning
Although indirect questioning methods have been shown to reduce bias (e.g., Rosenfeld et al. 2016), they are typically less efficient than direct questioning. Here, we demonstrate that the proposed methodology can help mitigate and even reverse the efficiency losses entailed by indirect questioning. To do this, we compare the average size of standard errors for the precinct-level predictions from the analysis of indirect questioning in the Precinct-level Results subsection to the average size of the standard errors for direct questioning.
To generate predictions based on direct questioning, we leverage the fact that the original Mississippi validation study included an item that asked respondents directly if they had voted for the personhood amendment. Thus, the vast majority of respondents were asked directly as well as indirectly about their vote choice. As expected, direct questioning yielded statistically efficient predictions that were also highly biased (Rosenfeld et al. 2016). We begin our comparisons by randomly sampling respondents who received the direct question in order to produce three subsamples that are equal in size to the three indirect questioning samples. This procedure, which allows us to construct fair comparisons between direct questioning and each indirect questioning technique, resulted in one direct sample of 1,325 respondents, matching the number of respondents in the list experiment sample, one direct sample of 818 respondents for the randomized response technique sample, and one direct sample of 1,841 respondents for the endorsement experiment sample. 5
For comparison with the list experiment and randomized response technique estimates, we generate precinct-level predictions from direct questioning using the identically sized samples just mentioned. Specifically, we fit logistic regression models with the same voter-file covariates as were used to produce the estimates in Figure 1: party ID, gender, and age. To compute the standard error of these estimates, we use the same Monte Carlo simulation approach described above. We then compare the average size of these standard errors with the corresponding average standard errors for the precinct-level estimates based on indirect questioning reported in the Precinct-level Results subsection—both with and without auxiliary information.
To compare the efficiency of our approach to the endorsement experiment with direct questioning, we use a direct questioning sample of equal size to generate predictions from a comparable probit model with precinct random effects in place of individual-level covariates. This follows the approach to the endorsement experiment used in the Precinct-level Results subsection. Specifically, letting

where
Table 1 reports the findings. The table shows the average standard errors along with the ratio of the indirect questioning average standard errors to the direct questioning average standard errors. 6 We use the latter as a measure of relative efficiency. Ratios greater (less) than 1 indicate that the estimator is less (more) efficient than direct questioning. We confirm that indirect questioning typically results in a large efficiency loss when no auxiliary information is available as shown in previous simulation studies (e.g., Blair et al. 2015; Imai 2011). This can be seen in the ratios of the standard errors without auxiliary information to the standard errors from direct questioning in Table 1, which range from 1.574 to 3.963.
Comparing Efficiency of Direct Questioning to Indirect Questioning with and without Auxiliary Information.
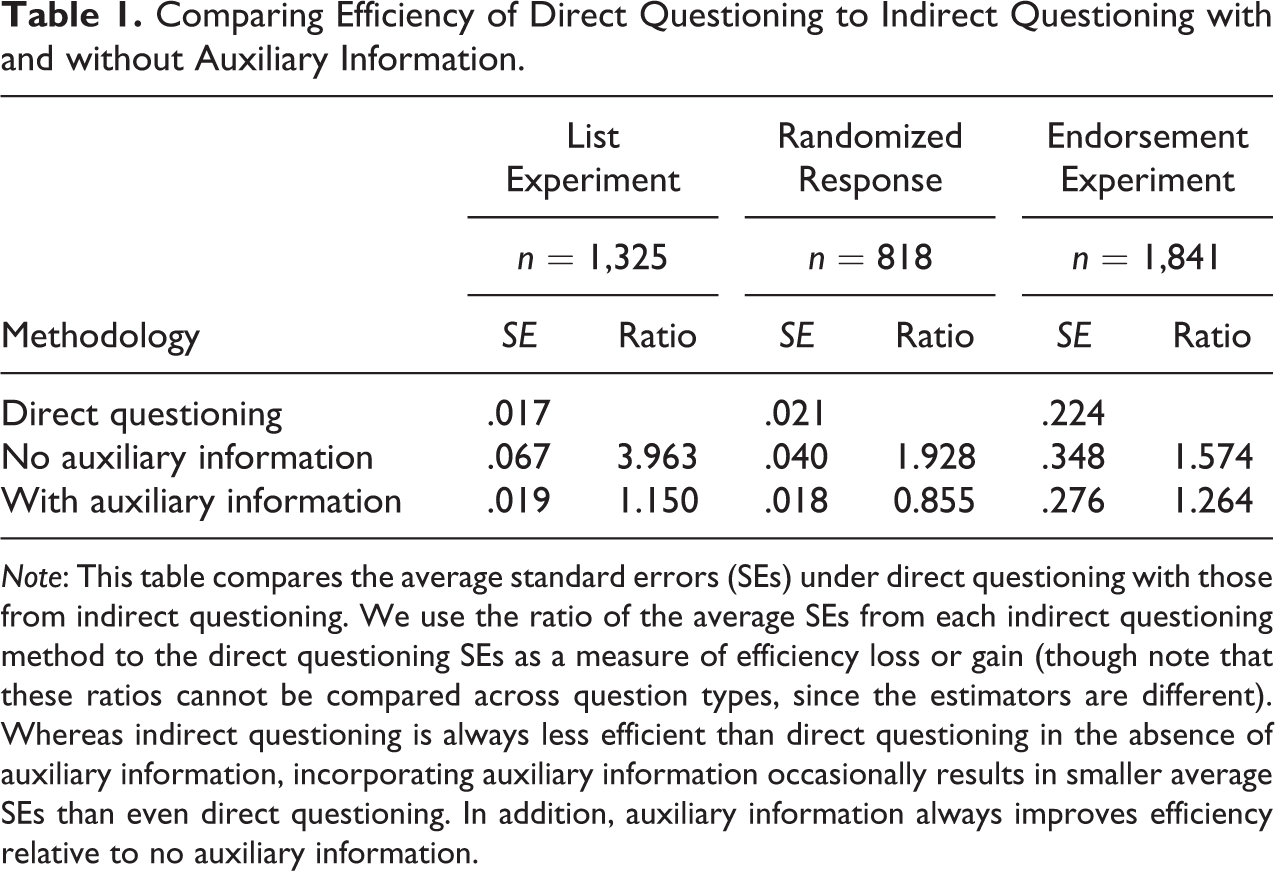
Note: This table compares the average standard errors (SEs) under direct questioning with those from indirect questioning. We use the ratio of the average SEs from each indirect questioning method to the direct questioning SEs as a measure of efficiency loss or gain (though note that these ratios cannot be compared across question types, since the estimators are different). Whereas indirect questioning is always less efficient than direct questioning in the absence of auxiliary information, incorporating auxiliary information occasionally results in smaller average SEs than even direct questioning. In addition, auxiliary information always improves efficiency relative to no auxiliary information.
However, we also find that incorporating auxiliary information significantly reduces, and may even reverse, this efficiency loss. With the addition of auxiliary information, the proposed estimator based on the randomized response technique is, in fact, about 15 percent more efficient than the estimator based on direct questioning. Although the estimators based on the list and endorsement experiments remain 15 percent and 26 percent less efficient than direct questioning, respectively, the efficiency gains from adding auxiliary information to the list and endorsement experiment models are also substantial. Together with the findings of the Precinct-level Results subsection, our results indicate that auxiliary information effectively alleviates both bias and imprecision when using indirect questioning techniques.
Individual-level Results with Auxiliary Information
Next, we investigate whether incorporating auxiliary information improves inference at the individual level, focusing on the list experiment and randomized response technique. Ideally, we would like to assess whether incorporating auxiliary information improves the accuracy of predictions among subgroups with particular covariate profiles. Unfortunately, the true vote choice for any specific individual is unavailable from official records. Thus, we compare the association between individual-level covariates and responses to the sensitive item across the methods.
Following Rosenfeld et al. (2016), our analysis focuses on support for the personhood referendum by gender, party identification, and educational level. We conduct a multiple regression analysis using the GMM approach detailed in the second section. Given the goal of our analysis, the specifications include a larger set of survey-measured covariates including gender, party identification, education, age, and age squared. We use survey-measured covariates for this analysis to minimize problems of missingness in the voter-file covariates. These specifications thus differ slightly from the specifications used to produce the poststratified estimates in Figure 1, which included only voter-file covariates compatible with available population data to produce regression-adjusted population estimates.
Figure 2 presents a comparison of the estimated share of the sensitive trait across several subgroups of the population. We omit the results for age as neither of the two age variables was statistically significant in any of the models. For each category of respondents, the figure presents four estimates: open circles denote estimates from the list experiment without auxiliary information; closed circles denote estimates from the list experiment with auxiliary information; open squares represent randomized response estimates without auxiliary information; and closed squares represent randomized response estimates with auxiliary information. As before, the added auxiliary information consists of county-level vote shares.
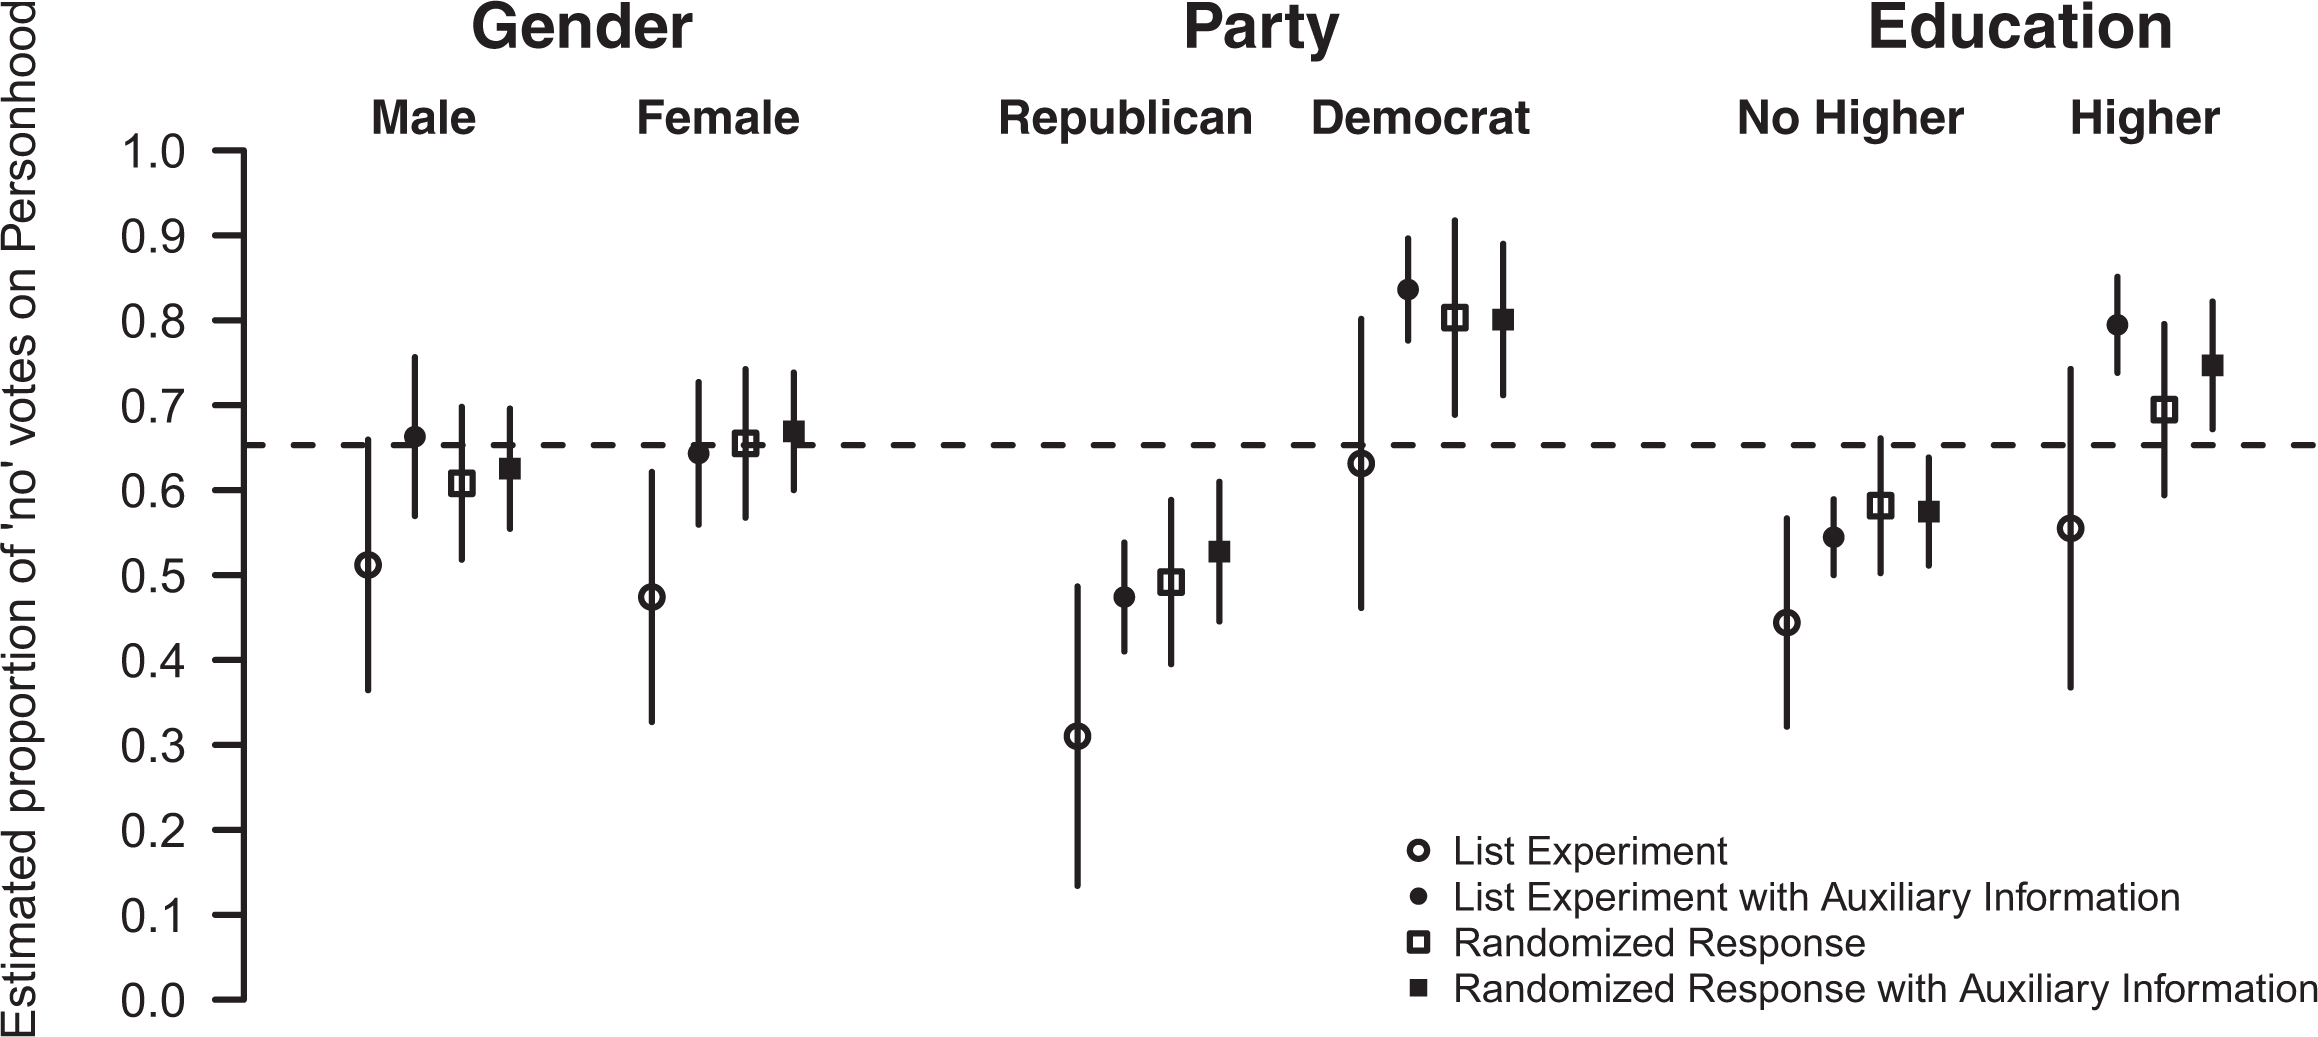
Comparison of responses across subgroups based on models with individual-level covariates. This figure compares the estimated prevalence of the sensitive trait, voting against the personhood referendum, across several categories of respondents based on gender, party identification, and educational level. The results in this figure are based on survey-measured covariates. For each subgroup, the figure presents four estimates using the list experiment, the list experiment with auxiliary information, the randomized response technique, and the randomized response technique with auxiliary information. The vertical bars indicate 95 percent confidence intervals.
We begin by noting that the estimates based on auxiliary information are more consistent across methods than the estimates without it. They are also generally closer to the statewide mean. The effect of incorporating auxiliary information is especially pronounced for the list experiment (i.e., the open and closed circles in Figure 2). Incorporating auxiliary information greatly reduces the variance of the predictions from the list experiment and brings them closer to the estimates from randomized response technique. Given that the list experiment was found by Rosenfeld et al. (2016) to yield the most biased estimates in previous analyses of these data, we interpret the fact that the auxiliary information brings the list experiment estimates into greater alignment with the randomized response estimates as an encouraging sign that our approach is potentially effective for reducing bias.
Additionally, by comparing the lines (representing 95 percent confidence intervals) extending from the open and closed shapes in Figure 2, we can see that the auxiliary information increases the precision of estimates and alters our statistical inference for partisan affiliation and education. Whereas the list experiment did not initially show statistically significant differences in support between Democrats and Republicans, incorporating the county-level results reveals statistically significant differences in partisanship. Additionally, while neither the list experiment nor the randomized response technique showed statistically significant differences in education, incorporating auxiliary information indicates that voters with higher education were significantly more likely to vote against the personhood amendment relative to those without higher education. We view this as an encouraging sign given that partisanship and education have been found to be substantively important and strong predictors of abortion attitudes in research based on efficient but potentially biased direct questioning (e.g., Adams 1997). 7 By improving the efficiency of indirect questioning, our approach enables researchers to balance the need for accurate estimates of sensitive traits with the need to examine individual-level heterogeneity efficiently.
Specification Test
Lastly, we perform a specification test for the list experiment and randomized response technique to test the fundamental assumption of our approach to the list experiment and randomized response technique, which is that the model parameters are constant across counties (or, more generally, across the groups corresponding by the auxiliary constraints). This assumption can be tested using the standard overidentification test, which gauges whether the observed data are consistent with the orthogonality conditions used in equation (3). Given that the validity of indirect questioning techniques is the subject of growing literature, which has at times yielded conflicting results, we strongly recommend that researchers conduct the overidentification test, which provides a principled means of deciding whether large deviations from the population moments are due to sampling variability, model misspecification, or residual bias in indirect questioning. Table 2 presents the coefficient estimates, standard errors, and results of the overidentification test for the list experiment and the randomized response technique used to produce the poststratified estimates presented in Figure 1, first without and then with the auxiliary county-level information.
Specification Test with and without Auxiliary Information.
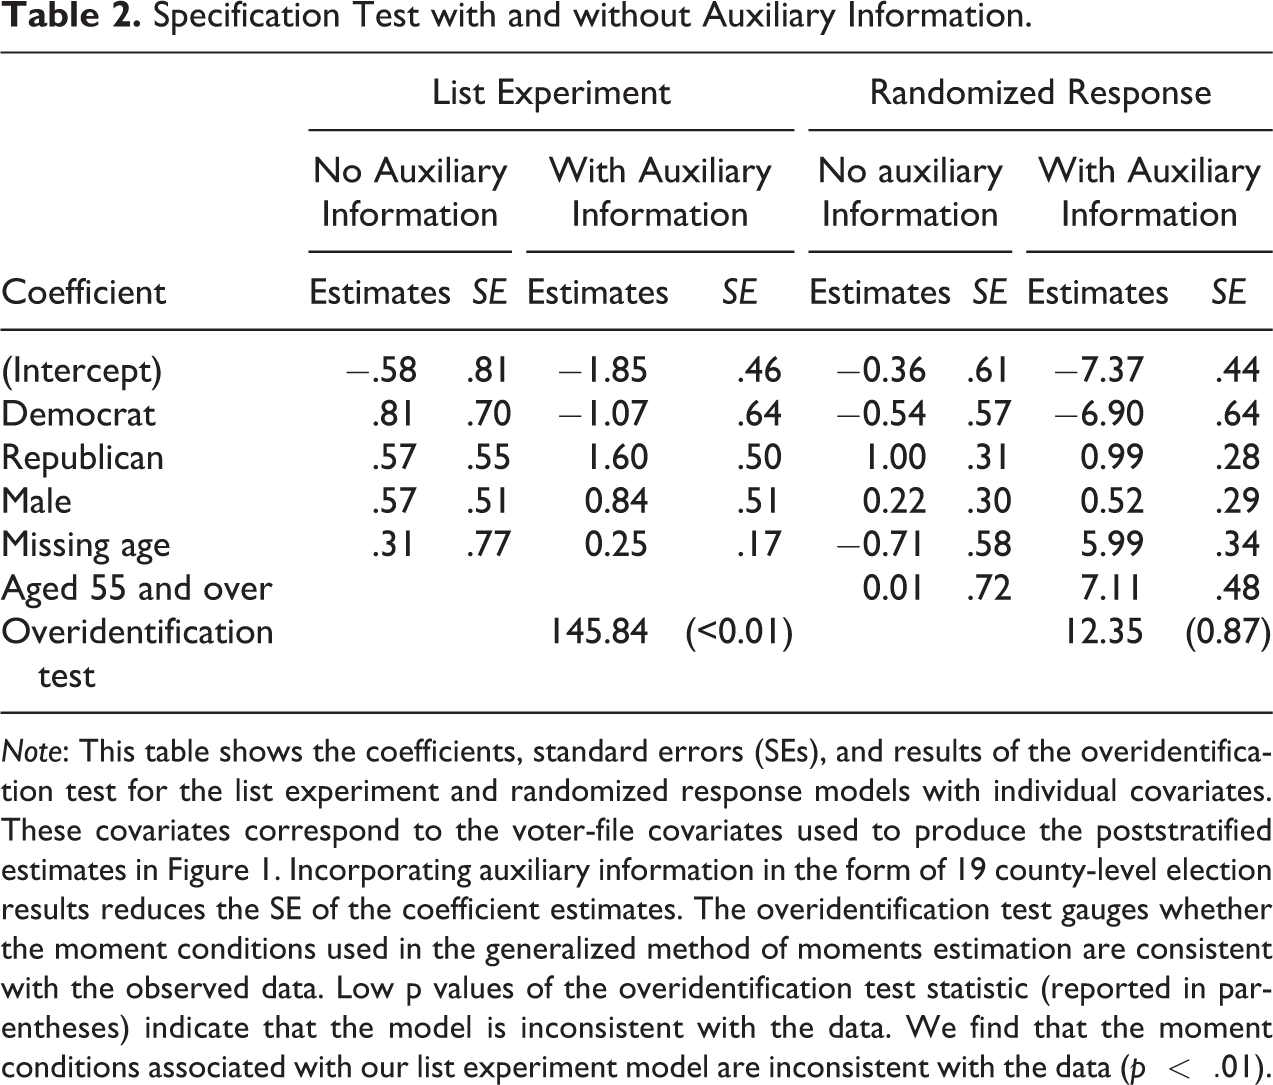
Note: This table shows the coefficients, standard errors (SEs), and results of the overidentification test for the list experiment and randomized response models with individual covariates. These covariates correspond to the voter-file covariates used to produce the poststratified estimates in Figure 1. Incorporating auxiliary information in the form of 19 county-level election results reduces the SE of the coefficient estimates. The overidentification test gauges whether the moment conditions used in the generalized method of moments estimation are consistent with the observed data. Low p values of the overidentification test statistic (reported in parentheses) indicate that the model is inconsistent with the data. We find that the moment conditions associated with our list experiment model are inconsistent with the data (
We find that incorporating auxiliary information reduces the size of the standard errors for virtually all coefficients in both the list experiment and the randomized response technique. This increased efficiency is due to the additional orthogonality conditions implied by our auxiliary information. However, the large test statistic (and its corresponding small p value shown in parentheses) from the overidentification test for the list experiment indicates that the moment conditions in equation (3) are inconsistent with the observed data. While this indicates that at least some aspects of our model for the list experiment are invalid, the finding is consistent with the analysis of these data by Rosenfeld et al. (2016), which shows that the list experiment yielded substantially more biased estimates relative to the randomized response technique and the endorsement experiment. On the other hand, the overidentification test for the randomized response technique implies that the model’s overidentifying restrictions are consistent with the observed data (p = .87). We therefore conclude that our assumption that the model and set of parameters are constant across counties is reasonable given the data.
Simulation Studies
In this section, we conduct two simulation studies to explore the conditions under which our method is effective for improving inference for multivariate relationships. We focus on the proposed estimators for the list experiment and randomized response technique, as our approach for the endorsement experiment is more appropriate for improving predictions in hierarchically structured data rather than improving multivariate inference for individual-level covariates.
Simulations under Correct Model Specification
We begin our baseline simulations by generating the sensitive trait according to the following logistic regression model,

which was the basic model analyzed by Imai (2011) and Blair et al. (2015) for the list experiment and randomized response technique, respectively. The covariate vector
We then assess the performance of our estimators by varying the correlation between the group assignment and the covariates, where we simulate
We focus on the following four scenarios, in which the researcher knows the prevalence of the sensitive trait in all
In the no segregation scenario, both
In the segregation on
In the segregation on
In the
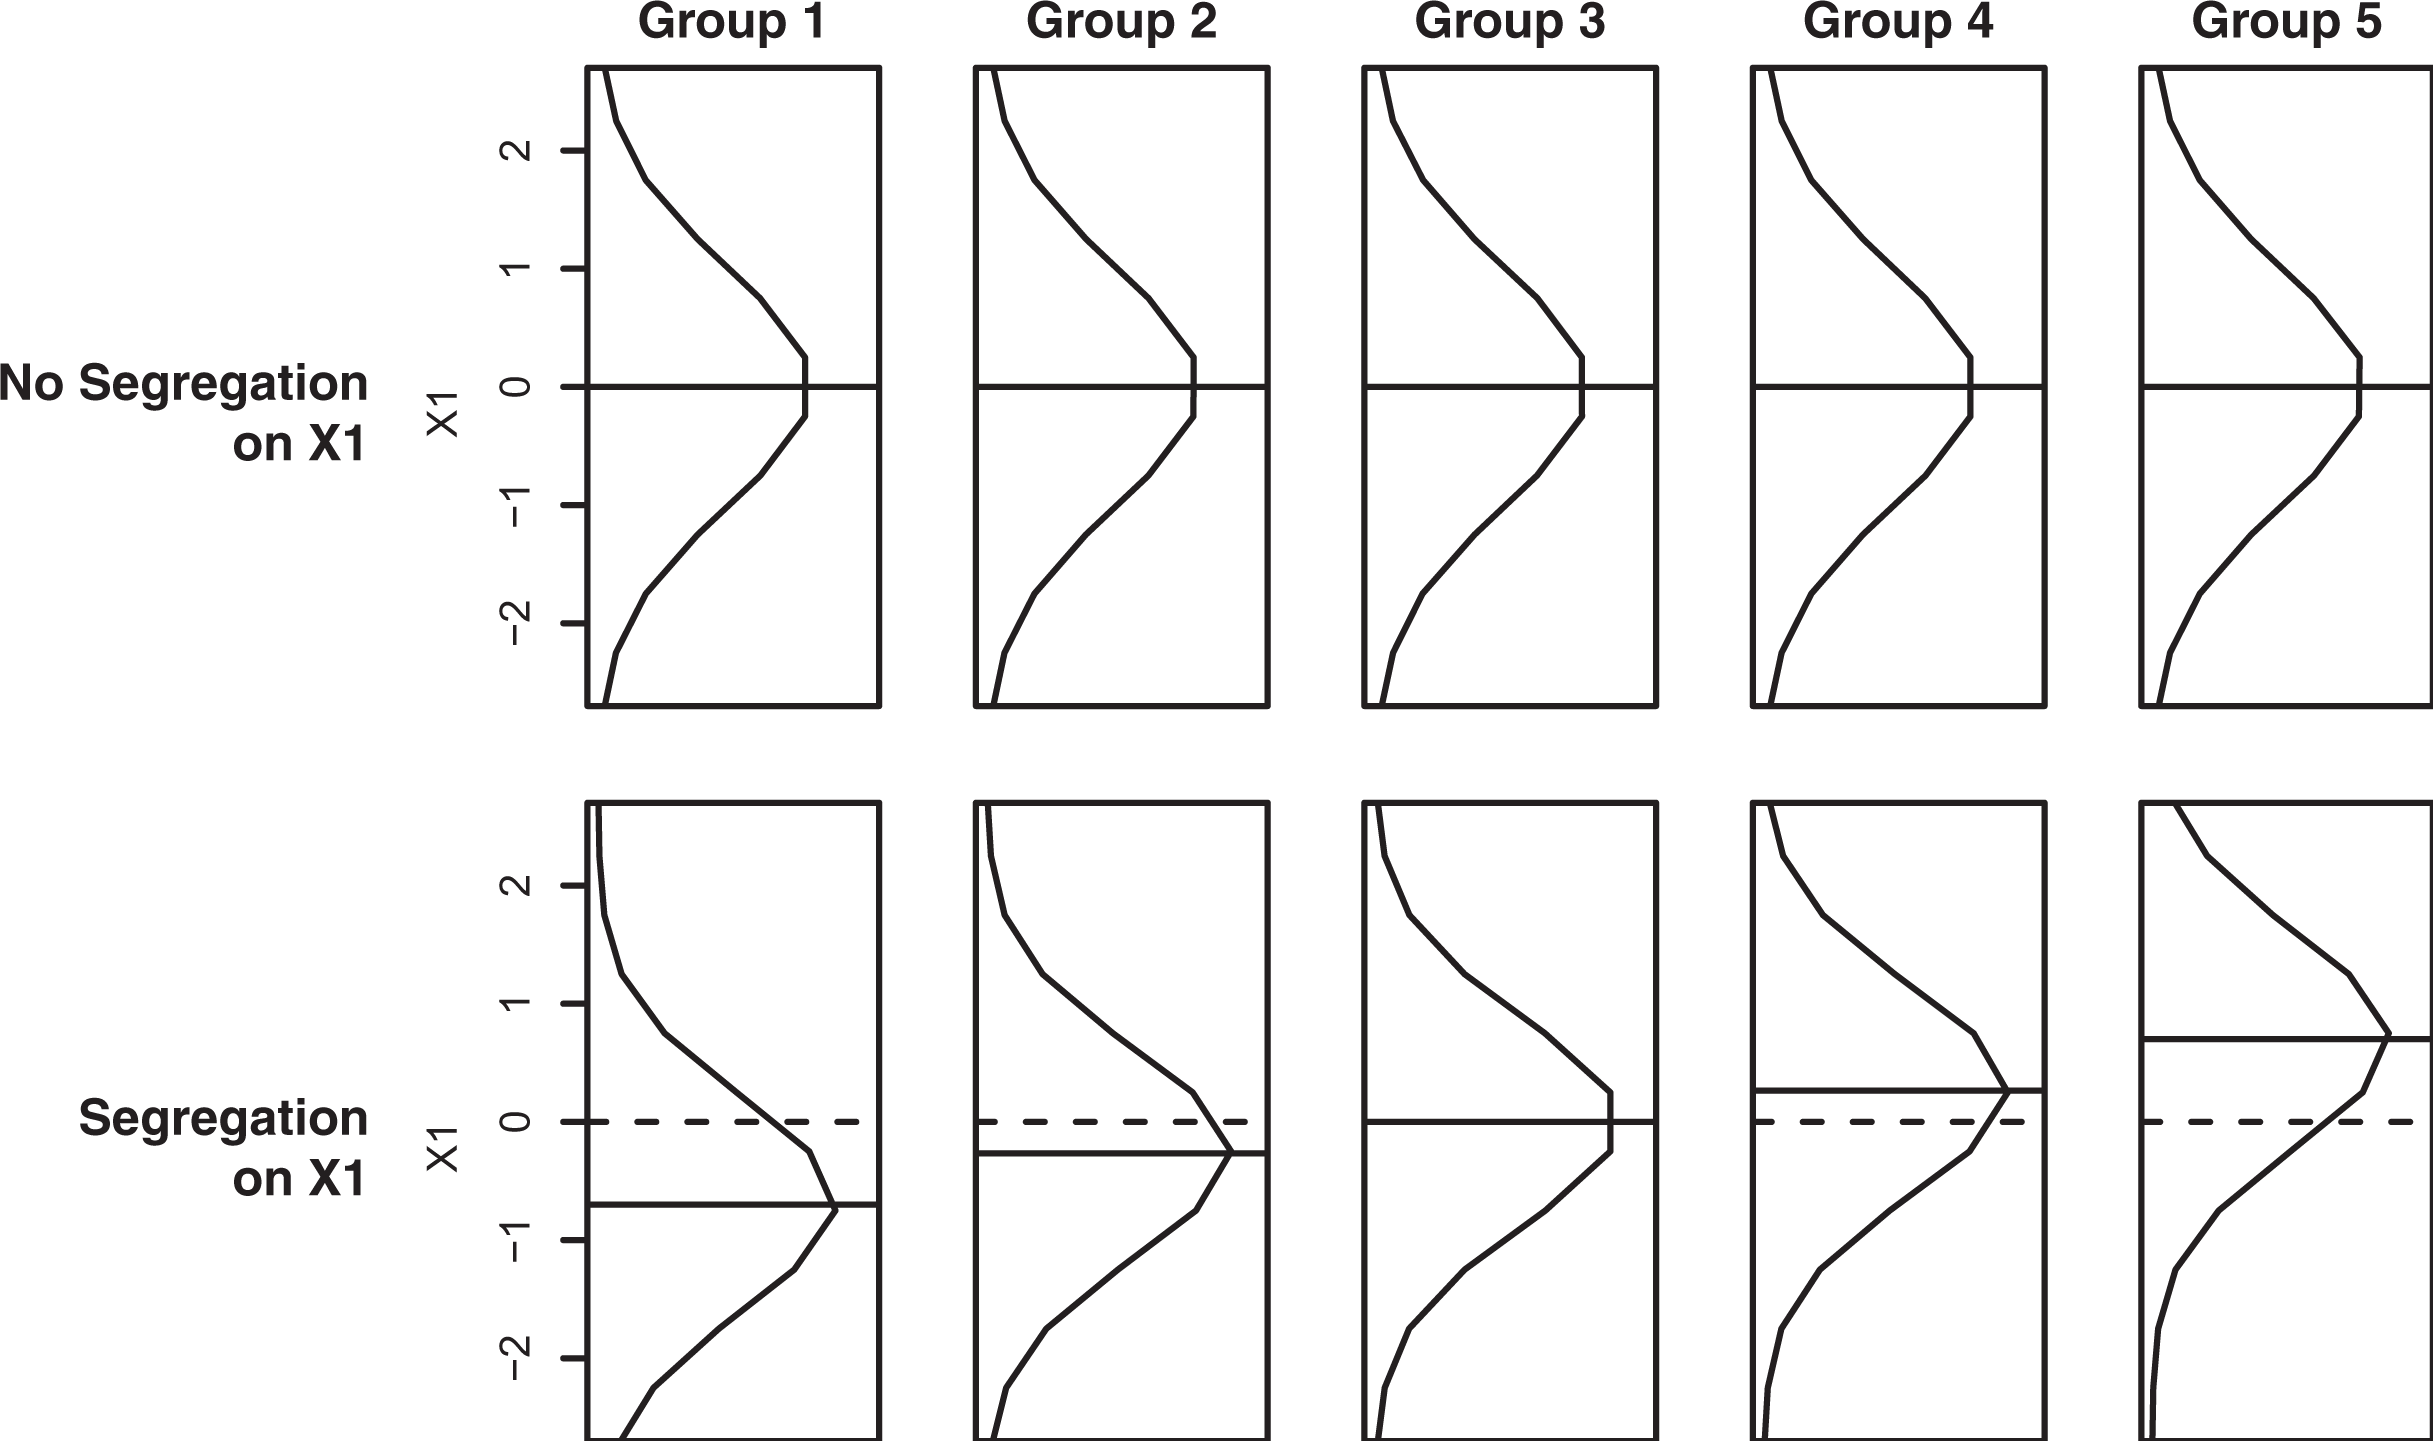
No segregation versus segregation scenarios. This figure illustrates the simulated distribution of
Once we simulate these varying levels of segregation, we proceed to estimate the parameters of interest δ for each indirect questioning technique with and without auxiliary information. Our results are summarized in Figures 4 and 5 for the list experiment and the randomized response technique, respectively. The three columns in each figure correspond to the coefficient for the intercept
In Figure 4, the standard list experiment estimator without auxiliary information is represented by open lines and solid circles. Comparing the standard estimator to the other four lines, we find that the auxiliary information results in lower levels of bias across all four scenarios, although these gains converge to zero as the sample size increases. This finding, which is indicated by the downward sloping lines in the first row of Figure 4, is due to the fact that the standard estimator for the list experiment is also consistent despite its inefficiency.
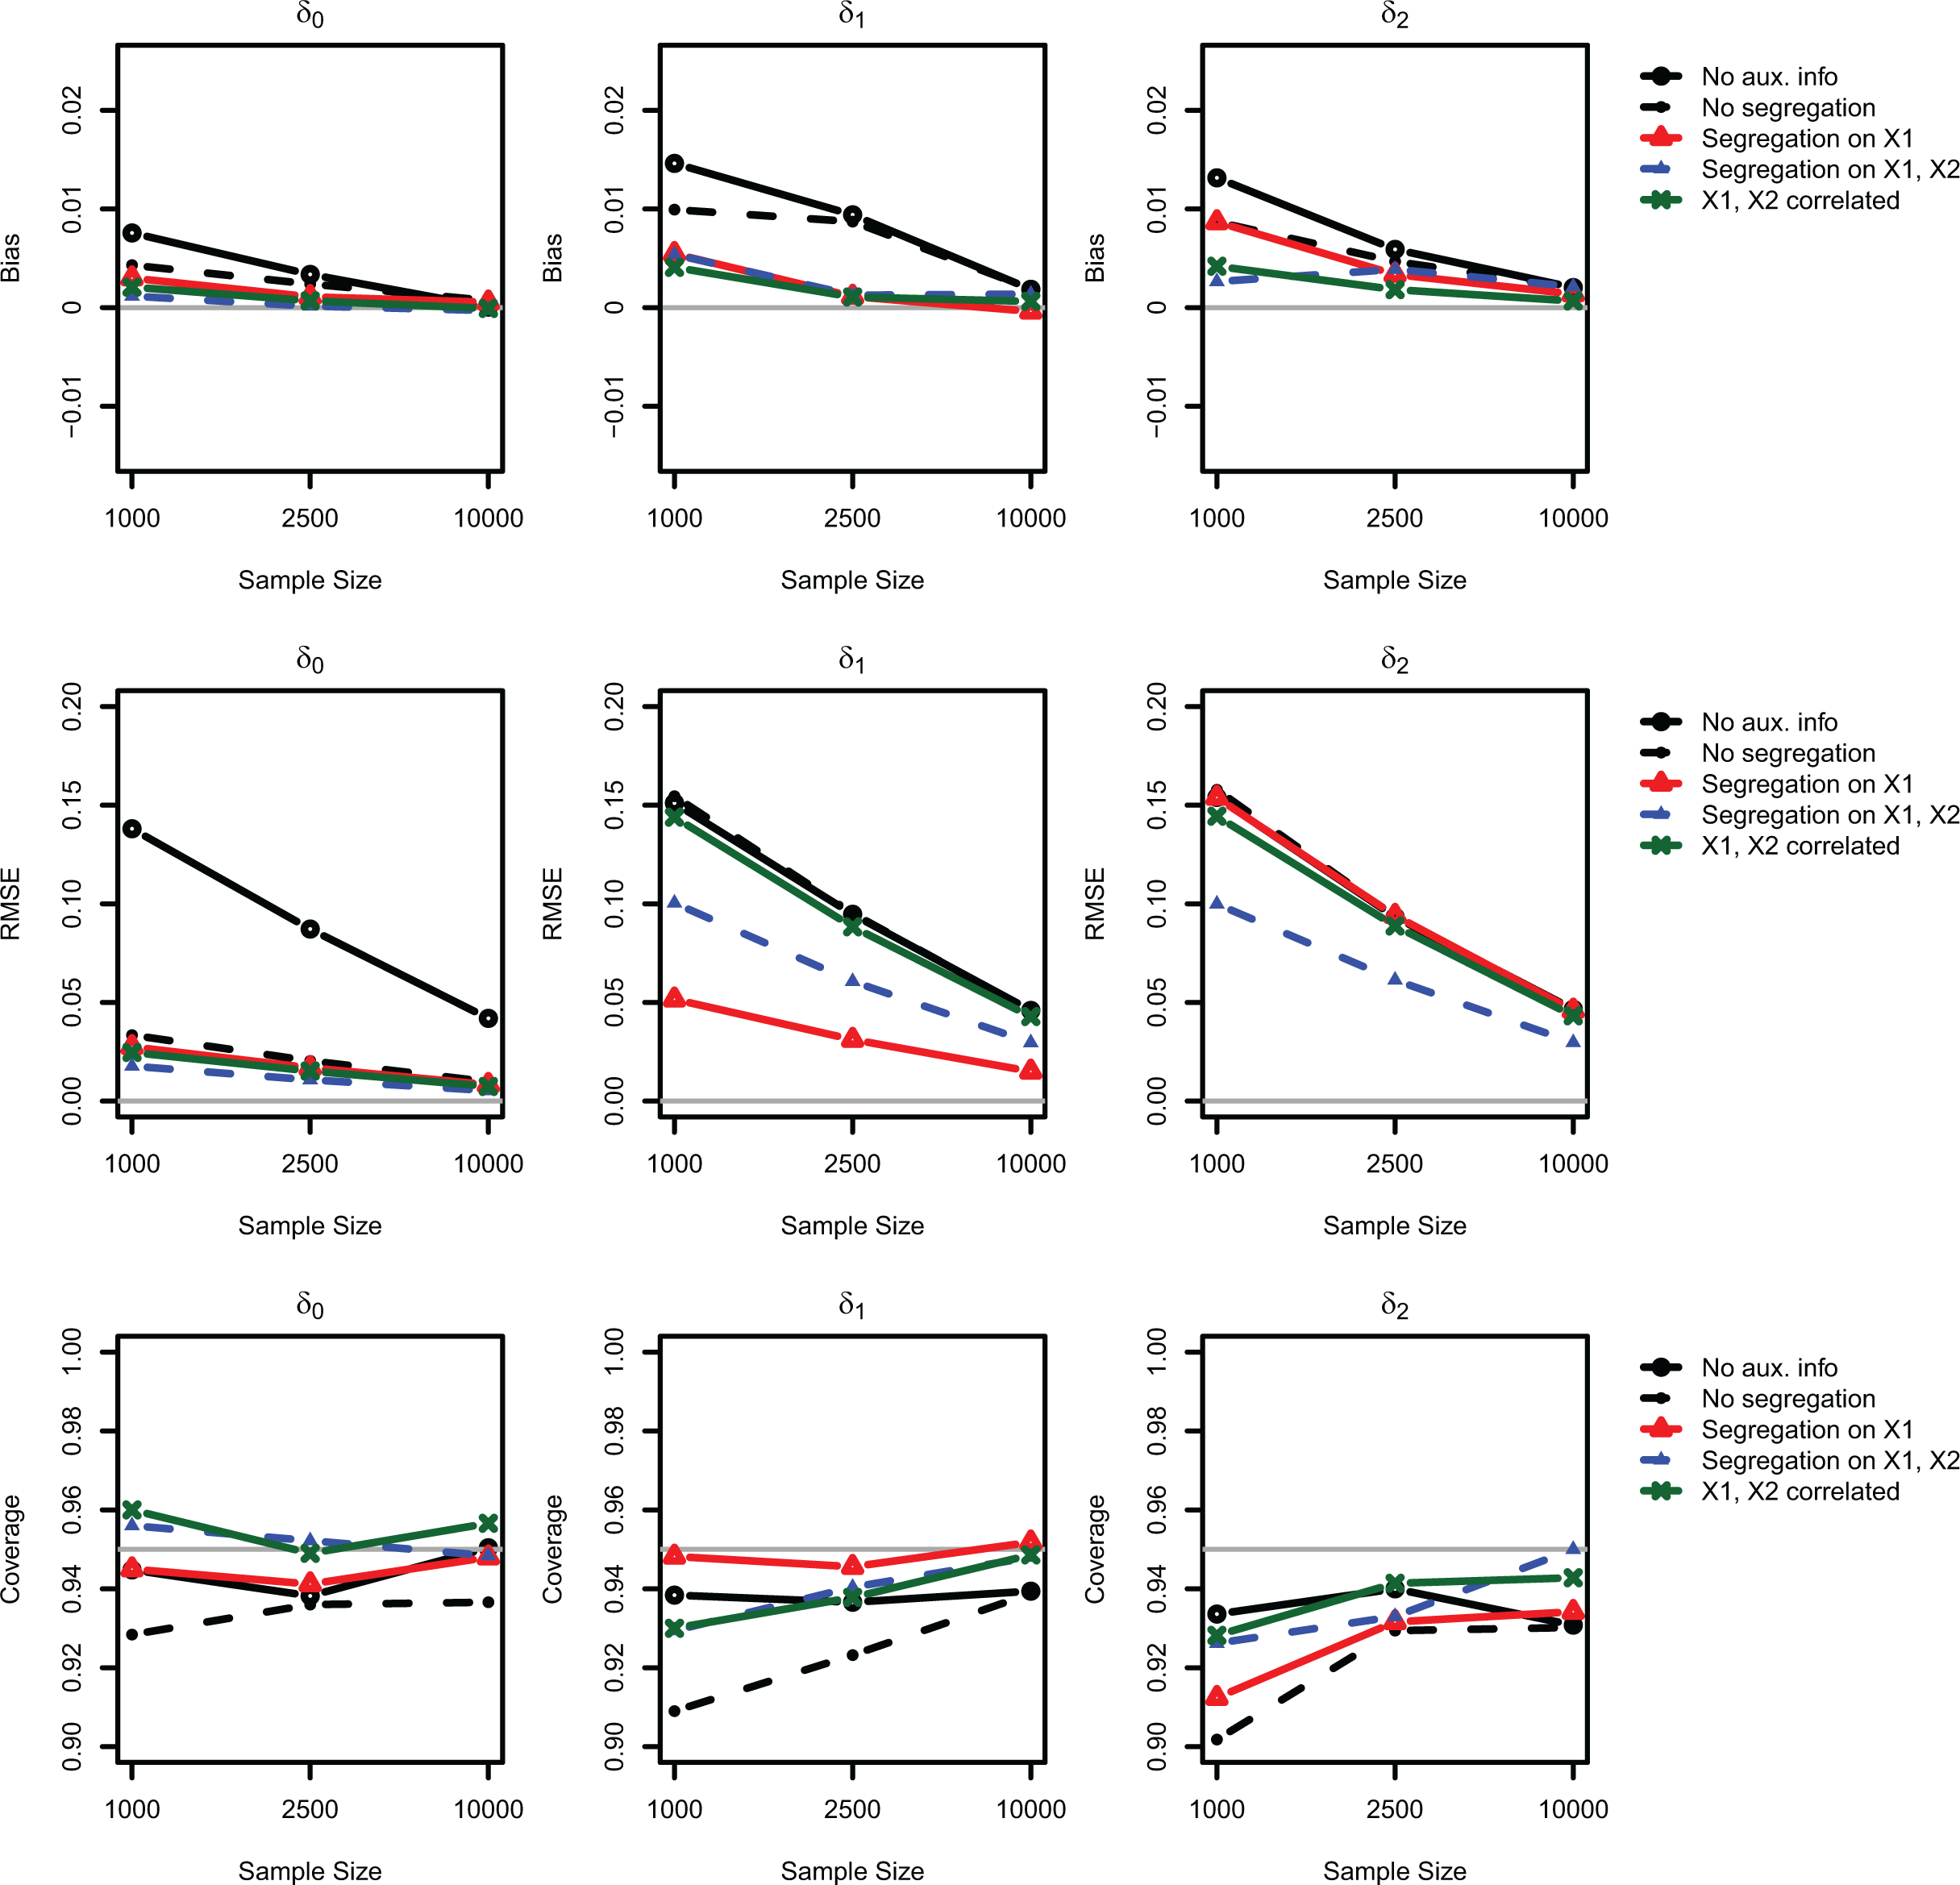
Empirical performance of the proposed estimator for the list experiment with auxiliary information. This figure illustrates the bias, root mean square error, and coverage of 95 percent confidence intervals for the nonlinear least squares estimator of Imai (2011), with and without auxiliary information, over 5,000 Monte Carlo simulations. The continuously updating generalized method of moments estimator is used for all simulations. Each line corresponds to a different scenario: open circles and solid lines correspond to the baseline estimator with no auxiliary information; closed circles and dashed lines correspond to the no segregation scenario; open triangles and solid lines correspond to the segregation on
On the other hand, the improvements in the RMSE are confined to the scenarios when covariates are correlated with the group assignment, which results in a nonuniform distribution of the covariates across groups. This can be seen by focusing on the triangles in the second row of Figure 4, which represent the segregation on
Even when there is segregation on both covariates, however, the improvements in the RMSE are much smaller when
Turning to the randomized response technique in Figure 5, we find that, although the improvements in bias are smaller due to the greater overall efficiency of the randomized response technique, the improvements in RMSE follow a similar pattern. This can be seen by focusing on the triangles in the second row of Figure 5, which again correspond to scenarios with segregation on
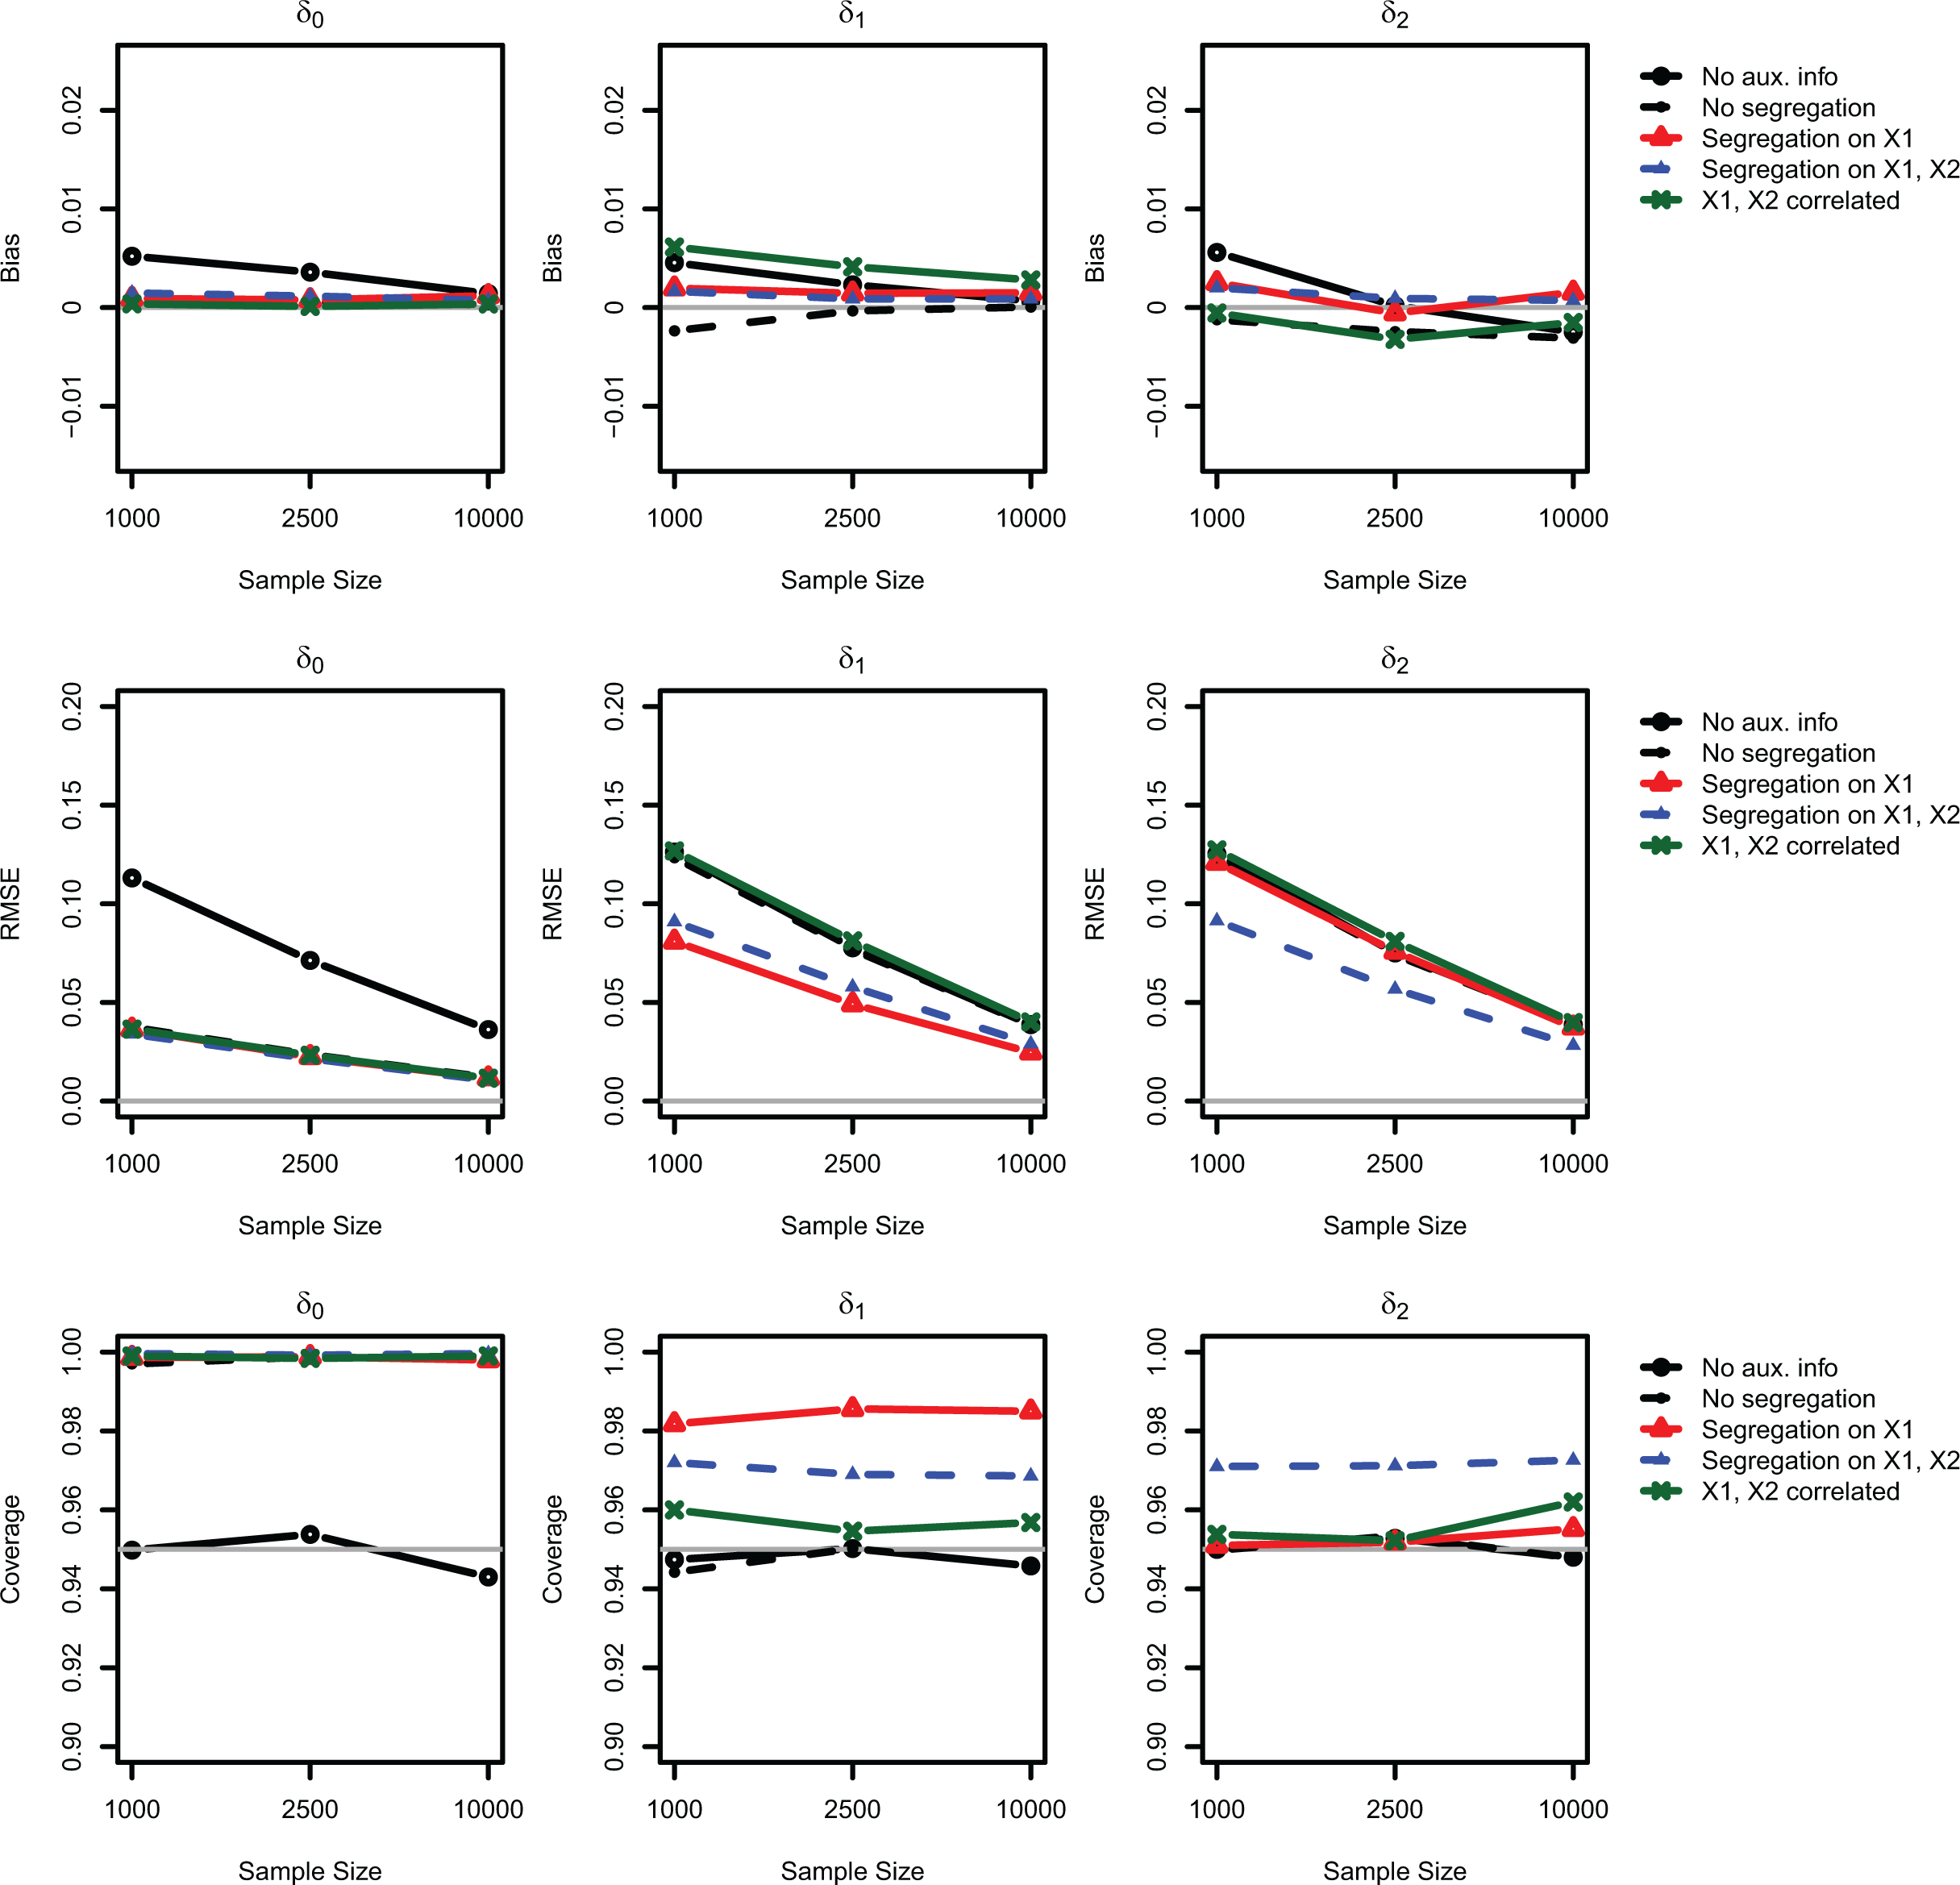
Empirical performance of the proposed estimator for the randomized response technique. This figure illustrates the bias, root mean square error, and coverage of 95 percent confidence intervals for the likelihood estimator of Blair et al. (2015), with and without auxiliary information, over 5,000 Monte Carlo simulations. The continuously updating generalized method of moments estimator is used for all simulations. Each line corresponds to a different scenario: open circles and solid lines correspond to the baseline estimator with no auxiliary information; closed circles and dashed lines correspond to the no segregation scenario; open triangles and solid lines correspond to the segregation on
Taken together, Figures 4 and 5 indicate that the effectiveness of our approach for improving multivariate inference hinges on the extent of segregation. When there is no segregation on the covariates, the auxiliary information only improves inference for the intercept and does not result in more efficient estimates of the other coefficients. Conversely, when covariates are unevenly distributed across groups, auxiliary information can increase efficiency across different sample sizes. Furthermore, these improvements are greater when covariates are less correlated.
Comparison with Direct Questioning
We next examine the efficiency of our proposed estimators relative to direct questioning. To do this, we use the same simulation setting as above and assume that the sensitive trait is truthfully observed for each individual. We estimate the logistic regression model given in equation (21) using the observed sensitive trait and compare the size of the resulting standard errors with those from the conventional estimators for the list experiment and randomized response with and without the auxiliary information. Table 3 reports the findings from 5,000 Monte Carlo simulations for each of our four scenarios described above. The table shows the standard errors along with the ratio of the indirect questioning standard errors to the direct questioning standard errors. Ratios greater (less) than 1 indicate that the estimator is less (more) efficient than direct questioning. We limit the presentation of results to sample sizes of 2,500 for clarity.
Comparing Efficiency of Direct Questioning to Indirect Questioning with and without Auxiliary Information.
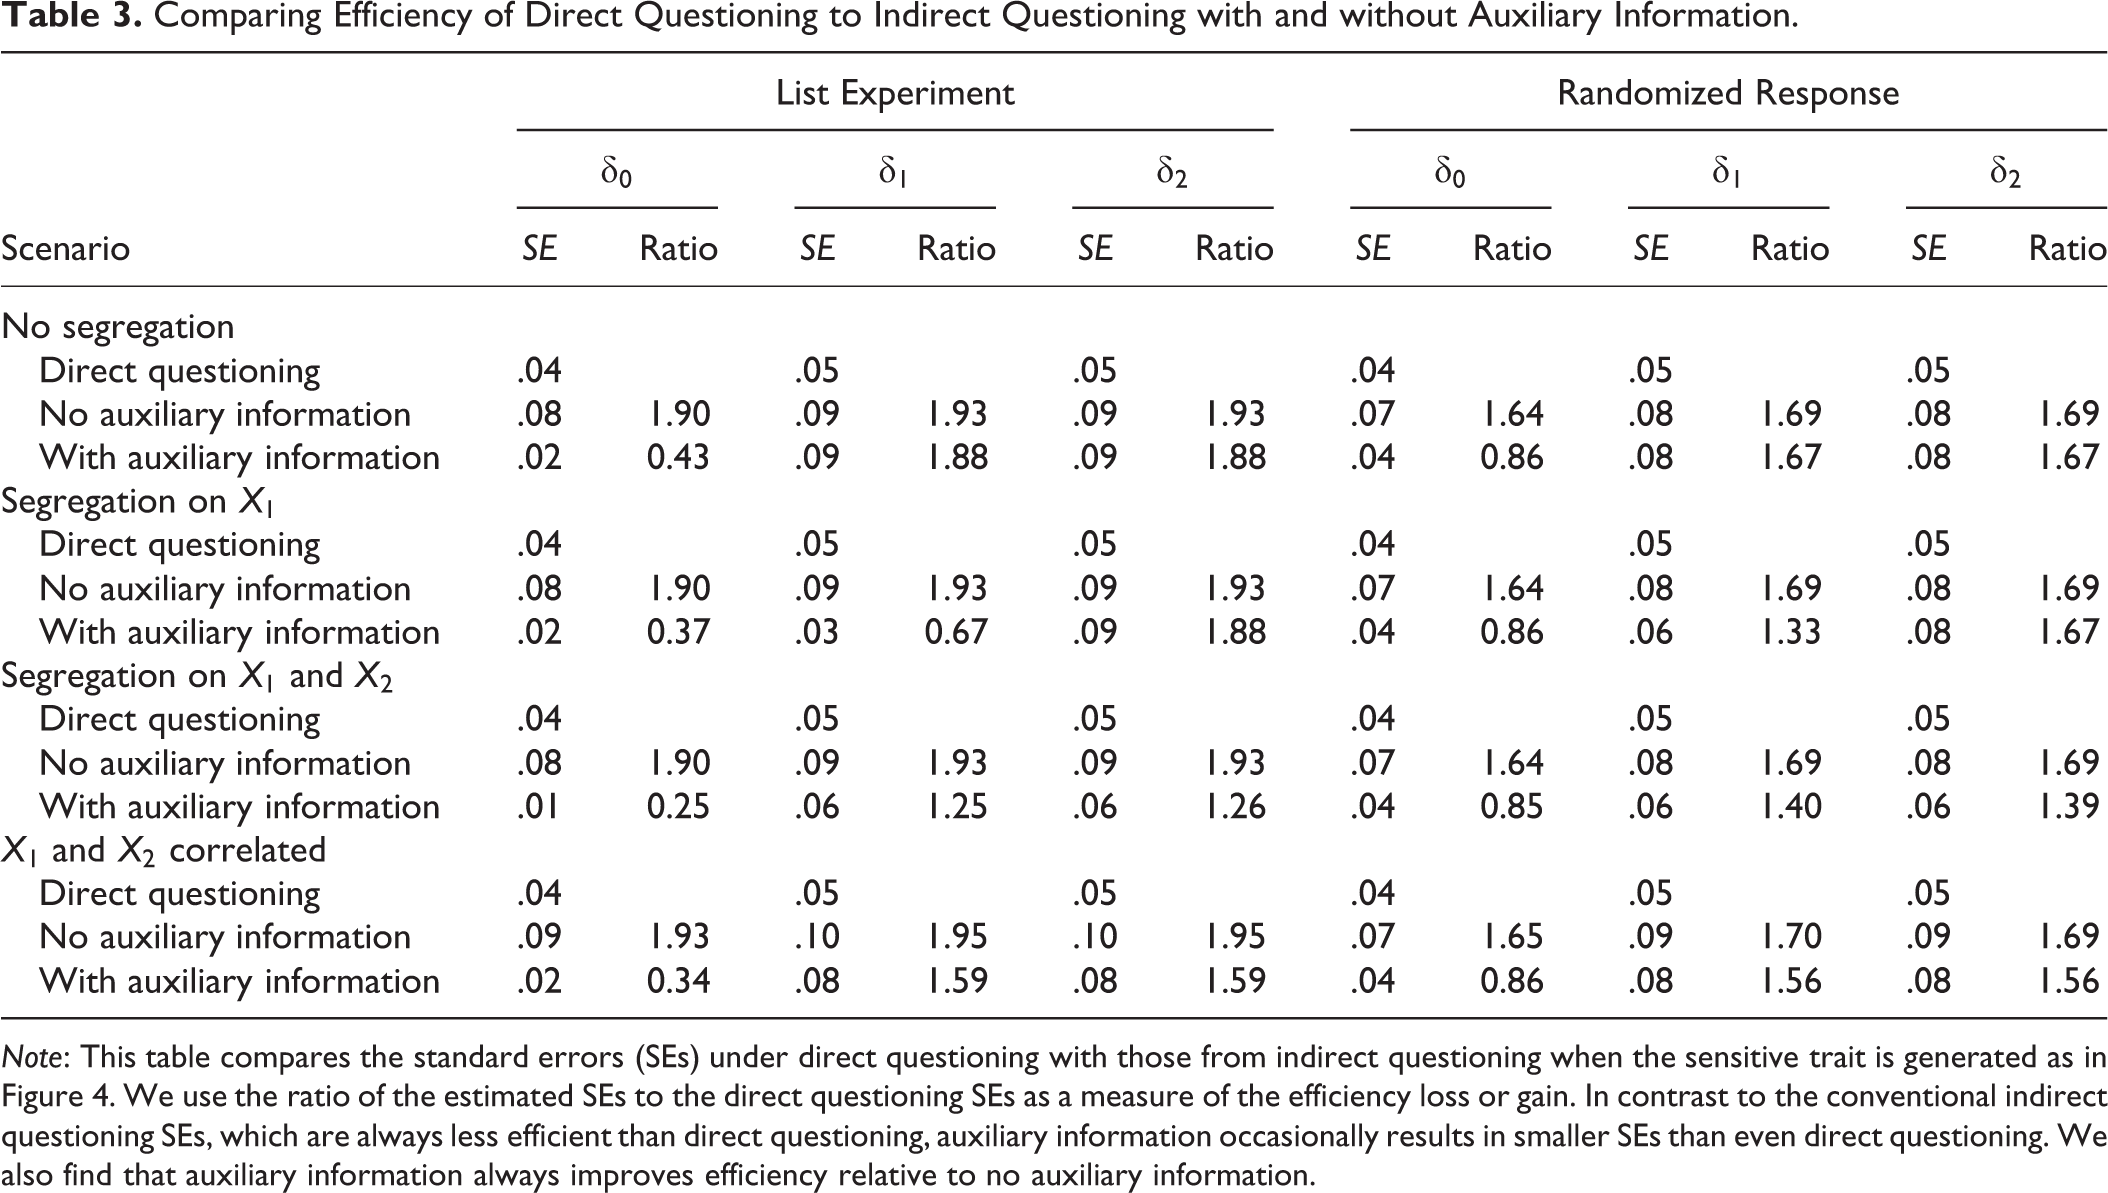
Note: This table compares the standard errors (SEs) under direct questioning with those from indirect questioning when the sensitive trait is generated as in Figure 4. We use the ratio of the estimated SEs to the direct questioning SEs as a measure of the efficiency loss or gain. In contrast to the conventional indirect questioning SEs, which are always less efficient than direct questioning, auxiliary information occasionally results in smaller SEs than even direct questioning. We also find that auxiliary information always improves efficiency relative to no auxiliary information.
We find that indirect questioning typically results in a large efficiency loss when no auxiliary information is available as shown in the previous simulation studies (e.g., Blair et al. 2015; Imai 2011). This can be seen in the ratios of the standard errors without auxiliary information to the standard errors from direct questioning in Table 3, which range from 1.64 to 1.95. In other words, the standard errors from the conventional indirect questioning estimators are nearly twice as large as the standard errors that we would obtain assuming that the sensitive trait were truthfully observed.
However, we also find that incorporating auxiliary information can significantly mitigate and even reverse this efficiency loss. This can be seen especially in the ratios for the intercept
Simulations under Model Misspecification
We also conduct a separate simulation study to explore the benefits of auxiliary information under model misspecification, a routine concern for applied researchers. We begin by generating the sensitive trait according to the following logistic regression model:

where we slightly modify the value of
After simulating our initial population, we generate predictions for the subgroups defined by
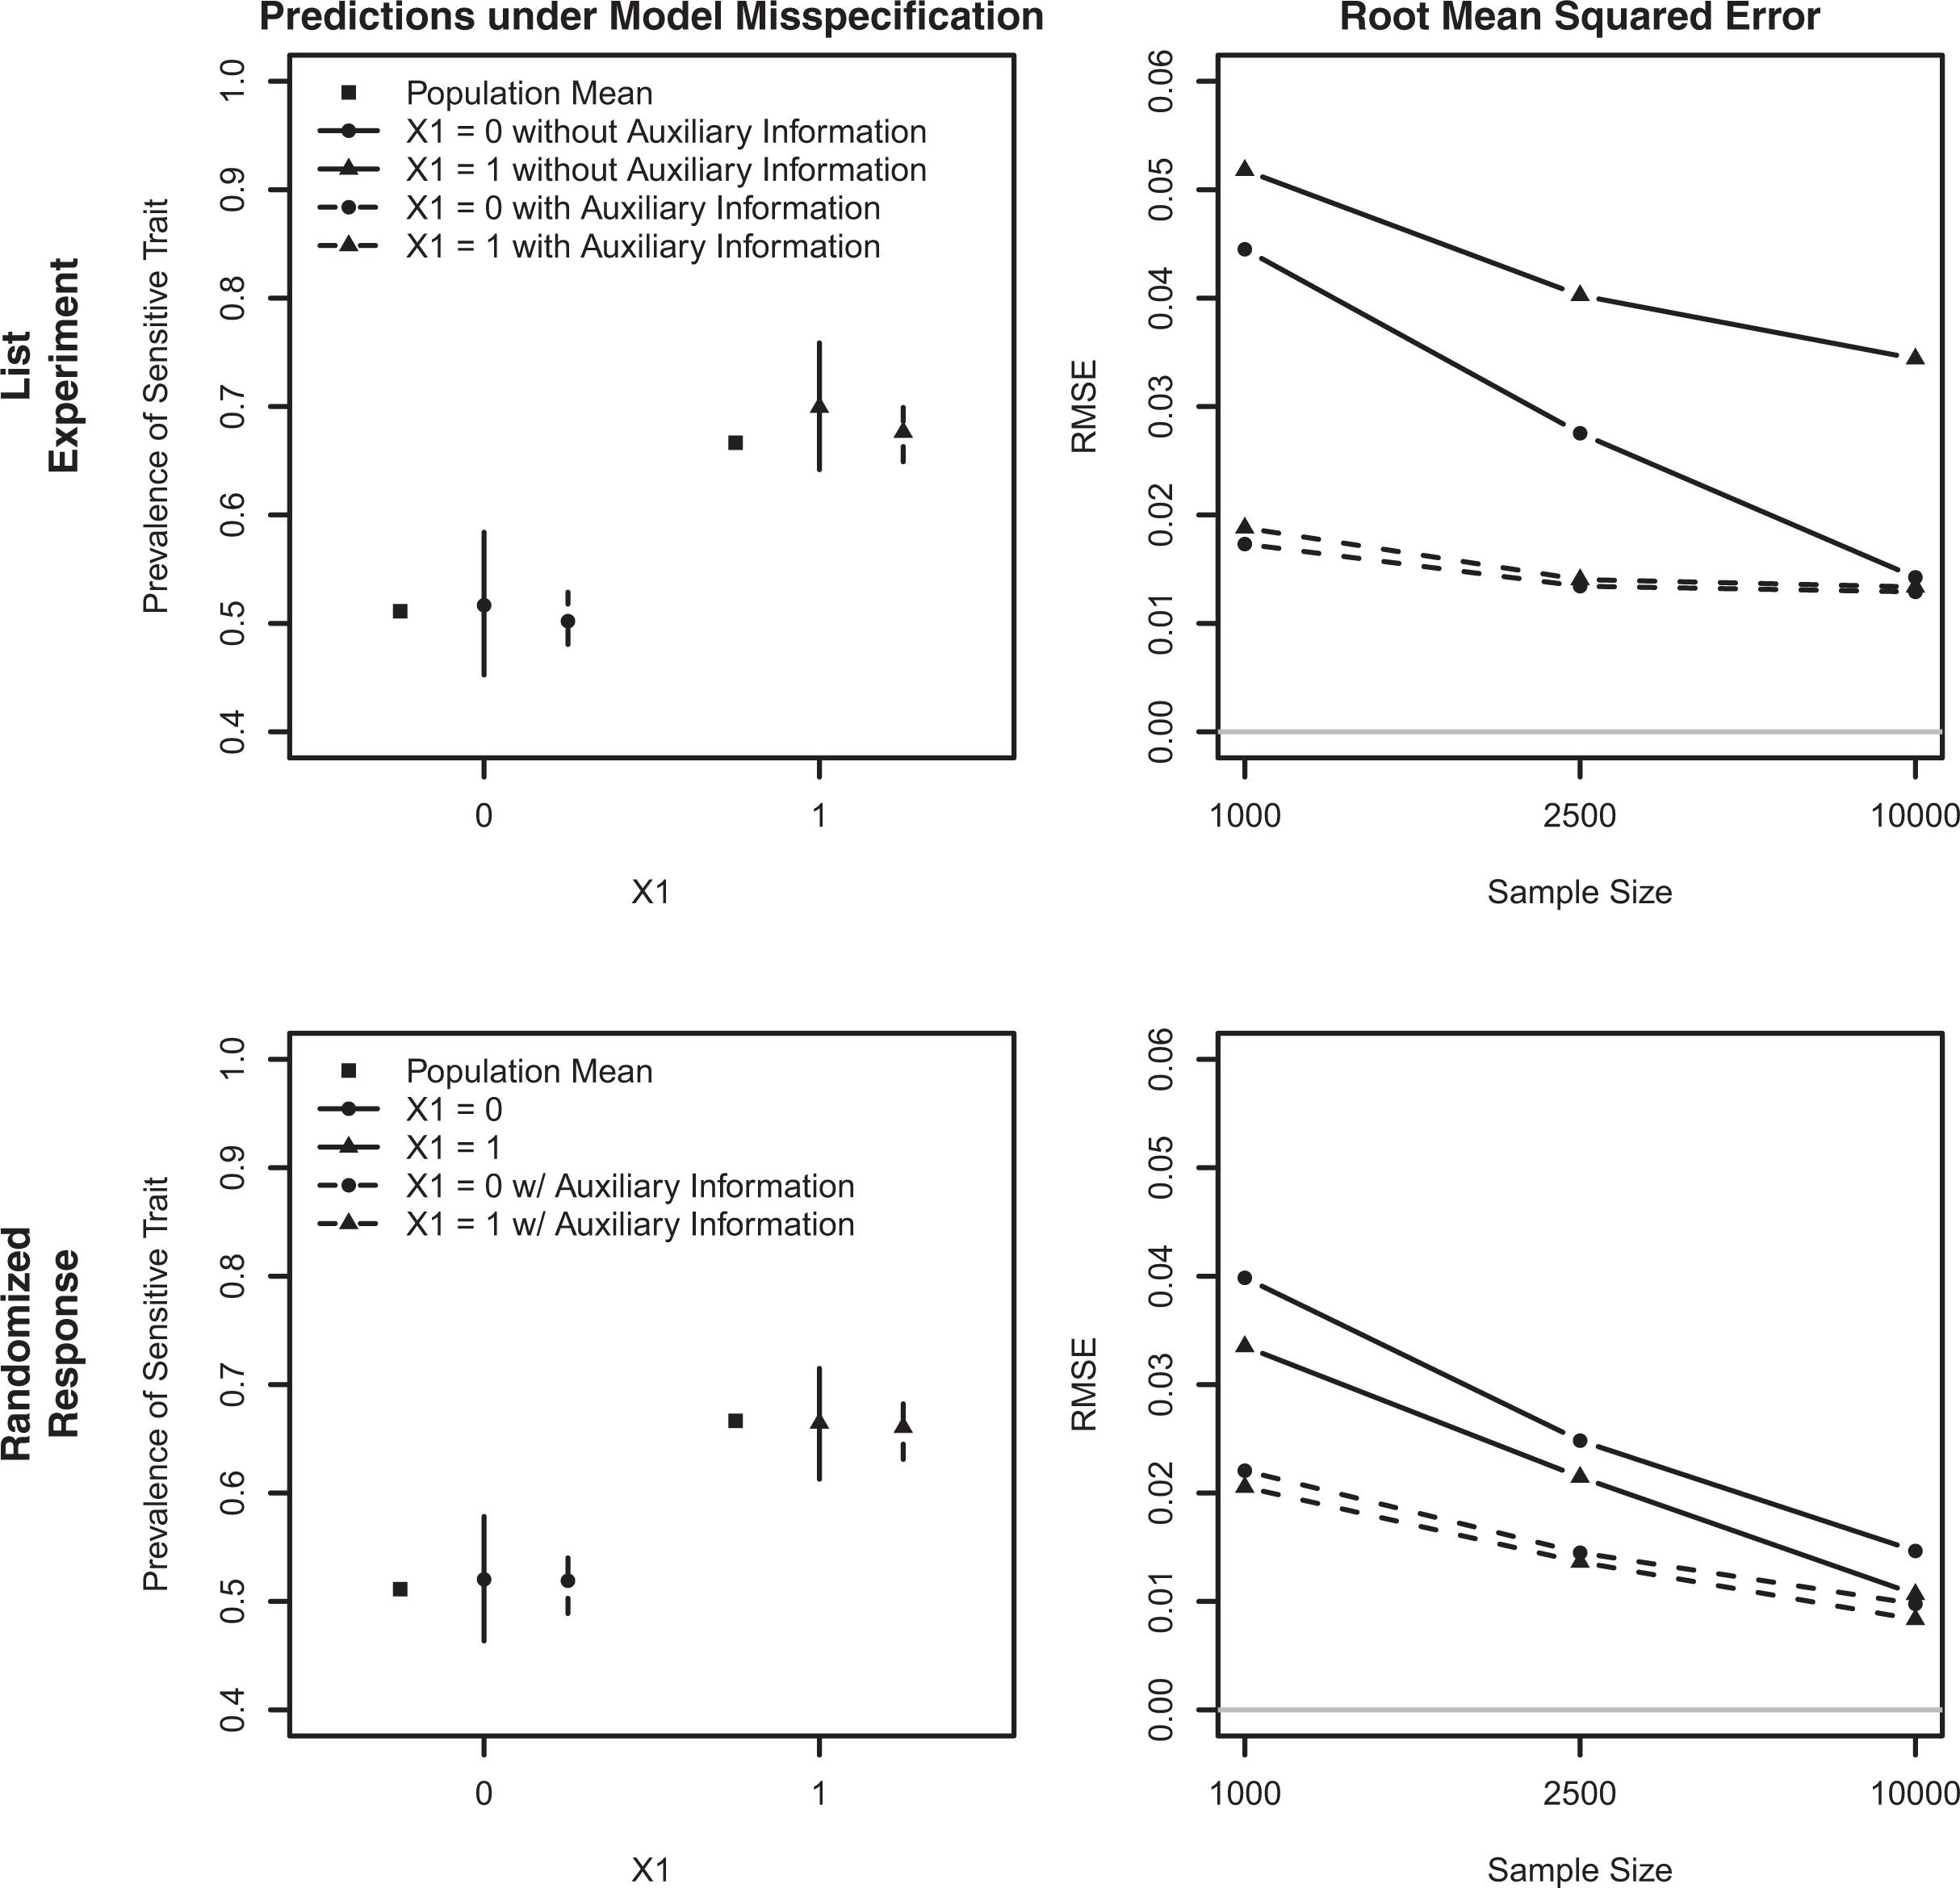
Comparing predictions under model misspecification with and without auxiliary information. This figure summarizes the results of 5,000 Monte Carlo simulations, in which predictions were generated using a misspecified model for two subgroups defined by a binary covariate
The second column of Figure 6 shows the RMSE of the predictions for sample sizes ranging from 1,000 to 10,000. Although the RMSE does not converge to 0 due to the model misspecification, we find that the auxiliary information results in more precise estimates of the sensitive trait. This is true even for large sample sizes, as can be seen by the RMSE for sample sizes of 10,000. The gains from the auxiliary information are especially large for the list experiment and for smaller sample sizes. These results suggest that auxiliary information can be useful for making more robust and precise predictions even when a misspecified model is used, as is often the case in applied research.
Concluding Remarks
Despite their importance in social science research, sensitive topics such as vote choice, health, illicit behavior, and contact with the criminal justice system continue to present serious methodological challenges. Social desirability bias and high rates of item nonresponse make it especially difficult to measure the prevalence of sensitive attitudes and behaviors. Indirect questioning techniques hold considerable promise for alleviating these sources of bias. However, they also entail a major loss of efficiency that can make multivariate inference and prediction for small groups impossible.
In this article, we present a method for improving statistical analysis of indirect questioning techniques by exploiting auxiliary information about the population under study. Such information may be available from official sources, administrative records, or expert evaluations. In this study, we took advantage of official voting data—a source of auxiliary information that may be relevant for a range of research questions on sensitive topics including turnout, nationalist party support, and vote choice on other referendums involving sensitive social issues. We demonstrate that aggregate-level auxiliary information can improve multivariate inference and prediction when analyzing three popular indirect questioning techniques: the list experiment, randomized response technique, and endorsement experiment. Empirical and simulation studies find that such aggregate information can increase the efficiency, reduce the bias due to model misspecification, and improve the predictive accuracy of quantities at a lower level of aggregation. In some cases, the addition of auxiliary information completely recovers the efficiency loss relative to direct questioning. Finally, we enable researchers to implement the proposed methods by making them available through open-source software.
Supplemental Material
Supplemental Material, Online_Appendix_729711 - Sensitive Survey Questions with Auxiliary Information
Supplemental Material, Online_Appendix_729711 for Sensitive Survey Questions with Auxiliary Information by Winston Chou, Kosuke Imai and Bryn Rosenfeld in Sociological Methods & Research
Footnotes
Authors’ Note
The methods described in this article can be implemented via the open-source statistical software, endorse: R Package for Analyzing Endorsement Experiments, list: Statistical Methods for the Item Count Technique and List Experiment, and rr: Statistical Methods for the randomized response technique, all of which are available through the Comprehensive R Archive Network (![]() ). The replication archive for this article is available as Chou, Winston; Imai, Kosuke; and Rosenfeld, Bryn, 2017, “Replication Data for: Sensitive Survey Questions with Auxiliary Information,” doi:10.7910/DVN/4FEJZ3, Harvard Dataverse.
). The replication archive for this article is available as Chou, Winston; Imai, Kosuke; and Rosenfeld, Bryn, 2017, “Replication Data for: Sensitive Survey Questions with Auxiliary Information,” doi:10.7910/DVN/4FEJZ3, Harvard Dataverse.
Acknowledgment
We thank Ryan Bakker for useful comments and Grame Blair and Yuki Shiraito for answering our questions.
Declaration of Conflicting Interests
The author(s) declared no potential conflicts of interest with respect to the research, authorship, and/or publication of this article.
Funding
The author(s) received no financial support for the research, authorship, and/or publication of this article.
Supplemental Material
Supplemental material for this article is available online.
Notes
References
Supplementary Material
Please find the following supplemental material available below.
For Open Access articles published under a Creative Commons License, all supplemental material carries the same license as the article it is associated with.
For non-Open Access articles published, all supplemental material carries a non-exclusive license, and permission requests for re-use of supplemental material or any part of supplemental material shall be sent directly to the copyright owner as specified in the copyright notice associated with the article.