



Abstract
Identifying inattentive respondents in self-administered surveys is a challenging goal for survey researchers. Instructed response items (IRIs) provide a measure for inattentiveness in grid questions that is easy to implement. The present article adds to the sparse research on the use and implementation of attention checks by addressing three research objectives. In a first study, we provide evidence that IRIs identify respondents who show an elevated use of straightlining, speeding, item nonresponse, inconsistent answers, and implausible statements throughout a survey. Excluding inattentive respondents, however, did not alter the results of substantive analyses. Our second study suggests that respondents’ inattentiveness partially changes as the context in which they complete the survey changes. In a third study, we present experimental evidence that a mere exposure to an IRI does not negatively or positively affect response behavior within a survey. A critical discussion on using IRI attention checks concludes this article.
Keywords
Providing high-quality answers requires respondents to devote their attention to completing a questionnaire and, thus, thoroughly assessing every single question. This requirement is particularly challenging to achieve in web surveys, which lack the presence of interviewers who can assess how carefully respondents answer questions and motivate them to be more attentive if necessary.
With regard to web surveys, a variety of attention checks have been proposed to identify inattentive respondents. These proposed attention checks include instructional manipulation checks (IMCs; Oppenheimer, Meyvis, and Davidenko 2009), bogus items, and instructed response items (IRIs; Meade and Craig 2012). With respect to IMCs, respondents receive questions but are asked to ignore the response options and instead provide proof that they have read the question instructions (e.g., by clicking on a specific element on the screen). Thus, IMCs aim to assess whether respondents have read the instructions or not. In contrast, bogus items require respondents to agree or disagree with statements for which there is consent that a correct answer exists (e.g., “water is wet”). Failure to provide this correct answer is considered to indicate inattentiveness.
IRIs are a special form of IMCs. There have been different labels for IRIs, among them trap questions, red herrings, validation questions, and verification ratings (Jones, House, and Gao 2015:692), of which we believe IRIs (Meade and Craig 2012) to be the most specific and distinct term for this type of attention check. An IRI is included as one item in a grid and instructs respondents to mark a specific response category (e.g., “click strongly agree”). The instruction is not incorporated into the question text but is provided as a label of an item. Compared to IMCs, which assess whether respondents have read the instructions in the question text, an IRI measures whether respondents have read the specific item of the grid. Thus, IRIs are by origin local indicators of respondent inattentiveness while answering a grid.
The present study focuses on IRI attention checks, since these (i) are easy to create and implement in a survey, (ii) do not need too much space in a questionnaire (i.e., one item in a grid), (iii) provide a distinct measure of failing or passing the attention check, (iv) require no interpretation by the respondent, (v) are not cognitively demanding, and (vi)—most importantly—provide a measure of how thoroughly respondents read items of a grid. The latter aspect is a prominent characteristic of IRIs because grids are used frequently in web surveys to decrease the length of a survey. Since previous studies have demonstrated potentially adverse effects of using grid questions on data quality (e.g., Couper et al. 2013; Mavletova and Couper 2016; Toepoel, Das, and Van Soest 2009), IRIs are a promising approach to measure inattentiveness for a widely used question format that is prone to suboptimal response.
Despite the increasing popularity of self-administered surveys and the growing research on data quality, a surprising lack of research exists on attention checks and their capability to identify respondents who provide answers of poor quality. This lack of research exists because most of the literature on attention checks has focused on the consistency of some theoretical “key” constructs (e.g., Berinsky, Margolis, and Sances 2014; Oppenheimer et al. 2009). As a result, IRIs typically serve as a local measure of inattentiveness for the grid in which they are incorporated. Yet, when assessing data quality, social scientists mostly refer to an entire survey and therefore are interested predominantly in “global” measures of inattentiveness. Consequently, attention checks are particularly useful if they can be used to assess inattentiveness throughout a complete survey.
We extend previous research by investigating whether IRIs are more than a local measure of inattentiveness by providing information on response quality throughout a survey. Furthermore, we investigate whether inattentiveness is a rather stable characteristic of some respondents, which remains basically unchanged across different surveys, or whether inattentiveness can be attributed to the situational context of a survey. Finally, we complement our analyses of IRIs properties and implementation by reporting the results of an experiment that tested whether a mere exposure to an IRI alters response behavior and data quality.
In the following sections, we provide the theoretical background of our study. Referring to the cognitive model of survey response, we elaborate on the role of (in-)attentiveness in the response process. Then, we provide a systematic review of previous research on attention checks and present our research objectives, which we address in three empirical studies. The following sections present these studies. Each section includes a description of the data, methods, and results. We close with a summary of our findings and a critical discussion of their implications for survey research in general. Finally, we provide suggestions for using attention checks and provide an outlook on future research opportunities.
Theoretical Background
The cognitive model of survey response by Tourangeau, Rips, and Rasinski (2000:7–14) structures the process of answering a question in four steps: (i) comprehending the question, (ii) retrieving relevant information, (iii) integrating this information into a required judgment, and (iv) selecting and reporting the appropriate answer. Skipping or superficially performing the steps in this cognitive process results in nonoptimal response behavior (Krosnick 1991, 1999).
A lack of attentiveness can affect the cognitive response process in at least three ways. First, respondents may fail to correctly comprehend a question because they do not or only superficially read the question or response instructions and, thus, fail to retrieve the relevant information. The consequence can be arbitrary or implausible answers. Second, inattentive respondents may skip or only superficially complete the steps of information retrieval and judgment. Again, this inattentiveness can result in nonoptimal response behavior because respondents may retrieve information that is inadequate to form the required judgment, or they do not properly form a judgment based on the retrieved information. Consequentially, inattentiveness can result in not forming a judgment at all and, thus, in item nonresponse (Beatty and Herrmann 2002). Third, inattentive respondents may also fail to select the appropriate response categories, since they only superficially process the available response options.
In summary, inattentiveness can provoke response behavior that constitutes measurement and nonresponse error. Identifying inattentive respondents is the basis for achieving three objectives: an ad hoc encouragement of respondents to be more attentive, a posterior analysis of survey data quality, and an adjustment of substantial posterior analysis. Objective 1, for instance, could be achieved by prompting inattentive respondents to work the questionnaire more thoroughly, and objectives 2 and 3, for instance, by deleting cases which have been identified as “low data quality” (Berinsky et al. 2014; Oppenheimer et al. 2009). However, these approaches rely on the assumption that attention checks are reliable predictors of answers of low quality and, thus, survey error.
Previous Research on Attention Checks
Previous research has provided preliminary insights into the effects of using attention checks in surveys. Oppenheimer et al. (2009) have proposed IMCs as a way to identify inattentive respondents. In a first study, these authors reported that excluding inattentive respondents from data analysis reduced statistical noise (i.e., theoretical constructs became more consistent). To test whether retraining inattentive respondents may be a way to enhance attentiveness, they conducted a second study in which they exposed inattentive respondents to repeated IMCs until they passed the test. Their results showed that repeated IMCs increased the attentiveness of respondents for this specific question and, again, reduced statistical noise in the data analysis.
Unlike Oppenheimer et al. (2009), Berinsky et al. (2014) reported contradictory findings on the overall quality of survey data when investigating the effects of training inattentive respondents to be more attentive. Moreover, these authors reported that “it appears that training comes with additional costs,” since they found lower completion and higher attrition rates for respondents who received this kind of training (Berinsky et al. 2014:750). Similar spillover effects of attention checks have been discussed by Oppenheimer et al. (2009:871) as backlashes: “Diligent participants who come across an IMC may feel insulted to find that they are not trusted by the researchers.” Consequently, the authors cautioned that “there is the possibility that including an IMC will hurt the quality of the data” (p. 871). However, a spillover effect can also have a positive effect on respondents who realize that they are being controlled. Specifically, respondents might attend to the subsequent questions more thoroughly (Miller and Baker-Prewitt 2009). This reasoning is supported by Hauser and Schwarz (2015) who found that exposure to an IMC increased their respondents’ performance in a complex reasoning test.
Hauser et al. (2016) have provided further ambivalent findings to the discussion on the spillover effects of attention checks. Based on two short surveys, in which IMCs were presented to MTurk respondents, the authors concluded that IMCs can influence respondents who are completing complex reasoning tasks, but “they seem unlikely to affect how they approach standard survey questions” (p. 214).
In a recent study, Jones et al. (2015) compared different placements of IRIs to other data quality metrics (e.g., straightlining, speeding) with respect to their ability to predict irrational responses to one choice experiment. These authors showed that exclusion strategies based on IRIs outperform the use of more traditional metrics with respect to being able to filter the large majority of respondents who gave an “irrational” answer in the choice experiment. However, focusing on IMCs, Anduiza and Galais (2016) demonstrated that “for descriptive analyses there is a significant risk of increasing biases if we remove those respondents who fail IMCs,” while “(f)or explanatory analysis […] the results do not seem to change much […]” (p. 19). This conclusion is based on the authors’ finding that a special subset of respondents fails attention checks.
Research Objectives
With respect to the budding research on attention checks and the yet unclear spillover effects, the present article explores three research objectives related to the properties and implementation of IRI attention checks. Each research objective is addressed in a separate study.
First, in Study 1, we investigated how well IRI attention checks can identify the response behavior associated with measurement and nonresponse error. Thereby, we aimed at evaluating the applicability of IRI attention checks as global measures of inattentiveness throughout a survey. The previous literature has established global data quality indicators based on identifying straightlining or nondifferentiation (Couper et al. 2013; Krosnick 1991, 1999; Krosnick and Alwin 1988), speeding (Greszki, Meyer, and Schoen 2015; Roßmann 2010; Zhang and Conrad 2014), and nonsubstantive responses (Krosnick et al. 2002; Krosnick, Narayan, and Smith 1996) that result from the superficial processing of survey questions. Therefore, we compared respondents who failed an IRI to those who passed with respect to a set of corresponding data quality indicators. Since the implementation of IRIs is not an end in itself but serves the purpose of enhancing data quality, we further tested whether excluding inattentive respondents altered results in substantive analyses. This rather invasive approach of dealing with inattentive cases has been proposed frequently in prior studies (e.g., Berinsky et al. 2014; Oppenheimer et al. 2009). Yet again, from a more global perspective on data quality that does not focus on one key construct, we are interested in determining whether the results of substantive multivariate models may be affected by inattentiveness and, thus, how results may change when using the common strategy of omitting respondents who failed the IRI.
Second, in Study 2, we examined whether (in-)attentiveness is a rather stable personal characteristic of respondents and, thus, remains basically unchanged across different surveys, or whether it is dependent on the situational context of a survey. The answer to this question is crucial for managing and designing longitudinal surveys. On the one hand, if attentiveness is subject to a survey’s context and this context changes, implementing multiple attention checks is required. On the other hand, if attentiveness is rather stable, IRIs may provide valuable insights into the future response behavior of these respondents. Hence, these measures could enable practitioners to implement tailored methods to enhance data quality, for instance, in subsequent waves of panel surveys.
Third, due to the mixed findings of previous research, it has not been established, yet, whether attention checks have positive or negative spillover effects on response behavior. Therefore, in Study 3, we experimentally investigated whether the mere exposure to a single IRI attention check affects response behavior and, thus, answer quality. This study shifts the perspective to respondents who have presumably read and processed the IRI. It aims at testing the competing assumptions that the awareness of being controlled makes respondents increase their effort or their reluctance. In other words, the third study addresses the question of whether the implementation of attention checks is a means to measure and/or influence data quality.
Study 1
Study 1 investigates how well IRI attention checks perform with respect to indicating low and high data quality in a survey as measured by commonly used indicators of questionable response behavior. After assessing the properties of IRIs and whether they provide a global measure of response quality (i.e., for the entire survey), we tested whether IRIs can be used as a corrective. Therefore, additional analyses addressed the question of whether deleting respondents who failed the IRI altered the results of substantive analyses.
Data and Method
Study 1 relied on data from a web-based survey that was fielded in December 2012 in Germany. The respondents were quota sampled from a large opt-in online panel with more than 100,000 respondents. Of the 3,478 panelists who followed the invitation, 535 were screened out and 440 broke off. This left a total of 2,503 respondents completing the survey at a break-off rate of 15 percent (Callegaro and DiSogra 2008). The questionnaire covered a multitude of items on political attitudes and behaviors.
The last third of the questionnaire featured a six-item grid question with an IRI. Figure 1 shows a screenshot of the grid as the respondents saw it (see Table A1 in the Online Appendix for question wording). The fourth item instructed respondents to select “rather disagree.” We created a dummy variable that indicated whether respondents passed or failed the attention check (0 = attentive, 1 = inattentive). About 24 percent of the respondents failed the test (descriptive statistics on respondents who failed and passed are provided in Table B1 in the Online Appendix). 1
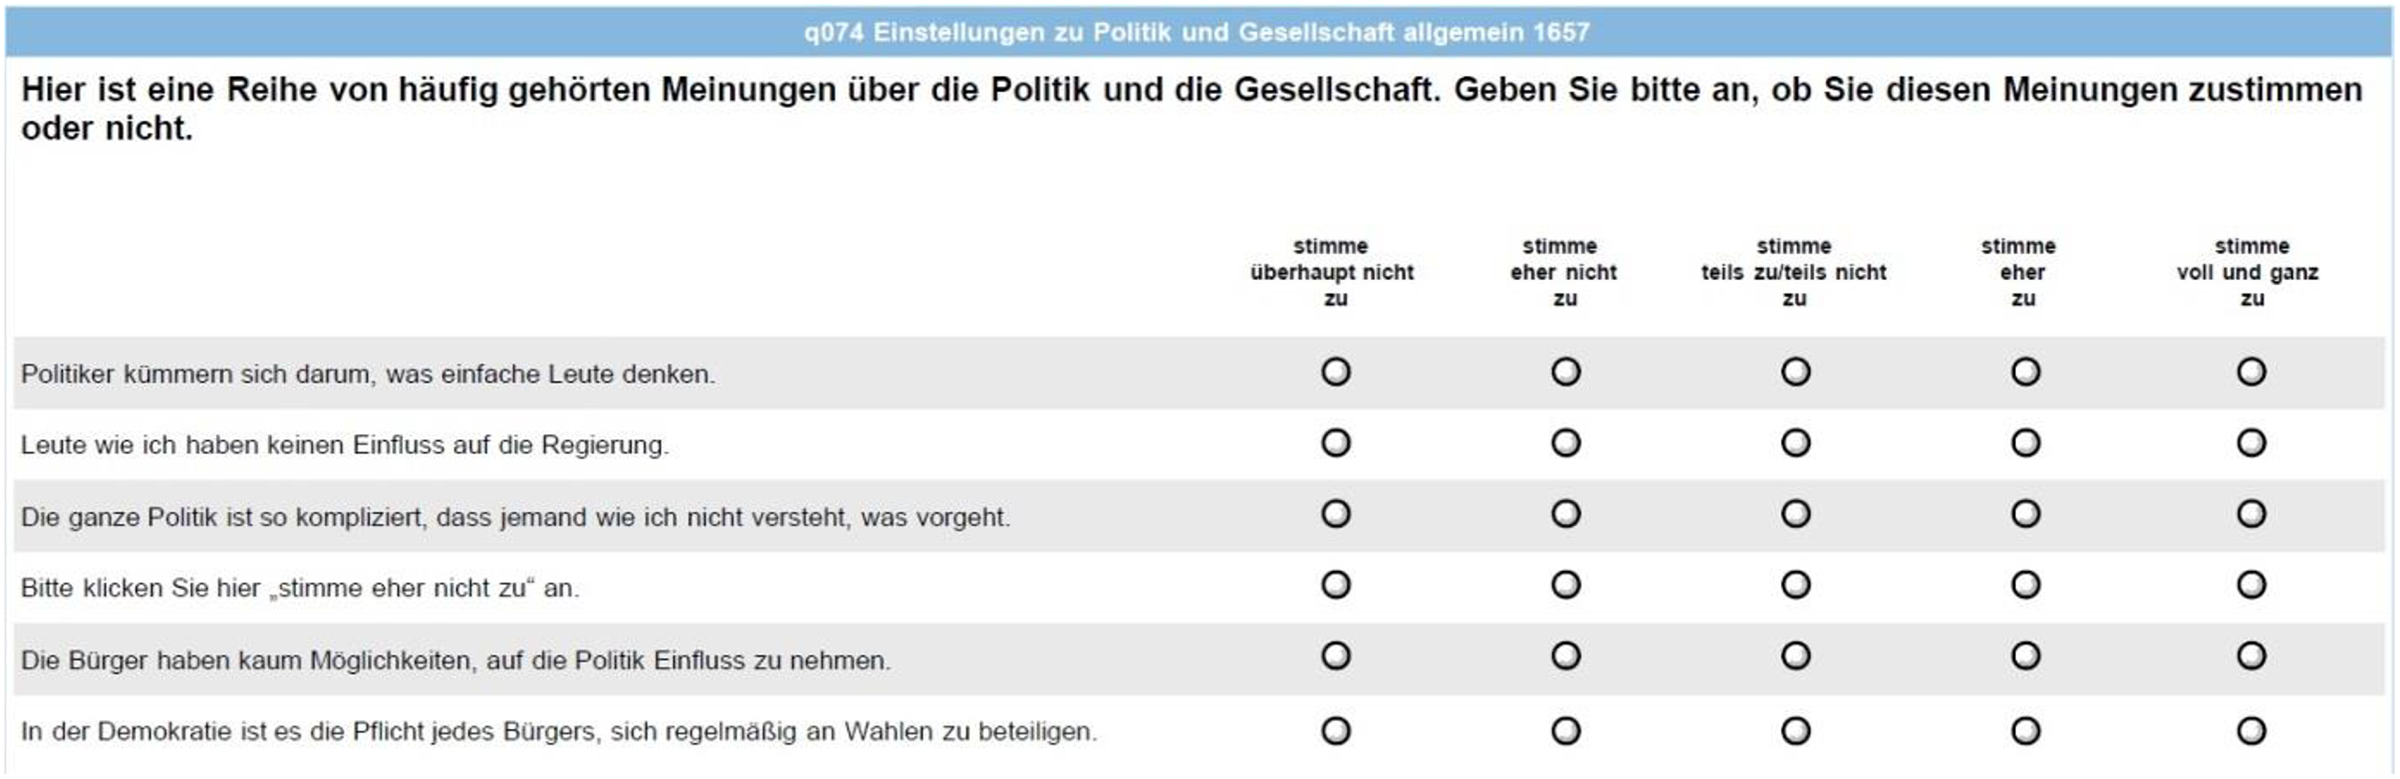
Grid questions with instructed response item in Study 1.
We created six indicators for response behaviors that constitute measurement or nonresponse error. First, previous research has suggested that respondents who superficially perform the cognitive task of answering questions can be expected to complete a survey extremely fast (e.g., Greszki et al. 2015). To identify these “speeders,” we calculated a speeder index as proposed by Roßmann (2010). 2 The index provides a standardized measure for a respondent’s average response times. Values below 1 indicate faster respondents, and values above 1 indicate respondents with slower response times.
Second, straightlining (nondifferentiation) is a response pattern frequently associated with satisficing (Krosnick 1991, 1999). Consequently, we created a variable that indicates each respondent’s relative frequency of straightlining across 24 grid questions in the survey. This index takes values between 0 and 1, which can be interpreted as relative frequencies. For instance, a value of 0.75 would indicate that a respondent straightlined in 75 percent of the grids.
Third, frequently providing “don’t know” answers can be considered an easy way to reduce the response burden and, hence, may be a hint that a respondent is only superficially working the questionnaire. Thus, we calculated the proportion to which respondents answered with don’t know to 113 items. This don’t know index takes values in the range from 0 to 1. Again, the values can be interpreted as relative frequencies.
Fourth, we calculated the proportion of item nonresponses (i.e., refused to answer) per respondent. This measure was based on 322 items. Again, the item nonresponse indicator takes values between 0 and 1 and can be interpreted similar to the straightlining and the don’t know indices.
Fifth to extend our perspective on data quality to a more substantive level, we included an indicator for the frequency of inconsistent answers. We define inconsistent answers as a set of statements that are mutually exclusive and, thus, logically impossible. For example, respondents were asked which parties they would consider voting for and which parties they would never vote for. If a respondent named the same party for both questions, we considered this an inconsistent response pattern. Based on four questions, we computed, for each respondent, the frequency of answers that were inconsistent with their previous responses. The indicator for the frequency of inconsistent answers takes values in the range from 0 to 4.
Sixth, we also included a second substantive data quality measure: a variable that indicates implausible answers. We define implausible answers as a set of statements that do not complement each other, yet, are (strictly speaking) not logically impossible but highly unlikely. For example, respondents were asked which newspapers and magazines they had read during the last week. Reading every newspaper and every magazine, the questions asked about every single day of the week was considered an implausible statement. For this measure, we relied on four questions to compute the frequency of implausible answers. This indicator takes values between 0 and 4 as well. The indicators for implausible and inconsistent answers are interrelated, since both measure low intrarespondent response validity. However, they provide distinct measures of different dimensions of this issue. In other words, inconsistent answers constitute logically impossible combinations of answers, whereas implausible answers do not complement each other and are highly unlikely but not impossible.
In addition, we used respondents’ self-reported attention and effort devoted to completing the survey. Both questions were asked close to the end of the survey, since they relate to a respondent’s experience of answering the entire survey. Both attention and effort were measured on five-point scales. We used both variables in our analyses in order to compare self-reported measures of data quality to the IRIs.
Furthermore, we investigated the effects of excluding respondents who failed the IRI based on four explanatory models that resemble the frequently used models in political sociology. Thus, we compared the coefficients between models for the entire sample and models without the respondents who failed the attention checks. To ensure comparability, in each case, we employed an ordinary least squares (OLS) regression. The four dependent variables were as follows: (i) intended turnout at the next federal election, (ii) satisfaction with the government, (iii) interest in politics, and (iv) engagement in political discussions. Turnout intention was measured on a fully labeled five-point scale that ranged from 0 (certainly not) to 4 (certainly). Satisfaction with the government was also measured using a fully labeled five-point scale (0 = very dissatisfied, 4 = very satisfied). A further fully labeled five-point scale was used to capture the respondents’ interest in politics (0 = not interested, 4 = very interested). Finally, the respondents’ political engagement was measured as participation in political discussions in days per week (0 = zero days, 7 = seven days). The independent variables in our analyses were (depending on the model, see Tables C1–C4 in the Online Appendix) age (metric), education (three categories: low, intermediate, and high), satisfaction with democracy (five-point scale), strength of party identification (three categories: none, weak, and strong), and identification with the party in government (0 = no, 1 = yes). To further investigate how the IRI measure relates to variables of interest in substantive multivariate models, we reran the four models as interaction models. In these models, we included a dummy variable for failing or passing the IRI (0 = no, 1 = yes) as an independent variable, and added interactions with all other substantive variables. Significant interaction effects can be interpreted as an indication that effects in the substantive models differ between the respondents who failed the IRI and those who passed.
Results
In the first step of our analysis, we investigated how well an IRI attention check performed in differentiating between respondents who provided low- or high-quality data across six indicators (using Mann–Whitney U tests or χ2 tests). First, the results suggest that respondents who failed the IRI were more likely to speed through the survey (
Table 1 presents the distributions of the respondents’ self-reported attentiveness and effort conditional for (in-)attentiveness as indicated by passing or failing the IRI attention check. We found that respondents who failed an IRI reported that they were less attentive,
Self-reported Attentiveness and Effort When Completing a Survey for Respondents That Passed or Failed the IRI Attention Check in Study 1.

Note: All figures except N in percentages. IRI = instructed response item.
To investigate the substantive implications of deleting respondents who failed an IRI, we conducted additional analyses. In these analyses, we fitted four explanation models on (i) intended turnout at the next federal election, (ii) satisfaction with the government, (iii) interest in politics, and (iv) engagement in political discussions. First, we ran each model twice for the entire sample and a subsample without inattentive respondents (see Tables C1–C4 in the Online Appendix for the full OLS models). Table 2 provides an overview of each model’s number of regressors and indicates whether the respective coefficients changed significantly when inattentive cases were omitted. Surprisingly, excluding the respondents who failed the IRI did not yield significantly different results (i.e., the coefficients did not change significantly). In addition, adjusted R 2s were reduced slightly in three of the four models by excluding inattentive respondents. However, in these cases, the root mean squared error (RMSE) also decreased. While the reduction in the RMSE may advocate for excluding cases (i.e., noise is reduced), we caution that these changes were comparatively small and came at the price of decreasing the model fit. Moreover, as Table 2 shows, we would have drawn the same substantive conclusions from each of the four models with and without inattentive respondents. Second, we reran each model as an interaction model with “failing the IRI” as an independent variable and additional interactions with all other independent variables. These supplemental analyses hint that the effects in the multivariate substantive models slightly differ between the respondents who passed and those who failed the IRI. As Table 2 illustrates, only a few interaction effects showed significant effects. Considering the few significant interactions and our prior findings on excluding respondents from an analysis, we interpret these findings as further support for our prior interpretation that specifically treating respondents who failed a single IRI has minor implications for substantive conclusions.
Changes in Substantive Models When Excluding Respondents Who Failed the Instructed Response Item in Study 1.
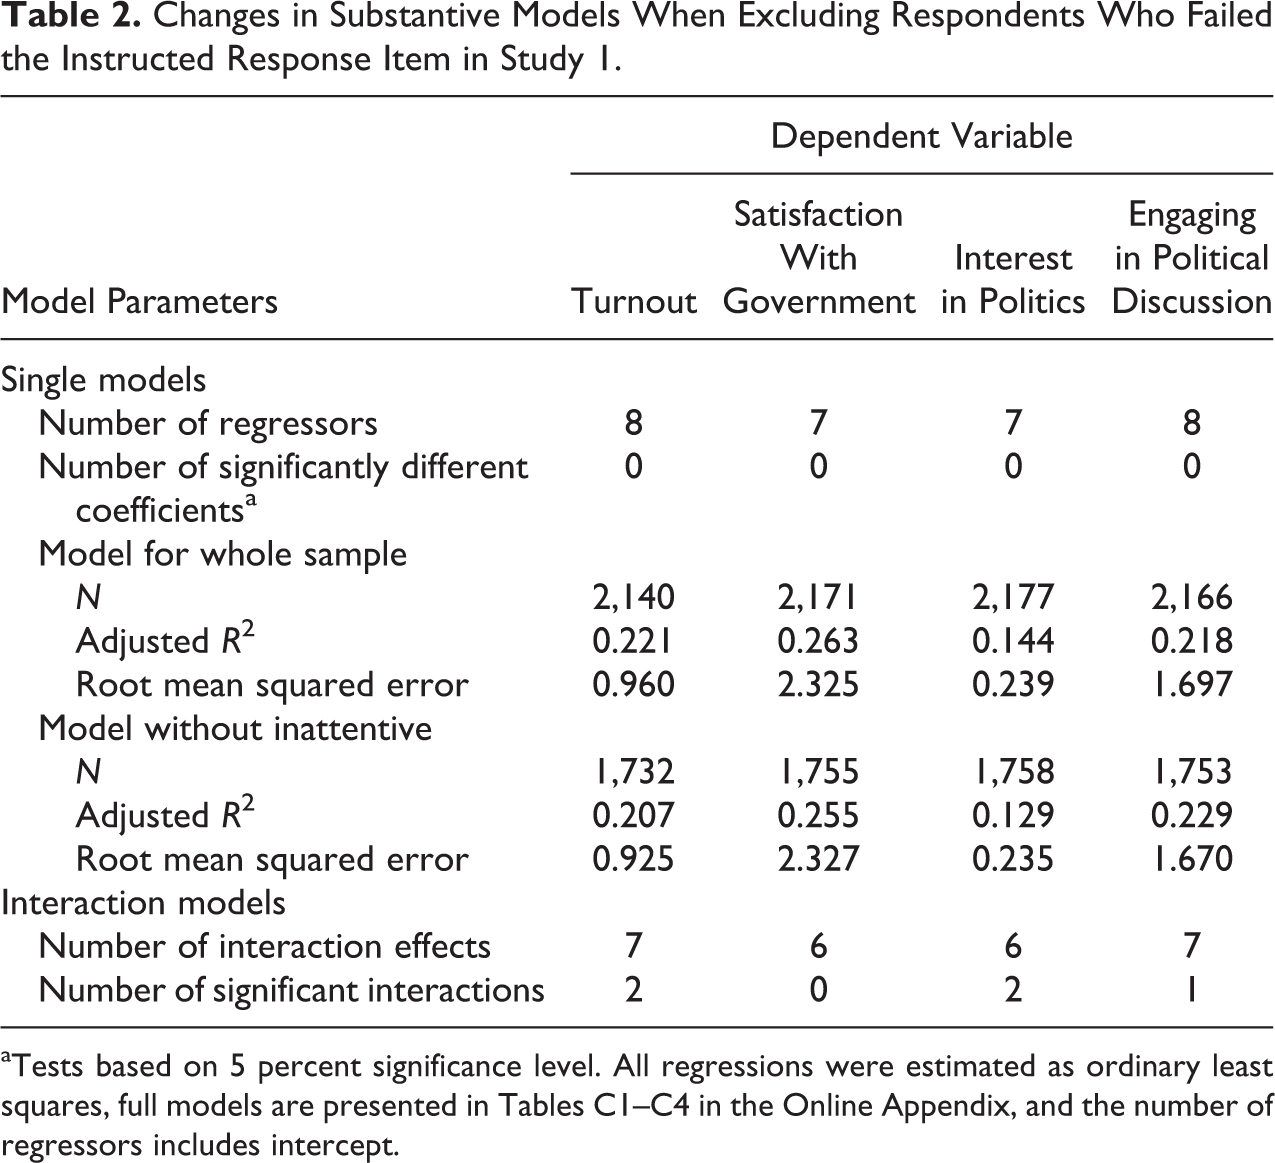
aTests based on 5 percent significance level. All regressions were estimated as ordinary least squares, full models are presented in Tables C1–C4 in the Online Appendix, and the number of regressors includes intercept.
To sum up, Study 1 demonstrated that inattentive respondents showed questionable response behavior to a significantly higher degree than attentive respondents across all six data quality indicators. Therefore, IRIs do not only provide a local measure of inattentiveness in the grid in which they are incorporated, but also indicate questionable response behavior throughout a survey. This finding lends support to the general expectation that IRIs can be used to identify respondents who provide answers of low quality because respondents who fail IRIs tend to use shortcuts in their survey response process. Excluding respondents whose IRIs indicated inattentiveness would have improved all six data quality indicators and also the self-reported measures of attentiveness and effort. However, in line with the findings of Anduiza and Galais (2016), changes in substantive explanatory models remained negligible. Similarly, Greszki et al. (2015) reported that the exclusion of too fast respondents did not alter significantly the results of their substantive models.
Study 2
Following the findings of Study 1, we extended our analytical perspective from respondents completing one single survey to respondents repeatedly participating in surveys. The use of panel data enabled us to address the open question whether (in-)attentiveness is a personal characteristic of respondents that is rather stable across different surveys, or whether it is subject to the specific situational context in which respondents complete each survey. This question has major implications for the design of a survey. Surveys that incorporate follow-up interviews or that are conducted in potentially changing environments (e.g., mobile web surveys) would require several attention checks if attentiveness and inattentiveness are not stable characteristics. However, space is severely limited in most questionnaires, which makes the implementation of the optimal amount of attention checks a formidable challenge. In contrast, a relative stability in (in-)attentiveness would enable practitioners not only to accurately predict response behavior and build the questionnaire more efficiently, but also administer tailored methods that specifically target endangered respondents.
Data and Method
In Study 2, we drew on a web-based panel survey with seven waves (Rattinger et al. 2013a). The survey was conducted during the campaign for the German federal election 2013 between June and October. With a break-off rate (Callegaro and DiSogra 2008) of 5 percent in the first wave of the panel, a total of 5,256 respondents completed the interview. Of these, 4,245 participants were quota sampled from a large online access panel. In addition, 1,011 respondents of the antecessor panel survey in 2009 responded to the survey invitation. Of the 5,256 respondents who completed the first wave, 66.4 percent participated in all seven waves, while 7.9 percent participated only in wave 1. Overall, between 77.3 percent and 85.9 percent of the first wave respondents completed waves 2–7.
In each wave of the panel, an IRI attention check was implemented in a grid question with a five-point scale (see Table A2 in the Online Appendix for the question wording of the seven IRIs). Similar to the IRI in Study 1, respondents were instructed to select a specific response category in each IRI. For our analyses, we created a dummy variable indicating whether a respondent passed or failed the attention check (0 = attentive, 1 = inattentive). Across the waves, the proportion of incorrect answers (i.e., inattentiveness) varied between 6.1 percent and 15.7 percent (see Table B2 in the Online Appendix for descriptive statistics on the respondents who failed and passed the IRIs).
The advantage of using a panel survey to investigate whether (in-)attentiveness is rather stable across survey waves or subject to context-dependent change is that each reinterview (i.e., each wave) constitutes a new situational context (i.e., different day, environment, and new personal experiences) or presents a respondent with new questionnaire contents and designs. Therefore, every time the respondents completed a questionnaire of the panel (i.e., every wave), they faced a new survey context. Our methodological approach to investigate the stability of attentiveness across panel waves was two-fold. First, we focused on individual patterns of failing attention checks across different waves and estimated transition probabilities between the states of passing and failing IRIs. Second, we fitted a hybrid logistic panel regression model (Allison 2009) with “failing an IRI” as the dependent variable. This additional analysis complemented the insights gained from looking at transition patterns by highlighting characteristics that affected the likelihood of changing a respondent’s outcome to an IRI (i.e., changes in [in-]attentiveness). The hybrid logistic panel regression as proposed by Allison (2009:39) enables a modeling of within-respondent (fixed) effects for time-variant covariates and also includes time-invariant covariates as random effects in the panel regression. We drew on satisficing theory (Krosnick 1991, 1999) to identify relevant independent variables (cf. Theoretical Background section). Accordingly, we included indicators for a respondent’s ability (education [three categories], prior experience with surveys in the last 30 days [four categories], membership in other online access panels [dichotomous]), motivation (interest in survey topic [three categories], index of self-reported motivation [metric]), complexity of the task (device used to complete survey [three categories]), sociodemographics (age and age 2 [metric], gender [dichotomous], and region of residence in Germany [dichotomous]), and dummy variables for the survey context and the survey situation (i.e., wave dummies).
Results
In a first step, we explored the patterns of respondents who failed attention checks across different waves of the seven-wave panel. The most common pattern was that respondents never failed an attention check. Overall, 3,696 (70.3 percent) of the respondents never failed, 10.5 percent failed 50.0 percent or more of the time, and only a small proportion of 4.1 percent failed every time they participated. These initial findings showed that respondents' attentiveness varied within respondents across the different waves of the panel. However, these results also suggest that in 74.4 percent of the cases, the level of attentiveness or inattentiveness remained stable.
To further examine the within-respondent changes between states of attentiveness and inattentiveness, we used the patterns we found in failing attention checks to predict a transition probability matrix. The prediction was based on the probabilities of changing between attentiveness and inattentiveness in each wave of the panel, which constitutes a Markov process. As shown by our analysis, the probability of remaining in the same state was 94.2 percent for attentiveness and 50.8 percent for inattentiveness. With respect to instability, our data suggested transition probabilities of 49.2 percent for inattentive respondents to become attentive, and 5.8 percent for attentive respondents to become inattentive. This transition probability matrix did not take the form of an identity matrix, which would suggest perfect stability, and it did not suggest a perfect mobility between attentiveness and inattentiveness. Our analyses of these transition probabilities showed that respondents’ inattentiveness is subject to both processes. Basically, it was a coin flip for inattentive respondents to become attentive or not, which suggests that context matters when completing a survey. In other words, while some respondents seem to be—in general—more prone to inattentiveness when answering a survey, this can change depending on the conditions under which these respondents complete a survey.
Table 3 shows the correlation matrix for inattentiveness in subsequent panel waves. As our preliminary analysis on failure patterns had suggested, we found inattentiveness in a previous wave of a panel to be predictive for inattentiveness later in the panel. While the prediction was not perfect, the correlations coefficients range from 0.35 to 0.54 (all
Correlations between Inattentiveness in Subsequent Waves of a Panel Survey in Study 2.
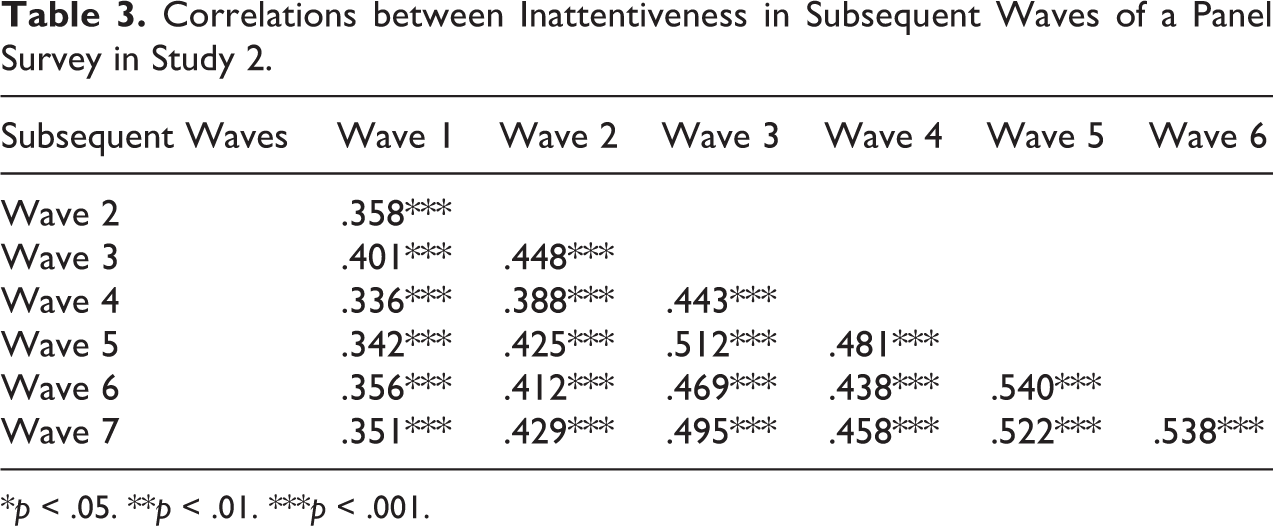
*p < .05. **p < .01. ***p < .001.
Table 4 provides the results of our hybrid logistic panel regression model. In line with what satisficing theory would suggest, we found a respondent’s ability (education, prior experience with surveys) to have a significant impact on the likelihood to change the outcome to an IRI. We documented similar findings for the indicators of a respondent’s motivation. Interest in the survey topic as well as the index for motivation and effort had significant effects on the likelihood of changing a respondent’s performance with respect to an IRI. In other words, the more motivated and able a respondent became, the less likely failure in the next IRI became. To measure the complexity of answering an IRI, we included a variable for the device used (assuming that answering the questions on a mobile device was more cumbersome than on a desktop computer; see Couper and Peterson 2017) but did not find a significant effect.
Hybrid Logistic Panel Regression Model on Failing IRIs in Study 2.

Note: Between effects of time-invariant covariates and intercept are omitted from the table. AME = average marginal effect; SE = standard error; IRI = instructed response item; OAP = online access panel.
*p < .05. **p < .01. ***p < .001.
With respect to the characteristics of the survey and questionnaire, which we modeled as wave dummies, we found significant effects for four of the six covariates. We can assume these dummy variables to capture a mixture of effects that stem from changes in the overall survey situation, the questionnaire design (e.g., questions placed next to the IRI that might spillover), and the grid question that incorporated the IRI. However, in this analysis, it was not possible to further disentangle the effects, and so we have to leave this task to future studies. Overall, what we can infer from our model is that change in (in-)attentiveness is driven partly by within-respondent changes (e.g., respondents losing or gaining motivation over the course of a panel survey) and partly by changes between the waves (e.g., changes in the questionnaire or the survey situation).
In summary, Study 2 provides initial evidence that factors on both the respondent and the survey level affect the attentiveness of a respondent when completing a survey. Thus, it can be reasoned that inattentiveness depends—at least partially—on the respective survey situation. Accordingly, if a survey is conducted in a dynamic environment that poses different contexts to the respondents when completing the survey or incorporates changing survey contents, multiple attention checks seem to be necessary for capturing context-dependent changes in attentiveness. For panel surveys, this means that attention checks should be implemented in each wave of the panel to acknowledge the changing survey situation.
Study 3
Building on the results of both previous studies, we conducted Study 3 to shed light on whether the mere exposure to a single IRI affects response behavior. As study 2 showed, inattentiveness is not an entirely stable characteristic but inherits the possibility to change (or be changed) to attentiveness. To follow-up on these results, we shifted the perspective to respondents who have read and processed the IRI, and investigated how this experience affected their response behavior. Consequently, Study 3 drew on an experimental design to explore the possible spillover effects of IRI attention checks.
Data and Method
For Study 3, we used a web survey that was conducted in Germany in January 2013 (Rattinger et al. 2013b). Again, this survey used questions on political attitudes and behaviors. The sample was drawn from an offline-recruited probability-based online access panel. Of the 1,532 panelists who followed the invitation, 326 were screened out, and 172 broke off, giving a break-off rate of 17 percent (Callegaro and DiSogra 2008). Overall, 1,034 respondents completed the survey.
For the experiment, we randomly split the sample into three groups: two treatment groups and one control group. Both treatment groups received the same IRI in a grid with seven items on “injustice” (see Table A3 in the Online Appendix for the question wording). The first treatment group had to answer this grid in the first third of the questionnaire (treatment: beginning), whereas the second treatment group was asked the grid questions in the last third of the questionnaire (treatment: end). The control group received the same grid but without the IRI (i.e., a six-item grid). Bivariate analyses on gender
The experiment enabled us to assess whether the mere exposure to a single IRI affects response behavior by comparing both treatment groups to the control group. Moreover, the comparison of the two treatment groups enabled us to examine whether the effects of an IRI on response behavior diminishes when the IRI is placed at the end of a questionnaire. Overall, 5.4 percent of the respondents in the treatment groups failed the IRI (see Table B3 in the Online Appendix for descriptive statistics on these respondents). 3
To investigate our research questions, it was mandatory that the respondents had seen and read the IRI. The mechanism behind either the positive or negative effects of exposure to an attention check rests on the assumption that respondents actually become aware that this survey item is a means of surveillance. In other words, if they were not aware that they were being controlled, a spillover effect should not exist. Consequently, we restricted our sample to all respondents who passed the IRI (in the treatment groups) or did not receive the IRI (in the control group), which left us with a total of 998 cases. 4
Similar to Study 1, we created a set of commonly used data quality indicators. Again, these included the speeder index, straightlining index, don’t know index, item nonresponse index, frequency of inconsistent answers, and frequency of implausible statements (for a detailed description, see Study 1). Since the questionnaires differed between surveys, the straightlining index relied on 18 grids, the don’t know index on 62 items, and the item nonresponse index on 200 items. Measures for inconsistent and implausible answers were based on two, respectively, 5 questions. In addition, the questionnaire featured both questions regarding self-reported data quality, which already had been used in Study 1 (i.e., self-reported attention and effort).
Results
Table 5 presents the results of comparing six indicators of data quality for respondents who did not receive the IRI attention check (control) and respondents who received the IRI (treatments: beginning/end). Overall, the results did not provide evidence that implementing an IRI affected respondents’ answering behavior. None of our tests showed differences in the indicators’ distributions for those respondents who received an attention check and those who did not. In other words, the respondents who did not receive an attention check completed the questionnaire with similar speed and a similar (relative) frequency of straightlining in the grids, don’t know answers, refusals, and inconsistent and implausible statements. Given the absence of effects for all six indicators, we interpret these findings as evidence that the spillover effects of a single attention check are limited.
Differences in Indicators of Data Quality Between Receiving an IRI Attention Check at the Beginning or End of the Questionnaire and the Control Group in Study 3.
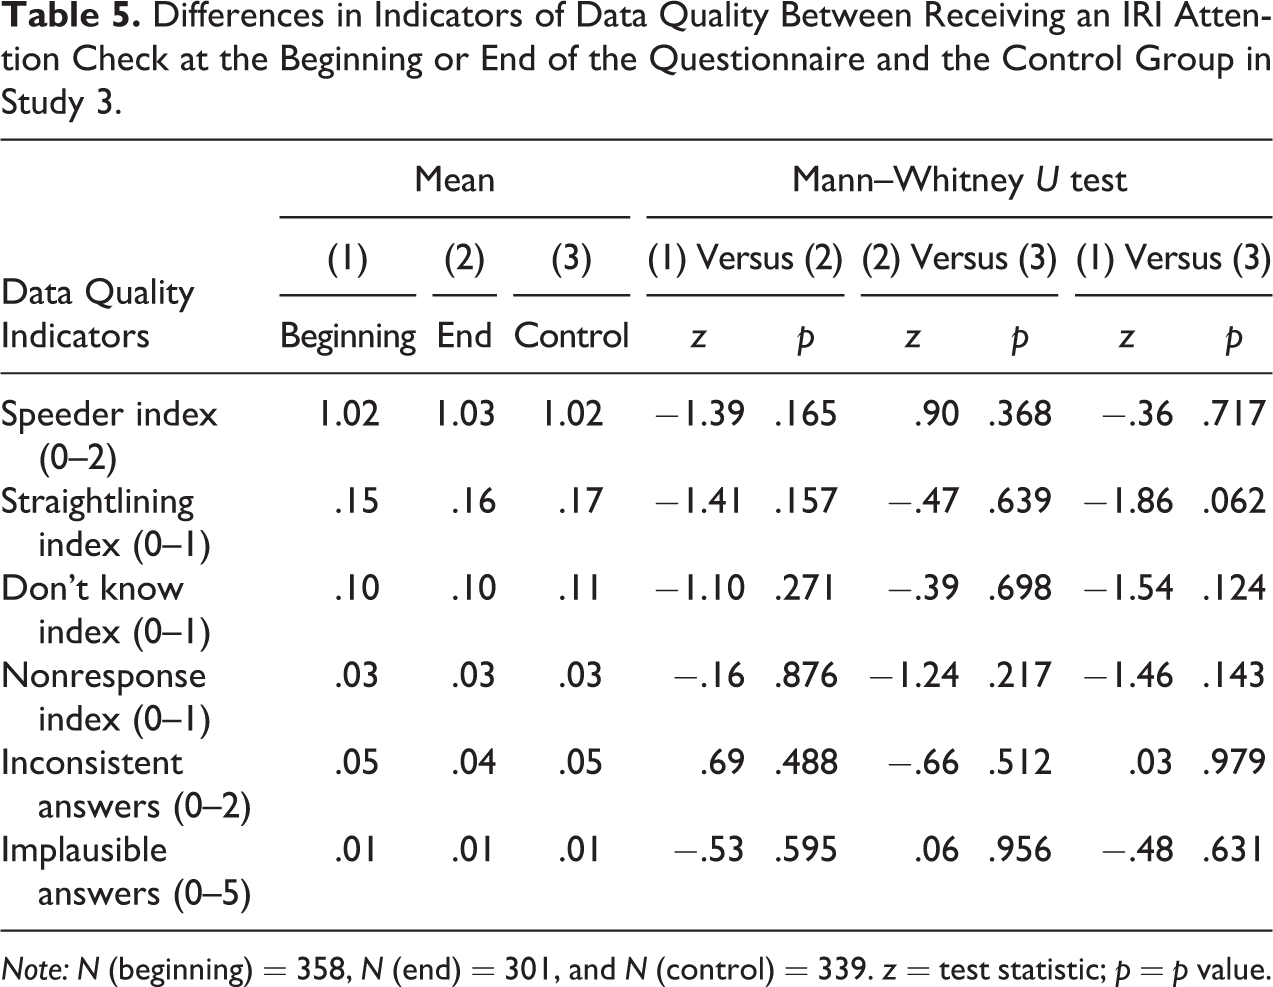
Note: N (beginning) = 358, N (end) = 301, and N (control) = 339. z = test statistic; p = p value.
With respect to the self-reported survey data quality measures, respondents in the treatment groups did not differ significantly from the control group: beginning versus control,
Table 5 also shows the differences in the six data quality indicators for respondents who received the attention check at the beginning or at the end of the questionnaire. The placement of the attention check did not significantly affect response behavior with respect to any of the six data quality indicators. This result is in line with our previous analyses, which suggested a limited spillover effect. Consequently, if spillover effects are limited, the placement of attention checks should not alter the overall data quality or the measurement and nonresponse error.
With respect to the self-reported data quality measures, our analyses provide additional support for the finding that the placement of the attention check does not affect how respondents judged their attention,
Conclusion
The present study sheds light on three research objectives regarding attention checks and the overall data quality of a survey. First, respondents who failed an IRI attention check were consistently more prone to response behaviors that commonly are associated with measurement and nonresponse error. They were more likely to speed through the questionnaire, straightline in grid questions, answer don’t know, refuse to answer questions, provide inconsistent and implausible answers, and report that they were less motivated and effortful when answering a questionnaire. While learning that IRIs may facilitate social scientists with an indicator for respondents who provide questionable data quality, excluding these cases did not significantly alter the results of substantive models. Second, an analysis using panel data showed that the inattentiveness of respondents changed across panel waves. Analyses of the transition patterns and factors behind these changes revealed that the potential for change can be attributed partly to variation in respondent and survey characteristics. This result suggests that practitioners need to consider whether the context and contents of their survey are stable when implementing attention checks. If IRI attention checks are to be used in panel surveys, our findings yield strong support for including attention checks in each wave of the panel. Third, the results of our experiment indicate that the mere exposure to a single IRI attention check does not alter response behavior to a significant extent. While this is an encouraging result in terms of the expected (negative) backlashes, it also means that we did not find IRIs to raise respondents’ awareness and, thus, to enhance the overall data quality. With respect to spillover effects, it needs to be noted that we investigated the effect of a single IRI. It seems, however, sensible to expect that with an increasing number of attention checks, spillover effects will start to emerge.
The findings of our three studies suggest that several benefits and drawbacks should be considered when planning the implementation of IRI attention checks in a survey. We would like to raise awareness that the use of attention checks has severe implications, and the choice for or against them should not be made lightly.
First, as our studies showed, IRIs help to detect response behaviors throughout a survey that are commonly associated with measurement error. Moreover, IRIs provide a local measure of (in-)attentiveness for the respective grid in which they are included. However, our findings also highlight the fact that the mere presence of a single IRI does not help to improve respondents’ attentiveness. Most importantly, excluding respondents who failed an IRI did not significantly alter the results of substantive models. This result is in line with previous findings by Anduiza and Galais (2016) on excluding respondents who failed an IMC, and by Greszki et al. (2015) on excluding speeding respondents. Accordingly, we remain skeptical about using IRIs to identify respondents who should be omitted from substantive analyses. As others have argued (e.g., Jones et al. 2015; Oppenheimer et al. 2009), using IRIs to exclude cases in (descriptive) analyses of one key construct, which has been placed close to the IRI in a survey, may have merit—but this is not recommendable when trying to improve explanatory models, which include variables from all over the survey. Second, it remains an open question whether attention checks should be used to assess overall quality if we can rely instead on indirect measures of data quality such as response latencies and item nonresponses. Omitting attention checks may help to avoid the negative issues associated with attention checks, which would enable survey designers to use this questionnaire space for substantive items. Third, inattentiveness varies across time and surveys. Accordingly, in (potentially) dynamic survey contexts and questionnaire contents, it seems recommendable to include several attention checks throughout a survey. These checks would require more space in a questionnaire(s) which then would not be available for substantive items. Again, one has to consider whether the use of indirect measures may be a more efficient means to assess data quality. Fourth, if a multiplicity of attention checks is used, it may be possible that negative spillover effects will emerge. More research on this issue is severely needed. Fifth, in most instances, respondents participate voluntarily in our surveys. Considering them to cheat and not provide the best they can might be perceived as unethical behavior on the part of researchers. This view becomes especially apparent if respondents are alerted by the attention checks, realize that they are being controlled, and perceive this behavior as insolent.
Our findings are not without limitations and yield research opportunities for further studies. First, the present study focused on IRI attention checks, which are only one approach among others of implementing attention checks (e.g., IMCs, bogus items). To further investigate what attention checks are capable of measuring and whether they incorporate spillover effects, it will be necessary to conduct additional comparative research on different types of attention checks. Second, in Study 2, we lacked variation in the survey-level characteristics and, hence, it was not possible to disentangle the effects of a changing questionnaire design, survey context and situation, and question characteristics. Therefore, we strongly encourage future studies to apply more advanced research designs to panel surveys to investigate this matter further. This could be done, for instance, by implementing an experimental variation in question content and complexity. Third, the sample of Study 3 was drawn from an offline-recruited access panel. Similar panels often are associated with higher data quality (e.g., Yeager et al. 2011). In our case, this sample likely reduced the number of respondents who failed the attention checks and, overall, resulted in data quality indicators that yielded more favorable results compared to the sample of Study 1. While this is surely desirable for substantive analyses, for our purposes, it limited the extent to which questionable response patterns could be observed and analyzed. Accordingly, we limited the scope of our analyses in Study 3 to the generic aim of the experiment, so to explore whether respondents changed their response behavior in reaction to reading and processing an IRI. We strongly encourage future studies to investigate attention checks and their spillover effects, especially in samples that are endangered by poor answer quality.
Supplemental Material
Supplemental Material, Appendix - Using Instructed Response Items as Attention Checks in Web Surveys: Properties and Implementation
Supplemental Material, Appendix for Using Instructed Response Items as Attention Checks in Web Surveys: Properties and Implementation by Tobias Gummer, Joss Roßmann and Henning Silber in Sociological Methods & Research
Footnotes
Declaration of Conflicting Interests
The author(s) declared no potential conflicts of interest with respect to the research, authorship, and/or publication of this article.
Funding
The author(s) received no financial support for the research, authorship, and/or publication of this article.

Supplemental Material
Supplemental material for this article is available online.
Notes
References
Supplementary Material
Please find the following supplemental material available below.
For Open Access articles published under a Creative Commons License, all supplemental material carries the same license as the article it is associated with.
For non-Open Access articles published, all supplemental material carries a non-exclusive license, and permission requests for re-use of supplemental material or any part of supplemental material shall be sent directly to the copyright owner as specified in the copyright notice associated with the article.
