
Abstract
Advances in computer science and computational linguistics have yielded new, and faster, computational approaches to structuring and analyzing textual data. These approaches perform well on tasks like information extraction, but their ability to identify complex, socially constructed, and unsettled theoretical concepts—a central goal of sociological content analysis—has not been tested. To fill this gap, we compare the results produced by three common computer-assisted approaches—dictionary, supervised machine learning (SML), and unsupervised machine learning—to those produced through a rigorous hand-coding analysis of inequality in the news (N = 1,253 articles). Although we find that SML methods perform best in replicating hand-coded results, we document and clarify the strengths and weaknesses of each approach, including how they can complement one another. We argue that content analysts in the social sciences would do well to keep all these approaches in their toolkit, deploying them purposefully according to the task at hand.
Keywords
Content analysis of text-based data is a well-established method in the social sciences, and advances in techniques for collecting and storing data, and in computational power and methods, are continually pushing it in new directions. These advances are typically aimed at making the process more scientific—more reliable, valid, and reproducible. 1 Previous advances include, for instance, intercoder reliability scores (e.g., Krippendorff 1970), designed to validate the coding of text across multiple people; qualitative data analysis software such as Atlas.ti and NVivo, designed to enable both qualitative analysis and quantitative identification of patterns to support qualitative conclusions; and the application of algorithms and mathematical models to extract objective patterns in text (Bearman and Stovel 2000; Carley 1994; Franzosi, Fazio, and Vicari 2012; Martin 2000; Mische and Pattison 2000; Mohr and Duquenne 1997). 2
This latter development, the application of algorithms and mathematical models to text-based data, is seeing renewed vigor from content analysts, as emerging methods in natural language processing (NLP) and machine learning are enabling new, and faster, computational approaches to structuring and analyzing textual data, including “big” data (DiMaggio, Nag, and Blei 2013; Grimmer and Stewart 2011; Mohr et al. 2013). Indeed, one of the promises of these techniques is that they will allow researchers to do more with fewer resources, permitting the analysis of more data or data from more diverse sources (e.g., newspapers and television), as well as the extraction of more fine-grained patterns from a data set of any size, including within a sample of previously hand-coded text. Given the resource-intensive nature of hand-coding techniques, achieving breadth and depth in the analysis of text-based data has been virtually impossible.
The specific advances in using computers to identify categories in text that we examine in this article were initiated by computer scientists and computational linguists with the aim of classifying text into prespecified or unknown categories (Andersen et al. 1992; Cowie and Lehnert 1996). To test the performance of these algorithms, computer scientists and computational linguists rely on a number of standard, labeled collections of text, such as the Reuters-21578 data set (“Reuters-21578 Test Collection” n.d.) and the 20 Newsgroup data set (Lang 1995). Categories in these benchmark data sets are determined by the collection curators and include topics such as “computers,” “recreation,” “science,” and “economics” among others.
The general conclusion from this research is that, given an adequate supply of previously labeled data, researchers can find an algorithm, or an ensemble of algorithms, that will accurately classify unlabeled data into the chosen classification scheme. That is, supervised machine learning (SML) algorithms of this kind can promise greater efficiency, transparency, and replicability, once a relatively small set of hand-coded documents has proven successful in “supervising” the computer to identify the desired content (Hanna 2013; King, Pan, and Roberts 2013). A number of software packages have therefore been developed to bundle algorithms and simplify their application in routine text analysis projects (e.g., RTextTools, scikit-learn, and Stanford NLP, which we discuss below).
However, as accessibility expands, scholars outside of computer science are moving beyond the benchmark collections and applying them to their own, discipline- or domain-specific tasks. This raises three methodological questions: (1) Can algorithms benchmarked on the standard collections perform as well in other domains? (2) If so, can these algorithms, and other computational tools, be successfully incorporated into the workflow of domain-specific questions and analyses? (3) More ambitiously, can they replace hand-coded work altogether?
We address these questions from the perspective of the domain of sociology (and allied disciplines). Scholars are turning to machine learning and other computational methods to augment or replace one of the most common tasks in sociological content analysis: identifying and coding themes, frames, concepts, and/or categories within text. But, in contrast to computer scientists and computational linguists, social scientists are typically not as interested in classifying a massive amount of text into their dominant categories, as they are in identifying complex, socially constructed, and unsettled theoretical concepts, often with ill-defined boundaries, such as populism, rationality, ambiguity, and inequality (Bonikowski and Gidron 2016; Evans 2002; Griswold 1987a). Most social scientists continue to rely on traditional human coding methods as the gold standard for the analysis of such phenomena (Benoit, Laver, and Mikhaylov 2009; Grimmer and Stewart 2011).
Our main objective in this article is to empirically test the three most prominent computer-assisted content coding methods—the dictionary method, SML methods, and unsupervised machine learning (UML) methods—against the gold standard of rigorous hand-coding for a complex topic of sociological interest. While there is considerable effort devoted to developing new algorithms for specific domains and problems (see, e.g., Bamman and Smith 2015; Nardulli, Althaus, and Hayes 2015), there is a dearth of empirical research to guide scholars in the selection and application of already established and packaged automated methods, especially with respect to the analysis of complex conceptual content. Can the leading fully-automated approaches to content analysis—dictionaries and UML—circumvent the need for hand-coding altogether? Indeed, are semiautomated methods like SML even up to the task of coding complex content?
Surprisingly, there has been no comprehensive comparison of how the various techniques perform relative to well established hand-coding methods when performing the kind of content coding of complex material that is of greatest interest to social scientists (including qualitative and quantitative researchers alike). Yet most social scientists do not have the resources to fully test these various approaches when embarking on their own content analysis project. We describe what, exactly, different automated techniques can and cannot do (in answer to the first question above) and show in the process that there can be significant complementarity among the various coding approaches (in answer to the second question above). In doing so, we provide a guide to the implementation of these methods in the domain of the social sciences more generally.
Because our aim is not only to inform debates among specialists but also to reach a more general social science audience, we take a different benchmarking tack than is common in the technical literature. Rather than benchmarking specific algorithms using data sets coded to test information retrieval (as computer scientists and computational linguists have done extensively), we benchmark the three computer-assisted approaches (dictionary, SML, and UML) on a data set hand coded to identify a complex and multifaceted theoretical concept (inequality). We compare substantive findings across the methods by provisionally treating the hand-coded results as the yardstick of measurement. The hand-coding method’s wider familiarity and acceptance among social scientists, along with its known strengths and weaknesses, enables us to root debates about content analysis methods firmly in realistic, social science data.
Although our focus is on substantive outcomes across the methods, we also offer practical guidance in the use of available software for computer-assisted text analysis. Supervised and unsupervised machine learning programs are at the leading edge of the field, yet even packaged programs require at least some knowledge of programming languages such as Python, Java, and R. We examined the three most widely-used “off-the-shelf” packages for applying SML methods: RTextTools (Jurka et al. 2014; R Core Team 2014), Python’s scikit-learn (Pedregosa et al. 2011), and Stanford’s NLP Classifier (Manning et al. 2014). Given that these three packages vary in the exact machine-learning algorithms included, the implementation of these algorithms, and the default text-processing settings, we wanted to test whether they produced similar results or whether they varied in their ability to replicate hand-coding. We also sought to evaluate their ease of use, and we provide some practical advice and links to learning resources in an Online Supplemental Appendix.
The data set, hand-coding methods, and general analytical strategy for testing the automated programs, given the features of our hand-coding project, are described in the Data and Analytical Strategy section. We then describe the metrics used to evaluate the accuracy of the automated methods in reproducing the hand-coded results in the Measures of Fit section. In the Results section, we describe in greater detail the three automated approaches to textual analysis, and perform our empirical tests of these approaches, in three subsections on SML methods, the dictionary method, and UML methods. Finally, in the Discussion and Conclusion section, we compare and contrast our results across the methods in order to highlight their strengths and weaknesses from a substantive perspective and to summarize the ways in which research questions of a substantive and conceptual nature can be appropriately matched to the various content analysis strategies.
Data and Analytical Strategy
Data and Hand-Coding Methods
In the hand-coding project, our substantive objective was to determine whether and when the new issue of rising economic inequality was covered by the media (McCall 2013). Following leading studies in political science on related topics such as welfare and race (Gilens 1999; Kellstedt 2000), we used the Readers’ Guide to Periodical Abstracts to search for articles on economic inequality from 1980 to 2012 in the three major American newsweeklies of Newsweek, Time, and US News & World Report. The Readers’ Guide provides a predefined list of subject terms for each article, and we selected a set of terms that most closely described our subject matter (“income inequality,” “wage differentials,” “equality,” and “meritocracy”). A surprisingly small number of articles had been assigned these inequality subject terms, however, so we expanded the search to include all articles that were assigned any of the 63 subject terms contained in this smaller set of articles. Because this population of articles numbered in the many thousands (approximately 8,500), we were forced to take a random sample stratified by year (10–15 percent of the population in each year). This sample (N = 1,253) is the data set of articles that we use in all subsequent analyses.
Crucial to the rationale for this article is the fact that we encountered such a variety of subject terms and complexity of subject matter that we felt no choice but to code each article by hand. Unlike comparable studies of media coverage of welfare and race, we assumed neither that all articles (selected using the method described above) were relevant, nor that a preset list of phrases was exhaustive or definitive enough for use in a computer-coding program. 3 Rather, coding by hand enabled a more flexible approach to identifying and classifying subject matter that varies in form (i.e., the particular words or phrases used) but not necessarily in content (i.e., the concept of interest). This flexibility is perhaps especially necessary when the subject of analysis is a new multifaceted social issue unfolding in real time, for which settled and durable cultural frames are unavailable. For instance, it was not feasible to deductively catalogue the complete set of metaphors for economic inequality that could be invoked over a three-decade span of news coverage (e.g., the metaphor of “Wall Street versus Main Street” spread wildly during the financial crisis in the late 2000s, whereas stories about “union busting” were more germane in the early 1980s). Nor could we generate an exhaustive list of terms that are used to describe every potentially relevant social class group (i.e., the wealthy, the rich, executives, managers, professionals, the middle class, the unemployed, the poor, minimum wage workers, etc.).
Our coding scheme—iteratively developed in several stages using deductive and inductive reasoning (Chong and Druckman 2009; Ferree et al. 2002; Griswold 1987b)—attempted to encompass this wide range of coverage and, in addition, come to a better understanding of several gray areas of coverage (see Online Supplemental Appendix A for our definition of inequality). In fact, the challenges we faced in reliably coding the concept of inequality—material that conveyed the reality of inequality without necessarily relying on stock phrases of inequality—meant that we had to abandon earlier efforts to also code the ways in which the issue was framed, particularly in terms of its causes and solutions. 4 As we discuss in subsequent sections, we anticipate using fully automated tools to perform these further analyses on the subset of articles identified by other methods (i.e., hand-coding and SML) as mentioning inequality. (Thus, automated methods may be of use in conducting more detailed analyses of sampled data; that is, they are not applicable only to “big data.”)
Our hand-coded results are presented in Figures 1 and 2. Over a third of articles were ultimately deemed irrelevant 5 in the process of hand-coding and the rest of the relevant articles were divided into two groups: (1) those that reference the topic of inequality, further broken down into articles with explicit references to inequality (e.g., using the term “inequality”) or implicit references (e.g., describing the diverging fortunes of executives and low-wage workers), respectively labeled explicit and implicit inequality, 6 or (2) those that fell into a residual category focusing on related but more general trends in income, employment, and the economy. This group, which we term general economic (or economic for short) is also broken down into two categories. Figure 1 provides a visual representation of the five underlying categories along a continuum from irrelevant to explicit inequality. The two aggregated relevant categories (explicit/implicit inequality and general economic) are also represented in Figure 1. Two-coder reliability tests were high for the irrelevant category (.78) and the combined explicit and implicit inequality category (.92 in the first round of coding and .85 in a second round), and thus we focus on replicating them, and especially the central category of interest, explicit/implicit inequality. The time trends for the two aggregated relevant categories plus the irrelevant category are charted in Figure 2.
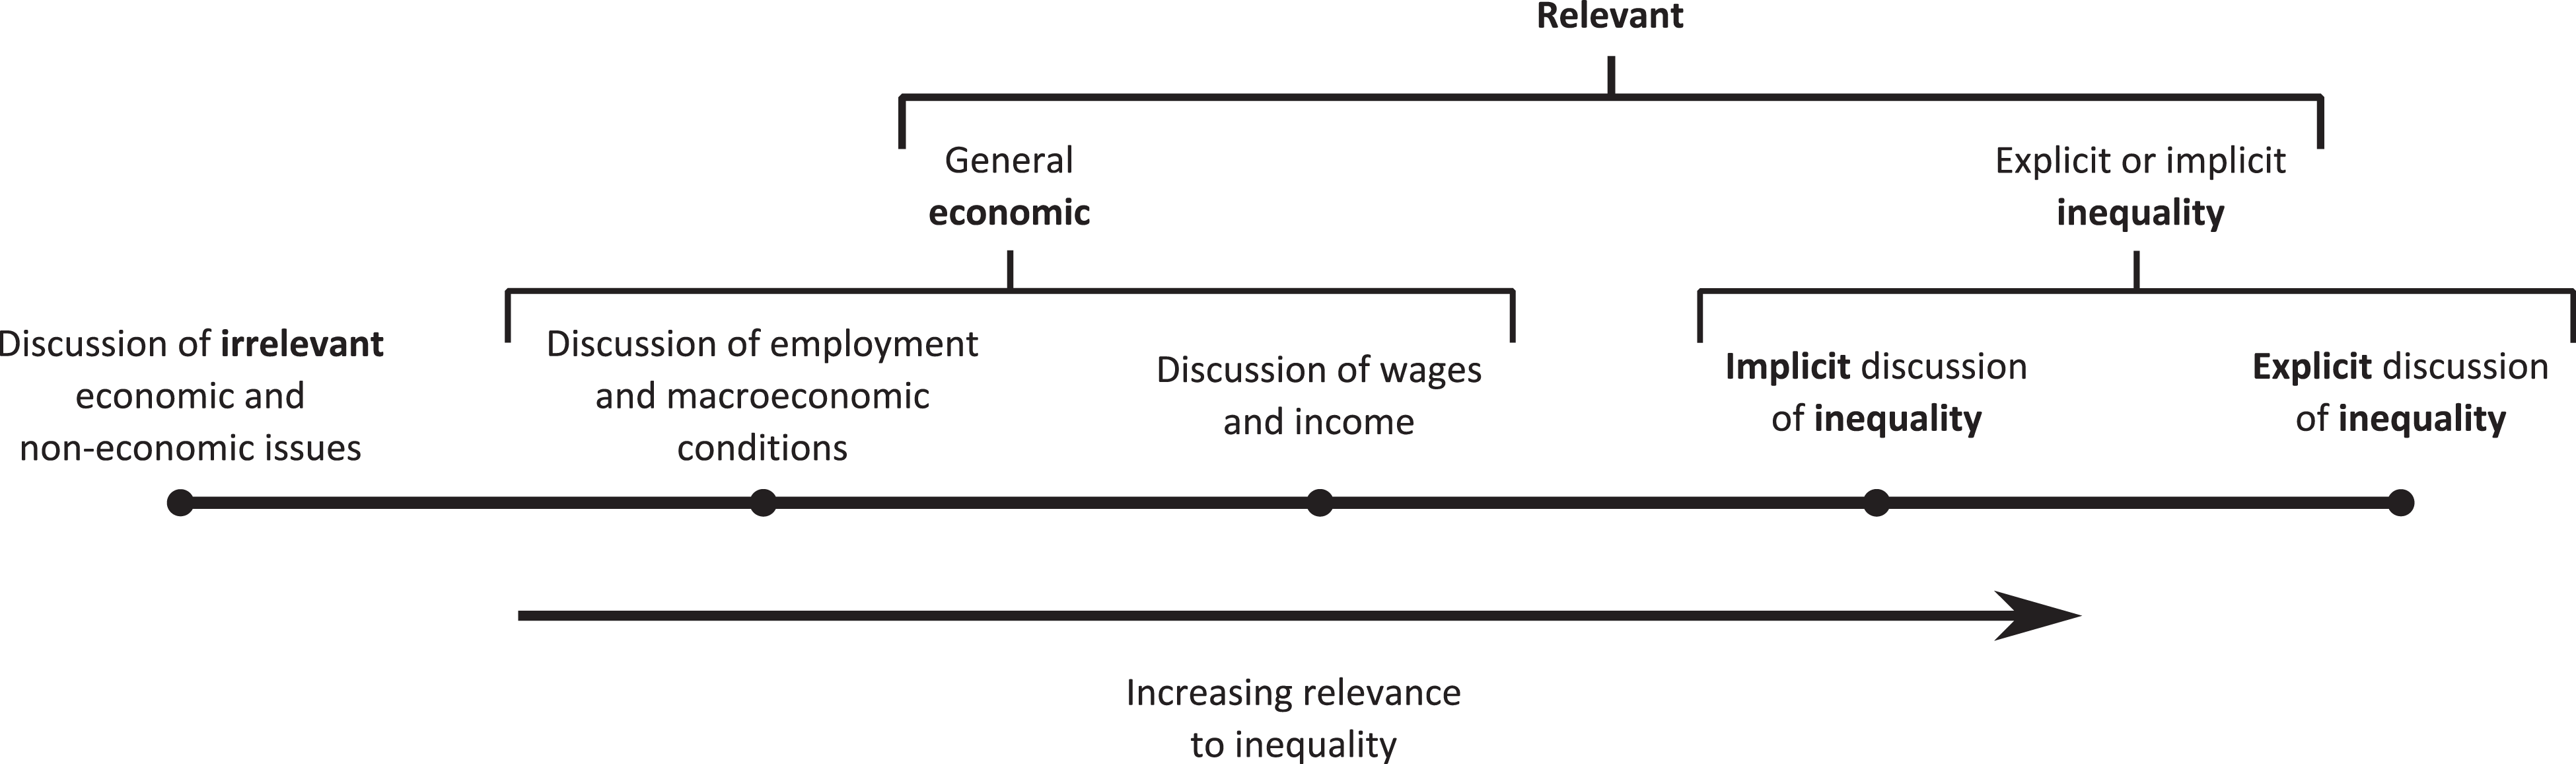
Categorization of hand-coded articles.
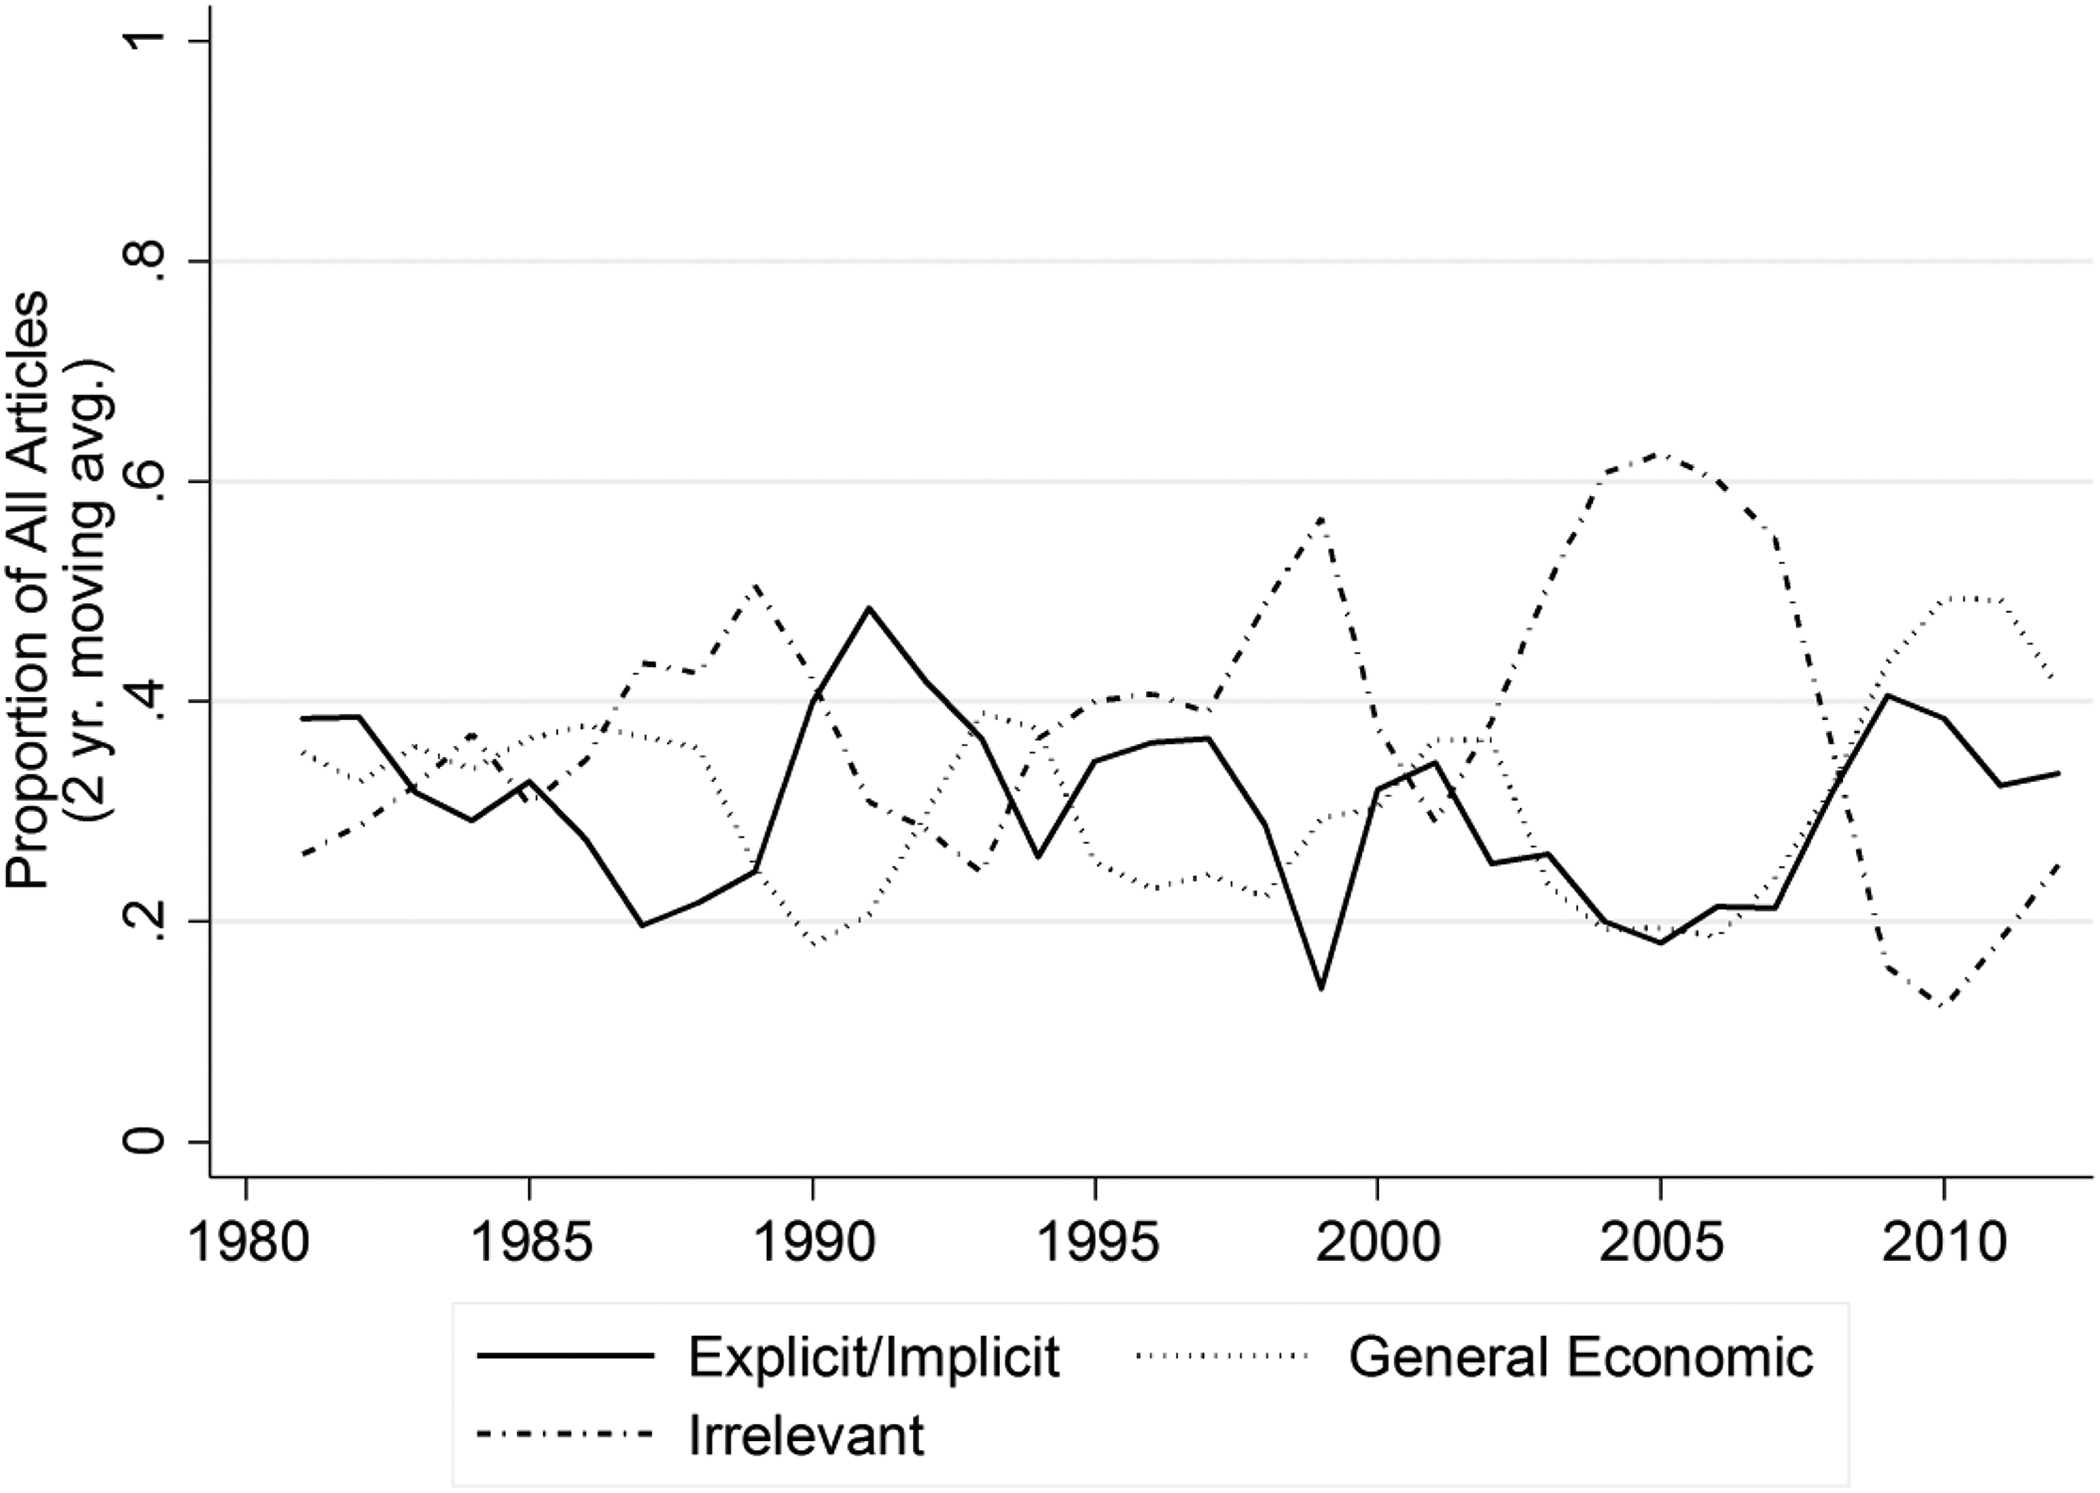
Trends in preferred three-code scheme of hand-coded articles (explicit/implicit inequality versus general economic versus irrelevant categories).
General Analytical Strategy
In addition to the complexity of the coding scheme noted above, we highlight several other aspects of our data and coding process that have implications for how we perform our tests of the automated methods and for our expectations of the results. First, the coding and development of the coding instructions took place prior to the spread of the new automated approaches to textual analysis; thus, the coding was not performed in order to test the automated programs. Second, and relatedly, we sought to determine only whether the fact of economic inequality, as we defined it, was ever mentioned in an article. Notably, this means that many articles were coded as inequality even if the primary topic was another issue. As a consequence of these two aspects of the hand-coding process, the automated programs will have to tune out a considerable amount of noise in order to correctly classify the articles (i.e., to agree with the classification of the hand coders). At the same time, the distinctions among the categories could be challenging to detect because most of the articles contain economic material to some degree. As we discuss below, this may especially be the case for categories of articles that are by definition subtle, such as implicit inequality.
Thus, we have set a high bar for the computer-assisted methods to meet, even those that are trained by previously hand-coded data. With respect to the automated methods that do not have this built-in advantage, the bar may be unreachably high. Our tests are nevertheless instructive, as they clarify exactly what will result, substantively, from the application of each method alone to the data, something we believe is fairly common practice. Specifically, we examine whether, starting from scratch, fully automated methods isolate the topic of theoretical interest (i.e., inequality) from the potentially numerous other ways in which our data can be categorized. Analogously, we examine whether sophisticated dictionary lists are exhaustive enough to detect the scope and variation of coverage of inequality over time. In short, we use the hand-coding results as a yardstick against which to empirically identify the relative strengths and weaknesses of each of the three broad approaches to computer-assisted textual analysis.
Measures of Fit
In performing our tests, we utilize three widely used measures of fit: precision, recall, and F1 scores (Van Rijsbergen 1979).
Precision refers to the proportion of positive results that are “true” positives according to the hand-coding. For instance, if half of the articles that an automated program classified as mentioning inequality were similarly classified by the hand coders, then the precision score would be .50. Recall refers to the proportion of true positives that are also coded by the automated methods as positives. Thus, an analysis with high precision and low recall will be correct in most of its positive classifications but will miss a large proportion of articles that should have been classified as positive. F1 scores are the harmonic mean of precision and recall and provide a measure of overall accuracy for each category. While in most situations F1 scores are taken as the best indicator of fit, we found that precision and recall offered a better sense of where a model is succeeding and where it is erring. Accordingly, we pay as much, if not more, attention to these indicators as to the F1 score. Because these scores are calculated for each category (i.e., inequality, irrelevant, etc.), we also use a weighted average of precision, recall, and F1 scores across coding categories as an overall measure of method accuracy. 7
We add to these standard measures a comparison of the time trends estimated by each of the computer-assisted methods. Not only is the identification of time trends one of the most common objectives of a textual analysis project, but one concern about automated approaches is their potential insensitivity to changes in language over time (Hopkins and King 2010:242). We therefore test for the ability of computer-assisted approaches to reproduce the time trend from the original data, which is based on the proportion of articles in each year coded as falling into our predetermined categories, such as articles that contain explicit and/or implicit mentions of inequality. After using two-year moving averages to smooth the data, we use the correlation between these proportions for the automated programs and for the hand-coded method as a measure of accuracy. These analyses provide an answer to the question of whether computer-assisted coding will yield substantive conclusions similar to those derived from traditional methods.
Results
We begin with the method that is most similar to hand-coding in that it requires hand-coded input (SML). We then evaluate the more fully automated methods in the following sections. Sections on each method are in turn broken down into three subsections: (1) a brief overview of the method, including references to the technical literature in both the text and corresponding Online Supplemental Appendix for readers interested in greater detail, (2) a description of the analytical strategy, which differs slightly for each method as we calibrate our data and analysis to the particularities of the methods, and (3) the results.
SML Methods
Brief description
SML methods leverage both computers’ ability to detect patterns across large numbers of documents and human coders’ ability to interpret textual meaning. Based on a “training set” of documents hand coded into categories of interest, an SML analysis consists of three steps. First, documents are converted into “vector[s] of quantifiable textual elements,” which are called “features” (e.g., counts). Second, a machine learning algorithm is applied to find a relationship between these numeric feature-vectors and the hand-coded categories assigned to them, producing a model called a “classifier.” Finally, the analyst uses the classifier to code documents not in the training set (Burscher, Vliegenthart, and De Vreese 2015:124).
In SML methods, then, a document is represented as a vector of word counts, or “bag of words.” On its face, treating documents as bags of words seems wrongheaded, given how context can drastically change a word’s meaning. Because of the complexity of our hand-coding scheme, changes over time, and the concept of inequality itself, our analysis poses a difficult test for the bag of words approach. However, in practice, this strategy has been shown to perform well for many classification schemes of interest to researchers (Hopkins and King 2010). Our data allow us to experiment with different combinations of our five underlying content codes (see Figure 1) and thus to test classification schemes of varying types.
Analytical strategy
If we were performing an SML analysis from scratch, we would first hand code a subset of documents from our population of interest. This subset of hand-coded documents is the training set. Next, we would test our SML setup by selecting random subsets of the hand-coded documents to train SML classifiers and try to replicate the classification of the remaining hand-coded documents (called the “test set”). Low levels of agreement would suggest the need to refine the hand-coding scheme or change the specifications for training the SML classifier. Finally, once an acceptable level of agreement was reached (based on precision, recall, and F1 scores), we would train a classifier using all the hand-coded documents as the training set and then use it to classify the larger population of uncoded documents (called the “unseen set”).
Because our focus was on testing the ability of SML to replicate hand-coding, we only applied our classifiers to already hand-coded documents. We constructed 25 artificial training and test sets by randomly selecting roughly 500 articles to be the training set and using the rest (roughly 750) as the test set. We present the range of metrics across the 25 sets for the weighted average precision, recall, and F1 scores across all categories (see columns 7–9 in the first panel of Table 1) but focus our presentation and discussion on the metrics for the individual categories of the median performing set. The metrics for this set are the main entries in all columns of the first panel of Table 1, and the accompanying figures chart the proportion of articles classified by SML into the specified categories over time, again for this median performing set. 8
Evaluation Metrics for Each Automated Method.
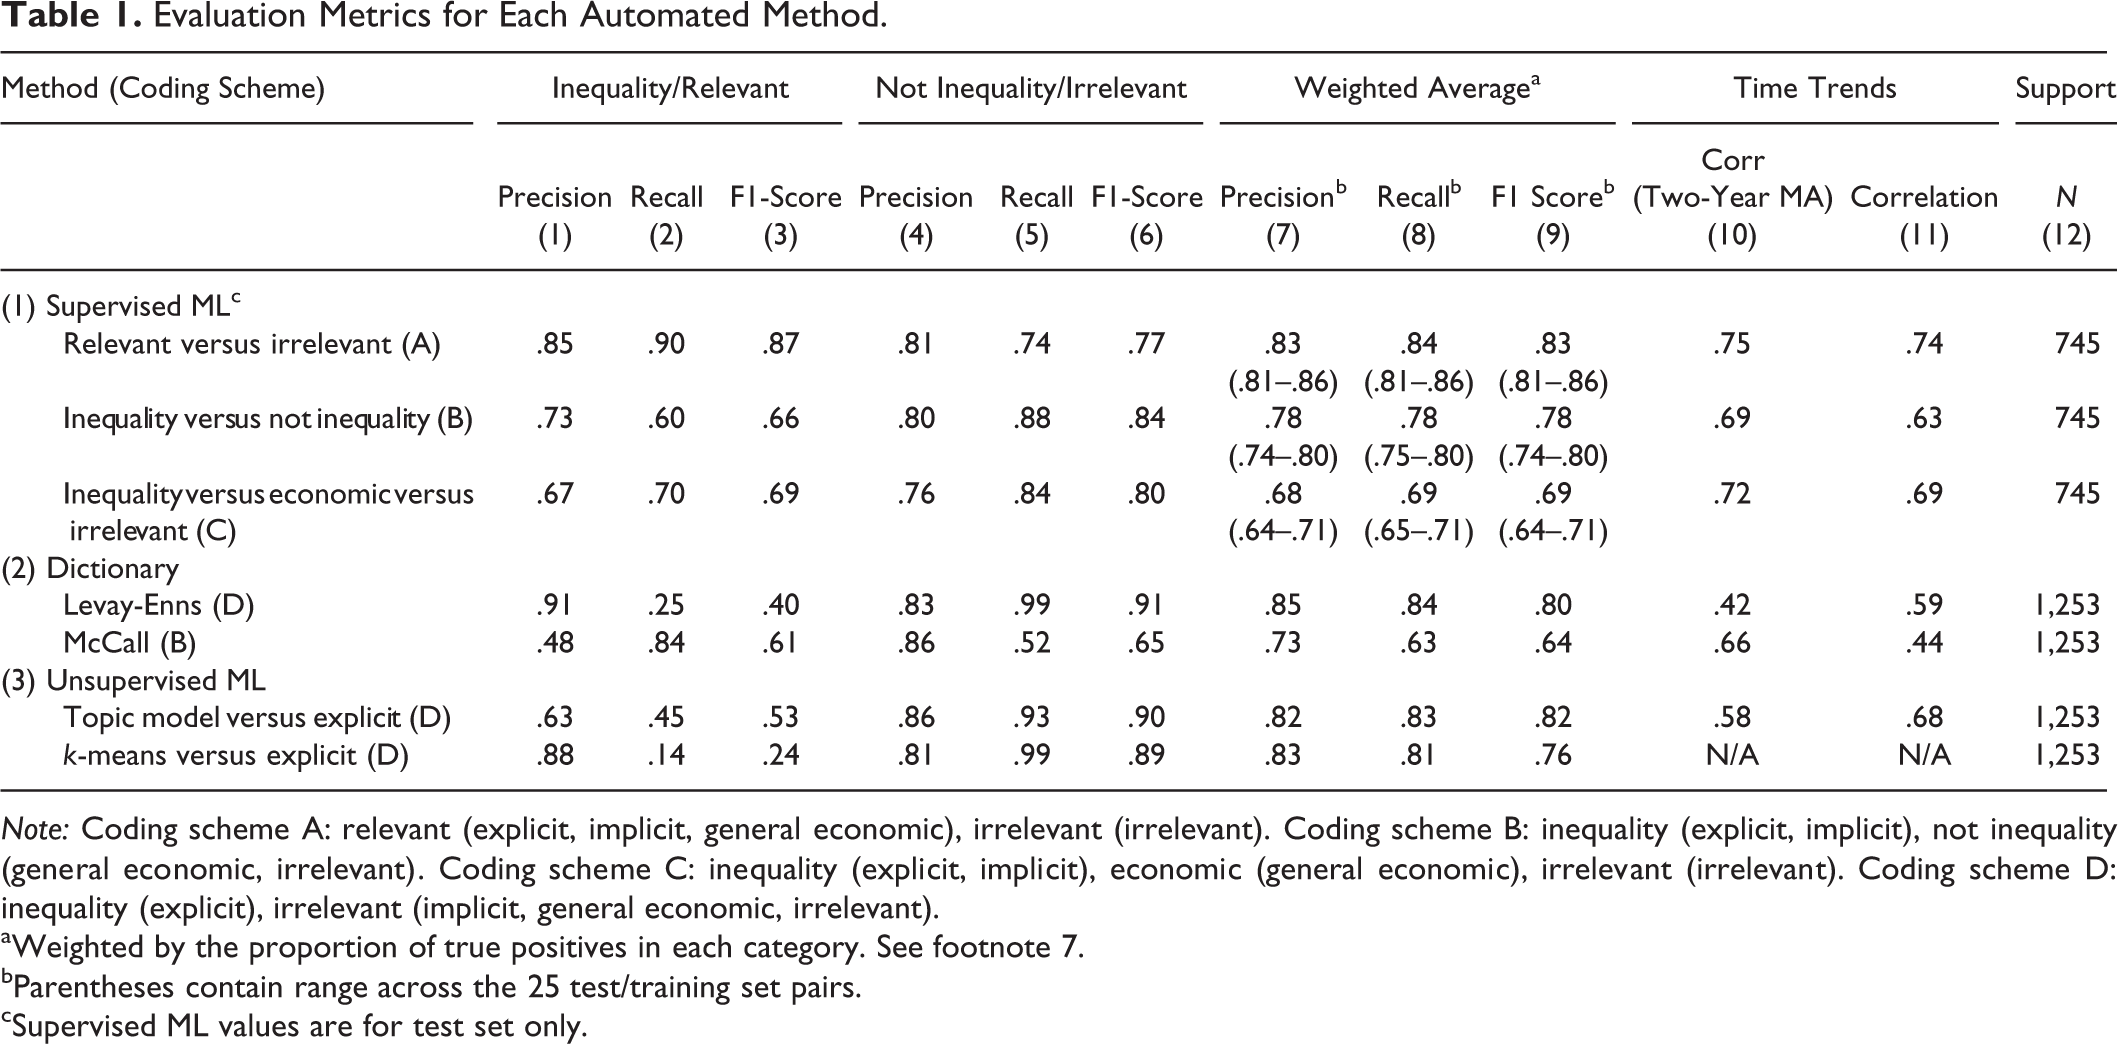
Note: Coding scheme A: relevant (explicit, implicit, general economic), irrelevant (irrelevant). Coding scheme B: inequality (explicit, implicit), not inequality (general economic, irrelevant). Coding scheme C: inequality (explicit, implicit), economic (general economic), irrelevant (irrelevant). Coding scheme D: inequality (explicit), irrelevant (implicit, general economic, irrelevant).
aWeighted by the proportion of true positives in each category. See footnote 7.
bParentheses contain range across the 25 test/training set pairs.
cSupervised ML values are for test set only.
In addition to varying the training and test sets, we also tested three combinations of our five underlying categories. In the first coding scheme, relevant versus irrelevant, we distinguish between all substantively relevant articles and irrelevant articles. In the second coding scheme, inequality versus not inequality, we distinguish between articles mentioning inequality—whether explicitly or implicitly—and all other articles. In the third coding scheme, inequality versus economic versus irrelevant, we distinguish between articles mentioning inequality, those discussing general economic issues but not mentioning inequality, and irrelevant articles. (We also discuss results from an alternative three-code scheme that we tested.) By comparing SML’s performance among these various coding schemes, we evaluate the method’s ability to replicate distinctions of different types, greater or lesser complexity, and different levels of aggregation.
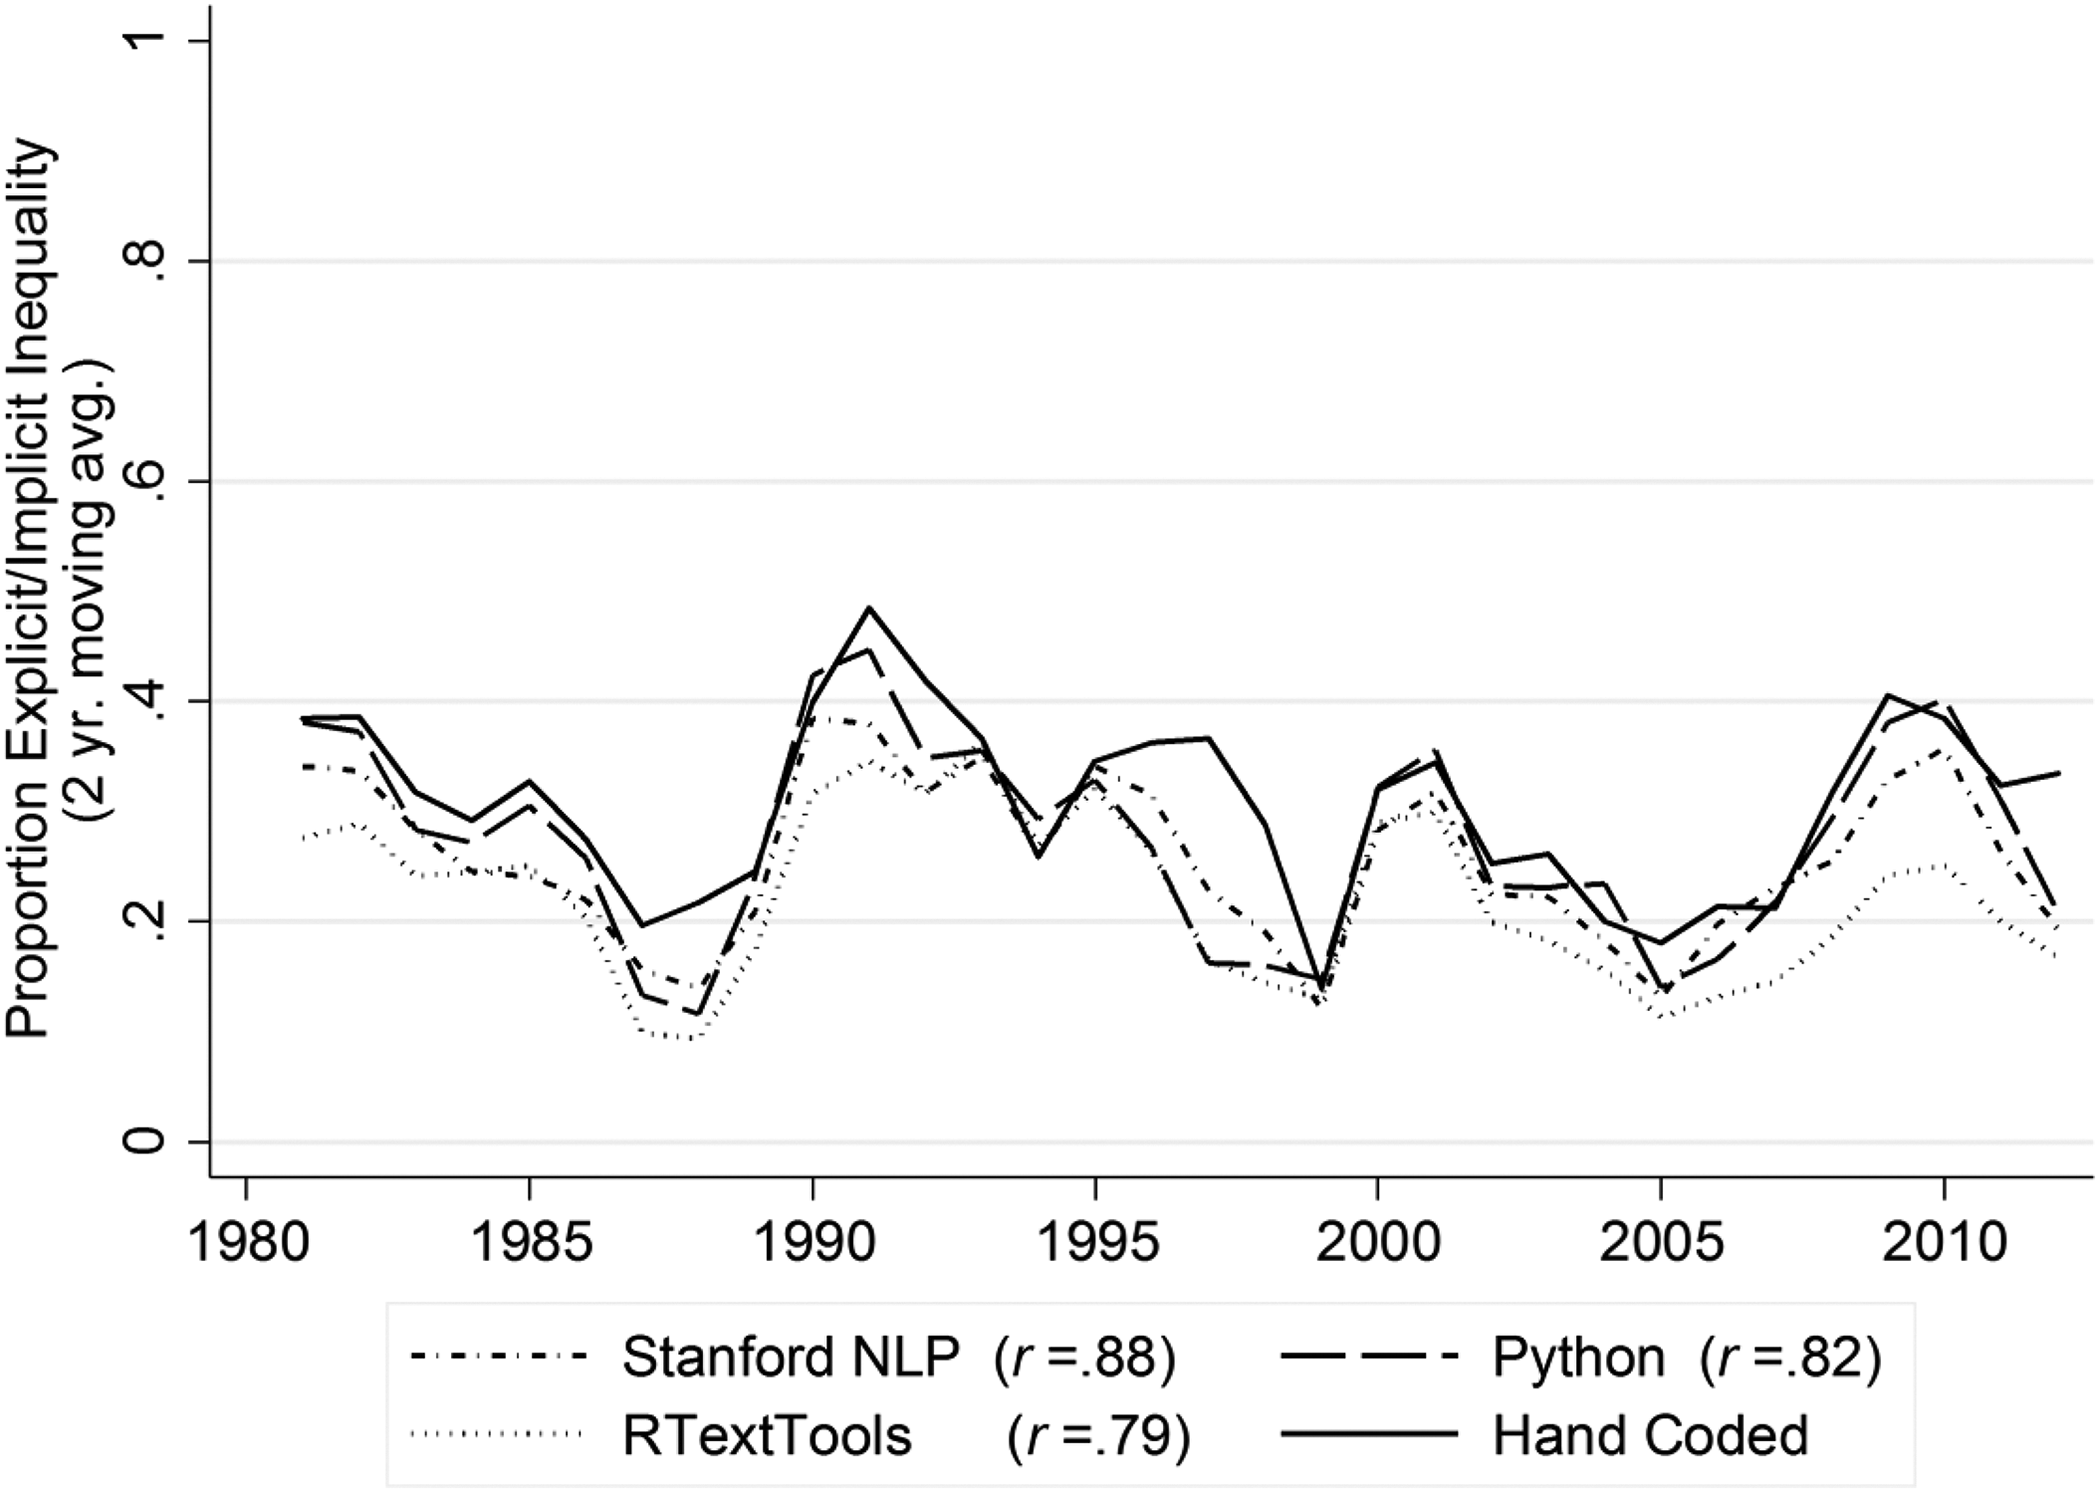
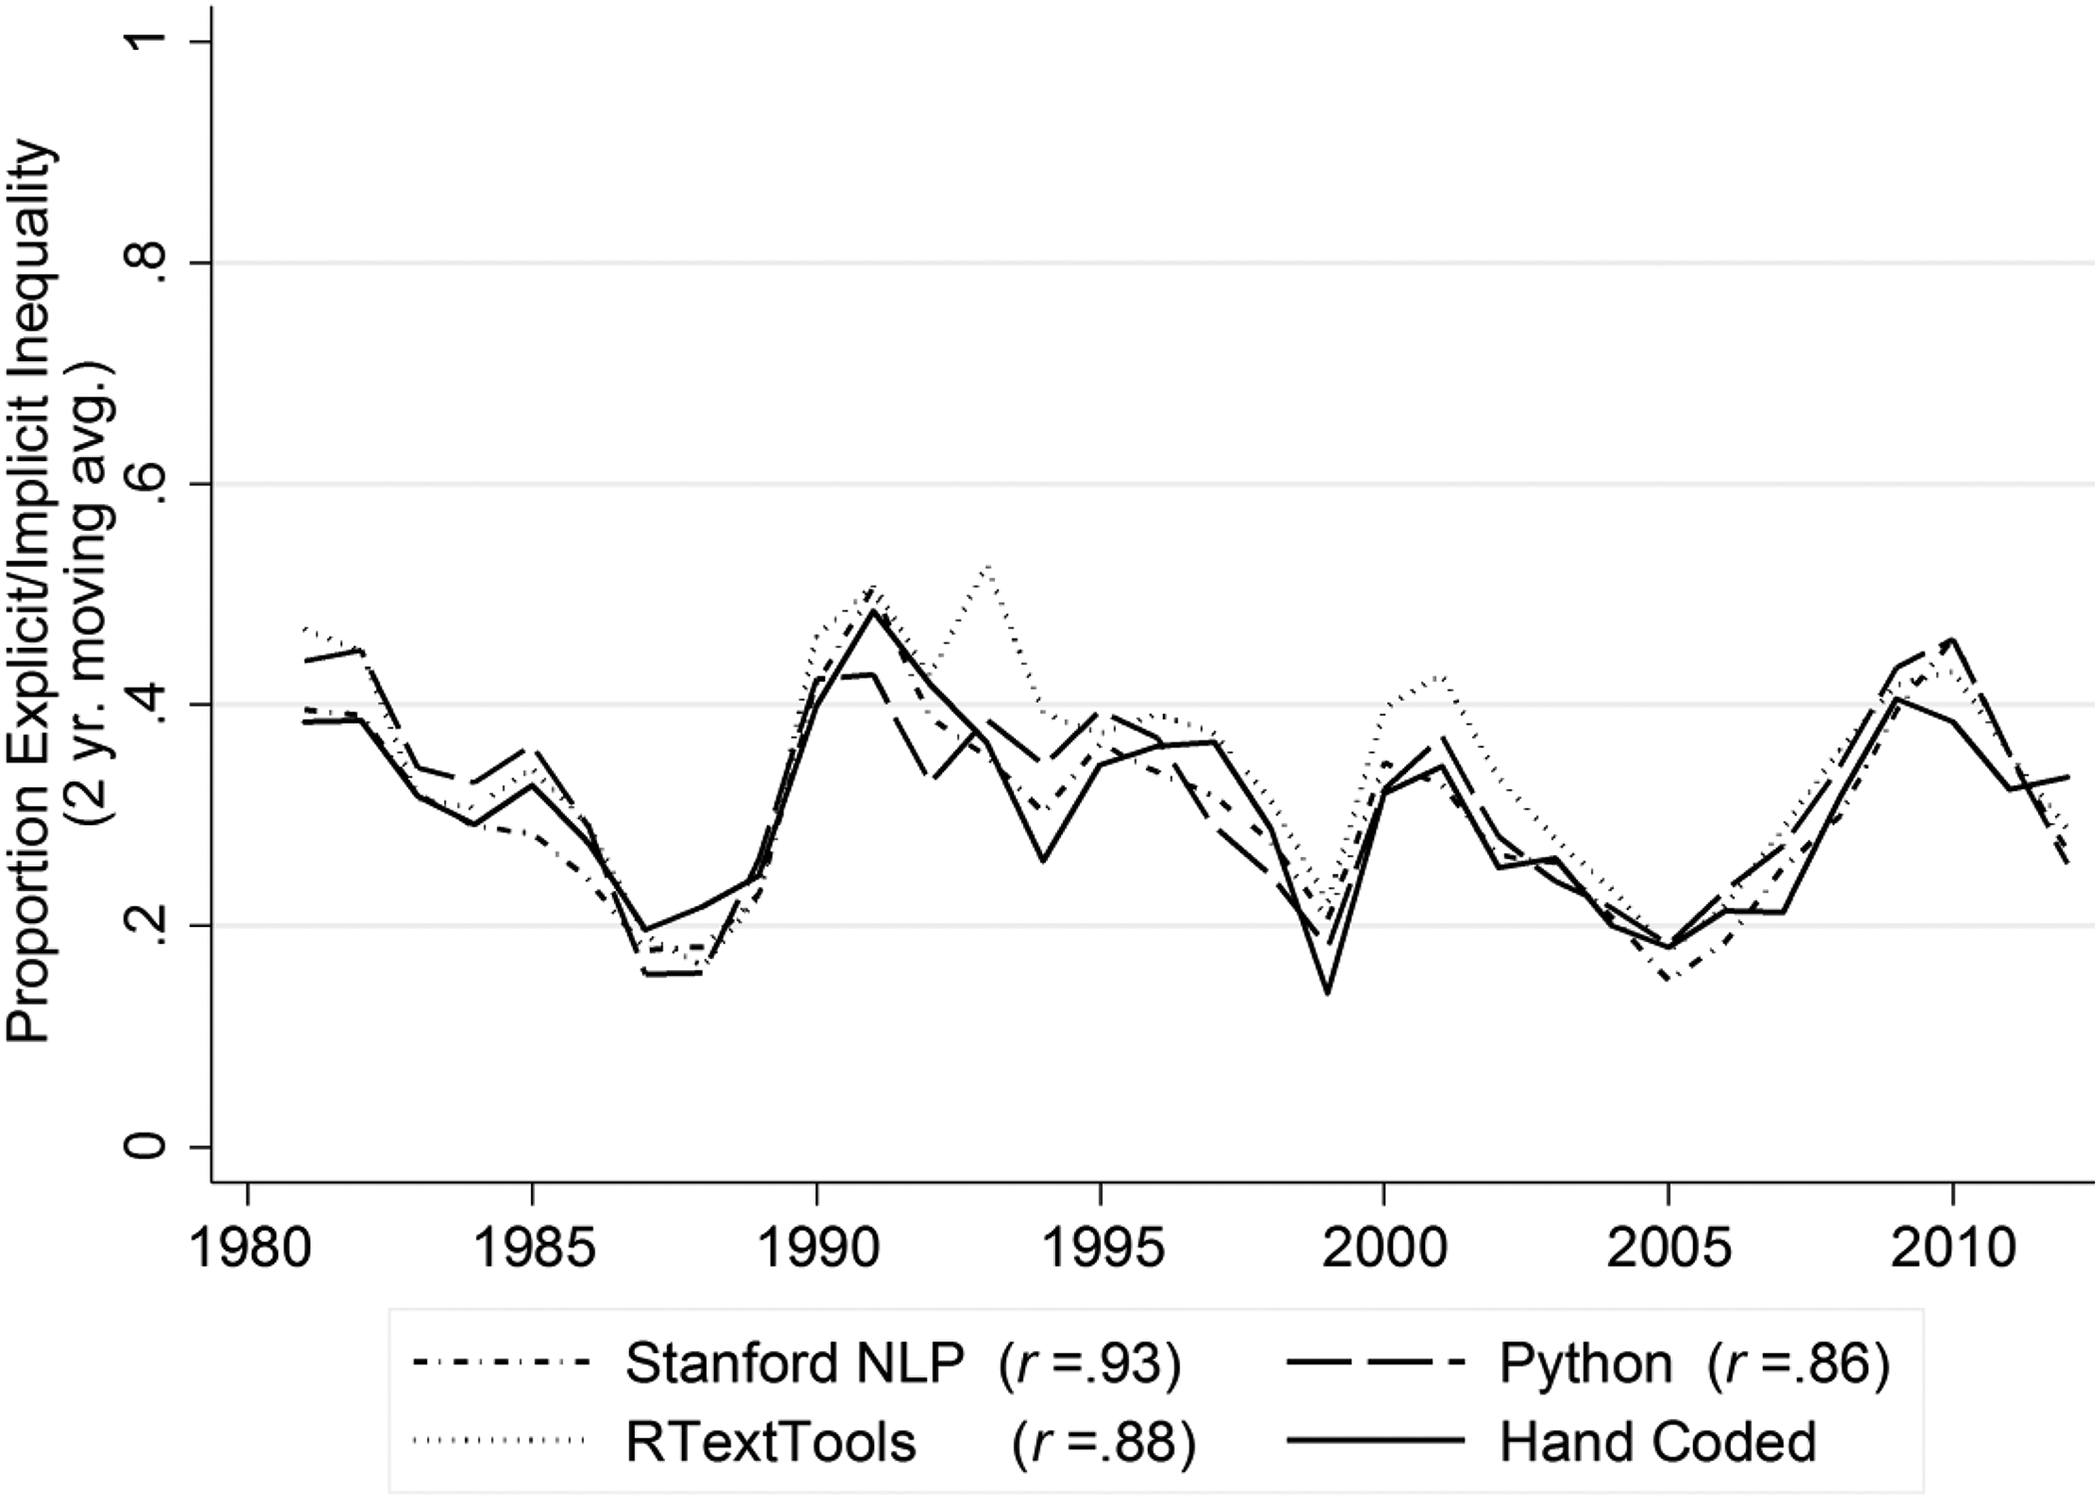
We performed our SML analysis using the three most widely adopted SML software packages: RTextTools, Stanford’s NLP routines, and Python’s scikit-learn. 9 We ran each program with comparable settings, within the limits of the options provided by each package, because we wanted to compare the “off-the-shelf” products and minimize the need for users to employ additional scripting (see Online Supplemental Appendix Table D1 for the settings for each program). Figures 3 –5 show the time trends for all three programs to demonstrate their commensurability. Because our results were similar across software packages, and because Python’s scikit-learn is the most actively developed program of the three, we present results only from that package in Table 1 but include results from the other programs in Online Supplemental Appendix Table D2. We also include in Online Supplemental Appendix D brief descriptions of each program, along with links to helpful tutorials and learning resources.
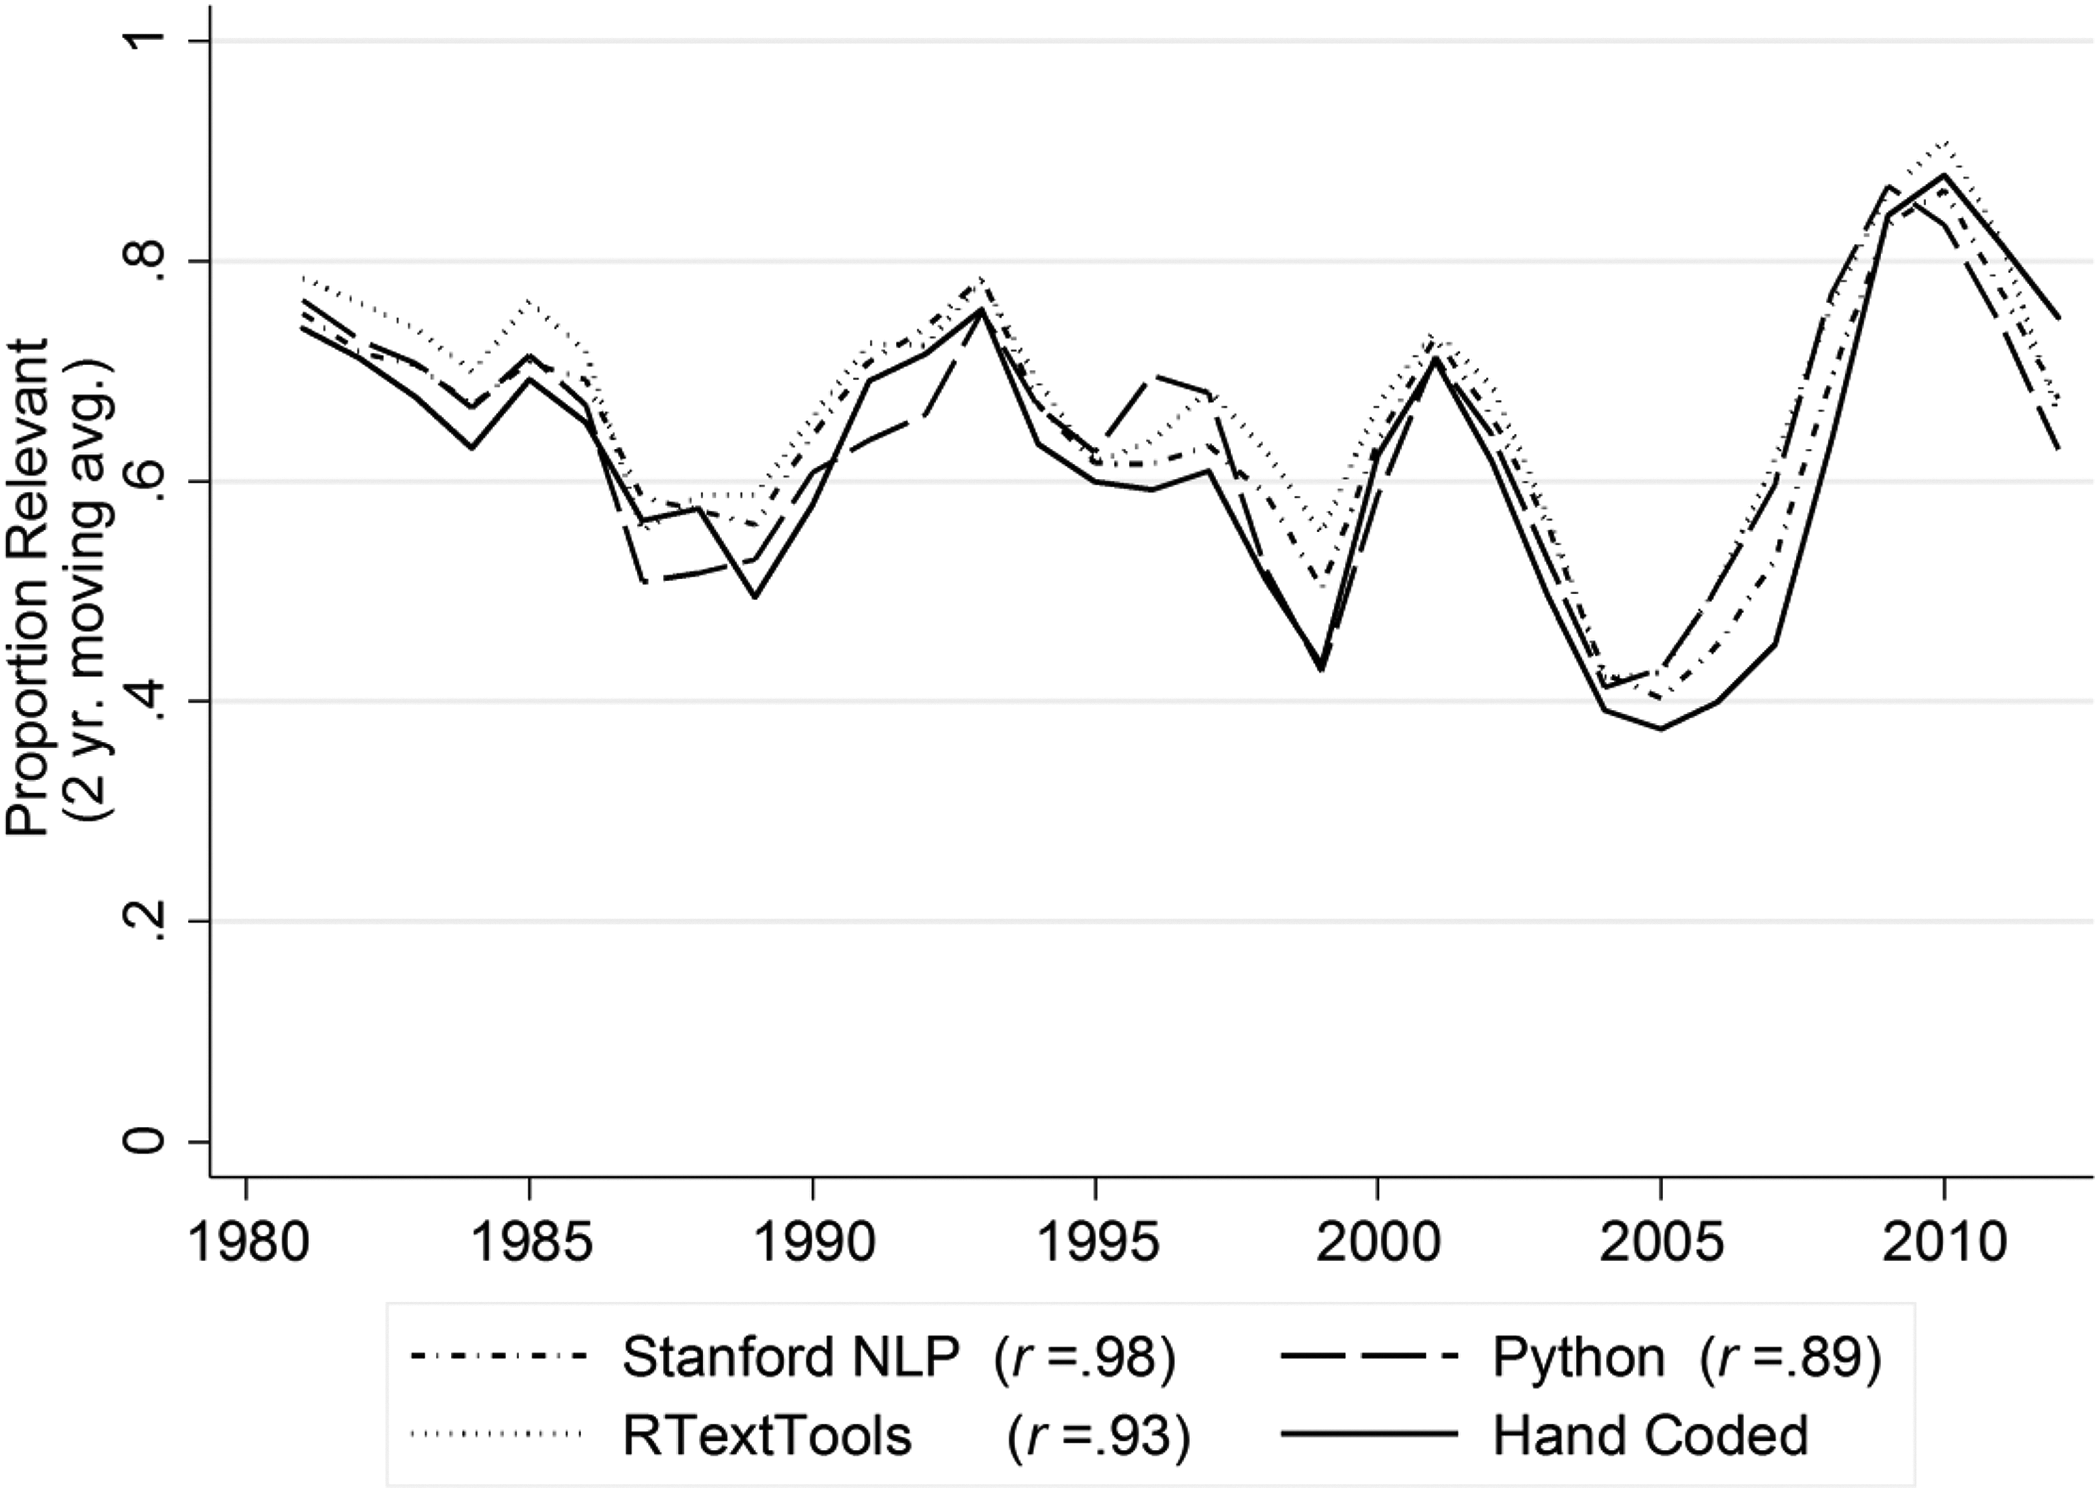
Trends in supervised machine learning analysis of hand-coded articles for relevant versus irrelevant binary scheme (combined relevant substantive categories versus irrelevant category; combined relevant substantive categories shown).
Trends in supervised machine learning analysis of hand-coded articles for inequality versus not inequality binary scheme (explicit/implicit inequality versus all other categories; explicit/implicit inequality category shown).
Trends in supervised machine learning analysis of hand-coded articles for preferred three-code scheme (explicit/implicit inequality versus general economic versus irrelevant categories; explicit/implicit inequality category shown).
Results
Our analyses reveal that SML methods perform well in terms of both precision and recall. Looking first at the metrics averaged across the categories for each of the three classification schemes (column 9 in Table 1), we find average F1 scores for the median test set close to or well above the .70 rule of thumb for good fit often followed in the literature (Caruana and Niculescu-Mizil 2006). F1 scores are generally quite high for both the relevant versus irrelevant (.83) and inequality versus not inequality (.78) schemes, indicating that the inequality articles (combining explicit and implicit articles) and the irrelevant articles represent well-defined groupings. F1 scores are lower for the inequality versus economic versus irrelevant scheme (.69), suggesting that lower levels of aggregation lead to fuzzier distinctions among categories that are more challenging for the algorithms to recognize, at least in our data.
Taking a closer look at these results for the three-code scheme, the low F1 score stems from lower metrics for the middle economic category, which are not shown in Table 1. The F1 score for this category was .52, compared to .69 and .80 for the inequality and irrelevant categories, respectively. The recall for this economic category was especially poor. Of the 200 test-set articles hand coded into this category, only 93 (47%) were correctly classified by the SML algorithm. The algorithm struggled most in distinguishing between the economic and inequality categories, classifying 67 (34%) of these 200 economic articles as inequality articles, and, as might be expected, most of these fall into the implicit category.
For example, an article from 1983 titled The Growing Gap in Retraining was hand coded into the economic category and misclassified by the SML algorithm into the inequality category. This article called for the Reagan administration to invest more in worker retraining programs. It has all the buzzwords and phrases associated with inequality: ever widening gap, pressing problem, displaced workers, lost value, and so on. But the article never actually mentions earnings or income inequality; instead, it discusses the employment skills gap: “As the U.S. economy sloughs off its declining manufacturing industries and increases its dependence on faster-growing service and technology sectors, an ever widening gap has opened between the new jobs that are being created and the skills of available workers.” These types of articles, containing key words associated with income inequality but used in the context of educational or employment inequality, were consistently misclassified by our algorithms. We return to the methodological and substantive significance of this point in a moment after we finish reporting the main results.
As shown in Figures 3 –5, the SML methods are also capable of reproducing the trend in media coverage of inequality found in the hand-coded data. Here, we measure coverage of inequality as the proportion (as opposed to number) of articles coded into the inequality or relevant category per year, and we include the whole sample (training and test sets) of articles to get the best estimate of actual coverage of inequality (with two-year moving averages depicted along with the correlation between the hand-coded and SML trends). Just as in the hand-coded analysis, the SML results show peaks in inequality coverage in the early 1990s and around the period of the Great Recession. The temporal correlation between the hand-coded and SML trends ranges from .69 to .75 (shown in column 10 of Table 1). Given the small variation in our metrics across our 25 data sets and our careful sampling procedures, we are confident that the patterns found in our 10–15 percent sample are representative of our larger population of articles.
While these results are certainly encouraging, an important takeaway from these and other analyses that we conducted is that the selection of classification schemes may depend more on the precision and recall metrics for individual categories of theoretical interest than on the average total F1 score across categories, which is a more common practice in the literature. For example, in testing different three-category coding schemes, we obtained a slightly higher overall F1 score with an explicit inequality versus implicit inequality/economic versus irrelevant scheme than with our theoretically preferred inequality versus economic versus irrelevant scheme presented in Table 1. This higher F1 value was due to much better precision and recall for the combined implicit inequality/economic category as compared to the economic category alone. Yet, the trade-off was a markedly worse performance in identifying explicit inequality articles as compared to identifying a combination of explicit and implicit inequality articles (in our preferred three-category scheme). Given our substantive interest in inequality, then, we opted for a coding scheme that better identified articles mentioning inequality over one with slightly better performance overall.
In sum, SML models were not only successful at replicating the hand-coded results overall and over time, thus, importantly, boosting confidence in the reliability of those results, but they also prompted a deeper analysis and understanding of the subject matter. This pertains especially to the subtle distinctions between articles in the explicit and implicit inequality categories and between articles in the middle general economic category and the categories that bookend it. Keeping these productive tensions in mind, a researcher could proceed to gathering another sample or population of articles from sources aimed at different audiences (e.g., from the New York Times) and code them using these semiautomated methods, assuming coverage features are roughly equivalent across the different kinds of publications. Indeed, an object file containing the relevant information for classifying articles into categories based on our full set of hand-coded articles (as the training set) can be made available to other researchers. This not only eliminates the need for hand-coding within specific content domains (e.g., inequality) but facilitates the comparative analysis of diverse corpora of text.
Dictionary and Unsupervised Learning Methods
Because SML algorithms require a nontrivial number of hand-coded texts, social scientists are exploring more fully automated text analysis methods to circumvent the need for hand-coding text altogether. Yet, it is important to recognize that fully automated methods (Grimmer 2010) and dictionary methods (Loughran and McDonald 2011) cannot be mechanistically applied; their output is typically tested by hand post facto. That is, the methods are implemented on a corpus and then hand coders go back through a sample of the corpus to test the validity of the computer-assisted codes. In this respect, dictionary and fully automated methods rely to a nontrivial degree on the judgment of the analyst to interpret and verify the results, at best using the most rigorous tests of reliability adopted by hand coders. Given that we have a large set of hand-coded results already at our disposal, our analysis is intended to make these judgment points explicit, along with the consequences for drawing substantive conclusions from the application of each method, had it been chosen originally as the only method of analysis of our data.
Dictionary method
Brief description
The dictionary method is the most straightforward and widely used of the automated textual analysis tools available. This is particularly the case when a media content analysis is not the central objective of a scholarly piece of research but instead is employed to quickly chart issue prevalence or salience in the media or to supplement findings from a survey-based analysis with more contextual data. On the subject of inequality, for instance, the Occupy Wall Street movement prompted what appeared to be an increase in media coverage of inequality. The impulse to quantify this shift led researchers to use key word searches of “inequality” in the news to draw conclusions about the extent to which the public was being exposed to new information, as this is considered a key determinant not only of issue salience but of issue-specific political and policy preferences (McCall 2013; Milkman, Luce, and Lewis 2013).
Dictionary methods consist, then, of a search through a corpus of documents for a list of words or phrases predetermined by the researcher, offering a quick and relatively easy way to code large volumes of data. Dictionary methods can be considerably more sophisticated, however, requiring a carefully curated list that describes the category of interest. Standard dictionaries such as the Linguistic Inquiry and Word Count (Tausczik and Pennebaker 2010) have been shown to be reliable, but only in limited domains. Creating specialized dictionaries has the benefit of being domain-specific, but it is still unclear whether dictionaries can be reliably used to code complex text and unsettled concepts, the focus of our analysis.
Analytical strategy
We use the text mining tools available in the statistical package R to search for articles with key words from a combined list of two comprehensive dictionaries on inequality (Enns et al. 2015; Levay 2013). Because these lists are composed of variations on the term inequality and its synonyms (i.e., divide, gap), we compare the results of this method to the results from the hand-coded explicit inequality category only. In a subsequent analysis, we also attempt to translate our own hand-coding instructions in Online Supplemental Appendix A as closely as possible into a list of terms and search instructions to identify explicit and implicit mentions of inequality. Online Supplemental Appendices B and C provide these lists and instructions, respectively. If any term or phrase in the dictionary instructions is present in an article, the article is placed in the inequality category; otherwise, the article is placed in the irrelevant category. 10 This is consistent with our hand-coding procedure, in which a single mention of relevant content is sufficient to place an article in the inequality category, and it is a lenient test of the dictionary method.
Results
The results of our analysis of the hand-coded articles using these two dictionaries are presented in the second panel of Table 1 and in Figure 6. We find that the carefully constructed lists of terms provided by Enns et al. (2015) and Levay (2013)—which are combined in our analysis—are remarkably successful at identifying articles hand coded as containing explicit coverage of inequality. With a precision of .91 (see column 1 of the second panel of Table 1), this method was highly unlikely to misidentify noninequality articles as inequality articles; that is, it resulted in few false positives. Yet, as is often the case, precision came at a cost: With a recall score of just .25 (see column 2 of Table 1), many of the articles hand coded as explicit were overlooked, not to mention articles that were coded as implicitly covering inequality (which we excluded from the inequality category for these tests). This substantial degree of underestimation is visually apparent in Figure 6, which compares the time trends revealed by the hand-coding and dictionary methods. 11 By contrast, the instructions intended to mirror the complexity of our own hand-coding process, including both implicit and explicit mentions of inequality, erred in the opposite direction: With high recall (.84) and low precision (.48), coverage of inequality was overidentified, as also illustrated in Figure 6.
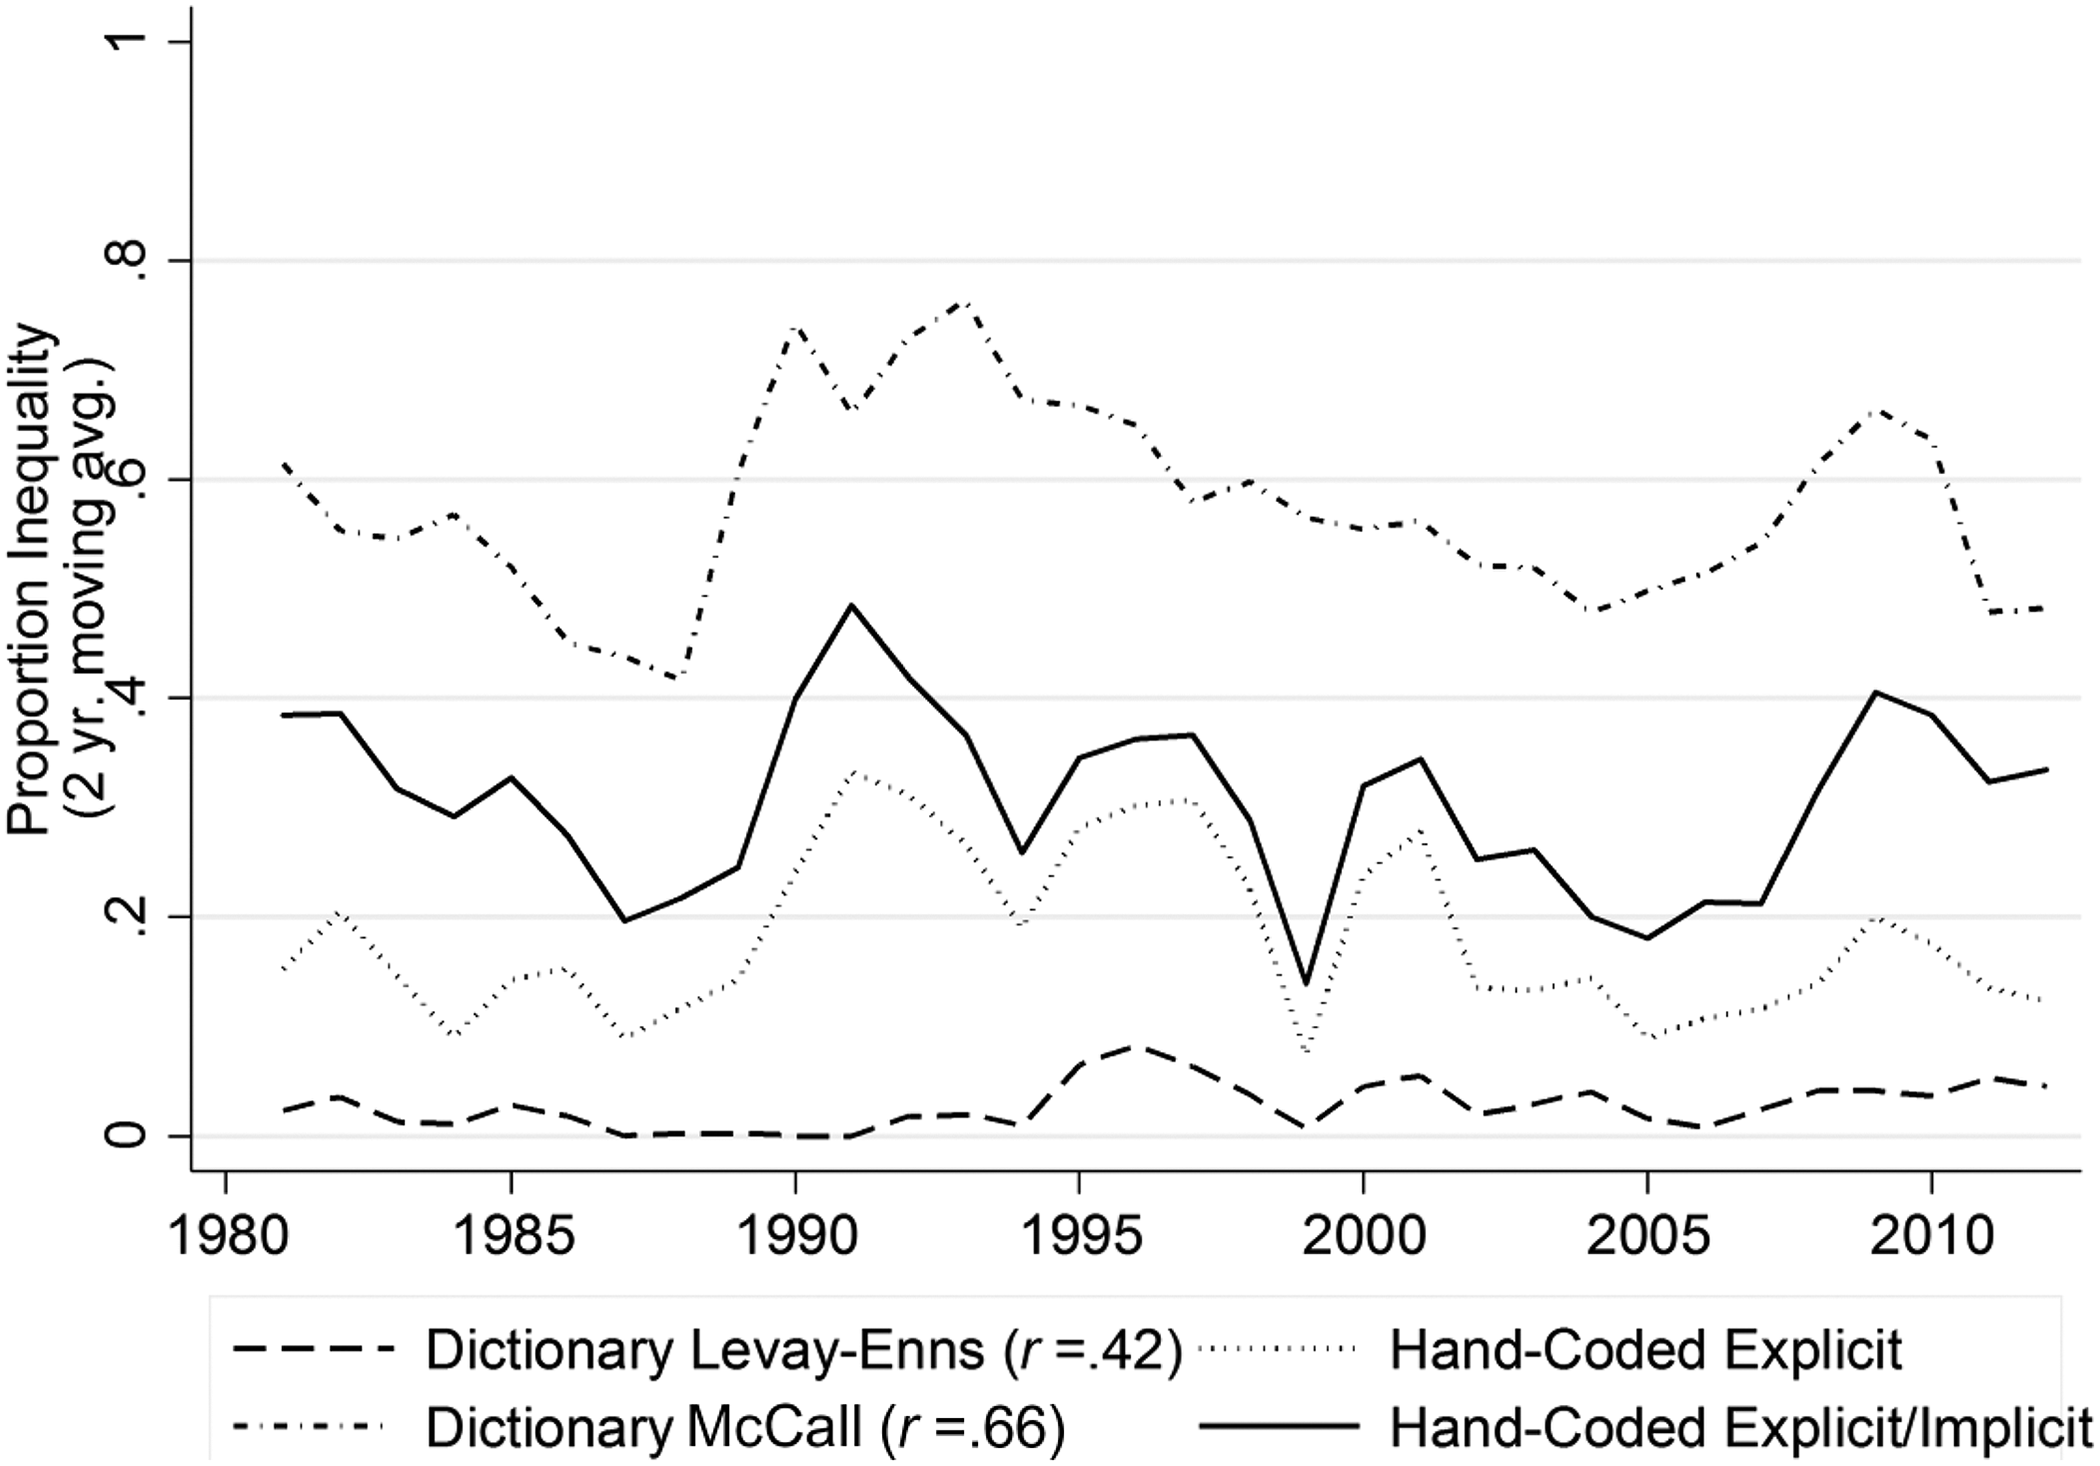
Trends in dictionary analysis of hand-coded articles (compare Levay-Enns to hand-coded explicit inequality trend; compare McCall to hand-coded explicit/implicit inequality trend).
We draw two conclusions from this exercise. First, dictionary lists can accurately identify the most explicit instances of coverage, and, somewhat to our surprise, even approximate a time trend of coverage (the correlation with the trend of articles hand coded as explicit was .42 when we use a two-year moving average, as shown in column 10 of Table 1), but they are likely to miss more nuanced portrayals of a topic and thus significantly underestimate overall occurrence. If absolute frequency of occurrence matters, then this is a serious shortcoming. 12 Second, a more complex set of instructions can effectively net a larger share of relevant articles, and even better approximate the time trend (r = .66), but they will in the process erroneously categorize a large share of irrelevant articles as relevant. Although it may be possible to fine-tune the dictionary instructions to arrive at a happy medium between the two extremes represented by our two versions of the dictionary method, 13 we underscore again that researchers beginning from scratch will not know, as we would, when they have arrived at this happy medium.
UML methods
Brief description
Finally, there is hope that fully automated methods—including UML tools—can inductively identify categories and topics in text, thus replacing human input altogether, at least on the front end (Bearman and Stovel 2000; Carley 1994; Franzosi 2004; Grimmer and Stewart 2011; Lee and Martin 2015; Mohr 1998). Rather than classifying text into predetermined categories, as is the case with the dictionary and SML methods, fully automated text analysis techniques simultaneously generate categories and classify text into those categories. In theory, these techniques will inductively categorize text into the objectively “best” categories. In practice, there are multiple ways to classify text, with no clear metrics to determine which classification is better than others (Blei 2012; Grimmer and Stewart 2011). When a fully automated method offers multiple ways to group texts, researchers may qualitatively consider the topics covered as well as statistical fit. The complexity of these algorithms, the “black box” nature of their implementation and interpretation, and the sometimes cryptic output they generate, has meant that social science researchers, in particular sociologists who are attuned to the complexity of language and concepts, are hesitant to fully embrace their use (e.g., Lee and Martin 2015).
Because the coding scheme in our hand-coded data was done in part inductively as well, as is common in qualitative analysis, and the categories are detailed enough to represent bounded, though complex, topics, we have the opportunity to compare computationally inductive techniques to the hand-coding technique. Our findings thus build on debates about the potential to substitute (allegedly) faster and more replicable UML methods for traditional content analysis (e.g., Bail 2014; DiMaggio et al. 2013; Lee and Martin 2015).
Analytical strategy
We used three fully automated methods in an attempt to identify inequality themes in these data. 14 The first two are from the probabilistic topic modeling family (Blei 2012). Using the co-occurrence of words within documents, probabilistic topic models use repeated sampling methods to simultaneously estimate topics and assign topic weights to each document. In other words, topic models assume that each document is made up of multiple topics with varying levels of prevalence, rather than assigning each document to one topic or category. We estimate two topic models using two different algorithms, latent Dirichlet allocation (LDA), the most basic topic model (Blei 2012), and structural topic models (STM; Roberts et al. 2013), a topic modeling algorithm that provides a way to incorporate document-level covariates into the model. Because the language used to discuss inequality changed over time, we include the document year as a covariate in our STM. As with many fully automated methods, the researcher must choose the number of topics to be estimated by the algorithm, and we ranged the number of topics from 5 to 100 at various intervals for both algorithms, looking at the highest weighted words per topic to determine the content of the topic.
As noted, topic models do not assign articles to topics as hand coders do; rather, each document is a weighted distribution over all topics. In order to compare these results to those obtained using hand-coding methods, we classified an article as being about inequality if the associated topic weight was in the 95th percentile or above of the topic score among articles hand coded as irrelevant. This is intended to avoid classifying articles as about inequality if they simply contained routine mentions of the words (common in everyday language) associated with the inequality topic. In addition, because of the infrequency of our topic using these methods, we measure their performance against the category of articles hand coded as explicit only (and not implicit), much like in the evaluation of the first dictionary method.
While increasingly popular in the social sciences, topic modeling has been criticized outside of the social sciences for its poor predictive performance and its lack of reproducibility (e.g., Lancichinetti et al. 2015). Simpler clustering techniques often perform just as well, and sometimes better, than more complicated hierarchical and topic modeling techniques (Schmidt 2012; Steinbach, Karypis, and Kumar 2000). Our third fully automated technique is thus the relatively simple k-means clustering algorithm, an established and ubiquitous algorithm that uses Euclidean distance measures to cluster articles into mutually exclusive groups (Jain 2010; Lloyd 1982). Like topic modeling, the number of clusters is determined by the researcher, using visual methods, mathematical methods (e.g., Bayesian information criterion [BIC]), or qualitatively by examining the coherence of the clusters (Rousseeuw 1987). We ranged the number of clusters from 2 to 70, looking at the most frequent words per cluster to determine the content of the cluster.
Results
The metrics are provided in the third panel of Table 1, and the time trend for the STM results is shown in Figure 7 (there were too few relevant articles from the k-means analysis to construct a time trend, and the LDA results were similar to the STM results). We begin with the k-means analysis before examining the more complex methods. Using the silhouette method (Rousseeuw 1987) combined with the BIC (Pelleg and Moore 2000), the 18-cluster model produced the most distinctive clusters, but none of these clusters were clearly about inequality. Beginning with the 20-cluster model, there was one cluster that seemed to center on inequality, and there were two such clusters in the 60-cluster model. The word “inequality” never appeared as a frequent word, however, in any of these clustering solutions (despite the fact that the SML methods were capable of distinguishing inequality content from other content in the corpus of articles). The silhouette method isolated the 30-cluster model as having the most distinctive clusters in the second set of models (20–70 clusters, in which the BIC steadily declines after 20 clusters), and it included a cluster that appeared consistent with our theme (see the first column of Table 2 for the most frequent words in this inequality cluster). Yet with only 42 articles in this cluster, these methods appeared to quite dramatically undercount the number of articles about inequality in our data.
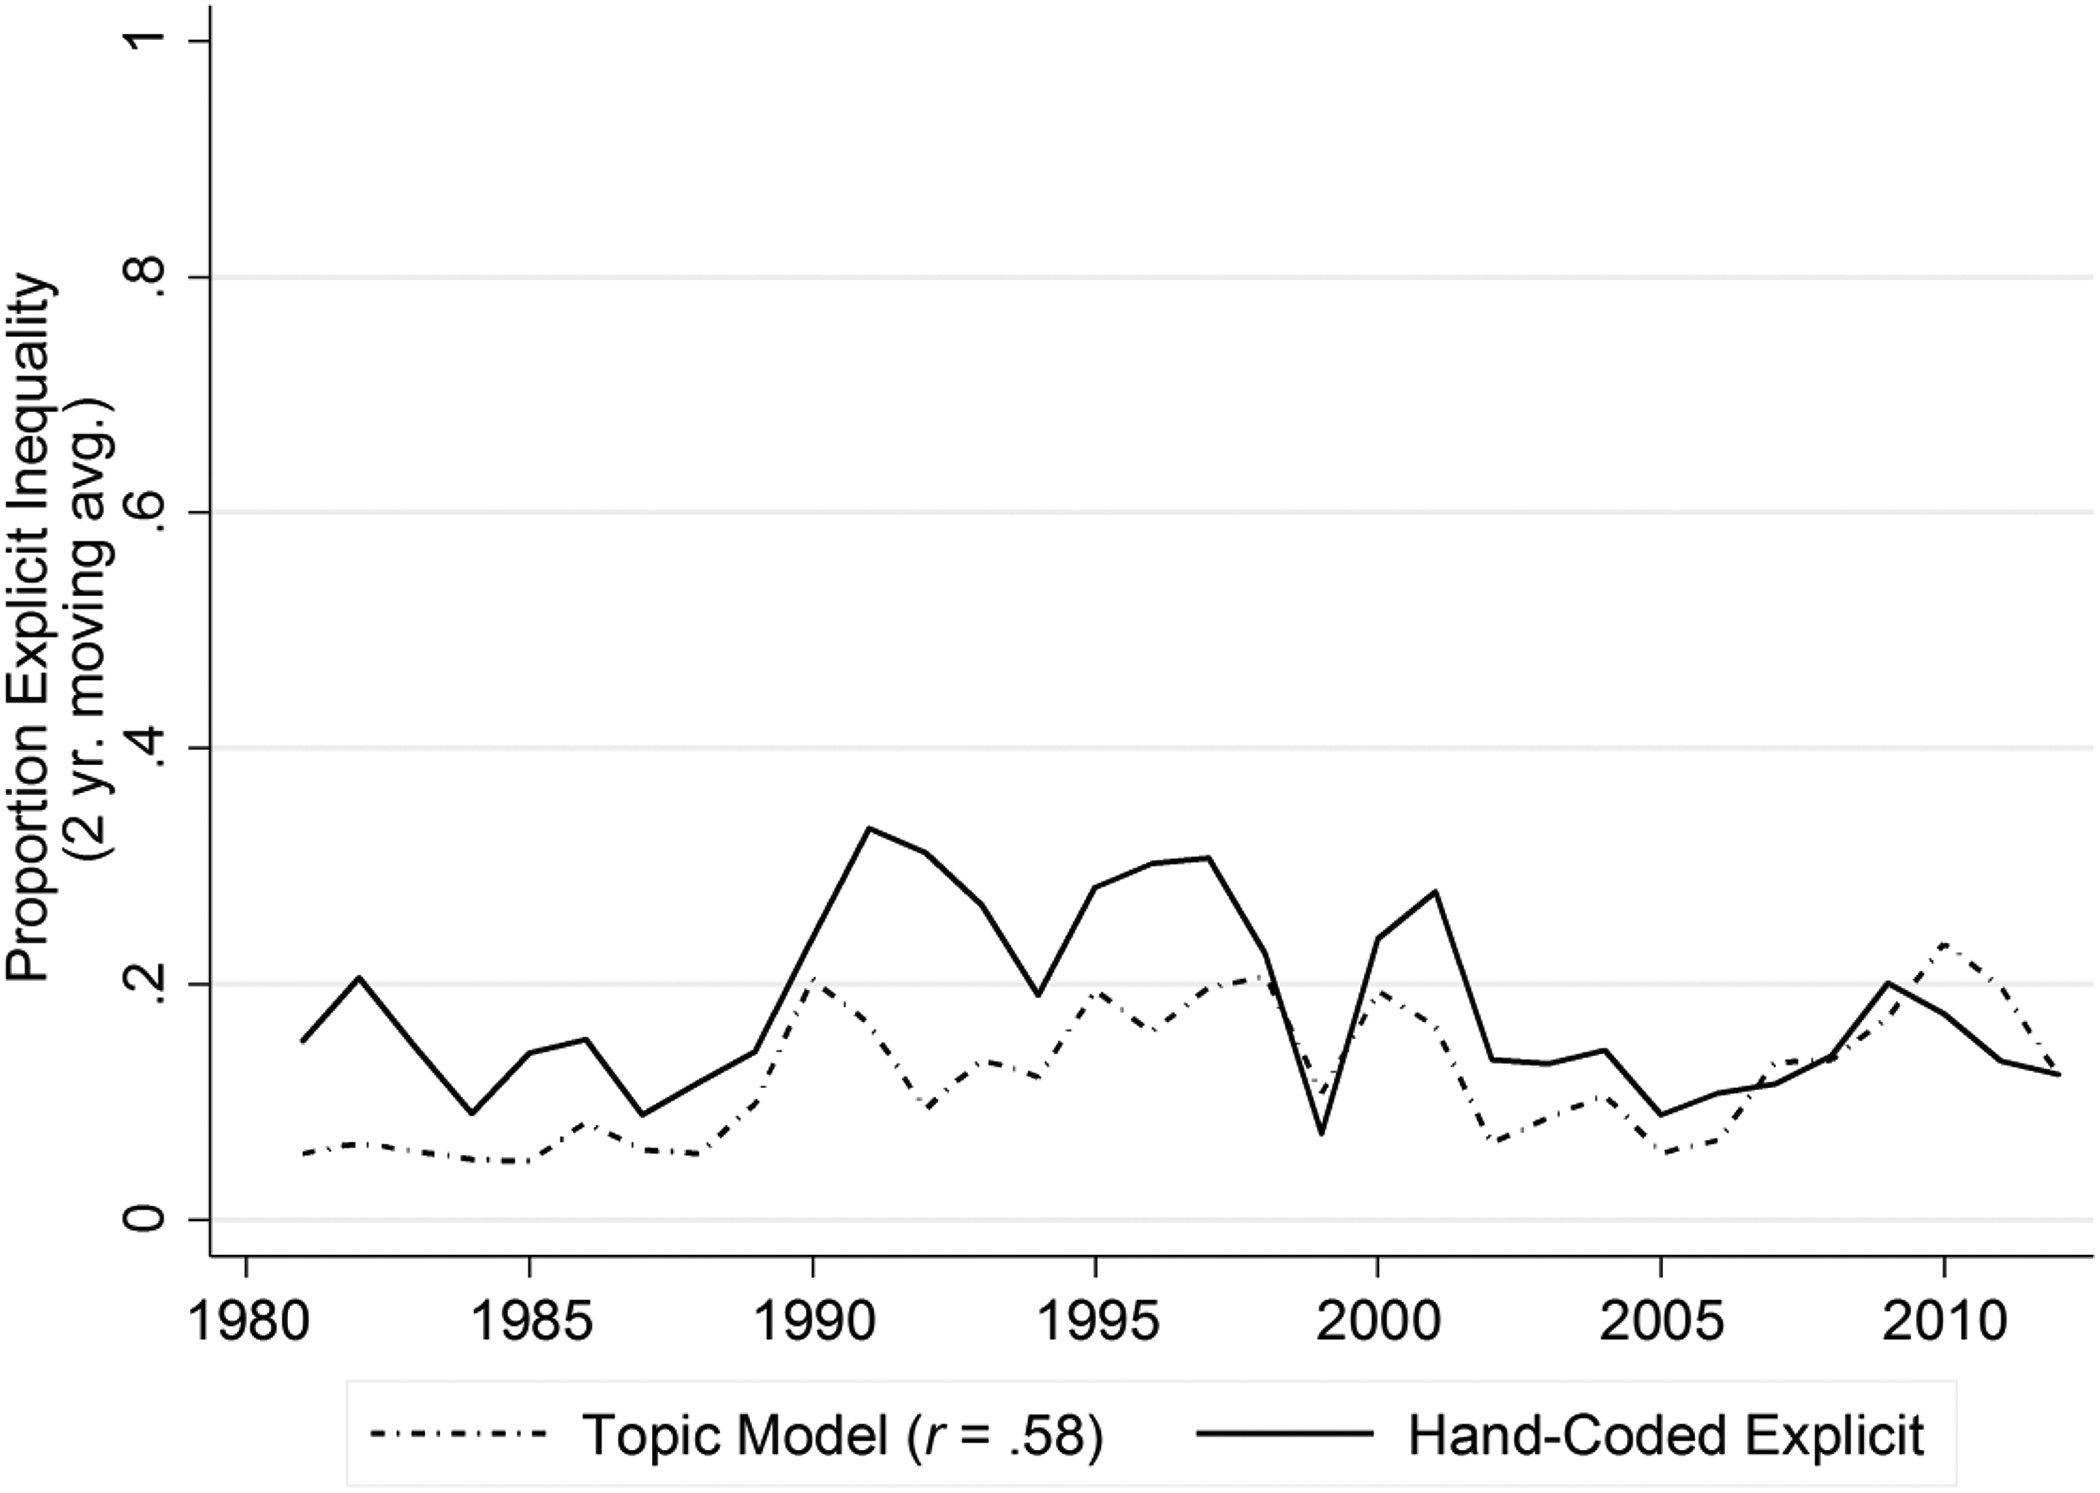
Trends in unsupervised machine learning analysis of hand-coded articles (explicit inequality category shown).
Top Words for Inequality Topics in k-means and Structural Topic Model Models.a
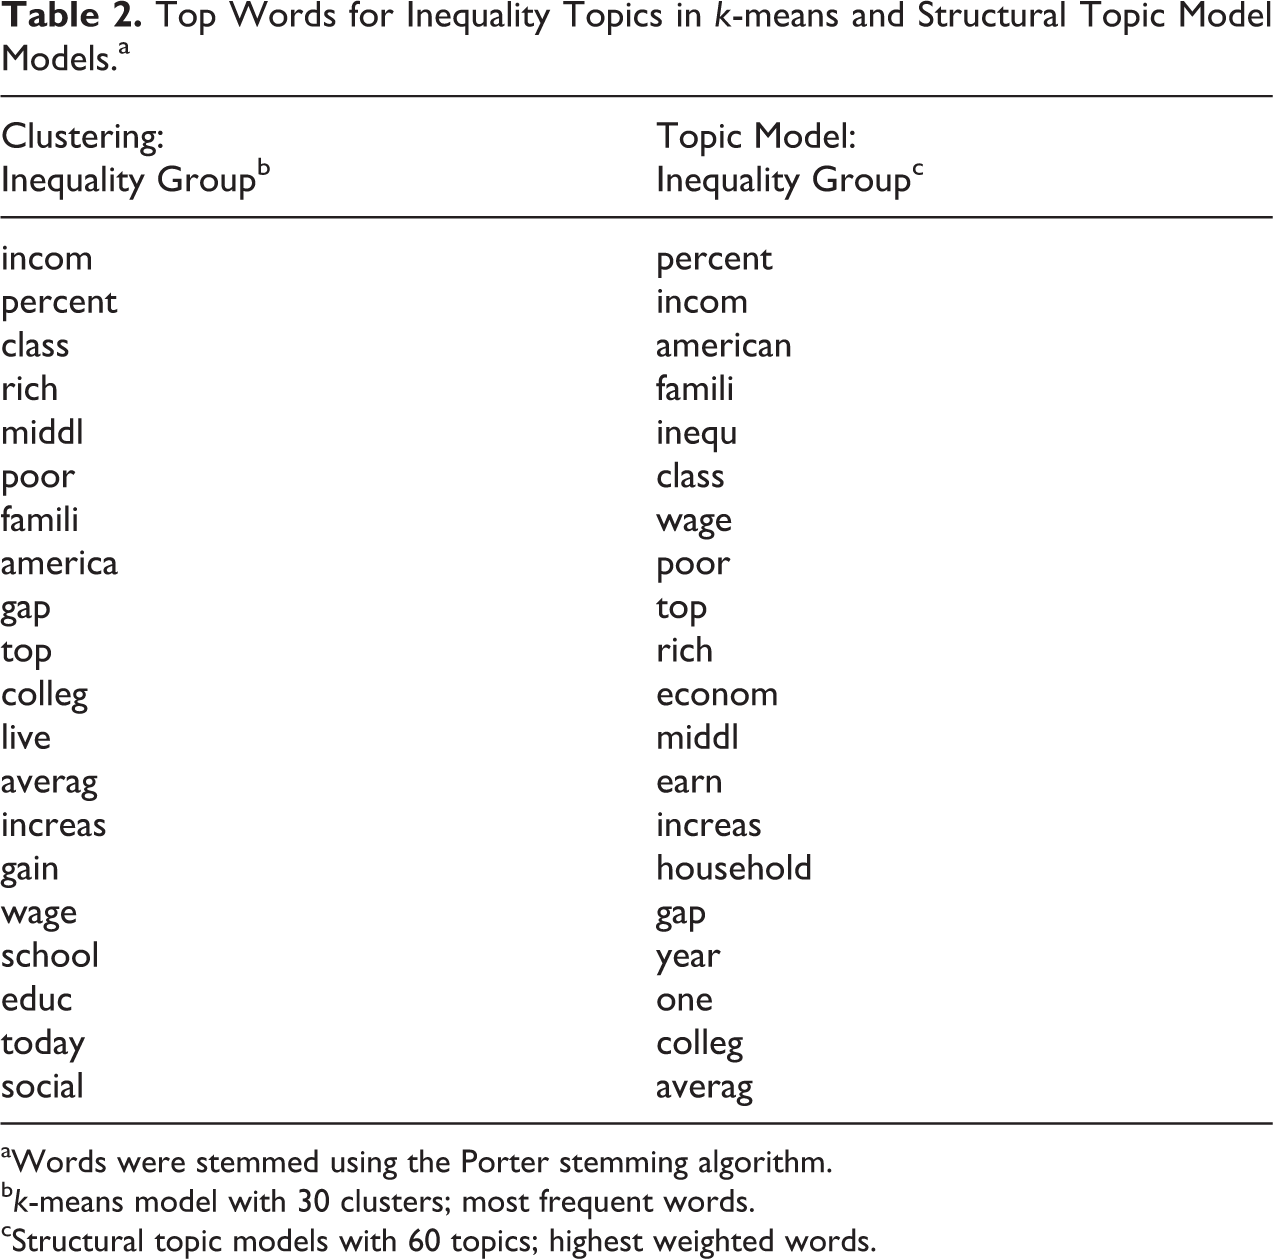
aWords were stemmed using the Porter stemming algorithm.
b k-means model with 30 clusters; most frequent words.
cStructural topic models with 60 topics; highest weighted words.
The results from this k-means analysis suggest two important conclusions. First, there is no guarantee that the clusters produced by the k-means algorithm will line up with the topics of interest to the researcher. Furthermore, the mathematically “best” clustering solution may not necessarily be the best solution from a substantive perspective, as was the case with our data (i.e., the mathematical methods were no better than visual inspection at identifying models containing clusters with an inequality theme). Second, these results confirm the intuition that, in our data, discussions of inequality are woven throughout articles whose main focus is a separate topic; that is, inequality as a dominant topic is relatively infrequent. K-means is thus better suited to the analysis of thematically focused articles, such as tweets or press releases, and does not perform well in picking up themes that may be buried within discussions of different topics.
The other fully automated method we use, topic modeling, is designed to address this shortcoming by picking up more minor themes running across many articles. After failing to find a computer-generated topic on the subject of inequality when the number of topics for the STM was set to 5, 10, and 20, one did emerge in the output of a 30-topic model. The 20-topic and the 60-topic models, however, produced the most coherent topics as measured by the distribution of the top weighted topic over all documents, a mathematical solution that indicates distinctive topics. Because the 60-topic model also produced an inequality topic, we analyze the results from this model (see the second column of Table 2 for a list of the top weighted words associated with this topic from the 60-topic model). 15
Generally speaking, the results mirror those for the first dictionary method, in which precision is high but recall is low. While the recall is extremely low using the k-means method (.14), there is somewhat more balance in the results from the STM method, in which a larger share of explicit articles is identified as compared to the first dictionary method (compare the recall score of .45 for STM with the recall score of .25 for the first dictionary method, as shown in column 2 of Table 1); consequently, the F1 score is also higher (.53 versus .40, as shown in column 3). The correlation of the two-year moving averages also improves (compare .58 for STM versus .42 for the first dictionary method). Given that our approach to hand-coding was not “topical,” in the sense that we were searching for any coverage of inequality in articles on any subject matter (broadly on economic matters), it is perhaps impressive how well the topic modeling algorithms actually correspond to the hand-coded articles. On the other hand, like the first dictionary method, the fully automated methods are undercounting the number of “true” inequality articles. If we had used only these methods for the original analysis, as we suspect many content analysts are now doing, we would have missed almost all of the implicit discussions of inequality and many of the explicit ones as well (as demonstrated by the low recall of .45).
Given that some of the clustering or topic modeling solutions did not pick up an inequality topic, and given the low recall for STM, we suggest that this method is best used as an inductive, exploratory method and should not be used to identify known categories in text. This could be done in two ways. It could be used as the first, exploratory step in an inductive research project, with the goal of uncovering themes or patterns in your data (e.g., Nelson 2017). Or, it may be best to deploy this method after categories have been defined and articles classified in order to explore emergent themes within the primary category of interest. For instance, once articles mentioning inequality have been selected with some degree of confidence (e.g., using either conventional hand-coding metrics of reliability, the dictionary method, supervised learning methods, or some combination of these), one could use UML methods to identify the range of frames and topics with which inequality often co-occurs—such as the discussion of taxes, immigration, education, and so on. As topic modeling assumes each document is structured from multiple topics, this could be an appropriate method for doing so.
In short, using UML methods as an exploratory first step, or, alternatively, after articles have been thematically classified, may suggest new patterns to the researcher that they had previously not considered and may take the research project in new and potentially fruitful directions. By contrast, utilizing these methods to classify material into predetermined categories may lead researchers astray, and “null” findings may be deceiving, depending on how prevalent the themes of interest are and how they are distributed.
Discussion and Conclusion
Our main conclusion is that these new computer-assisted methods can effectively complement traditional human approaches to coding complex and multifaceted concepts in the specialized domain of sociology (and related disciplines), but the evidence is mixed as to whether they can fully replace traditional approaches. SML methods successfully approximated and thus may partially substitute for hand-coding, whereas the other methods are best implemented in conjunction with hand-coding (or SML), or, in the case of topic modeling and clusters, as an initial exploratory step (Nelson 2017). That is, we find that none of the methods replace the human researcher in the content analysis workflow. Regardless of technique, the researcher is making decisions every step of the way based on their deep substantive knowledge of the domain.
In this section, then, we highlight the strengths and weaknesses of the various approaches in evaluating our hand-coded data, focusing on the substantive conclusions that would have been drawn from the results produced by each method. The larger objective of this discussion is to shed light on the pros and cons of each method for a broader array of substantively-based, text analysis projects. Taken together, our results confirm the effectiveness of each of these methods for specific roles in the workflow of a content analysis project.
To begin with the most widely used of the automated methods, the dictionary method successfully identified a subset of the most explicit discussions of inequality in our data, as evidenced by the dictionary-identified articles The Inequality Dodge; Rich America, Poor America; To the Rich, From America; and The Quagmire of Inequality. However, this method missed more nuanced but nonetheless obvious (to a knowledgeable coder) discussions of inequality. Specifically, this method failed to detect a noteworthy share of articles in the early 1990s that were hand coded as about inequality (see Figure 6). Media coverage at this time dealt primarily with the problem of rising wage and earnings inequality in the labor market, as opposed to Wall Street or the top 1 percent, in articles such as Bridging the Costly Skills Gap and Bob Reich’s Job Market. These articles discussed the simultaneous rise in productivity and stagnation of male wages, the gap in wages between college and noncollege-educated workers, and excessive executive pay. Concerns of fairness in the labor market were paramount as transformations in the economy appeared to threaten the financial security of many workers.
The SML algorithms, alternatively, confirmed the rise in coverage of inequality in the early 1990s that was identified by the hand coders (see Figure 4). The features (words) that most distinguish the inequality from not inequality categories include “class,” “middle,” “pay,” and “wage”—words indicative of the inequality discussion in the 1990s. However, they also include words one would not immediately associate with inequality, such as “benefit” or “families,” suggesting that the SML approach represents more than just a glorified dictionary method. One article in particular highlights the difference between the dictionary and SML methods. An article published in 1994 titled Reining in the Rich was correctly identified by the SML programs as mentioning inequality, but it was not so identified by the dictionary method. The story never uses words like income gap or income inequality. Instead, the discussion is about how social security subsidizes the lifestyles of the affluent: The costliest welfare load isn’t for the poor, it’s for the well-to-do…[A rich retiree] knows he is being subsidized by the 12.4% payroll tax being paid by employers and their younger and lower-paid workers, like his granddaughter Amanda Fargo, 21, who earns $5 an hour as a receptionist in a beauty salon. Savage approves of taxpayer subsidies for the elderly poor, but adds, “It’s unconscionable…to take money away from these kids and give it to well-off people.”
Our research thus suggests that dictionary methods will struggle with the identification of broader concepts but can play a role when specific phrases are of interest (e.g., the “1 percent”) or accuracy and prevalence are not at a premium. For example, tracking the use of the term “inequality” could be useful in revealing shifts in the way that the underlying concept of inequality is being represented, especially if it could be shown that the deployment of the inequality term itself has substantively meaningful consequences (e.g., for understanding how public discourse reflects or shapes public perceptions and views about inequality). By contrast, we show that dictionaries are not an appropriate method if the purpose is to identify complex concepts or themes with myriad meanings and definitions, particularly over long periods of time when the terms chosen to represent them are likely to vary.
SML algorithms, on the other hand, are well equipped to recognize these more complex concepts, even as the specific content related to the concepts changes over time; we were therefore able to almost completely replicate our hand-coding scheme using SML algorithms. The success of this method in discerning significant shifts in discussions of inequality gives us confidence that it can be used on most concepts or themes of interest to sociologists, provided they are reasonably bounded (recall the difficulties SML methods encountered distinguishing implicit inequality from general economic articles). This method does, however, require much more investment at the front end of the project to correctly hand code a nontrivial number of articles. With this caveat in mind, SML approaches can replace hand-coding approaches if the objective is to code large quantities of text and capture nuanced discussions of complex concepts.
Finally, structural topic modeling is also well equipped to identify salient clusters of words, and like the SML algorithms, it correctly identified the above article on inequalities in the social security tax and transfer system. Likewise, it correctly picked up the rise in discussion of inequality in the early 1990s. But, as the presentation of results using this method illustrated, UML approaches will not necessarily identify in every model the specific concepts or themes of interest to a researcher. And, if it does, the qualitative decision points involved, such as choosing the number of topics and types of words to include, should give deductive researchers pause. Additionally, to tag an article as having mentioned inequality, we used a cutoff determined by the distribution of topic probabilities across articles formerly hand coded as irrelevant. If we were doing a content analysis project from scratch (i.e., without any prior hand-coding), we would not be able to perform this sort of benchmarking, creating another choice-point for the researcher. More likely, researchers using this method would examine the proportion of words structured from a topic—charting, for example, this proportion over time—rather than tagging entire documents into categories (and charting the proportion of articles falling into these categories over time, as we did).
If the goal is not to categorize documents into known categories but to inductively explore textual data and the themes that emerge from them, or to explore how topics co-occur in texts, topic models are a good solution. In particular, once relevant content has already been identified using other, more reliable methods, such as SML, fully automated methods can then be used to examine the content in greater detail and in a more exploratory and inductive fashion (e.g., in our case, we would investigate exactly how inequality is covered or framed in the relevant articles or which topics inequality is most commonly associated with). Our results demonstrate the ability of topic models to recognize patterns of theoretical interest in textual data, indicating that they can be used to complement other forms of analysis. If used in an exploratory way, topic models can suggest new and potentially fruitful patterns that may productively reroute research agendas or may help researchers form testable hypotheses about their thematically focused data.
In closing, we wish to underscore that even though our conclusion regarding the significant complementarities among the methods we discussed is based on the current state-of-the art, we believe it will continue to apply in the foreseeable future as new computer-assisted text analysis methods and techniques are being developed. For example, on the one hand, new work in word embeddings, which incorporate the context in which a word is used more effectively than in previous methods, can further improve the performance of NLP algorithms (Goth 2016; Mikolov et al. 2013). Sociologists would therefore benefit from an ongoing engagement with this literature to elevate their own application of computer-assisted techniques. Yet, on the other hand, we as a discipline should think carefully about exactly how these new methods correspond to the types of research questions and data at the core of our scholarly enterprise, including those that privilege humanistic interpretation. Comparing and contrasting automated methods to nuanced hand-coding methods provides an empirical foundation that has been lacking in debates over the relationship between our methodological traditions and the new computer-assisted techniques and that we hope advances these debates to better understand the future of textual analysis in social science research.
Supplemental Material
Supplemental Material, Nelson_etal_OnlineAppendix - The Future of Coding: A Comparison of Hand-Coding and Three Types of Computer-Assisted Text Analysis Methods
Supplemental Material, Nelson_etal_OnlineAppendix for The Future of Coding: A Comparison of Hand-Coding and Three Types of Computer-Assisted Text Analysis Methods by Laura K. Nelson, Derek Burk, Marcel Knudsen and Leslie McCall in Sociological Methods & Research
Footnotes
Acknowledgments
We are grateful for funding from the Russell Sage Foundation and for extremely helpful comments from the reviewers and from John Levi Martin, James Evans, and Peter Enns on an earlier draft. We also thank Bart Bonikowski for introducing the hand coder among us to automated methods.
Declaration of Conflicting Interests
The author(s) declared no potential conflicts of interest with respect to the research, authorship, and/or publication of this article.
Funding
The author(s) disclosed receipt of the following financial support for the research, authorship, and/or publication of this article: This article has been funded by the Russell Sage Foundation.
Supplemental Material
Supplemental material for this article is available online.
Notes
References
Supplementary Material
Please find the following supplemental material available below.
For Open Access articles published under a Creative Commons License, all supplemental material carries the same license as the article it is associated with.
For non-Open Access articles published, all supplemental material carries a non-exclusive license, and permission requests for re-use of supplemental material or any part of supplemental material shall be sent directly to the copyright owner as specified in the copyright notice associated with the article.